hdfc asset management company limited - … amc - 2013… · 289 hdfc asset management company...
TRANSCRIPT

289
HDFC Asset Management Company Limited
TO THE MEMBERS
Your directors have the pleasure in presenting the Fourteenth Annual Report
together with the Audited Accounts of the Company for the year ended
March 31, 2013.
Financial Results
Directors’ Report
For the year ended For the year ended
March 31, 2013 March 31, 2012
( in Crores) ( in Crores)
Profit before Tax 446.82 381.49
Provision for Tax(Net Deferred Tax) 128.06 112.33
Short provision of Income Tax
for earlier years (net) 0.01 0.02
Profit after Tax 318.75 269.14
Balance brought forward from
previous year 487.15 404.16
Profit available forappropriation 805.90 673.30
General Reserve 31.88 26.92
Capital Redemption Reserve 0.48 0.50
Transfer to Corporate SocialResponsibility Account — 5.00
Buy-back of Equity Shares 54.42 57.19
Interim Equity Dividend Paid 111.06 83.06
Tax on Interim Equity Dividend Paid 18.03 13.48
Proposed Equity Dividend — —
Tax on Proposed Equity Dividend — —
Balance carried to Balance Sheet 590.03 487.15
For the year ended March 31, 2013,
the Company posted a net profit
of 318.75 crores as against
269.14 crores in the previous year.
Appropriations from the net profit
have been effected as per the table
given above.
Dividend
Your directors paid interim dividend
of 44/- per equity share in the
month of March 2013 and the same
is confirmed as Final Dividend
for the f inancial year ended
March 31, 2013.
Allotment of equity shares:
During the Financial year ended
March 31, 2013, the Company
allotted 555300 equity shares having
a face value of 10/- each pursuant
to the Employee Stock Options
Schemes of the Company.
Buy Back of equity shares:
During the financial year, the
shareholders of the Company at their
meeting held on February 6, 2013
approved the buy back of equity
shares of the Company from the
shareholders of the Company through
Board of Directors
Mr. Deepak S. ParekhChairman
DirectorsMr. Norman Keith SkeochMr. James AirdMr. Hoshang BillimoriaMr. P. M. ThampiDr. Deepak B. PhatakMr. Humayun DhanrajgirMs. Renu Sud KarnadMr. Rajeshwar R. BajaajMr. Keki M. MistryMr. Vijay Merchant
Mr. Milind BarveManaging Director
AuditorsHaribhakti & Co.Chartered Accountants
BankersHDFC Bank Ltd.
Registered OfficeRamon House,H. T. Parekh Marg,169, Backbay Reclamation,Churchgate,Mumbai 400 020.Tel. No. : 022-6631 6333Fax No. : 022-2204 4304
Fourteenth Annual Report 2012-13
290
Tender offer. The buy-back offer was
completed within the time limits as
prescribed under the Companies Act,
1956 and 484650 equity shares of
the Company were bought by the
Company under the buy-back offer.
The present paid up capital post the
buy-back offer is 25,24,08,000/-
Review of Operations
Your Directors are pleased to report
that: –
The Average Assets under
Management (AAuM) during the
financial year 2012-13 were
98,375 crore as against AAuM of
90,590 crore in financial year
2011-2012, which is an increase of
8.59% over previous financial year
and is inline with that of the industry
which grew by 8.55% over the
corresponding period. HDFC Mutual
Fund (HDFCMF) retained its position
during the current year as the largest
fund house.
During the year, the total number of
accounts managed by HDFCMF is
around 49.43 lac as on March 31,
2013. The number of Investor Service
Centres (ISCs) of the AMC as on
March 31, 2013 was at 137 ISCs of
Computer Age Management Services
Pvt. Ltd. (CAMS), the Registrar and
Transfer Agent of HDFCMF are Official
Points of Acceptance for transactions
of HDFCMF Schemes. These offices
(196 as on March 31, 2013)
supplement the investor-servicing
network of your company. With these
offices, your company services
investors in almost 200 cities
pan India.
During the financial year, the
aggregate assets under investment
management /advisory services
under Portfolio Management Services
were at 2,162.17 crore as on
March 31, 2013. Discretionary
Portfolio Management is provided to
High Networth Individuals and
Corporate(s) on a segregated basis
while advisory services are provided
to Institutional Investors and
Corporate(s).
Your company under Portfolio
Management Services had offered
“HDFC AMC PMS - Real Estate
Portfolio - 1” to resident individuals
and corporate(s) during 2007-2008.
The company had received
commitments of 3,831 Crores from
10,168 clients. Your company has
successfully exited investments to the
tune of 1,482.43 Crores till
31st March 2013.
New Initiative
In line with the SEBI circular, your
company has undertaken new
initiatives to penetrate beyond top 15
cities and promote HDFC Mutual Fund
across the country. During the period
October 1, 2012 to March 31, 2013,
the AMC has opened 20 ISCs/
Business Centre in beyond top
15 cities.
New Scheme Launched under HDFC
Mutual Fund
Government of India in the Union
Budget 2012-13 announced a tax
saving scheme named Rajiv Gandhi
Equity Savings Scheme, 2012
(RGESS). As per Section 80CCG of the
Income-tax Act, 1961, investments
made by new retail investor in this
Scheme will qualify for a 50%
deduction of the actual amount
invested from the taxable income of
the financial year.
HDFC Mutual Fund launched its
maiden HDFC Rajiv Gandhi Equity
Savings Scheme – Series 1 – February
2013 on 18th February 2013. It is a
Close Ended Equity Scheme investing
in Eligible Securities as per Rajiv
Gandhi Equity Savings Scheme,
2012. The scheme matures after
three years from the date of
allotment of units and the units are
compulsorily redeemed on the
maturity date. The investment
objective of the Scheme is to
generate long term capital
appreciation from a portfolio of
Eligible Securities as specified in
Rajiv Gandhi Equity Savings Scheme.
HDFC Mutual Fund received an
encouraging response to the NFO
collecting over 12000 applications
and mobilized over 105 crore in
the NFO.
Awards
Your Directors are pleased to inform
that HDFC Mutual Fund / HDFC AMC
received the following awards as
Fund House during the year under
review: –
1) OUTLOOK MONEY AWARDS
2012 #
HDFC AMC won the “Best Fund
House of the Year” award.
HDFC AMC won the “Best Equity
Fund House of the Year” award.
Chirag Setalvad was adjudged
Runner - up in the “Best Equity Fund
Manager category”.
2) LIPPER FUND AWARDS 2012 #
HDFC AMC won the “Best Mixed
Assets” award by Lipper for 2012.
HDFC AMC won the “Best
Overall” award by Lipper for 2012.
3) MORNINGSTAR FUND AWARDS
2013 #
HDFC AMC won the “Best Equity
Fund House” by Morningstar India for
the fourth year in a row since 2010.
HDFC AMC won the “Best Multi-
Asset Fund House” by Morningstar
India for the third straight year.
291
HDFC Asset Management Company Limited
During the year under review, the
following schemes of HDFC Mutual
Fund also received awards:
1) BUSINESS STANDARD ANNUAL
AWARDS 2012 #
Mr. Prashant Jain won the “Fund
Manager of the Year – Equity” Award
for the year 2012.
2) LIPPER FUND AWARDS 2012 #
HDFC Prudence Fund-Growth
was awarded “Best Fund over Three
Years” in Mixed Asset INR Aggressive
Asset Class at the Lipper Fund
Awards 2012.
HDFC Prudence Fund-Growth
was awarded “Best Fund over Ten
Years” in Mixed Asset INR Aggressive
Asset Class at the Lipper Fund
Awards 2012.
HDFC Children’s Gift Fund –
Investment Plan was awarded “Best
Fund over Three Years” in Mixed Asset
INR Balanced Asset Class at the
Lipper Fund Awards 2012.
HDFC Balanced Fund – Growth
was awarded “Best Fund over Five
Years” in Mixed Asset INR Balanced
Asset Class at the Lipper Fund
Awards 2012.
HDFC Children’s Gift Fund –
Savings Plan was awarded “Best Fund
over Three Years” in Mixed Asset INR
Conservative Asset Class at the Lipper
Fund Awards 2012.
HDFC Children’s Gift Fund –
Savings Plan was awarded “Best Fund
over Five Years” in Mixed Asset INR
Conservative Asset Class at the Lipper
Fund Awards 2012.
3) MORNINGSTAR FUND AWARDS
2013 #
HDFC Balanced Fund won the
“Best Moderate Allocation Fund” by
Morningstar India for the second time
after 2011.
During the year under review, HDFC
AMC PMS - Real Estate Portfolio - I of
HDFC Asset Management Company
Limited also received awards:
1) CNBC AWAAZ REAL ESTATE
AWARDS 2012 #
HDFC AMC PMS – REAL ESTATE
PORTFOLIO - I won the “Best Real
Estate Fund Award” for the year by
CNBC Awaaz.
# Please refer to the websites of the
respective organizations for further
information on the Ranking
Methodology/Disclaimers, etc for the
abovementioned Awards.
Review of the subsidiary company
The AMC had incorporated a wholly
owned subsidiary Company viz. HDFC
Asset Management Company
(Singapore) Pte. Ltd. in Singapore on
April 10, 2008 for providing fund
management and advisory services to
financial institutions like pension
funds, insurance companies, sovereign
wealth funds, venture capital funds, etc.
The paid up capital of Company was
Singapore $1,25,000.
The company has not procured any
license from Monetary Authority of
Singapore (MAS) and is not
operational since incorporation. It was
therefore proposed to wind up the
subsidiary by way of striking off the
name of the subsidiary from the
Accounting & Corporate Regulatory
Authority (ACRA) of Singapore. The
application for the same was made
to ACRA in February 2013.
Directors
In accordance with the Companies Act,
1956 and the Articles of Association
of the Company, Mr. Hoshang
Billimoria, Mr. Humayun Dhanrajgir,
Mr. P. M. Thampi and Mr. James Aird,
Directors, retire by rotation at the
ensuing Annual General Meeting. They
are eligible for re-appointment.
Necessary proposals for the
re-appointment of the aforesaid
Directors have been included in the
notice convening the Annual General
Meeting.
None of the Directors of the Company
are disqualified for being appointed
as Directors as specified in Section 274
of the Companies Act, 1956.
Board Meetings
The meetings of the Board of
Directors are held at the Company’s
registered office in Mumbai.
Six Board meetings were held
during the financial year under
review – on April 25, 2012, June 8,
2012, August 13, 2012, October 22,
2012, December 5, 2012 and
February 6, 2013.
The attendance of each Director at
the meetings of the Board of Directors
is as under:
Directors Number
of Board
Meetings
Attended
(i) Mr. Deepak S. Parekh(Chairman) 5
(ii) Mr. Norman Keith Skeoch 2
(iii) Mr. James Aird 5
(iv) Mr. Humayun Dhanrajgir 5
(v) Mr. Hoshang Billimoria 5
(vi) Mr. P. M. Thampi 6
(vii) Dr. Deepak B. Phatak 3
(viii) Ms. Renu Sud Karnad 6
(ix) Mr. Rajeshwar R. Bajaaj 6
(x) Mr. Keki M. Mistry 6
(xi) Mr. Vijay Merchant 6
(xii) Mr. Milind Barve(Managing Director) 6
Board Committees
To enable better and more focused
attention on the affairs of the
Fourteenth Annual Report 2012-13
292
Company, the Board has constituted
Committees of the Board such as
Audit Committee, Remuneration
Committee, Risk Management
Committee and Customer Services
Committee to which specific matters
have been delegated from time to
time. These Committees prepare the
groundwork for decision-making and
report at the subsequent Board
meeting.
Audit Committee
The members of the Audit Committee
are Mr. Hoshang Billimoria
(Chairman), Mr. P. M. Thampi, Mr. Keki
M. Mistry, Mr. Humayun Dhanrajgir
and Mr. James Aird. The Audit
Committee has been constituted and
functions in accordance with the
provisions of Section 292A of the
Companies Act, 1956. The Company
Secretary acts as the secretary to the
Committee. The Committee met 5
times during the financial year under
review. The Audit Committee met prior
to the finalization of the accounts for
the year ended March 31, 2013.
Public Deposits
During the year under review, the
Company has not accepted any
deposits from the public.
Particulars Regarding Conservation
of Energy, Technology Absorption and
Foreign Exchange Earnings and
Expenditure
(a) Since the Company does not
carry out any manufacturing activities,
particulars required to be disclosed
with respect to the conservation of
energy and technology absorption in
terms of Section 217(1)(e) of the
Companies Act, 1956 read with the
Companies (Disclosure of Particulars
in the Report of the Board of
Directors) Rules, 1988 are not
applicable.
(b) Foreign Exchange, earnings and
expenditure during the year –
!"#$%&'(!%)*+,('%! -%,$(&('./0
0.73 crores (previous year: 1.12
crores)
!"#$%&'(!%)*+,('%!-%)1%(2&34$%/0
46.32 crores (previous year: 35.12
crores) (including Equity Dividend)
Particulars of Employees
Particulars of employees as required
under Section 217(2A) of the
Companies Act, 1956 read with the
Companies (Particulars of Employees)
Rules, 1975 are set out in the
annexure to the Directors’ Report.
In terms of the provisions of
Section 219(1)(b)(iv) of the Companies
Act, 1956, the Directors’ Report is
being sent to the shareholders of the
Company excluding the annexure. Any
shareholder interested in obtaining a
copy of the said annexure may write
to the Company Secretary at the
registered office of the Company.
Auditors
M/s. Haribhakti & Co., Chartered
Accountants, Statutory Auditors of
your Company holds office until the
conclusion of the ensuing Annual
General Meeting and is eligible for
re-appointment. The Company has
received a certificate from them to the
effect that their re-appointment, if
made, would be within the limits
prescribed under Section 224(1B) of
the Companies Act, 1956.
Directors’ Responsibility Statement
In accordance with the provisions of
Section 217(2AA) of the Companies
Act, 1956 and based on the
information provided by the
management, your Directors state that:
(i) In the preparation of accounts,
the applicable accounting standards
have been followed.
(ii) Accounting policies selected were
applied consistently. Reasonable and
prudent judgments and estimates
were made so as to give a true and
fair view of the state of affairs of the
Company at the end of March 31,
2013 and of the profit of the Company
for year ended on that date.
(iii) Proper and sufficient care has
been taken for maintenance of
adequate accounting records in
accordance with the provisions of the
Companies Act, 1956, for
safeguarding the assets of the
Company and for preventing and
detecting frauds and other
irregularities.
(iv) The annual accounts of the
Company have been prepared on a
going concern basis.
Acknowledgements
The Directors acknowledge the
valuable assistance, support and
guidance given by the Securities and
Exchange Board of India, Association
of Mutual Funds of India, Reserve Bank
of India, bankers, distributors, key
partners, Investor Service Centres and
other service providers. The Directors
would like to convey their gratitude to
Housing Development Finance
Corporation Limited and Standard Life
Investments Limited and look forward
to their continued support.
The Directors wish to place on record
their appreciation to employees at all
levels for their dedication and
commitment.
The Directors also acknowledge the
faith reposed in HDFC Mutual Fund
by its investors and look forward to
their continued support.
On behalf of the Board of Directors
MUMBAI Deepak S. ParekhApril 29, 2013 Chairman

293
HDFC Asset Management Company Limited
Independent Auditors’ Report
TO THE MEMBERS OF HDFC ASSET MANAGEMENT COMPANY LIMITED
Report on the Financial Statements
We have audited the accompanyingfinancial statements of HDFC ASSETMANAGEMENT COMPANY LIMITED(“the Company”), which comprise theBalance Sheet as at March 31, 2013and the Statement of Profit and Lossand Cash Flow Statement for the yearthen ended and a summary ofsignificant accounting policies andother explanatory information.
Management’s Responsibility for theFinancial Statements
Management is responsible for thepreparation of these financialstatements that give a true and fairview of the financial position, financialperformance and cash flows of theCompany in accordance with theAccounting Standards referred to insub-section (3C) of section 211 of theCompanies Act, 1956 (“the Act”). Thisresponsibility includes the design,implementation and maintenance ofinternal control relevant to thepreparation and presentation of thefinancial statements that give a trueand fair view and are free frommaterial misstatement, whether dueto fraud or error.
Auditors’ Responsibility
Our responsibility is to express anopinion on these financial statementsbased on our audit. We conducted ouraudit in accordance with theStandards on Auditing issued by theInstitute of Chartered Accountants ofIndia. Those Standards require thatwe comply with ethical requirementsand plan and perform the audit toobtain reasonable assurance aboutwhether the financial statements arefree from material misstatement.
An audit involves performingprocedures to obtain audit evidenceabout the amounts and disclosuresin the financial statements. The
procedures selected depend on theauditors’ judgment, including theassessment of the risks of materialmisstatement of the financialstatements, whether due to fraud orerror. In making those riskassessments, the auditor considersinternal control relevant to theCompany’s preparation and fairpresentation of the financialstatements in order to design auditprocedures that are appropriate in thecircumstances. An audit also includesevaluating the appropriateness ofaccounting policies used and thereasonableness of the accountingestimates made by management, aswell as evaluating the overallpresentation of the financialstatements.
We believe that the audit evidence wehave obtained is sufficient andappropriate to provide a basis for ouraudit opinion.
Opinion
In our opinion and to the best of ourinformation and according to theexplanations given to us, thefinancial statements give theinformation required by the Act in themanner so required and give a trueand fair view in conformity with theaccounting principles generallyaccepted in India:
(a) in the case of the Balance Sheet,of the state of affairs of the Companyas at March 31, 2013;
(b) in the case of the Statement ofProfit and Loss, of the profit for theyear ended on that date; and
(c) in the case of the Cash FlowStatement, of the cash flows for theyear ended on that date.
Report on Other Legal andRegulatory Requirements
1. As required by the Companies(Auditors’ Report) Order, 2003 (“the
Order”) issued by the CentralGovernment of India in terms ofsub-section (4A) of section 227 ofthe Act, we give in the Annexure, astatement on the matters specifiedin paragraphs 4 and 5 of the Order.
2. As required by section 227(3) ofthe Act, we report that:
a. we have obtained all theinformation and explanations whichto the best of our knowledge andbelief were necessary for the purposeof our audit;
b. in our opinion proper booksof account as required by law havebeen kept by the Company so far asappears from our examination ofthose books;
c. the Balance Sheet,Statement of Profit and Loss, andCash Flow Statement dealt with bythis Report are in agreement with thebooks of account;
d. in our opinion, the BalanceSheet, Statement of Profit and Loss,and Cash Flow Statement comply withthe Accounting Standards referred toin sub-section (3C) of section 211 ofthe Companies Act, 1956;
e. on the basis of writtenrepresentations received from thedirectors as on March 31, 2013, andtaken on record by the Board ofDirectors, none of the directors isdisqualified as on March 31, 2013,from being appointed as adirector in terms of clause (g) ofsub-section (1) of section 274 of theCompanies Act, 1956.
For HARIBHAKTI & CO.Chartered Accountants
Firm Registration No.103523W
Rakesh RathiMUMBAI Partner
April 29, 2013 Membership No.: 45228
Fourteenth Annual Report 2012-13
294
given to us, the Company has not
accepted any deposits from the public
within the meaning of sections 58A
and 58AA of the Act and the rules
framed thereunder.
vii. In our opinion, the Company has
an internal audit system
commensurate with the size and
nature of its business.
viii. The clause (viii) of Para 4 of the
Companies (Auditor’s Report) Order,
2003 (as amended) is not reported
upon as it is not applicable to the
Company.
ix. (a) The Company is regular in
depositing with appropriate
authorities undisputed statutory dues
including provident fund, income-tax,
wealth-tax, service tax and other
statutory dues applicable to it.
(b) According to the information
and explanations given to us, no
undisputed amounts payable in
respect of provident fund, income-tax,
wealth tax, service tax and other
statutory dues were outstanding, at
the year end, for a period of more than
six months from the date they
became payable.
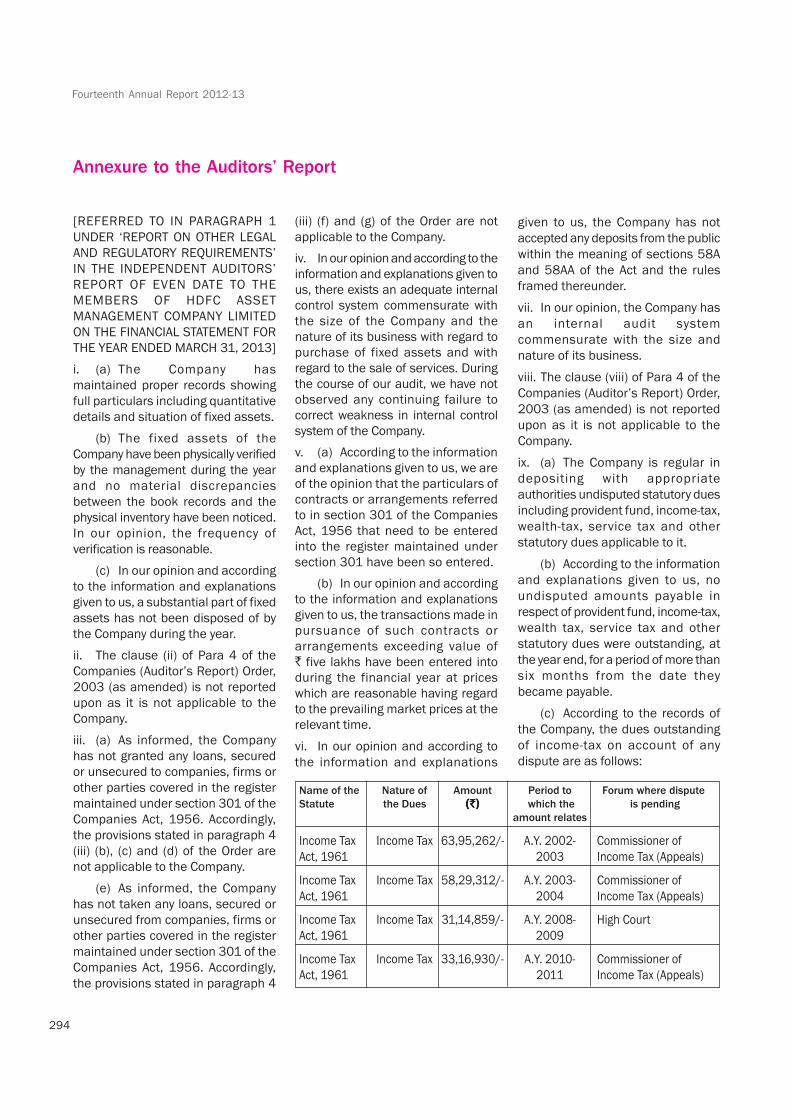
(c) According to the records of
the Company, the dues outstanding
of income-tax on account of any
dispute are as follows:
Name of the Nature of Amount Period to Forum where dispute
Statute the Dues which the is pending
amount relates
Income Tax Income Tax 63,95,262/- A.Y. 2002- Commissioner of
Act, 1961 2003 Income Tax (Appeals)
Income Tax Income Tax 58,29,312/- A.Y. 2003- Commissioner of
Act, 1961 2004 Income Tax (Appeals)
Income Tax Income Tax 31,14,859/- A.Y. 2008- High Court
Act, 1961 2009
Income Tax Income Tax 33,16,930/- A.Y. 2010- Commissioner of
Act, 1961 2011 Income Tax (Appeals)
Annexure to the Auditors’ Report
[REFERRED TO IN PARAGRAPH 1
UNDER ‘REPORT ON OTHER LEGAL
AND REGULATORY REQUIREMENTS’
IN THE INDEPENDENT AUDITORS’
REPORT OF EVEN DATE TO THE
MEMBERS OF HDFC ASSET
MANAGEMENT COMPANY LIMITED
ON THE FINANCIAL STATEMENT FOR
THE YEAR ENDED MARCH 31, 2013]
i. (a) The Company has
maintained proper records showing
full particulars including quantitative
details and situation of fixed assets.
(b) The fixed assets of the
Company have been physically verified
by the management during the year
and no material discrepancies
between the book records and the
physical inventory have been noticed.
In our opinion, the frequency of
verification is reasonable.
(c) In our opinion and according
to the information and explanations
given to us, a substantial part of fixed
assets has not been disposed of by
the Company during the year.
ii. The clause (ii) of Para 4 of the
Companies (Auditor’s Report) Order,
2003 (as amended) is not reported
upon as it is not applicable to the
Company.
iii. (a) As informed, the Company
has not granted any loans, secured
or unsecured to companies, firms or
other parties covered in the register
maintained under section 301 of the
Companies Act, 1956. Accordingly,
the provisions stated in paragraph 4
(iii) (b), (c) and (d) of the Order are
not applicable to the Company.
(e) As informed, the Company
has not taken any loans, secured or
unsecured from companies, firms or
other parties covered in the register
maintained under section 301 of the
Companies Act, 1956. Accordingly,
the provisions stated in paragraph 4
(iii) (f) and (g) of the Order are not
applicable to the Company.
iv. In our opinion and according to the
information and explanations given to
us, there exists an adequate internal
control system commensurate with
the size of the Company and the
nature of its business with regard to
purchase of fixed assets and with
regard to the sale of services. During
the course of our audit, we have not
observed any continuing failure to
correct weakness in internal control
system of the Company.
v. (a) According to the information
and explanations given to us, we are
of the opinion that the particulars of
contracts or arrangements referred
to in section 301 of the Companies
Act, 1956 that need to be entered
into the register maintained under
section 301 have been so entered.
(b) In our opinion and according
to the information and explanations
given to us, the transactions made in
pursuance of such contracts or
arrangements exceeding value of
five lakhs have been entered into
during the financial year at prices
which are reasonable having regard
to the prevailing market prices at the
relevant time.
vi. In our opinion and according to
the information and explanations
295
HDFC Asset Management Company Limited
x. The Company has no
accumulated losses at the end of the
financial year and it has not incurred
cash losses in the current and
immediately preceding financial year.
xi. In our opinion and according to
the information and explanations
given to us, the Company has not
taken any loan from Financial
Institution, Bank and the Company
has not issued any Debentures.
xii. We are of the opinion that the
Company has maintained adequate
records where the Company has
granted loans and advances on the
basis of security by way of pledge of
shares and other securities.
xiii. In our opinion, the Company is not
a chit fund or a nidhi / mutual benefit
fund / society. Therefore, the
provisions of clause (xiii) of paragraph
4 of the Companies (Auditor’s Report)
Order, 2003 (as amended) is not
reported upon as it is not applicable
to the Company.
xiv. In our opinion, the Company is
not dealing in or trading in shares,
securities, debentures and other
investments. Accordingly, the
provisions of clause (xiv) of paragraph
4 of the Companies (Auditor’s Report)
Order, 2003 (as amended) are not
applicable to the Company.
xv. In our opinion and according to
the information and explanations
given to us, the Company has not
given any guarantee for loans taken
by others from banks or financial
institutions during the year.
xvi. The Company has not obtained
any term loans.
xvii. According to the information and
explanations given to us and on an
overall examination of the Balance
Sheet of the Company, we report that
no funds raised on short-term basis
have been used for long-term
investment.
xviii. According to the information and
explanation given to us, the Company
has not made any preferential
allotment of shares to parties
and companies covered in
the Register maintained under
Section 301 of the Companies
Act, 1956.
xix. According to the information and
explanations given to us, no
debentures have been issued by
the Company during the year.
xx. The Company has not raised
money by way of public issue during
the year.
xxi. During the course of our
examination of the books and records
of the Company, carried out in
accordance with the generally
accepted auditing practices in India,
and according to the information and
explanations given to us, we have
neither come across any instance of
fraud on or by the Company, noticed
or reported during the year, nor have
we been informed of such case by the
management.
For HARIBHAKTI & CO.Chartered Accountants
Firm Registration No.103523W
Rakesh RathiMUMBAI Partner
April 29, 2013 Membership No.: 45228
Annexure to the Auditors’ Report (Continued)
Fourteenth Annual Report 2012-13
296
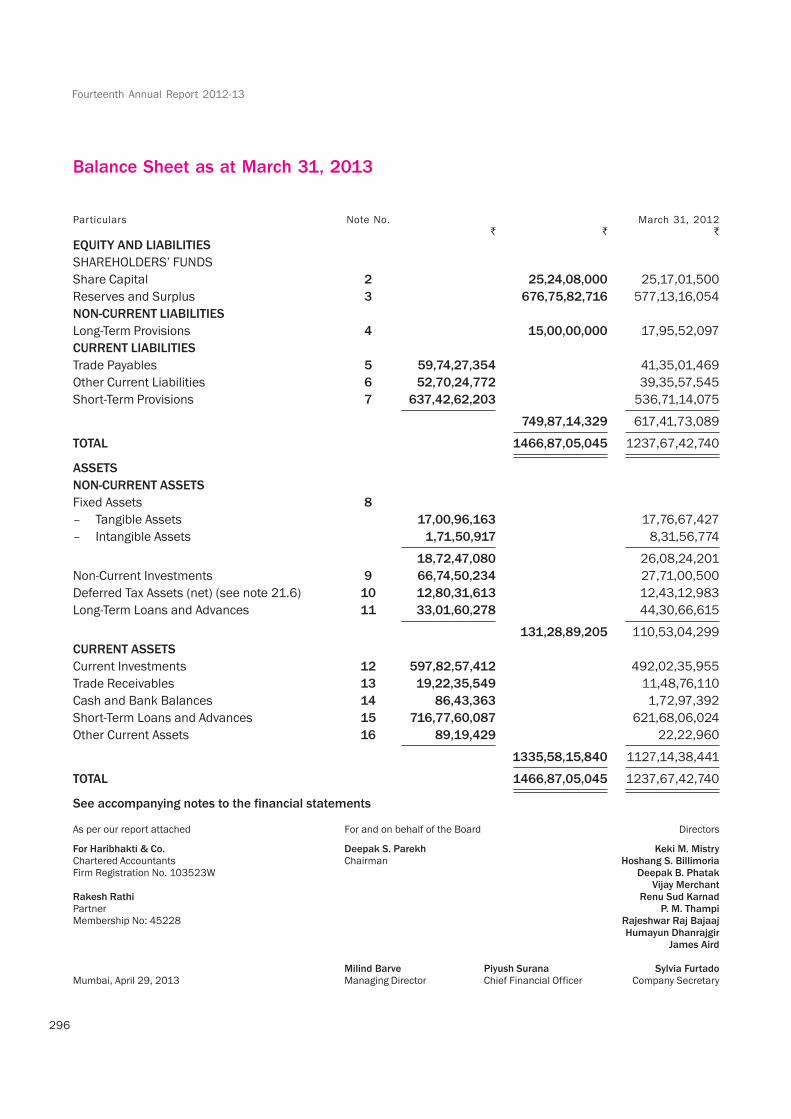
Balance Sheet as at March 31, 2013
Particulars Note No. March 31, 2012
EQUITY AND LIABILITIES
SHAREHOLDERS’ FUNDS
Share Capital 2 25,24,08,000 25,17,01,500
Reserves and Surplus 3 676,75,82,716 577,13,16,054
NON-CURRENT LIABILITIES
Long-Term Provisions 4 15,00,00,000 17,95,52,097
CURRENT LIABILITIES
Trade Payables 5 59,74,27,354 41,35,01,469
Other Current Liabilities 6 52,70,24,772 39,35,57,545
Short-Term Provisions 7 637,42,62,203 536,71,14,075
749,87,14,329 617,41,73,089
TOTAL 1466,87,05,045 1237,67,42,740
ASSETS
NON-CURRENT ASSETS
Fixed Assets 8
– Tangible Assets 17,00,96,163 17,76,67,427
– Intangible Assets 1,71,50,917 8,31,56,774
18,72,47,080 26,08,24,201
Non-Current Investments 9 66,74,50,234 27,71,00,500
Deferred Tax Assets (net) (see note 21.6) 10 12,80,31,613 12,43,12,983
Long-Term Loans and Advances 11 33,01,60,278 44,30,66,615
131,28,89,205 110,53,04,299
CURRENT ASSETS
Current Investments 12 597,82,57,412 492,02,35,955
Trade Receivables 13 19,22,35,549 11,48,76,110
Cash and Bank Balances 14 86,43,363 1,72,97,392
Short-Term Loans and Advances 15 716,77,60,087 621,68,06,024
Other Current Assets 16 89,19,429 22,22,960
1335,58,15,840 1127,14,38,441
TOTAL 1466,87,05,045 1237,67,42,740
See accompanying notes to the financial statements
As per our report attached For and on behalf of the Board Directors
For Haribhakti & Co. Deepak S. Parekh Keki M. MistryChartered Accountants Chairman Hoshang S. BillimoriaFirm Registration No. 103523W Deepak B. Phatak
Vijay MerchantRakesh Rathi Renu Sud KarnadPartner P. M. ThampiMembership No: 45228 Rajeshwar Raj Bajaaj
Humayun DhanrajgirJames Aird
Milind Barve Piyush Surana Sylvia FurtadoMumbai, April 29, 2013 Managing Director Chief Financial Officer Company Secretary
297
HDFC Asset Management Company Limited
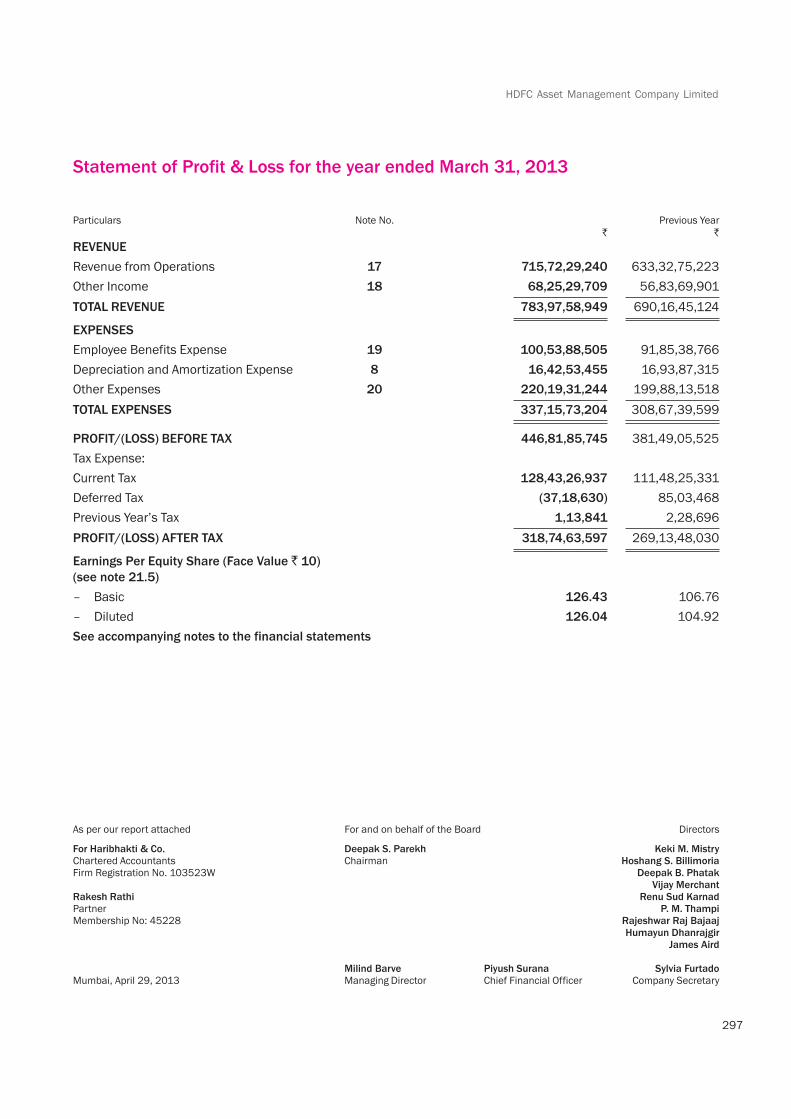
Particulars Note No. Previous Year
REVENUE
Revenue from Operations 17 715,72,29,240 633,32,75,223
Other Income 18 68,25,29,709 56,83,69,901
TOTAL REVENUE 783,97,58,949 690,16,45,124
EXPENSES
Employee Benefits Expense 19 100,53,88,505 91,85,38,766
Depreciation and Amortization Expense 8 16,42,53,455 16,93,87,315
Other Expenses 20 220,19,31,244 199,88,13,518
TOTAL EXPENSES 337,15,73,204 308,67,39,599
PROFIT/(LOSS) BEFORE TAX 446,81,85,745 381,49,05,525
Tax Expense:
Current Tax 128,43,26,937 111,48,25,331
Deferred Tax (37,18,630) 85,03,468
Previous Year’s Tax 1,13,841 2,28,696
PROFIT/(LOSS) AFTER TAX 318,74,63,597 269,13,48,030
Earnings Per Equity Share (Face Value 10)
(see note 21.5)
– Basic 126.43 106.76
– Diluted 126.04 104.92
See accompanying notes to the financial statements
Statement of Profit & Loss for the year ended March 31, 2013
As per our report attached For and on behalf of the Board Directors
For Haribhakti & Co. Deepak S. Parekh Keki M. MistryChartered Accountants Chairman Hoshang S. BillimoriaFirm Registration No. 103523W Deepak B. Phatak
Vijay MerchantRakesh Rathi Renu Sud KarnadPartner P. M. ThampiMembership No: 45228 Rajeshwar Raj Bajaaj
Humayun DhanrajgirJames Aird
Milind Barve Piyush Surana Sylvia FurtadoMumbai, April 29, 2013 Managing Director Chief Financial Officer Company Secretary
Fourteenth Annual Report 2012-13
298
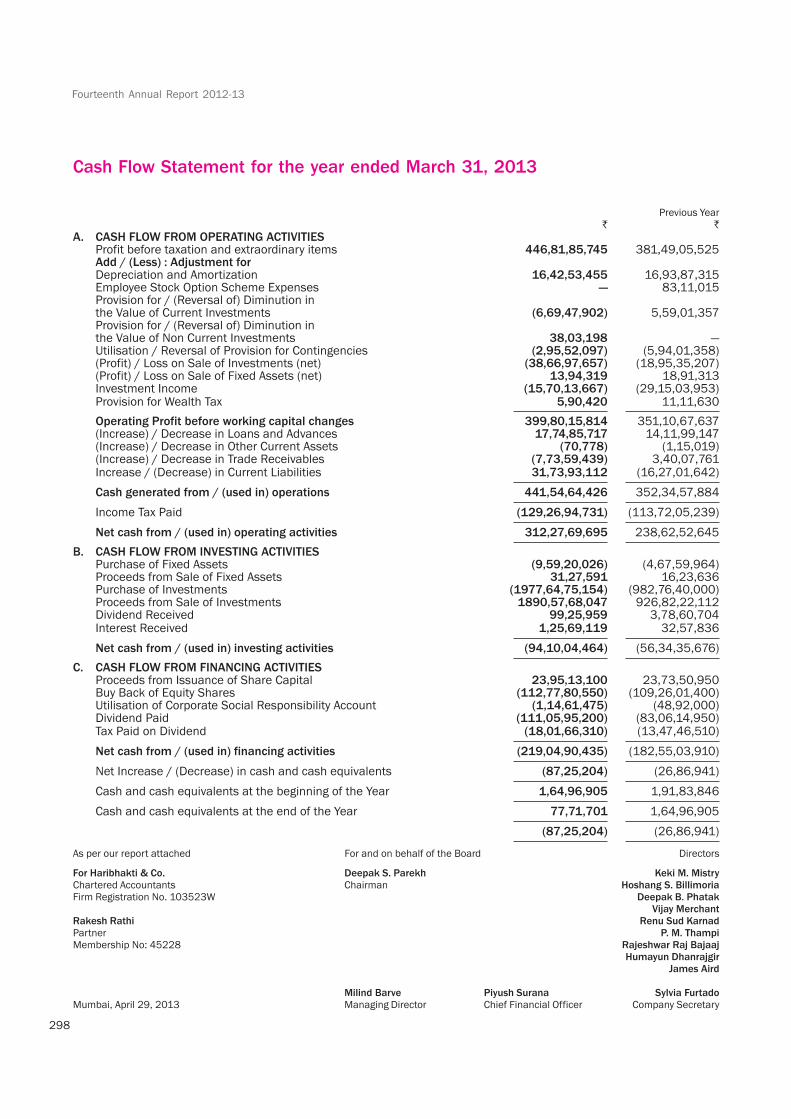
Cash Flow Statement for the year ended March 31, 2013
Previous Year
A. CASH FLOW FROM OPERATING ACTIVITIESProfit before taxation and extraordinary items 446,81,85,745 381,49,05,525Add / (Less) : Adjustment forDepreciation and Amortization 16,42,53,455 16,93,87,315Employee Stock Option Scheme Expenses — 83,11,015Provision for / (Reversal of) Diminution inthe Value of Current Investments (6,69,47,902) 5,59,01,357Provision for / (Reversal of) Diminution inthe Value of Non Current Investments 38,03,198 —Utilisation / Reversal of Provision for Contingencies (2,95,52,097) (5,94,01,358)(Profit) / Loss on Sale of Investments (net) (38,66,97,657) (18,95,35,207)(Profit) / Loss on Sale of Fixed Assets (net) 13,94,319 18,91,313Investment Income (15,70,13,667) (29,15,03,953)Provision for Wealth Tax 5,90,420 11,11,630
Operating Profit before working capital changes 399,80,15,814 351,10,67,637(Increase) / Decrease in Loans and Advances 17,74,85,717 14,11,99,147(Increase) / Decrease in Other Current Assets (70,778) (1,15,019)(Increase) / Decrease in Trade Receivables (7,73,59,439) 3,40,07,761Increase / (Decrease) in Current Liabilities 31,73,93,112 (16,27,01,642)
Cash generated from / (used in) operations 441,54,64,426 352,34,57,884
Income Tax Paid (129,26,94,731) (113,72,05,239)
Net cash from / (used in) operating activities 312,27,69,695 238,62,52,645
B. CASH FLOW FROM INVESTING ACTIVITIESPurchase of Fixed Assets (9,59,20,026) (4,67,59,964)Proceeds from Sale of Fixed Assets 31,27,591 16,23,636Purchase of Investments (1977,64,75,154) (982,76,40,000)Proceeds from Sale of Investments 1890,57,68,047 926,82,22,112Dividend Received 99,25,959 3,78,60,704Interest Received 1,25,69,119 32,57,836
Net cash from / (used in) investing activities (94,10,04,464) (56,34,35,676)
C. CASH FLOW FROM FINANCING ACTIVITIESProceeds from Issuance of Share Capital 23,95,13,100 23,73,50,950Buy Back of Equity Shares (112,77,80,550) (109,26,01,400)Utilisation of Corporate Social Responsibility Account (1,14,61,475) (48,92,000)Dividend Paid (111,05,95,200) (83,06,14,950)Tax Paid on Dividend (18,01,66,310) (13,47,46,510)
Net cash from / (used in) financing activities (219,04,90,435) (182,55,03,910)
Net Increase / (Decrease) in cash and cash equivalents (87,25,204) (26,86,941)
Cash and cash equivalents at the beginning of the Year 1,64,96,905 1,91,83,846
Cash and cash equivalents at the end of the Year 77,71,701 1,64,96,905
(87,25,204) (26,86,941)
As per our report attached For and on behalf of the Board Directors
For Haribhakti & Co. Deepak S. Parekh Keki M. MistryChartered Accountants Chairman Hoshang S. BillimoriaFirm Registration No. 103523W Deepak B. Phatak
Vijay MerchantRakesh Rathi Renu Sud KarnadPartner P. M. ThampiMembership No: 45228 Rajeshwar Raj Bajaaj
Humayun DhanrajgirJames Aird
Milind Barve Piyush Surana Sylvia FurtadoMumbai, April 29, 2013 Managing Director Chief Financial Officer Company Secretary
299
HDFC Asset Management Company Limited
SUMMARY OF SIGNIFICANT ACCOUNTING POLICIES AND OTHER EXPLANATORY INFORMATION (NOTES) FORMING
PART OF THE FINANCIAL STATEMENTS FOR THE YEAR ENDED MARCH 31, 2013
Note 1
A) COMPANY OVERVIEW
HDFC Asset Management Company Limited (‘the Company’) was incorporated under the Companies Act, 1956
on December 10, 1999 and was approved to act as an Asset Management Company for the HDFC Mutual Fund
by Securities and Exchange Board of India (SEBI) vide its letter dated July 3, 2000. In terms of the Investment
Management Agreement, the Trustee has appointed the Company to manage the Mutual Fund.
The Company is also registered under the SEBI (Portfolio Managers) Regulations, 1993 and provides Portfolio
Management Services.
B) SIGNIFICANT ACCOUNTING POLICIES
1.1 Basis of Preparation
The financial statements have been prepared on accrual basis of accounting in accordance with historical
cost convention, applicable Accounting Standards issued by the Institute of Chartered Accountants of India
and relevant provisions of the Companies Act, 1956 to the extent applicable.
1.2 Use of Estimates
The preparation of financial statements requires the management to make estimates and assumptions
considered in the reported amounts of assets and liabilities (including contingent liabilities) as of the date
of the financial statements and the reported income and expenses during the reporting period. Management
believes that the estimates used in preparation of the financial statements are prudent and reasonable.
Future results could differ from these estimates.
1.3 Income Recognition
Management fees and income from investments are accounted for on accrual basis. Dividend income is
recognized when the right to receive the same is established. Interest income is recognized on a time
proportion basis.
1.4 Cash and Cash Equivalents
Cash and cash equivalents represent cash and balance with scheduled banks in current account.
1.5 Fixed Assets
Fixed assets are stated at cost less accumulated depreciation / amortization as adjusted for impairment, if
any. The cost of acquisition is inclusive of taxes, duties, freight and other incidental expenses related to
acquisition and installation of the assets. Subsequent expenditure incurred on assets put to use is capitalized
only when it increases the future benefit / functioning capability from / of such assets.
All expenses on existing fixed assets, including day to day repair and maintenance expenditure and
cost of replacing parts are charged to Statement of Profit and Loss during the period in which
they are incurred. Depreciation is charged over the estimated useful life of the fixed asset on a
straight-line basis.
Gains or Losses arising from disposal of fixed assets are measured as the difference between the
net disposal proceeds and carrying amount of the asset and is recognized in the Statement of Profit
and Loss.
Fourteenth Annual Report 2012-13
300
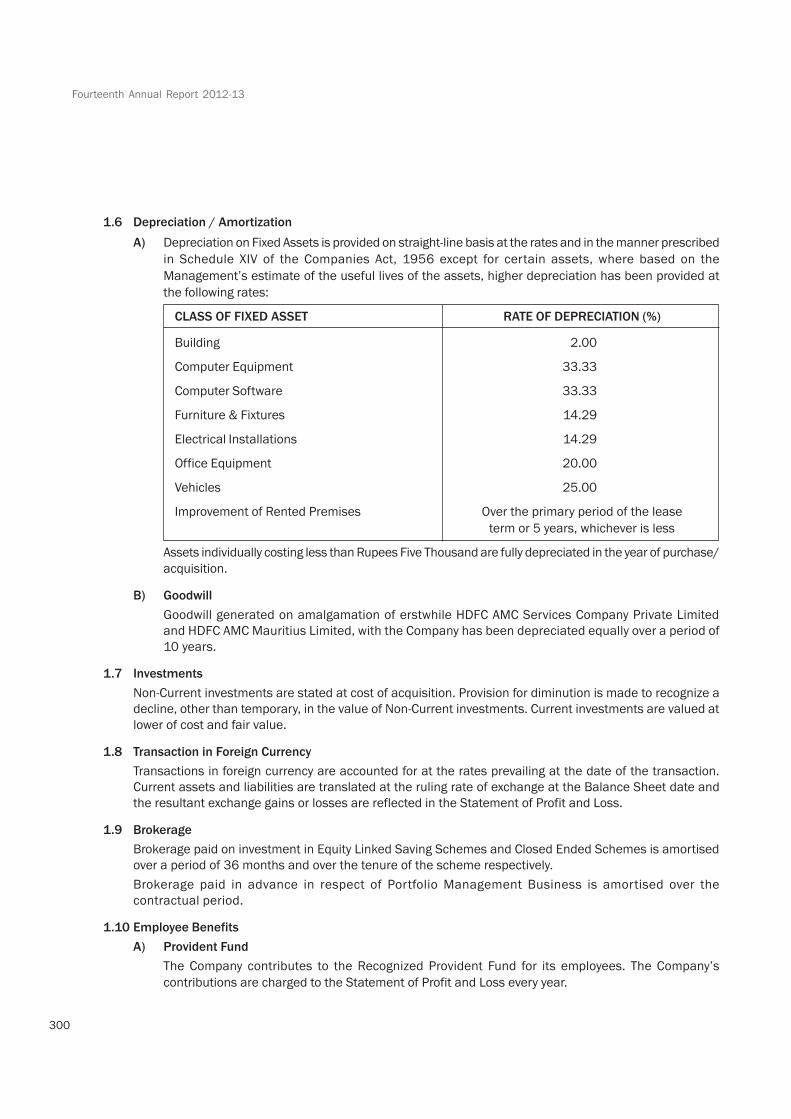
1.6 Depreciation / Amortization
A) Depreciation on Fixed Assets is provided on straight-line basis at the rates and in the manner prescribed
in Schedule XIV of the Companies Act, 1956 except for certain assets, where based on the
Management’s estimate of the useful lives of the assets, higher depreciation has been provided at
the following rates:
CLASS OF FIXED ASSET RATE OF DEPRECIATION (%)
Building 2.00
Computer Equipment 33.33
Computer Software 33.33
Furniture & Fixtures 14.29
Electrical Installations 14.29
Office Equipment 20.00
Vehicles 25.00
Improvement of Rented Premises Over the primary period of the lease
term or 5 years, whichever is less
Assets individually costing less than Rupees Five Thousand are fully depreciated in the year of purchase/
acquisition.
B) Goodwill
Goodwill generated on amalgamation of erstwhile HDFC AMC Services Company Private Limited
and HDFC AMC Mauritius Limited, with the Company has been depreciated equally over a period of
10 years.
1.7 Investments
Non-Current investments are stated at cost of acquisition. Provision for diminution is made to recognize a
decline, other than temporary, in the value of Non-Current investments. Current investments are valued at
lower of cost and fair value.
1.8 Transaction in Foreign Currency
Transactions in foreign currency are accounted for at the rates prevailing at the date of the transaction.
Current assets and liabilities are translated at the ruling rate of exchange at the Balance Sheet date and
the resultant exchange gains or losses are reflected in the Statement of Profit and Loss.
1.9 Brokerage
Brokerage paid on investment in Equity Linked Saving Schemes and Closed Ended Schemes is amortised
over a period of 36 months and over the tenure of the scheme respectively.
Brokerage paid in advance in respect of Portfolio Management Business is amortised over the
contractual period.
1.10 Employee Benefits
A) Provident Fund
The Company contributes to the Recognized Provident Fund for its employees. The Company’s
contributions are charged to the Statement of Profit and Loss every year.
301
HDFC Asset Management Company Limited
B) Gratuity
Company’s contribution in the case of gratuity is funded annually with a life insurance company. The
net present value of the Company’s obligation towards gratuity to employees is actuarially determined
by an independent actuary based on the projected unit credit method. Actuarial gains and losses are
immediately recognized in the Statement of Profit and Loss.
1.11 Operating Leases
Leases where the lessor effectively retains substantially all the risks and benefits of ownership
over the lease term are classified as Operating Leases. Operating lease rentals are recognized on
accrual basis.
1.12 Income Tax
The accounting treatment for Income Tax in respect of the Company’s income is based on the Accounting
Standard on “Accounting for Taxes on Income” (AS-22) issued by the Institute of Chartered Accountants
of India. The provision made for Income Tax in the Financial Statements comprises both, the current
tax and the deferred tax. The deferred tax assets and liabilities for the year, arising on account of
timing differences, are recognized in the Statement of Profit and Loss and the cumulative effect thereof
is reflected in the Balance Sheet. Deferred tax assets are recognized only to the extent there is
reasonable certainty that the assets can be realized in future. Deferred tax assets and liabilities are
measured using the enacted or substantively enacted tax rates at the balance sheet date. The major
components of the respective balances of deferred tax assets and liabilities are disclosed in the Financial
Statements.
1.13 Scheme Expenses
Recurring expenses of schemes of HDFC Mutual Fund in excess of limits prescribed by the Securities and
Exchange Board of India are accounted under the respective expense heads in the Statement of Profit and
Loss. In accordance with Securities and Exchange Board of India (Mutual Funds) Regulations, 1996, New
Fund Offer (NFO) expenses on the launch of schemes is borne by the Company.
1.14 Impairment of Assets
The Company assesses at each Balance Sheet date whether there is any indication that an asset may be
impaired. Impairment loss, if any, is provided in the Statement of Profit and Loss to the extent the carrying
amount of assets exceeds their estimated recoverable amount.
1.15 Provision for Contingencies
In accordance with Accounting Standard on “Provisions, Contingent Liabilities and Contingent Assets”
(AS-29), a provision is recognized when the Company has a present legal or constructive obligation as a
result of past events and it is probable that an outflow of resources will be required to settle the obligation,
in respect of which a reliable estimate can be made. Provisions are not discounted to their present value
and are determined based on best estimate required to settle the obligation at the balance sheet date.
These are reviewed at each balance sheet date and adjusted to reflect the current best estimates. The
Company’s policy is to carry adequate amounts in the Provision for Contingencies account to meet all
contingencies in the business.
Contingent liabilities are not recognized. A contingent asset is neither recognized nor disclosed.
Fourteenth Annual Report 2012-13
302
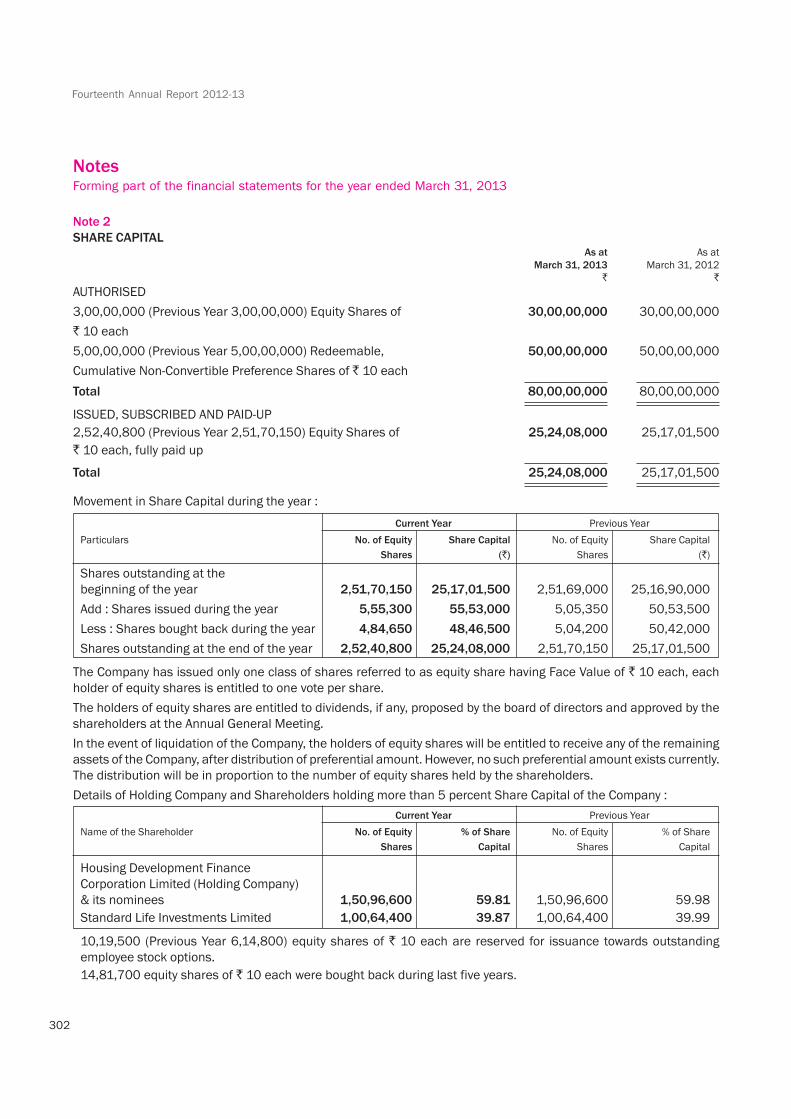
Note 2
SHARE CAPITALAs at As at
March 31, 2013 March 31, 2012
AUTHORISED
3,00,00,000 (Previous Year 3,00,00,000) Equity Shares of 30,00,00,000 30,00,00,000
10 each
5,00,00,000 (Previous Year 5,00,00,000) Redeemable, 50,00,00,000 50,00,00,000
Cumulative Non-Convertible Preference Shares of 10 each
Total 80,00,00,000 80,00,00,000
ISSUED, SUBSCRIBED AND PAID-UP
2,52,40,800 (Previous Year 2,51,70,150) Equity Shares of 25,24,08,000 25,17,01,500
10 each, fully paid up
Total 25,24,08,000 25,17,01,500
Movement in Share Capital during the year :
Current Year Previous Year
Particulars No. of Equity Share Capital No. of Equity Share Capital
Shares ( ) Shares ( )
Shares outstanding at the
beginning of the year 2,51,70,150 25,17,01,500 2,51,69,000 25,16,90,000
Add : Shares issued during the year 5,55,300 55,53,000 5,05,350 50,53,500
Less : Shares bought back during the year 4,84,650 48,46,500 5,04,200 50,42,000
Shares outstanding at the end of the year 2,52,40,800 25,24,08,000 2,51,70,150 25,17,01,500
The Company has issued only one class of shares referred to as equity share having Face Value of 10 each, each
holder of equity shares is entitled to one vote per share.
The holders of equity shares are entitled to dividends, if any, proposed by the board of directors and approved by the
shareholders at the Annual General Meeting.
In the event of liquidation of the Company, the holders of equity shares will be entitled to receive any of the remaining
assets of the Company, after distribution of preferential amount. However, no such preferential amount exists currently.
The distribution will be in proportion to the number of equity shares held by the shareholders.
Details of Holding Company and Shareholders holding more than 5 percent Share Capital of the Company :
Current Year Previous Year
Name of the Shareholder No. of Equity % of Share No. of Equity % of Share
Shares Capital Shares Capital
Housing Development Finance
Corporation Limited (Holding Company)
& its nominees 1,50,96,600 59.81 1,50,96,600 59.98
Standard Life Investments Limited 1,00,64,400 39.87 1,00,64,400 39.99
10,19,500 (Previous Year 6,14,800) equity shares of 10 each are reserved for issuance towards outstanding
employee stock options.
14,81,700 equity shares of 10 each were bought back during last five years.
NotesForming part of the financial statements for the year ended March 31, 2013
303
HDFC Asset Management Company Limited
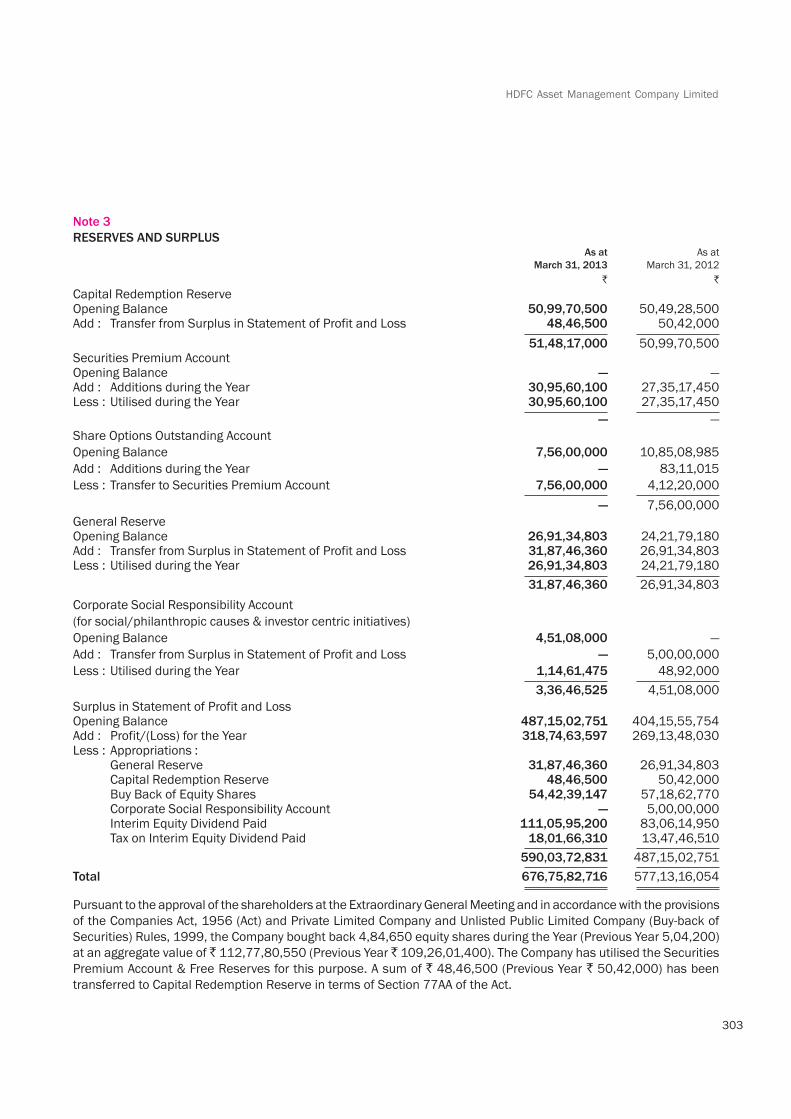
Note 3
RESERVES AND SURPLUSAs at As at
March 31, 2013 March 31, 2012
Capital Redemption ReserveOpening Balance 50,99,70,500 50,49,28,500Add : Transfer from Surplus in Statement of Profit and Loss 48,46,500 50,42,000
51,48,17,000 50,99,70,500Securities Premium AccountOpening Balance — —Add : Additions during the Year 30,95,60,100 27,35,17,450Less : Utilised during the Year 30,95,60,100 27,35,17,450
— —
Share Options Outstanding Account
Opening Balance 7,56,00,000 10,85,08,985
Add : Additions during the Year — 83,11,015
Less : Transfer to Securities Premium Account 7,56,00,000 4,12,20,000
— 7,56,00,000
General ReserveOpening Balance 26,91,34,803 24,21,79,180Add : Transfer from Surplus in Statement of Profit and Loss 31,87,46,360 26,91,34,803Less : Utilised during the Year 26,91,34,803 24,21,79,180
31,87,46,360 26,91,34,803
Corporate Social Responsibility Account
(for social/philanthropic causes & investor centric initiatives)
Opening Balance 4,51,08,000 —
Add : Transfer from Surplus in Statement of Profit and Loss — 5,00,00,000
Less : Utilised during the Year 1,14,61,475 48,92,000
3,36,46,525 4,51,08,000
Surplus in Statement of Profit and LossOpening Balance 487,15,02,751 404,15,55,754Add : Profit/(Loss) for the Year 318,74,63,597 269,13,48,030Less : Appropriations :
General Reserve 31,87,46,360 26,91,34,803Capital Redemption Reserve 48,46,500 50,42,000Buy Back of Equity Shares 54,42,39,147 57,18,62,770Corporate Social Responsibility Account — 5,00,00,000Interim Equity Dividend Paid 111,05,95,200 83,06,14,950Tax on Interim Equity Dividend Paid 18,01,66,310 13,47,46,510
590,03,72,831 487,15,02,751
Total 676,75,82,716 577,13,16,054
Pursuant to the approval of the shareholders at the Extraordinary General Meeting and in accordance with the provisions
of the Companies Act, 1956 (Act) and Private Limited Company and Unlisted Public Limited Company (Buy-back of
Securities) Rules, 1999, the Company bought back 4,84,650 equity shares during the Year (Previous Year 5,04,200)
at an aggregate value of 112,77,80,550 (Previous Year 109,26,01,400). The Company has utilised the Securities
Premium Account & Free Reserves for this purpose. A sum of 48,46,500 (Previous Year 50,42,000) has been
transferred to Capital Redemption Reserve in terms of Section 77AA of the Act.
Fourteenth Annual Report 2012-13
304
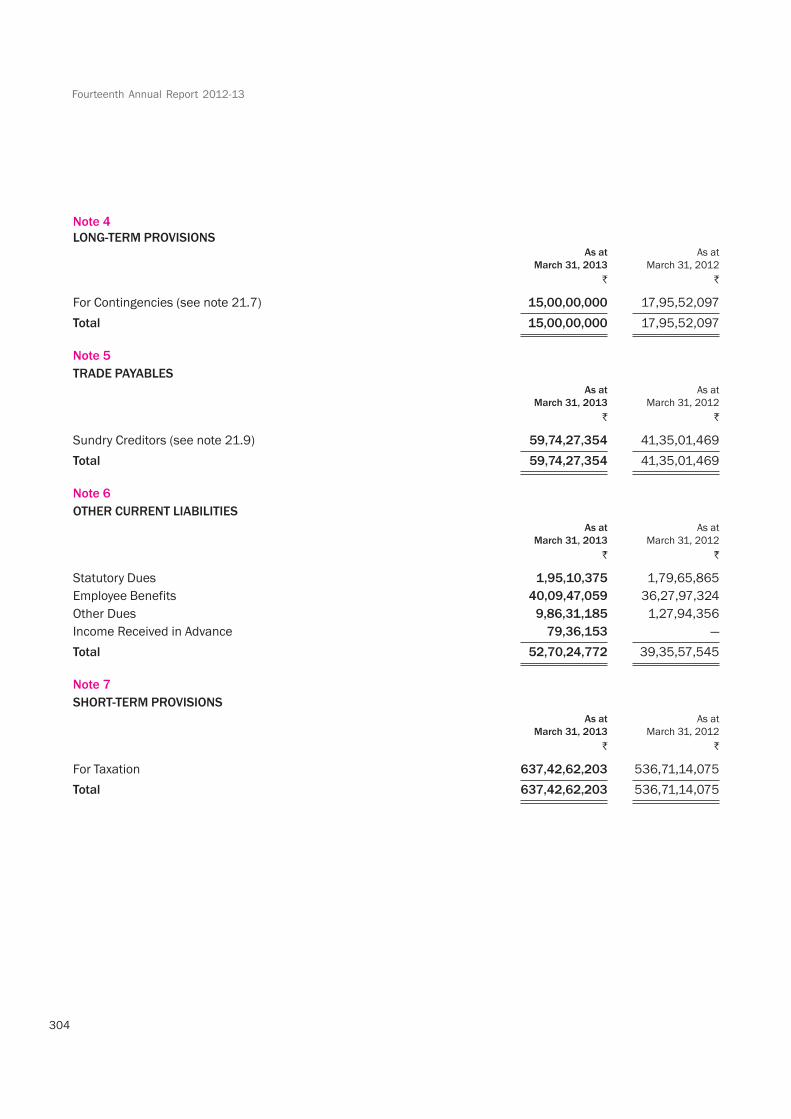
Note 4
LONG-TERM PROVISIONSAs at As at
March 31, 2013 March 31, 2012
For Contingencies (see note 21.7) 15,00,00,000 17,95,52,097
Total 15,00,00,000 17,95,52,097
Note 5
TRADE PAYABLES
As at As at
March 31, 2013 March 31, 2012
Sundry Creditors (see note 21.9) 59,74,27,354 41,35,01,469
Total 59,74,27,354 41,35,01,469
Note 6
OTHER CURRENT LIABILITIES
As at As at
March 31, 2013 March 31, 2012
Statutory Dues 1,95,10,375 1,79,65,865
Employee Benefits 40,09,47,059 36,27,97,324
Other Dues 9,86,31,185 1,27,94,356
Income Received in Advance 79,36,153 —
Total 52,70,24,772 39,35,57,545
Note 7
SHORT-TERM PROVISIONS
As at As at
March 31, 2013 March 31, 2012
For Taxation 637,42,62,203 536,71,14,075
Total 637,42,62,203 536,71,14,075
30
5
HD
FC
Asse
t Ma
na
ge
me
nt C
om
pa
ny L
imite
d
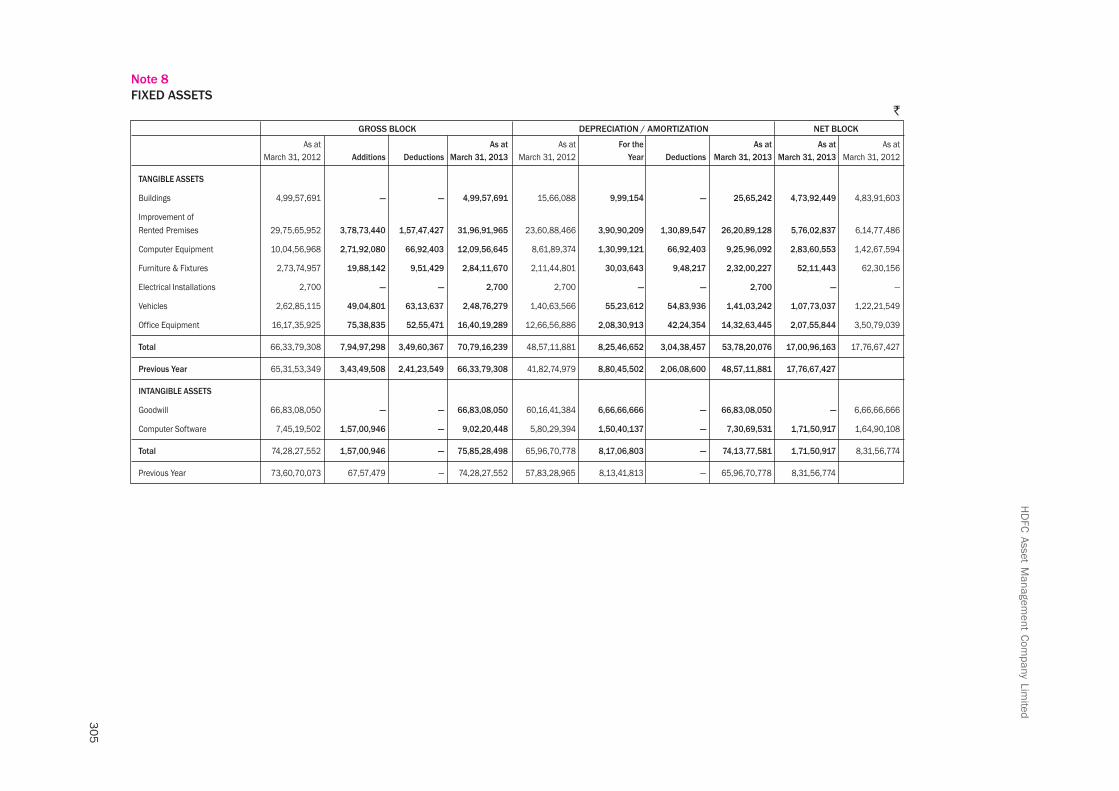
Note 8
FIXED ASSETS
GROSS BLOCK DEPRECIATION / AMORTIZATION NET BLOCK
As at As at As at For the As at As at As at
March 31, 2012 Additions Deductions March 31, 2013 March 31, 2012 Year Deductions March 31, 2013 March 31, 2013 March 31, 2012
TANGIBLE ASSETS
Buildings 4,99,57,691 — — 4,99,57,691 15,66,088 9,99,154 — 25,65,242 4,73,92,449 4,83,91,603
Improvement of
Rented Premises 29,75,65,952 3,78,73,440 1,57,47,427 31,96,91,965 23,60,88,466 3,90,90,209 1,30,89,547 26,20,89,128 5,76,02,837 6,14,77,486
Computer Equipment 10,04,56,968 2,71,92,080 66,92,403 12,09,56,645 8,61,89,374 1,30,99,121 66,92,403 9,25,96,092 2,83,60,553 1,42,67,594
Furniture & Fixtures 2,73,74,957 19,88,142 9,51,429 2,84,11,670 2,11,44,801 30,03,643 9,48,217 2,32,00,227 52,11,443 62,30,156
Electrical Installations 2,700 — — 2,700 2,700 — — 2,700 — —
Vehicles 2,62,85,115 49,04,801 63,13,637 2,48,76,279 1,40,63,566 55,23,612 54,83,936 1,41,03,242 1,07,73,037 1,22,21,549
Office Equipment 16,17,35,925 75,38,835 52,55,471 16,40,19,289 12,66,56,886 2,08,30,913 42,24,354 14,32,63,445 2,07,55,844 3,50,79,039
Total 66,33,79,308 7,94,97,298 3,49,60,367 70,79,16,239 48,57,11,881 8,25,46,652 3,04,38,457 53,78,20,076 17,00,96,163 17,76,67,427
Previous Year 65,31,53,349 3,43,49,508 2,41,23,549 66,33,79,308 41,82,74,979 8,80,45,502 2,06,08,600 48,57,11,881 17,76,67,427
INTANGIBLE ASSETS
Goodwill 66,83,08,050 — — 66,83,08,050 60,16,41,384 6,66,66,666 — 66,83,08,050 — 6,66,66,666
Computer Software 7,45,19,502 1,57,00,946 — 9,02,20,448 5,80,29,394 1,50,40,137 — 7,30,69,531 1,71,50,917 1,64,90,108
Total 74,28,27,552 1,57,00,946 — 75,85,28,498 65,96,70,778 8,17,06,803 — 74,13,77,581 1,71,50,917 8,31,56,774
Previous Year 73,60,70,073 67,57,479 — 74,28,27,552 57,83,28,965 8,13,41,813 — 65,96,70,778 8,31,56,774
Fourteenth Annual Report 2012-13
306
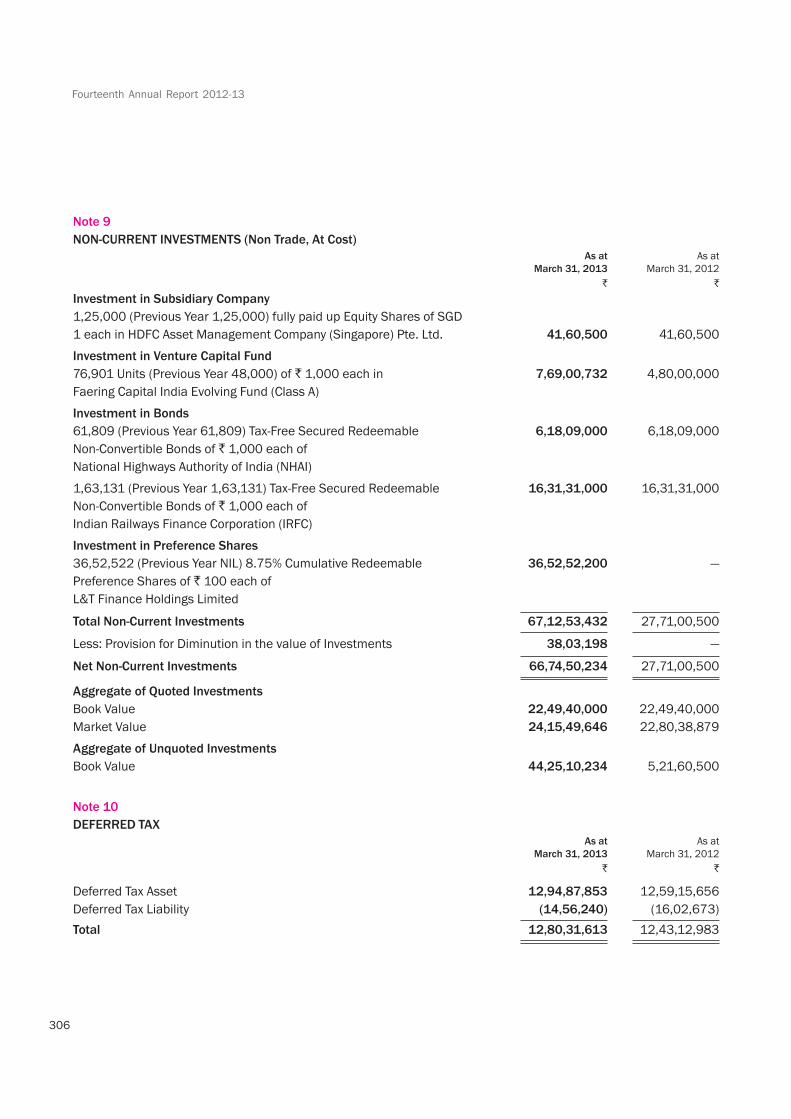
Note 9
NON-CURRENT INVESTMENTS (Non Trade, At Cost)
As at As at
March 31, 2013 March 31, 2012
Investment in Subsidiary Company
1,25,000 (Previous Year 1,25,000) fully paid up Equity Shares of SGD
1 each in HDFC Asset Management Company (Singapore) Pte. Ltd. 41,60,500 41,60,500
Investment in Venture Capital Fund
76,901 Units (Previous Year 48,000) of 1,000 each in 7,69,00,732 4,80,00,000
Faering Capital India Evolving Fund (Class A)
Investment in Bonds
61,809 (Previous Year 61,809) Tax-Free Secured Redeemable 6,18,09,000 6,18,09,000
Non-Convertible Bonds of 1,000 each of
National Highways Authority of India (NHAI)
1,63,131 (Previous Year 1,63,131) Tax-Free Secured Redeemable 16,31,31,000 16,31,31,000
Non-Convertible Bonds of 1,000 each of
Indian Railways Finance Corporation (IRFC)
Investment in Preference Shares
36,52,522 (Previous Year NIL) 8.75% Cumulative Redeemable 36,52,52,200 —
Preference Shares of 100 each of
L&T Finance Holdings Limited
Total Non-Current Investments 67,12,53,432 27,71,00,500
Less: Provision for Diminution in the value of Investments 38,03,198 —
Net Non-Current Investments 66,74,50,234 27,71,00,500
Aggregate of Quoted Investments
Book Value 22,49,40,000 22,49,40,000
Market Value 24,15,49,646 22,80,38,879
Aggregate of Unquoted Investments
Book Value 44,25,10,234 5,21,60,500
Note 10
DEFERRED TAX
As at As at
March 31, 2013 March 31, 2012
Deferred Tax Asset 12,94,87,853 12,59,15,656
Deferred Tax Liability (14,56,240) (16,02,673)
Total 12,80,31,613 12,43,12,983
307
HDFC Asset Management Company Limited
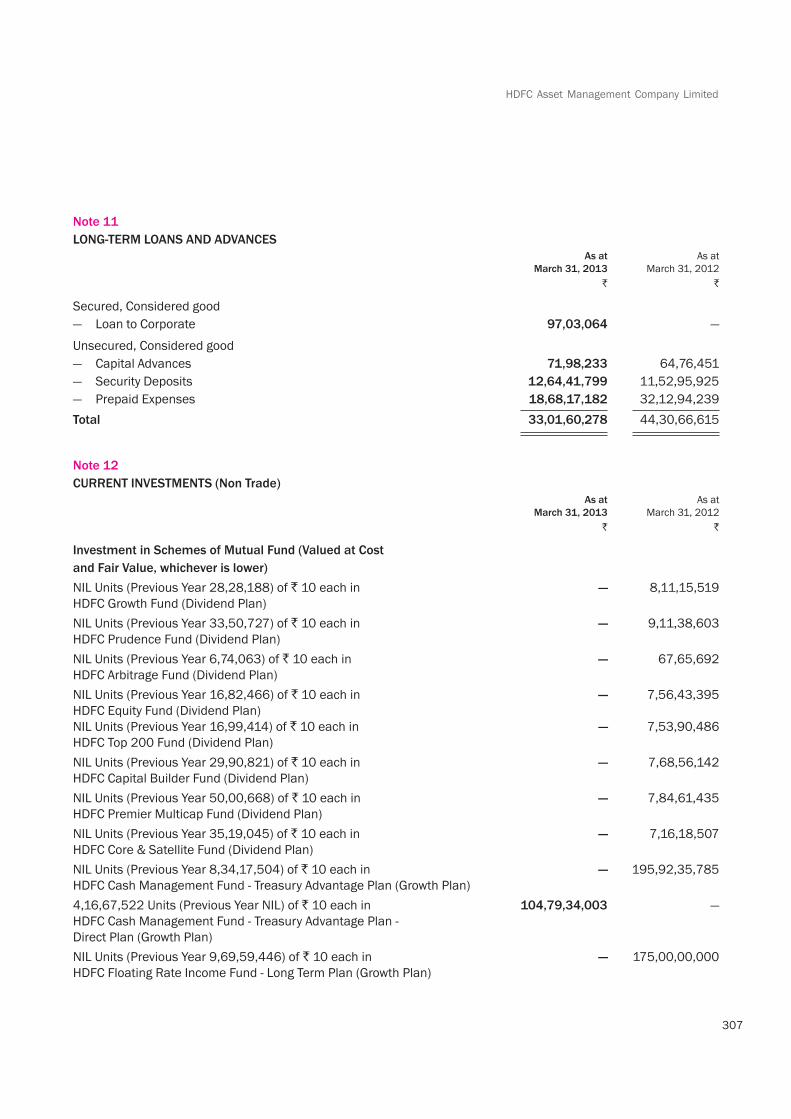
Note 11
LONG-TERM LOANS AND ADVANCES
As at As at
March 31, 2013 March 31, 2012
Secured, Considered good
— Loan to Corporate 97,03,064 —
Unsecured, Considered good
— Capital Advances 71,98,233 64,76,451
— Security Deposits 12,64,41,799 11,52,95,925
— Prepaid Expenses 18,68,17,182 32,12,94,239
Total 33,01,60,278 44,30,66,615
Note 12
CURRENT INVESTMENTS (Non Trade)
As at As at
March 31, 2013 March 31, 2012
Investment in Schemes of Mutual Fund (Valued at Cost
and Fair Value, whichever is lower)
NIL Units (Previous Year 28,28,188) of 10 each in — 8,11,15,519
HDFC Growth Fund (Dividend Plan)
NIL Units (Previous Year 33,50,727) of 10 each in — 9,11,38,603
HDFC Prudence Fund (Dividend Plan)
NIL Units (Previous Year 6,74,063) of 10 each in — 67,65,692
HDFC Arbitrage Fund (Dividend Plan)
NIL Units (Previous Year 16,82,466) of 10 each in — 7,56,43,395
HDFC Equity Fund (Dividend Plan)
NIL Units (Previous Year 16,99,414) of 10 each in — 7,53,90,486
HDFC Top 200 Fund (Dividend Plan)
NIL Units (Previous Year 29,90,821) of 10 each in — 7,68,56,142
HDFC Capital Builder Fund (Dividend Plan)
NIL Units (Previous Year 50,00,668) of 10 each in — 7,84,61,435
HDFC Premier Multicap Fund (Dividend Plan)
NIL Units (Previous Year 35,19,045) of 10 each in — 7,16,18,507
HDFC Core & Satellite Fund (Dividend Plan)
NIL Units (Previous Year 8,34,17,504) of 10 each in — 195,92,35,785
HDFC Cash Management Fund - Treasury Advantage Plan (Growth Plan)
4,16,67,522 Units (Previous Year NIL) of 10 each in 104,79,34,003 —
HDFC Cash Management Fund - Treasury Advantage Plan -
Direct Plan (Growth Plan)
NIL Units (Previous Year 9,69,59,446) of 10 each in — 175,00,00,000
HDFC Floating Rate Income Fund - Long Term Plan (Growth Plan)
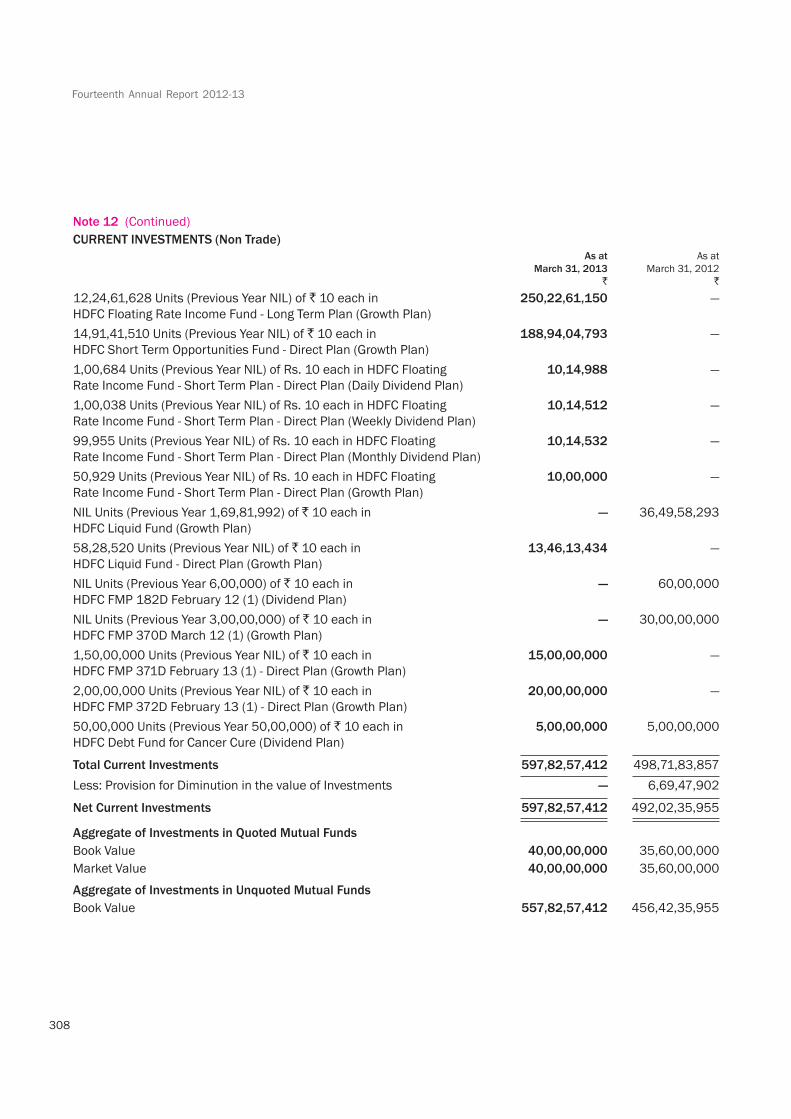
Fourteenth Annual Report 2012-13
308
12,24,61,628 Units (Previous Year NIL) of 10 each in 250,22,61,150 —
HDFC Floating Rate Income Fund - Long Term Plan (Growth Plan)
14,91,41,510 Units (Previous Year NIL) of 10 each in 188,94,04,793 —
HDFC Short Term Opportunities Fund - Direct Plan (Growth Plan)
1,00,684 Units (Previous Year NIL) of Rs. 10 each in HDFC Floating 10,14,988 —
Rate Income Fund - Short Term Plan - Direct Plan (Daily Dividend Plan)
1,00,038 Units (Previous Year NIL) of Rs. 10 each in HDFC Floating 10,14,512 —
Rate Income Fund - Short Term Plan - Direct Plan (Weekly Dividend Plan)
99,955 Units (Previous Year NIL) of Rs. 10 each in HDFC Floating 10,14,532 —
Rate Income Fund - Short Term Plan - Direct Plan (Monthly Dividend Plan)
50,929 Units (Previous Year NIL) of Rs. 10 each in HDFC Floating 10,00,000 —
Rate Income Fund - Short Term Plan - Direct Plan (Growth Plan)
NIL Units (Previous Year 1,69,81,992) of 10 each in — 36,49,58,293
HDFC Liquid Fund (Growth Plan)
58,28,520 Units (Previous Year NIL) of 10 each in 13,46,13,434 —
HDFC Liquid Fund - Direct Plan (Growth Plan)
NIL Units (Previous Year 6,00,000) of 10 each in — 60,00,000
HDFC FMP 182D February 12 (1) (Dividend Plan)
NIL Units (Previous Year 3,00,00,000) of 10 each in — 30,00,00,000
HDFC FMP 370D March 12 (1) (Growth Plan)
1,50,00,000 Units (Previous Year NIL) of 10 each in 15,00,00,000 —
HDFC FMP 371D February 13 (1) - Direct Plan (Growth Plan)
2,00,00,000 Units (Previous Year NIL) of 10 each in 20,00,00,000 —
HDFC FMP 372D February 13 (1) - Direct Plan (Growth Plan)
50,00,000 Units (Previous Year 50,00,000) of 10 each in 5,00,00,000 5,00,00,000
HDFC Debt Fund for Cancer Cure (Dividend Plan)
Total Current Investments 597,82,57,412 498,71,83,857
Less: Provision for Diminution in the value of Investments — 6,69,47,902
Net Current Investments 597,82,57,412 492,02,35,955
Aggregate of Investments in Quoted Mutual Funds
Book Value 40,00,00,000 35,60,00,000
Market Value 40,00,00,000 35,60,00,000
Aggregate of Investments in Unquoted Mutual Funds
Book Value 557,82,57,412 456,42,35,955
Note 12 (Continued)
CURRENT INVESTMENTS (Non Trade)
As at As at
March 31, 2013 March 31, 2012

309
HDFC Asset Management Company Limited
Note 13
TRADE RECEIVABLES
(Unsecured, Considered good) As at As at
March 31, 2013 March 31, 2012
Investment Management Fee Receivable 15,10,05,641 6,62,90,120
(less than six months)
Portfolio Management Fee Receivable
— Over six months 1,53,494 13,238
— Others 4,10,76,414 4,85,72,752
4,12,29,908 4,85,85,990
Total 19,22,35,549 11,48,76,110
Note 14
CASH AND BANK BALANCES
As at As at
March 31, 2013 March 31, 2012
Cash and Cash Equivalents
— Balances with Banks 77,71,701 1,64,96,905
Other Bank Balances
— In Deposit Account (security against bank guarantee) 8,71,662 8,00,487
Total 86,43,363 1,72,97,392
Note 15
SHORT-TERM LOANS AND ADVANCES
(Unsecured, Considered good) As at As at
March 31, 2013 March 31, 2012
Advance Payment of Taxes 646,80,04,223 545,31,92,562
Prepaid Expenses
— Related Parties 66,74,836 52,82,101
— Others 36,98,60,413 42,36,65,828
37,65,35,249 42,89,47,929
Service Tax Credit Receivable 1,00,34,388 67,72,687
Other Receivables
— Related Parties 4,67,20,200 5,05,60,200
— Others 26,64,66,027 27,73,32,646
31,31,86,227 32,78,92,846
Total 716,77,60,087 621,68,06,024
Fourteenth Annual Report 2012-13
310
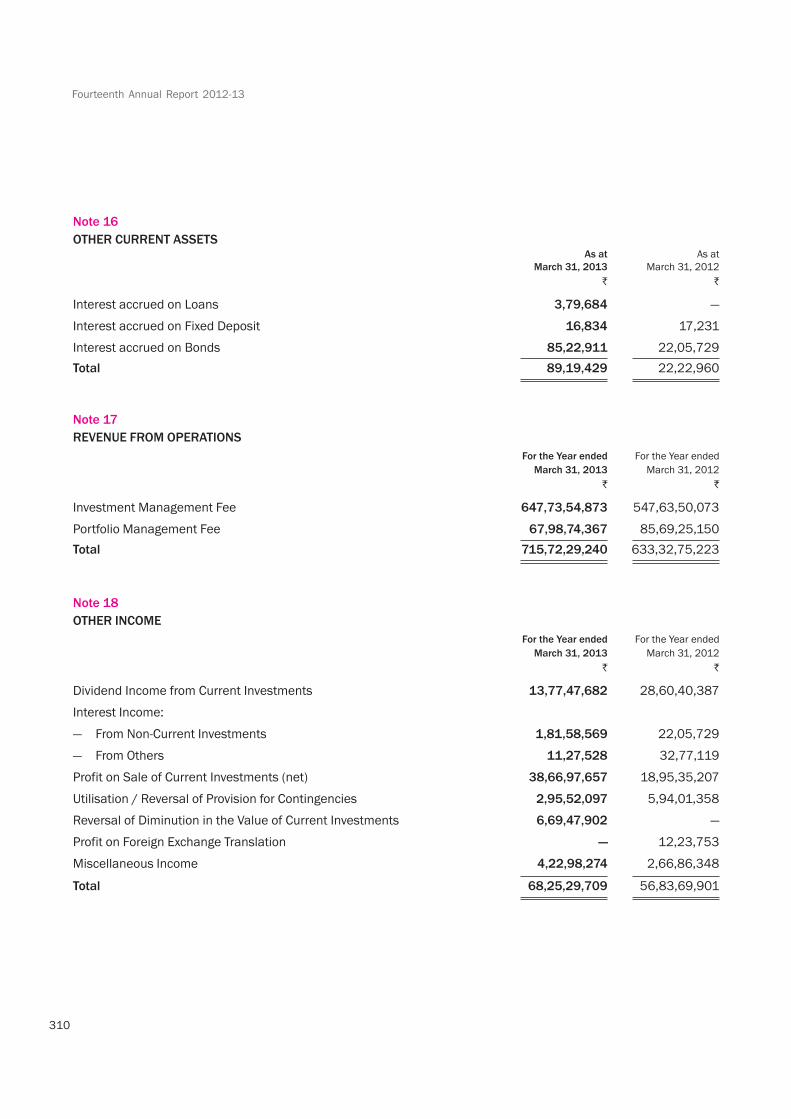
Note 16
OTHER CURRENT ASSETSAs at As at
March 31, 2013 March 31, 2012
Interest accrued on Loans 3,79,684 —
Interest accrued on Fixed Deposit 16,834 17,231
Interest accrued on Bonds 85,22,911 22,05,729
Total 89,19,429 22,22,960
Note 17
REVENUE FROM OPERATIONS
For the Year ended For the Year ended
March 31, 2013 March 31, 2012
Investment Management Fee 647,73,54,873 547,63,50,073
Portfolio Management Fee 67,98,74,367 85,69,25,150
Total 715,72,29,240 633,32,75,223
Note 18
OTHER INCOME
For the Year ended For the Year ended
March 31, 2013 March 31, 2012
Dividend Income from Current Investments 13,77,47,682 28,60,40,387
Interest Income:
— From Non-Current Investments 1,81,58,569 22,05,729
— From Others 11,27,528 32,77,119
Profit on Sale of Current Investments (net) 38,66,97,657 18,95,35,207
Utilisation / Reversal of Provision for Contingencies 2,95,52,097 5,94,01,358
Reversal of Diminution in the Value of Current Investments 6,69,47,902 —
Profit on Foreign Exchange Translation — 12,23,753
Miscellaneous Income 4,22,98,274 2,66,86,348
Total 68,25,29,709 56,83,69,901
311
HDFC Asset Management Company Limited
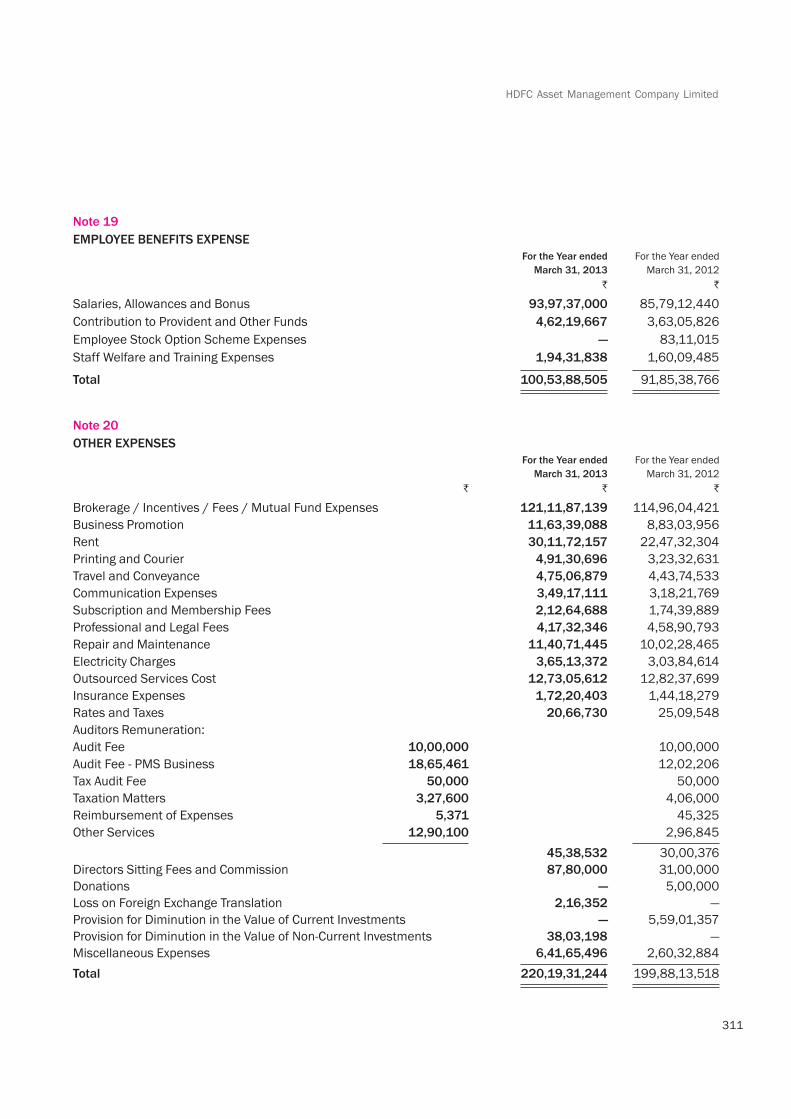
Note 19
EMPLOYEE BENEFITS EXPENSE
For the Year ended For the Year ended
March 31, 2013 March 31, 2012
Salaries, Allowances and Bonus 93,97,37,000 85,79,12,440
Contribution to Provident and Other Funds 4,62,19,667 3,63,05,826
Employee Stock Option Scheme Expenses — 83,11,015
Staff Welfare and Training Expenses 1,94,31,838 1,60,09,485
Total 100,53,88,505 91,85,38,766
Note 20
OTHER EXPENSES
For the Year ended For the Year ended
March 31, 2013 March 31, 2012
Brokerage / Incentives / Fees / Mutual Fund Expenses 121,11,87,139 114,96,04,421
Business Promotion 11,63,39,088 8,83,03,956
Rent 30,11,72,157 22,47,32,304
Printing and Courier 4,91,30,696 3,23,32,631
Travel and Conveyance 4,75,06,879 4,43,74,533
Communication Expenses 3,49,17,111 3,18,21,769
Subscription and Membership Fees 2,12,64,688 1,74,39,889
Professional and Legal Fees 4,17,32,346 4,58,90,793
Repair and Maintenance 11,40,71,445 10,02,28,465
Electricity Charges 3,65,13,372 3,03,84,614
Outsourced Services Cost 12,73,05,612 12,82,37,699
Insurance Expenses 1,72,20,403 1,44,18,279
Rates and Taxes 20,66,730 25,09,548
Auditors Remuneration:
Audit Fee 10,00,000 10,00,000
Audit Fee - PMS Business 18,65,461 12,02,206
Tax Audit Fee 50,000 50,000
Taxation Matters 3,27,600 4,06,000
Reimbursement of Expenses 5,371 45,325
Other Services 12,90,100 2,96,845
45,38,532 30,00,376
Directors Sitting Fees and Commission 87,80,000 31,00,000
Donations — 5,00,000
Loss on Foreign Exchange Translation 2,16,352 —
Provision for Diminution in the Value of Current Investments — 5,59,01,357
Provision for Diminution in the Value of Non-Current Investments 38,03,198 —
Miscellaneous Expenses 6,41,65,496 2,60,32,884
Total 220,19,31,244 199,88,13,518
Fourteenth Annual Report 2012-13
312
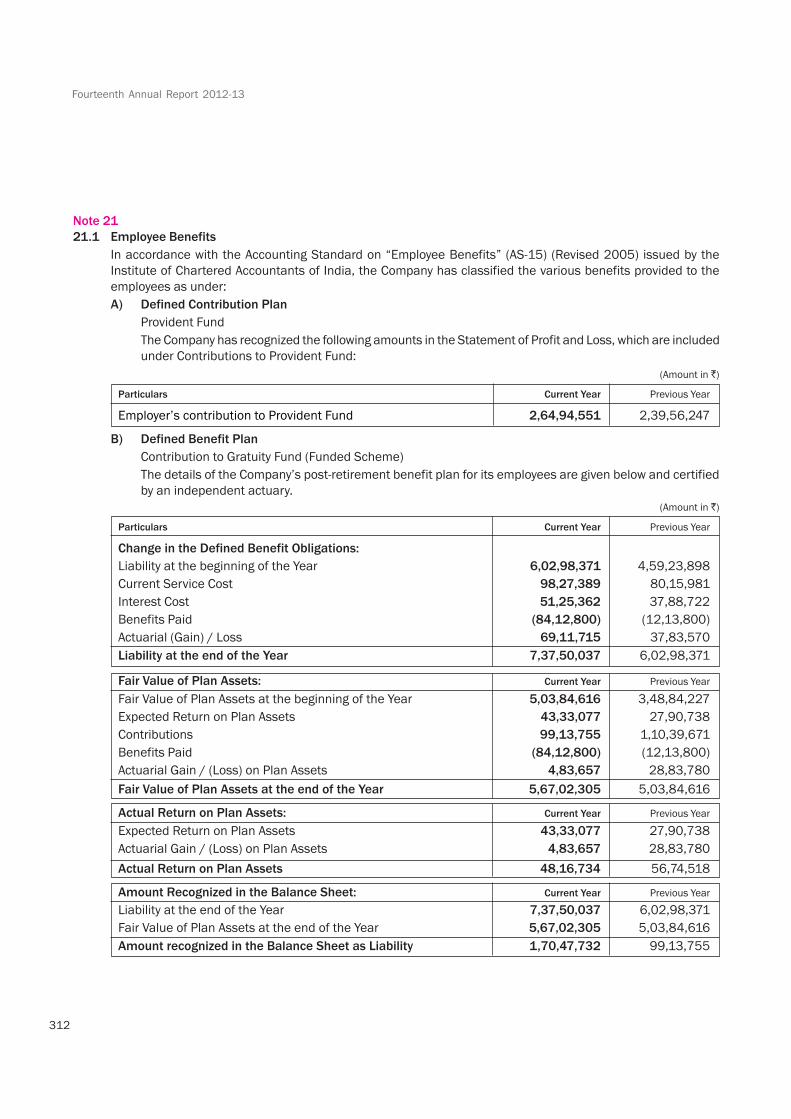
Note 21
21.1 Employee Benefits
In accordance with the Accounting Standard on “Employee Benefits” (AS-15) (Revised 2005) issued by the
Institute of Chartered Accountants of India, the Company has classified the various benefits provided to the
employees as under:
A) Defined Contribution Plan
Provident Fund
The Company has recognized the following amounts in the Statement of Profit and Loss, which are included
under Contributions to Provident Fund:
(Amount in )
Particulars Current Year Previous Year
Employer’s contribution to Provident Fund 2,64,94,551 2,39,56,247
B) Defined Benefit Plan
Contribution to Gratuity Fund (Funded Scheme)
The details of the Company’s post-retirement benefit plan for its employees are given below and certified
by an independent actuary.
(Amount in )
Particulars Current Year Previous Year
Change in the Defined Benefit Obligations:
Liability at the beginning of the Year 6,02,98,371 4,59,23,898
Current Service Cost 98,27,389 80,15,981
Interest Cost 51,25,362 37,88,722
Benefits Paid (84,12,800) (12,13,800)
Actuarial (Gain) / Loss 69,11,715 37,83,570
Liability at the end of the Year 7,37,50,037 6,02,98,371
Fair Value of Plan Assets: Current Year Previous Year
Fair Value of Plan Assets at the beginning of the Year 5,03,84,616 3,48,84,227
Expected Return on Plan Assets 43,33,077 27,90,738
Contributions 99,13,755 1,10,39,671
Benefits Paid (84,12,800) (12,13,800)
Actuarial Gain / (Loss) on Plan Assets 4,83,657 28,83,780
Fair Value of Plan Assets at the end of the Year 5,67,02,305 5,03,84,616
Actual Return on Plan Assets: Current Year Previous Year
Expected Return on Plan Assets 43,33,077 27,90,738
Actuarial Gain / (Loss) on Plan Assets 4,83,657 28,83,780
Actual Return on Plan Assets 48,16,734 56,74,518
Amount Recognized in the Balance Sheet: Current Year Previous Year
Liability at the end of the Year 7,37,50,037 6,02,98,371
Fair Value of Plan Assets at the end of the Year 5,67,02,305 5,03,84,616
Amount recognized in the Balance Sheet as Liability 1,70,47,732 99,13,755
313
HDFC Asset Management Company Limited
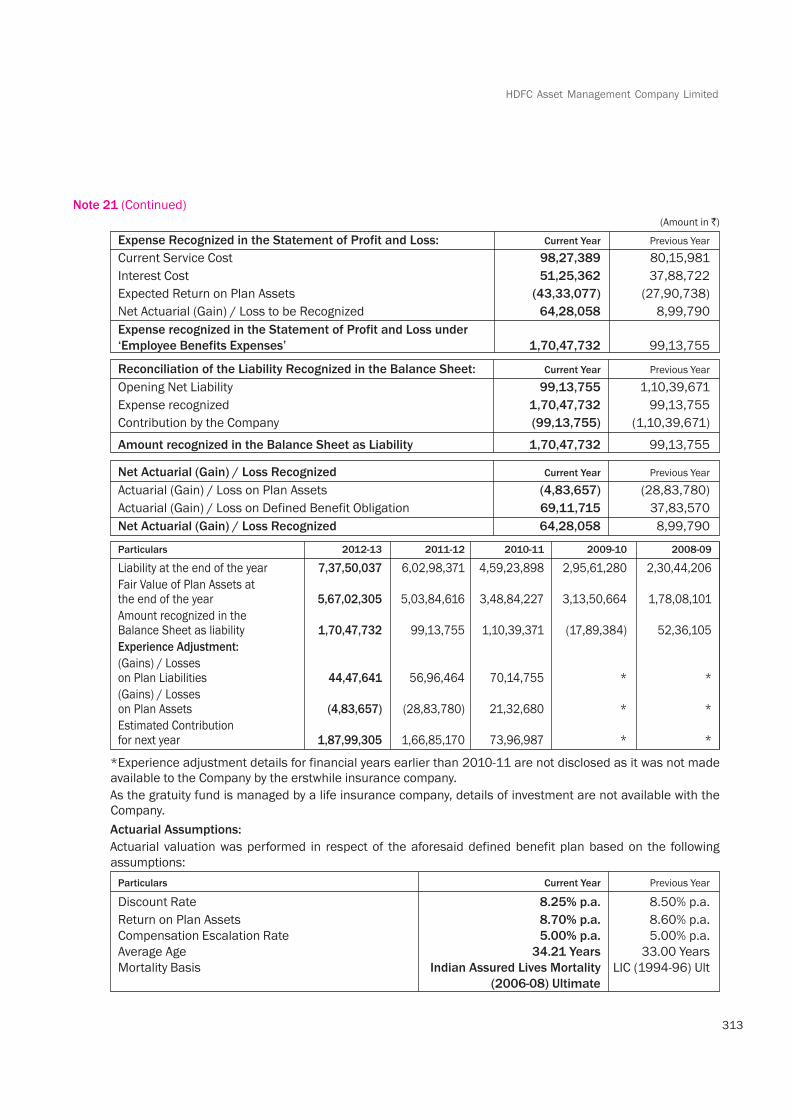
Expense Recognized in the Statement of Profit and Loss: Current Year Previous Year
Current Service Cost 98,27,389 80,15,981
Interest Cost 51,25,362 37,88,722
Expected Return on Plan Assets (43,33,077) (27,90,738)
Net Actuarial (Gain) / Loss to be Recognized 64,28,058 8,99,790
Expense recognized in the Statement of Profit and Loss under
‘Employee Benefits Expenses’ 1,70,47,732 99,13,755
Reconciliation of the Liability Recognized in the Balance Sheet: Current Year Previous Year
Opening Net Liability 99,13,755 1,10,39,671
Expense recognized 1,70,47,732 99,13,755
Contribution by the Company (99,13,755) (1,10,39,671)
Amount recognized in the Balance Sheet as Liability 1,70,47,732 99,13,755
Net Actuarial (Gain) / Loss Recognized Current Year Previous Year
Actuarial (Gain) / Loss on Plan Assets (4,83,657) (28,83,780)
Actuarial (Gain) / Loss on Defined Benefit Obligation 69,11,715 37,83,570
Net Actuarial (Gain) / Loss Recognized 64,28,058 8,99,790
Particulars 2012-13 2011-12 2010-11 2009-10 2008-09
Liability at the end of the year 7,37,50,037 6,02,98,371 4,59,23,898 2,95,61,280 2,30,44,206
Fair Value of Plan Assets atthe end of the year 5,67,02,305 5,03,84,616 3,48,84,227 3,13,50,664 1,78,08,101
Amount recognized in theBalance Sheet as liability 1,70,47,732 99,13,755 1,10,39,371 (17,89,384) 52,36,105
Experience Adjustment:
(Gains) / Losseson Plan Liabilities 44,47,641 56,96,464 70,14,755 * *
(Gains) / Losseson Plan Assets (4,83,657) (28,83,780) 21,32,680 * *
Estimated Contributionfor next year 1,87,99,305 1,66,85,170 73,96,987 * *
*Experience adjustment details for financial years earlier than 2010-11 are not disclosed as it was not madeavailable to the Company by the erstwhile insurance company.
As the gratuity fund is managed by a life insurance company, details of investment are not available with theCompany.
Actuarial Assumptions:
Actuarial valuation was performed in respect of the aforesaid defined benefit plan based on the following
assumptions:
Particulars Current Year Previous Year
Discount Rate 8.25% p.a. 8.50% p.a.
Return on Plan Assets 8.70% p.a. 8.60% p.a.
Compensation Escalation Rate 5.00% p.a. 5.00% p.a.
Average Age 34.21 Years 33.00 Years
Mortality Basis Indian Assured Lives Mortality LIC (1994-96) Ult
(2006-08) Ultimate
(Amount in )
Note 21 (Continued)
Fourteenth Annual Report 2012-13
314
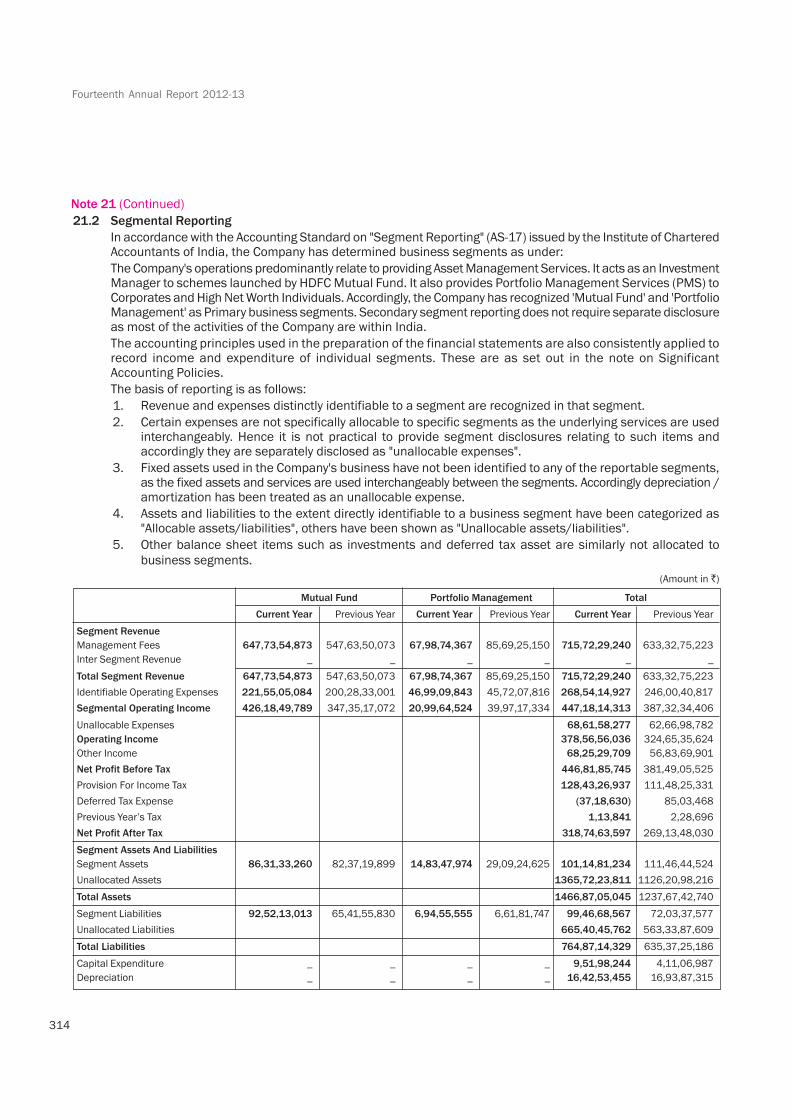
21.2 Segmental Reporting
In accordance with the Accounting Standard on "Segment Reporting" (AS-17) issued by the Institute of CharteredAccountants of India, the Company has determined business segments as under:
The Company's operations predominantly relate to providing Asset Management Services. It acts as an InvestmentManager to schemes launched by HDFC Mutual Fund. It also provides Portfolio Management Services (PMS) toCorporates and High Net Worth Individuals. Accordingly, the Company has recognized 'Mutual Fund' and 'PortfolioManagement' as Primary business segments. Secondary segment reporting does not require separate disclosureas most of the activities of the Company are within India.
The accounting principles used in the preparation of the financial statements are also consistently applied torecord income and expenditure of individual segments. These are as set out in the note on SignificantAccounting Policies.
The basis of reporting is as follows:
1. Revenue and expenses distinctly identifiable to a segment are recognized in that segment.
2. Certain expenses are not specifically allocable to specific segments as the underlying services are usedinterchangeably. Hence it is not practical to provide segment disclosures relating to such items andaccordingly they are separately disclosed as "unallocable expenses".
3. Fixed assets used in the Company's business have not been identified to any of the reportable segments,as the fixed assets and services are used interchangeably between the segments. Accordingly depreciation /amortization has been treated as an unallocable expense.
4. Assets and liabilities to the extent directly identifiable to a business segment have been categorized as"Allocable assets/liabilities", others have been shown as "Unallocable assets/liabilities".
5. Other balance sheet items such as investments and deferred tax asset are similarly not allocated tobusiness segments.
(Amount in )
Mutual Fund Portfolio Management Total
Current Year Previous Year Current Year Previous Year Current Year Previous Year
Segment Revenue
Management Fees 647,73,54,873 547,63,50,073 67,98,74,367 85,69,25,150 715,72,29,240 633,32,75,223
Inter Segment Revenue _ _ _ _ _ _
Total Segment Revenue 647,73,54,873 547,63,50,073 67,98,74,367 85,69,25,150 715,72,29,240 633,32,75,223
Identifiable Operating Expenses 221,55,05,084 200,28,33,001 46,99,09,843 45,72,07,816 268,54,14,927 246,00,40,817
Segmental Operating Income 426,18,49,789 347,35,17,072 20,99,64,524 39,97,17,334 447,18,14,313 387,32,34,406
Unallocable Expenses 68,61,58,277 62,66,98,782
Operating Income 378,56,56,036 324,65,35,624
Other Income 68,25,29,709 56,83,69,901
Net Profit Before Tax 446,81,85,745 381,49,05,525
Provision For Income Tax 128,43,26,937 111,48,25,331
Deferred Tax Expense (37,18,630) 85,03,468
Previous Year’s Tax 1,13,841 2,28,696
Net Profit After Tax 318,74,63,597 269,13,48,030
Segment Assets And Liabilities
Segment Assets 86,31,33,260 82,37,19,899 14,83,47,974 29,09,24,625 101,14,81,234 111,46,44,524
Unallocated Assets 1365,72,23,811 1126,20,98,216
Total Assets 1466,87,05,045 1237,67,42,740
Segment Liabilities 92,52,13,013 65,41,55,830 6,94,55,555 6,61,81,747 99,46,68,567 72,03,37,577
Unallocated Liabilities 665,40,45,762 563,33,87,609
Total Liabilities 764,87,14,329 635,37,25,186
Capital Expenditure _ _ _ _ 9,51,98,244 4,11,06,987
Depreciation _ _ _ _ 16,42,53,455 16,93,87,315
Note 21 (Continued)
315
HDFC Asset Management Company Limited
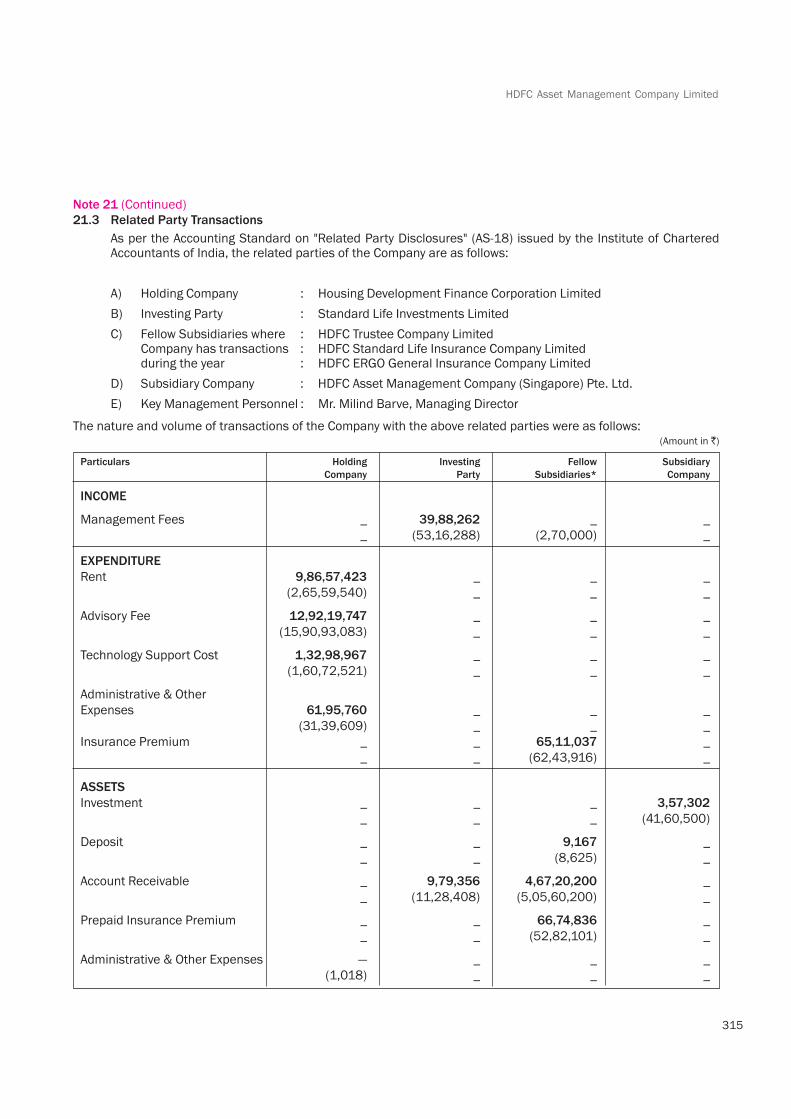
21.3 Related Party Transactions
As per the Accounting Standard on "Related Party Disclosures" (AS-18) issued by the Institute of CharteredAccountants of India, the related parties of the Company are as follows:
A) Holding Company : Housing Development Finance Corporation Limited
B) Investing Party : Standard Life Investments Limited
C) Fellow Subsidiaries where : HDFC Trustee Company LimitedCompany has transactions : HDFC Standard Life Insurance Company Limitedduring the year : HDFC ERGO General Insurance Company Limited
D) Subsidiary Company : HDFC Asset Management Company (Singapore) Pte. Ltd.
E) Key Management Personnel : Mr. Milind Barve, Managing Director
The nature and volume of transactions of the Company with the above related parties were as follows:(Amount in )
Particulars Holding Investing Fellow Subsidiary
Company Party Subsidiaries* Company
INCOME
Management Fees _ 39,88,262 _ _
_ (53,16,288) (2,70,000) _
EXPENDITURE
Rent 9,86,57,423 _ _ _
(2,65,59,540) _ _ _
Advisory Fee 12,92,19,747 _ _ _
(15,90,93,083) _ _ _
Technology Support Cost 1,32,98,967 _ _ _
(1,60,72,521) _ _ _
Administrative & Other
Expenses 61,95,760 _ _ _
(31,39,609) _ _ _
Insurance Premium _ _ 65,11,037 _
_ _ (62,43,916) _
ASSETS
Investment _ _ _ 3,57,302
_ _ _ (41,60,500)
Deposit _ _ 9,167 _
_ _ (8,625) _
Account Receivable _ 9,79,356 4,67,20,200 _
_ (11,28,408) (5,05,60,200) _
Prepaid Insurance Premium _ _ 66,74,836 _
_ _ (52,82,101) _
Administrative & Other Expenses — _ _ _
(1,018) _ _ _
Note 21 (Continued)
Fourteenth Annual Report 2012-13
316
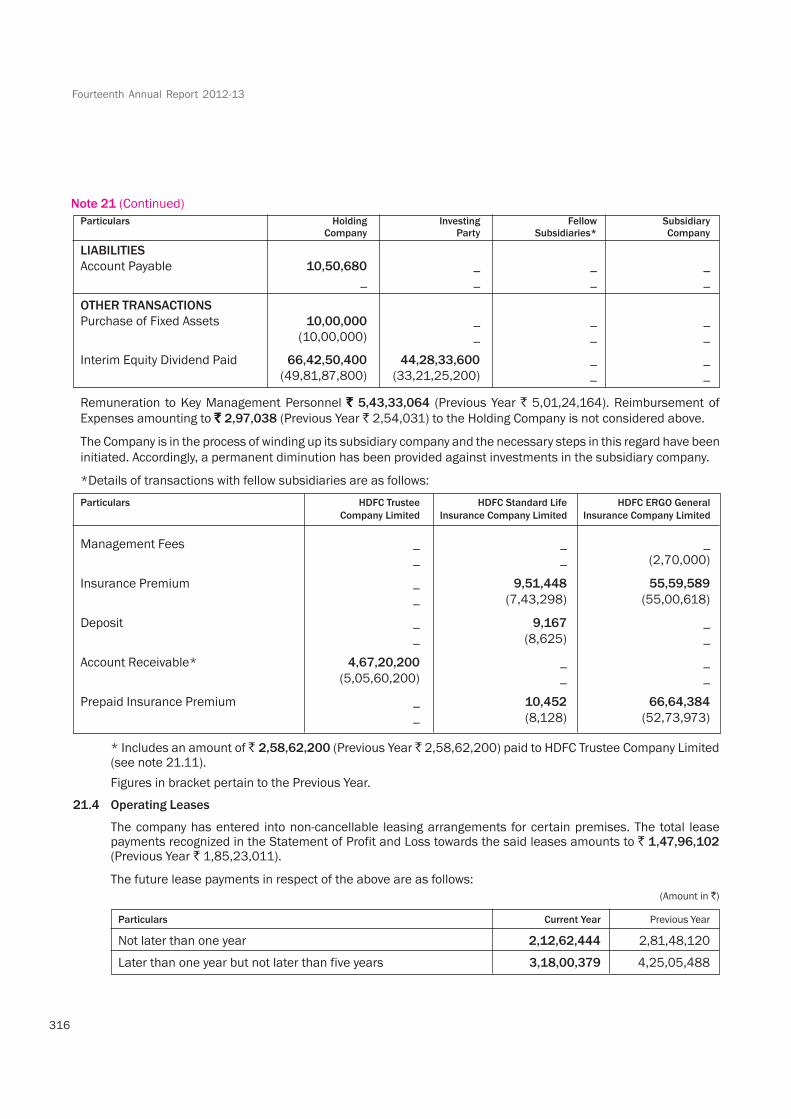
Particulars Holding Investing Fellow SubsidiaryCompany Party Subsidiaries* Company
LIABILITIES
Account Payable 10,50,680 _ _ _
_ _ _ _
OTHER TRANSACTIONS
Purchase of Fixed Assets 10,00,000 _ _ _
(10,00,000) _ _ _
Interim Equity Dividend Paid 66,42,50,400 44,28,33,600 _ _
(49,81,87,800) (33,21,25,200) _ _
Remuneration to Key Management Personnel 5,43,33,064 (Previous Year 5,01,24,164). Reimbursement of
Expenses amounting to 2,97,038 (Previous Year 2,54,031) to the Holding Company is not considered above.
The Company is in the process of winding up its subsidiary company and the necessary steps in this regard have been
initiated. Accordingly, a permanent diminution has been provided against investments in the subsidiary company.
*Details of transactions with fellow subsidiaries are as follows:
Particulars HDFC Trustee HDFC Standard Life HDFC ERGO General
Company Limited Insurance Company Limited Insurance Company Limited
Management Fees _ _ _
_ _ (2,70,000)
Insurance Premium _ 9,51,448 55,59,589
_ (7,43,298) (55,00,618)
Deposit _ 9,167 _
_ (8,625) _
Account Receivable* 4,67,20,200 _ _
(5,05,60,200) _ _
Prepaid Insurance Premium _ 10,452 66,64,384
_ (8,128) (52,73,973)
* Includes an amount of 2,58,62,200 (Previous Year 2,58,62,200) paid to HDFC Trustee Company Limited(see note 21.11).
Figures in bracket pertain to the Previous Year.
21.4 Operating Leases
The company has entered into non-cancellable leasing arrangements for certain premises. The total leasepayments recognized in the Statement of Profit and Loss towards the said leases amounts to 1,47,96,102(Previous Year 1,85,23,011).
The future lease payments in respect of the above are as follows:
(Amount in )
Particulars Current Year Previous Year
Not later than one year 2,12,62,444 2,81,48,120
Later than one year but not later than five years 3,18,00,379 4,25,05,488
Note 21 (Continued)
317
HDFC Asset Management Company Limited
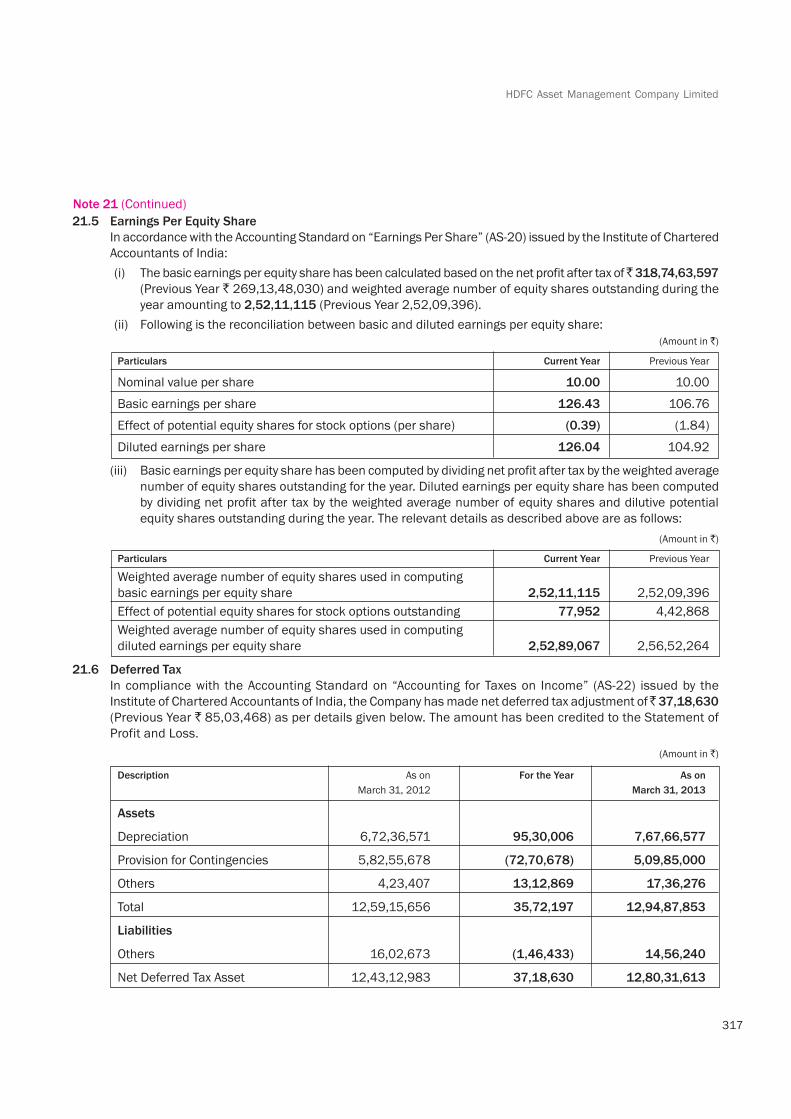
21.5 Earnings Per Equity Share
In accordance with the Accounting Standard on “Earnings Per Share” (AS-20) issued by the Institute of Chartered
Accountants of India:
(i) The basic earnings per equity share has been calculated based on the net profit after tax of 318,74,63,597
(Previous Year 269,13,48,030) and weighted average number of equity shares outstanding during the
year amounting to 2,52,11,115 (Previous Year 2,52,09,396).
(ii) Following is the reconciliation between basic and diluted earnings per equity share:
(Amount in )
Particulars Current Year Previous Year
Nominal value per share 10.00 10.00
Basic earnings per share 126.43 106.76
Effect of potential equity shares for stock options (per share) (0.39) (1.84)
Diluted earnings per share 126.04 104.92
(iii) Basic earnings per equity share has been computed by dividing net profit after tax by the weighted average
number of equity shares outstanding for the year. Diluted earnings per equity share has been computed
by dividing net profit after tax by the weighted average number of equity shares and dilutive potential
equity shares outstanding during the year. The relevant details as described above are as follows:
(Amount in )
Particulars Current Year Previous Year
Weighted average number of equity shares used in computing
basic earnings per equity share 2,52,11,115 2,52,09,396
Effect of potential equity shares for stock options outstanding 77,952 4,42,868
Weighted average number of equity shares used in computing
diluted earnings per equity share 2,52,89,067 2,56,52,264
21.6 Deferred Tax
In compliance with the Accounting Standard on “Accounting for Taxes on Income” (AS-22) issued by the
Institute of Chartered Accountants of India, the Company has made net deferred tax adjustment of 37,18,630
(Previous Year 85,03,468) as per details given below. The amount has been credited to the Statement of
Profit and Loss.
(Amount in )
Description As on For the Year As on
March 31, 2012 March 31, 2013
Assets
Depreciation 6,72,36,571 95,30,006 7,67,66,577
Provision for Contingencies 5,82,55,678 (72,70,678) 5,09,85,000
Others 4,23,407 13,12,869 17,36,276
Total 12,59,15,656 35,72,197 12,94,87,853
Liabilities
Others 16,02,673 (1,46,433) 14,56,240
Net Deferred Tax Asset 12,43,12,983 37,18,630 12,80,31,613
Note 21 (Continued)
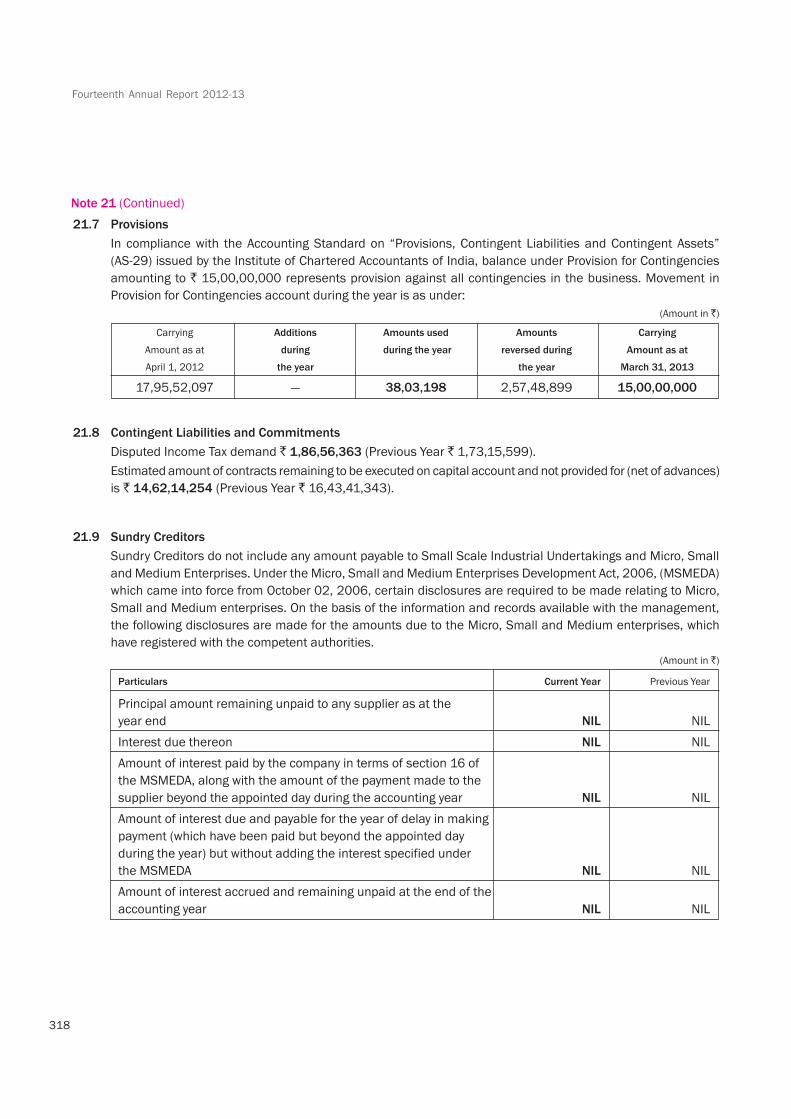
Fourteenth Annual Report 2012-13
318
21.7 Provisions
In compliance with the Accounting Standard on “Provisions, Contingent Liabilities and Contingent Assets”
(AS-29) issued by the Institute of Chartered Accountants of India, balance under Provision for Contingencies
amounting to 15,00,00,000 represents provision against all contingencies in the business. Movement in
Provision for Contingencies account during the year is as under:
(Amount in )
Carrying Additions Amounts used Amounts Carrying
Amount as at during during the year reversed during Amount as at
April 1, 2012 the year the year March 31, 2013
17,95,52,097 — 38,03,198 2,57,48,899 15,00,00,000
21.8 Contingent Liabilities and Commitments
Disputed Income Tax demand 1,86,56,363 (Previous Year 1,73,15,599).
Estimated amount of contracts remaining to be executed on capital account and not provided for (net of advances)
is 14,62,14,254 (Previous Year 16,43,41,343).
21.9 Sundry Creditors
Sundry Creditors do not include any amount payable to Small Scale Industrial Undertakings and Micro, Small
and Medium Enterprises. Under the Micro, Small and Medium Enterprises Development Act, 2006, (MSMEDA)
which came into force from October 02, 2006, certain disclosures are required to be made relating to Micro,
Small and Medium enterprises. On the basis of the information and records available with the management,
the following disclosures are made for the amounts due to the Micro, Small and Medium enterprises, which
have registered with the competent authorities.
(Amount in )
Particulars Current Year Previous Year
Principal amount remaining unpaid to any supplier as at the
year end NIL NIL
Interest due thereon NIL NIL
Amount of interest paid by the company in terms of section 16 of
the MSMEDA, along with the amount of the payment made to the
supplier beyond the appointed day during the accounting year NIL NIL
Amount of interest due and payable for the year of delay in making
payment (which have been paid but beyond the appointed day
during the year) but without adding the interest specified under
the MSMEDA NIL NIL
Amount of interest accrued and remaining unpaid at the end of the
accounting year NIL NIL
Note 21 (Continued)
319
HDFC Asset Management Company Limited
21.10 Accounting for Employee Share Based Payments
Under Employees Stock Option Scheme 2012 – Series I (ESOS 2012 – Series I) and Employees Stock Option
Scheme 2012 – Series II (ESOS 2012 – Series II), the Company had on 14!" September 2012 granted 8,70,000
stock options at an exercise price of 2,129/- per option under ESOS 2012 – Series I, representing 8,70,000
equity shares of 10/- each and 90,000 stock options at an exercise price of 2,129/- per option under ESOS
2012 – Series II, representing 90,000 equity shares of 10/- each to few employees and directors of the
Company. The fair value of the Company’s underlying equity shares was determined in accordance with the
pricing formula approved by the Remuneration Committee i.e. based on the Price Earning Multiple method and
the Assets Under Management (AUM) method.
In terms of ESOS 2012 – Series I and ESOS 2012 – Series II, the options vest over a period of 1-2 years and
3-4 years respectively from the date of grant. Accordingly, during the year NIL options under ESOS 2012 –
Series I (Previous Year NIL) vested and NIL options under ESOS 2012 – Series II (Previous Year NIL) vested. The
options can be exercised over a period of five years from the date of respective vesting.
Under Employees Stock Option Scheme 2009 – Series I (ESOS 2009 – Series I), the Company had on
25!" August 2009 granted 1,54,000 stock options at an exercise price of 527/- per option, representing
1,54,000 equity shares of 10/- each to few employees and directors of the Company. The fair value of the
Company’s underlying equity shares was determined in accordance with the pricing formula approved by the
Remuneration Committee of the Board of Directors of the Company (‘Remuneration Committee’) i.e. based on
the Profit Earning Capacity Valuation (PECV) method and the Assets Under Management (AUM) method.
In terms of ESOS 2009 – Series I, the options vest over a period of 1-2 years from the date of grant. Accordingly,
during the year NIL options (Previous Year 77,000) vested. The options can be exercised over a period of five
years from the date of respective vesting.
Under Employees Stock Option Scheme 2008 – Series I (ESOS 2008 – Series I) and Employees Stock Option
Scheme 2008 – Series II (ESOS 2008 – Series II), the Company had on 10!" March 2008 granted 5,24,000
stock options at an exercise price of 390/- per option under ESOS 2008 – Series I, representing 5,24,000
equity shares of 10/- each and 10,76,000 stock options at an exercise price of 750/- per option under
ESOS 2008 – Series II, representing 10,76,000 equity shares of 10/- each to few employees and directors of
the Company. The fair value of the Company’s underlying equity shares was determined in accordance with the
pricing formula approved by the Remuneration Committee i.e. based on the Profit Earning Capacity Valuation
(PECV) method and the Assets Under Management (AUM) method.
In terms of ESOS 2008 – Series I and ESOS 2008 – Series II, the options vest over a period of 3-4 years from the
date of grant. Accordingly, during the year NIL options under ESOS 2008 – Series I (Previous Year 2,46,000)
vested and NIL options under ESOS 2008 – Series II (Previous Year 4,84,750) vested [including NIL options
under ESOS 2008 – Series II (Previous Year 1,500) vested and lapsed]. The options can be exercised over a
period of five years from the date of respective vesting.
Note 21 (Continued)
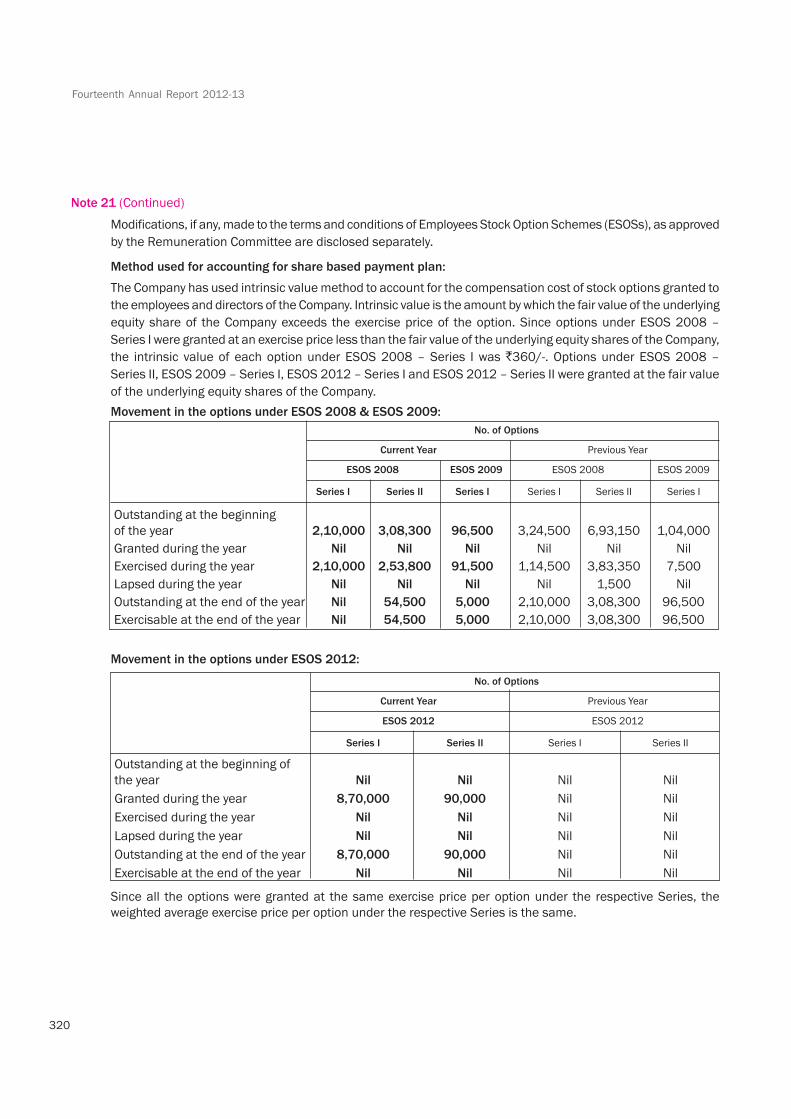
Fourteenth Annual Report 2012-13
320
Modifications, if any, made to the terms and conditions of Employees Stock Option Schemes (ESOSs), as approved
by the Remuneration Committee are disclosed separately.
Method used for accounting for share based payment plan:
The Company has used intrinsic value method to account for the compensation cost of stock options granted to
the employees and directors of the Company. Intrinsic value is the amount by which the fair value of the underlying
equity share of the Company exceeds the exercise price of the option. Since options under ESOS 2008 –
Series I were granted at an exercise price less than the fair value of the underlying equity shares of the Company,
the intrinsic value of each option under ESOS 2008 – Series I was 360/-. Options under ESOS 2008 –
Series II, ESOS 2009 – Series I, ESOS 2012 – Series I and ESOS 2012 – Series II were granted at the fair value
of the underlying equity shares of the Company.
Movement in the options under ESOS 2008 & ESOS 2009:
No. of Options
Current Year Previous Year
ESOS 2008 ESOS 2009 ESOS 2008 ESOS 2009
Series I Series II Series I Series I Series II Series I
Outstanding at the beginning
of the year 2,10,000 3,08,300 96,500 3,24,500 6,93,150 1,04,000
Granted during the year Nil Nil Nil Nil Nil Nil
Exercised during the year 2,10,000 2,53,800 91,500 1,14,500 3,83,350 7,500
Lapsed during the year Nil Nil Nil Nil 1,500 Nil
Outstanding at the end of the year Nil 54,500 5,000 2,10,000 3,08,300 96,500
Exercisable at the end of the year Nil 54,500 5,000 2,10,000 3,08,300 96,500
Movement in the options under ESOS 2012:
No. of Options
Current Year Previous Year
ESOS 2012 ESOS 2012
Series I Series II Series I Series II
Outstanding at the beginning of
the year Nil Nil Nil Nil
Granted during the year 8,70,000 90,000 Nil Nil
Exercised during the year Nil Nil Nil Nil
Lapsed during the year Nil Nil Nil Nil
Outstanding at the end of the year 8,70,000 90,000 Nil Nil
Exercisable at the end of the year Nil Nil Nil Nil
Since all the options were granted at the same exercise price per option under the respective Series, the
weighted average exercise price per option under the respective Series is the same.
Note 21 (Continued)
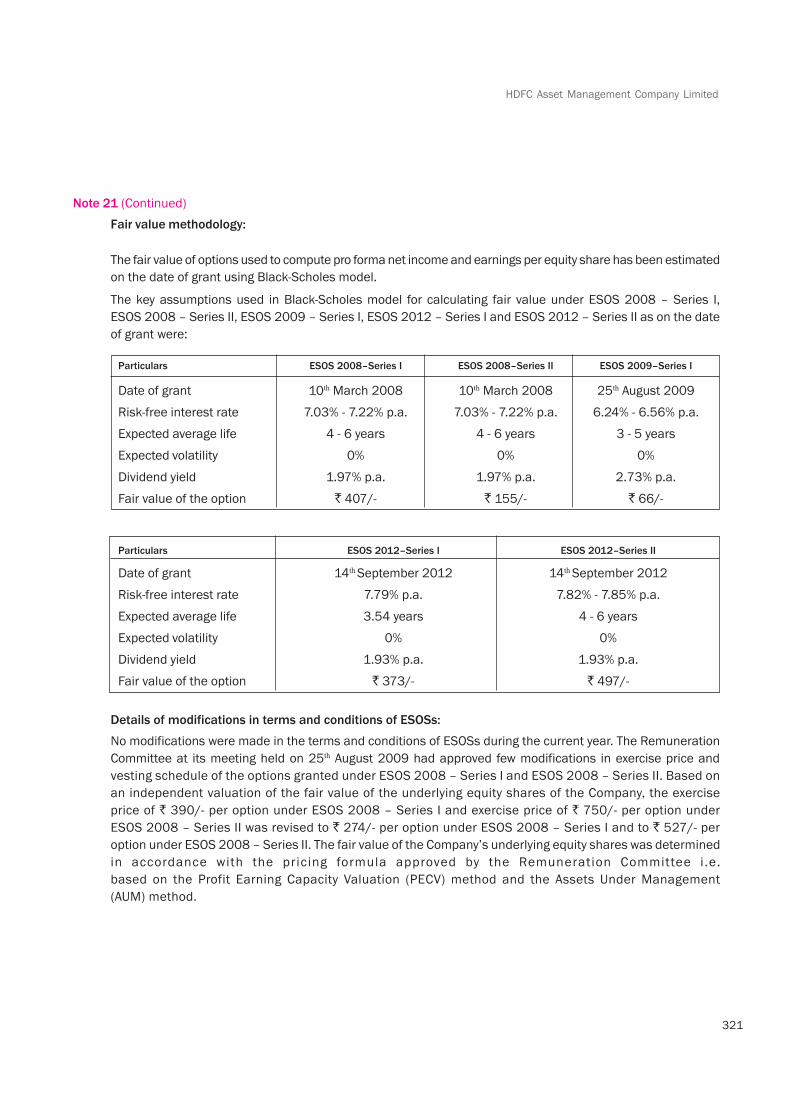
321
HDFC Asset Management Company Limited
Fair value methodology:
The fair value of options used to compute pro forma net income and earnings per equity share has been estimated
on the date of grant using Black-Scholes model.
The key assumptions used in Black-Scholes model for calculating fair value under ESOS 2008 – Series I,
ESOS 2008 – Series II, ESOS 2009 – Series I, ESOS 2012 – Series I and ESOS 2012 – Series II as on the date
of grant were:
Particulars ESOS 2008–Series I ESOS 2008–Series II ESOS 2009–Series I
Date of grant 10!" March 2008 10!" March 2008 25!" August 2009
Risk-free interest rate 7.03% - 7.22% p.a. 7.03% - 7.22% p.a. 6.24% - 6.56% p.a.
Expected average life 4 - 6 years 4 - 6 years 3 - 5 years
Expected volatility 0% 0% 0%
Dividend yield 1.97% p.a. 1.97% p.a. 2.73% p.a.
Fair value of the option 407/- 155/- 66/-
Particulars ESOS 2012–Series I ESOS 2012–Series II
Date of grant 14!"#September 2012 14!"#September 2012
Risk-free interest rate 7.79% p.a. 7.82% - 7.85% p.a.
Expected average life 3.54 years 4 - 6 years
Expected volatility 0% 0%
Dividend yield 1.93% p.a. 1.93% p.a.
Fair value of the option 373/- 497/-
Details of modifications in terms and conditions of ESOSs:
No modifications were made in the terms and conditions of ESOSs during the current year. The Remuneration
Committee at its meeting held on 25!" August 2009 had approved few modifications in exercise price and
vesting schedule of the options granted under ESOS 2008 – Series I and ESOS 2008 – Series II. Based on
an independent valuation of the fair value of the underlying equity shares of the Company, the exercise
price of 390/- per option under ESOS 2008 – Series I and exercise price of 750/- per option under
ESOS 2008 – Series II was revised to 274/- per option under ESOS 2008 – Series I and to 527/- per
option under ESOS 2008 – Series II. The fair value of the Company’s underlying equity shares was determined
in accordance with the pricing formula approved by the Remuneration Committee i .e.
based on the Profit Earning Capacity Valuation (PECV) method and the Assets Under Management
(AUM) method.
Note 21 (Continued)
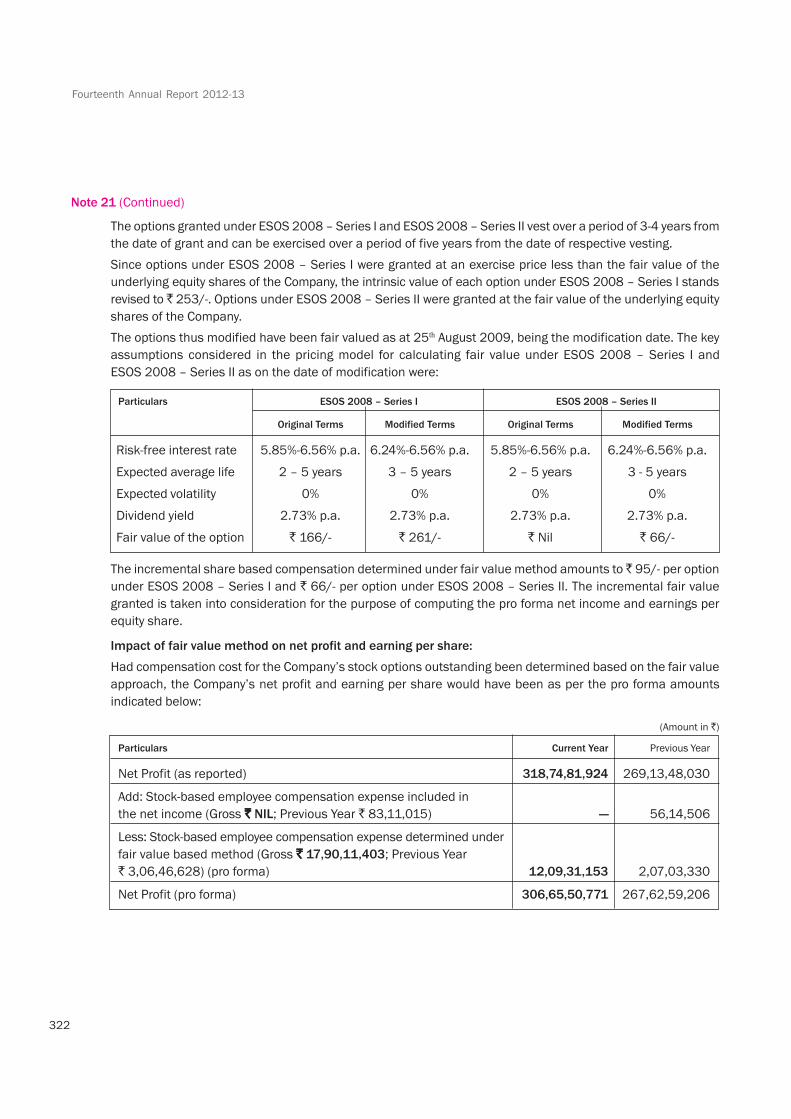
Fourteenth Annual Report 2012-13
322
The options granted under ESOS 2008 – Series I and ESOS 2008 – Series II vest over a period of 3-4 years from
the date of grant and can be exercised over a period of five years from the date of respective vesting.
Since options under ESOS 2008 – Series I were granted at an exercise price less than the fair value of the
underlying equity shares of the Company, the intrinsic value of each option under ESOS 2008 – Series I stands
revised to 253/-. Options under ESOS 2008 – Series II were granted at the fair value of the underlying equity
shares of the Company.
The options thus modified have been fair valued as at 25!" August 2009, being the modification date. The key
assumptions considered in the pricing model for calculating fair value under ESOS 2008 – Series I and
ESOS 2008 – Series II as on the date of modification were:
Particulars ESOS 2008 – Series I ESOS 2008 – Series II
Original Terms Modified Terms Original Terms Modified Terms
Risk-free interest rate 5.85%-6.56% p.a. 6.24%-6.56% p.a. 5.85%-6.56% p.a. 6.24%-6.56% p.a.
Expected average life 2 – 5 years 3 – 5 years 2 – 5 years 3 - 5 years
Expected volatility 0% 0% 0% 0%
Dividend yield 2.73% p.a. 2.73% p.a. 2.73% p.a. 2.73% p.a.
Fair value of the option 166/- 261/- Nil 66/-
The incremental share based compensation determined under fair value method amounts to 95/- per option
under ESOS 2008 – Series I and 66/- per option under ESOS 2008 – Series II. The incremental fair value
granted is taken into consideration for the purpose of computing the pro forma net income and earnings per
equity share.
Impact of fair value method on net profit and earning per share:
Had compensation cost for the Company’s stock options outstanding been determined based on the fair value
approach, the Company’s net profit and earning per share would have been as per the pro forma amounts
indicated below:
(Amount in )
Particulars Current Year Previous Year
Net Profit (as reported) 318,74,81,924 269,13,48,030
Add: Stock-based employee compensation expense included in
the net income (Gross NIL; Previous Year 83,11,015) — 56,14,506
Less: Stock-based employee compensation expense determined under
fair value based method (Gross 17,90,11,403; Previous Year
3,06,46,628) (pro forma) 12,09,31,153 2,07,03,330
Net Profit (pro forma) 306,65,50,771 267,62,59,206
Note 21 (Continued)

323
HDFC Asset Management Company Limited
(Amount in )
Particulars Current Year Previous Year
Basic earning per share (as reported) 126.43 106.76
Basic earning per share (pro forma) 121.63 106.16
Diluted earning per share (as reported) 126.04 104.92
Diluted earning per share (pro forma) 121.42 104.33
21.11 (a) In terms of interim order dated 17 June 2010 and letter dated 5 July 2011 received from Securities and
Exchange Board of India (SEBI), the Company has deposited 2,58,62,200 with HDFC Trustee Company
Limited representing estimated losses incurred by the schemes of HDFC Mutual Fund/clients of the
Company on suspected “front running” of the orders of HDFC Mutual Fund by a dealer of the Company.
This amount is held by HDFC Trustee Company Limited in an account segregated for this purpose, till
further orders by SEBI are received in this matter. The said amount has been included under Short-Term
Loans and Advances (note 15).
(b) The exact liability, if any, on the Company in connection with the aforesaid matter cannot be determined at
this stage.
21.12 Income in Foreign Currency
(Amount in )
Current Year Previous Year
Investment Advisory Fee 72,86,390 1,11,35,224
Interest Income 20,112 19,283
21.13 Payments in Foreign Currency
A) Expenditure
(Amount in )
Current Year Previous Year
i) Staff Training Expenses — 29,483
ii) Travelling Expenses 18,45,882 15,11,190
iii) Overseas Representative Office Expenses 1,36,14,414 1,25,46,192
iv) Professional Fees 507,505 49,61,772
v) Business Promotion 43,50,000 —
Note 21 (Continued)
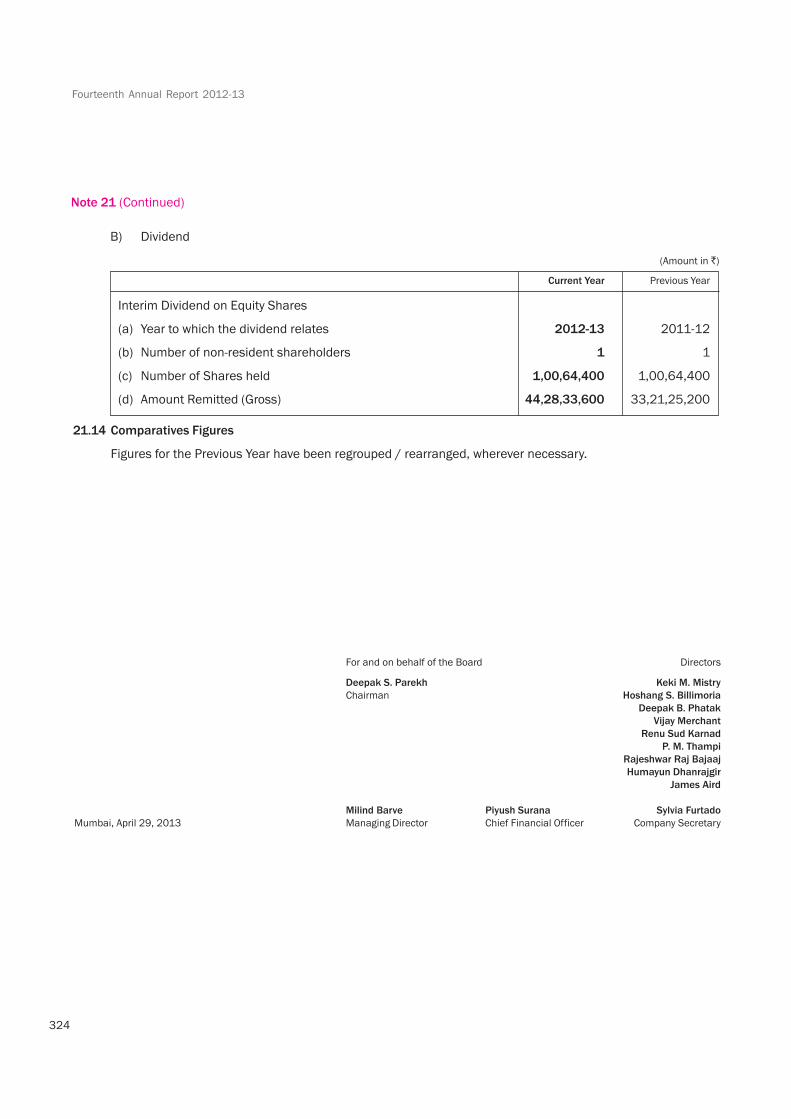
Fourteenth Annual Report 2012-13
324
For and on behalf of the Board Directors
Deepak S. Parekh Keki M. Mistry
Chairman Hoshang S. Billimoria
Deepak B. Phatak
Vijay Merchant
Renu Sud Karnad
P. M. Thampi
Rajeshwar Raj Bajaaj
Humayun Dhanrajgir
James Aird
Milind Barve Piyush Surana Sylvia Furtado
Mumbai, April 29, 2013 Managing Director Chief Financial Officer Company Secretary
B) Dividend
(Amount in )
Current Year Previous Year
Interim Dividend on Equity Shares
(a) Year to which the dividend relates 2012-13 2011-12
(b) Number of non-resident shareholders 1 1
(c) Number of Shares held 1,00,64,400 1,00,64,400
(d) Amount Remitted (Gross) 44,28,33,600 33,21,25,200
21.14 Comparatives Figures
Figures for the Previous Year have been regrouped / rearranged, wherever necessary.
Note 21 (Continued)