hb2 implementation policy guide -...
TRANSCRIPT

report
HB2 Implementation Policy Guide
prepared for
Commonwealth Transportation Board
date
March 18, 2015


HB2 Implementation Policy Guide
i
Table of Contents 1.0 Introduction ............................................................................................................ 9
1.1 HB2 Legislation Requirements .................................................................. 10
House Bill 1887 ............................................................................................. 10
1.2 Roles and Responsibilities .......................................................................... 11
Commonwealth Transportation Board ..................................................... 11
Office of the Secretary of Transportation ................................................. 11
1.3 Stakeholder Input ........................................................................................ 12
1.4 Annual HB2 Cycle ....................................................................................... 13
2.0 Project Eligibility and Application Process .................................................... 15 Types of Projects .......................................................................................... 16
Funding Sources .......................................................................................... 16
Entities Eligible to Submit Projects ........................................................... 17
2.2 Screening ....................................................................................................... 17
Screening Process & Administration ........................................................ 17
Corridors of Statewide Significance .......................................................... 18
Screening Criteria for COSS Projects .................................................... 18
Regional Networks ...................................................................................... 18
Screening Criteria for Regional Network Projects ............................. 18
Urban Development Areas ......................................................................... 19
Screening Criteria for UDA Projects..................................................... 19
2.3 Application Process ..................................................................................... 20
Project Preparation ...................................................................................... 20
Application Submittal ................................................................................. 21
3.0 Evaluation Measures ........................................................................................... 22 3.1 Safety Measures ........................................................................................... 23
3.2 Congestion Mitigation Measures............................................................... 24
3.3 Accessibility Measures ................................................................................ 25
3.4 Environmental Quality Measures ............................................................. 27
3.5 Economic Development Measures ............................................................ 28
3.6 Land Use Coordination Measures ............................................................. 29
4.0 Project Evaluation and Rating ........................................................................... 30 4.1 Calculation of HB2 Measures ..................................................................... 31

HB2 Implementation Policy Guide
ii
4.2 Internal/External Review ........................................................................... 31
4.3 Factor Weighting ......................................................................................... 31
Approach for Subdividing Construction Districts ............................. 32
4.4 Project Cost ................................................................................................... 36
4.5 Project Scoring .............................................................................................. 37
Key Terms ................................................................................................ 37
Methodology ............................................................................................ 37
5.0 CTB Prioritization & Programming ................................................................. 40 5.1 Funding Decisions for Draft SYIP ............................................................. 41
5.2 Public Comment Period .............................................................................. 41
5.3 Adoption of SYIP ......................................................................................... 42
5.4 Annual Process Issues ................................................................................. 42
Changes in Project Scope/Schedule/Cost ............................................... 42
Re-Rating Projects ........................................................................................ 43
5.5 Improvements to Process and Measures .................................................. 44
5.6 Outstanding Issues ...................................................................................... 44
6.0 Appendix A: Project Application ...................................................................... 45
7.0 Appendix B: Safety Measures ........................................................................... 49 Measures Approach .................................................................................... 49
S.1 Expected reduction in total fatalities and severe injuries ........... 49
S.2 Expected reduction in crash rate ................................................... 51
8.0 Appendix C: Congestion Mitigation Measures ............................................. 53 Measures Approach .................................................................................... 53
C.1 Person Throughput ......................................................................... 53
C.2 Person Hours of Delay ................................................................... 55
9.0 Appendix D: Accessibility Measures ............................................................... 57 Measures Approach .................................................................................... 57
A.1 Access to Work Destinations ......................................................... 57
A.2 Access to Non-Work Destinations ................................................ 58
A.3 Access to Multimodal Choices ...................................................... 59
10.0 Appendix E: Environmental Quality Measures ............................................. 62 Measures Approach .................................................................................... 62
E.1 Air Quality and Energy Effect ....................................................... 62

HB2 Implementation Policy Guide
iii
E.2 Non-auto Access to Work Destinations for Disadvantaged Populations .............................................................................................. 64
E.3 Non-Auto Access to Essential Destinations for Disadvantaged Populations .................................................................. 64
11.0 Appendix F: Economic Development Measures ............................................ 66 Measures Approach .................................................................................... 66
ED.1 Project Consistency with Economic Development Plans, Local Support and Development Activity ........................................... 66
ED.2 Intermodal access and efficiency ................................................. 68
12.0 Appendix G: Land Use Coordination Measures ............................................ 70 Measures Approach .................................................................................... 70
L.1 Future Land Use Policy Consistency ............................................. 70
L.2 Change in VMT per Capita ............................................................. 71
13.0 Appendix H: Factor Weighting ......................................................................... 73


HB2 Implementation Policy Guide
v
List of Tables Table 2.1 Eligibility to Submit Projects ................................................................... 17
Table 3.1 Safety Measures ......................................................................................... 23
Table 3.2 Congestion Mitigation Measures ............................................................ 24
Table 3.3 Accessibility Measures ............................................................................. 25
Table 3.4 Environmental Quality Measures ........................................................... 27
Table 3.5 Economic Development Measures ......................................................... 28
Table 3.6 Land Use Coordination Measures .......................................................... 29
Table 4.1 PDC-MPO Draft Typology ...................................................................... 35
Table 4.2 Preliminary Draft Weighting ................................................................... 36
Table 8.1 Congestion Mitigation Factor – Measures Summary ........................... 53
Table 9.1 Accessibility Factor – Measures Summary ............................................ 57
Table 9.2 Accessibility Scoring Approach .............................................................. 60
Table 10.1 Environmental Quality Factor – Measures Summary ......................... 62
Table 10.2 Qualifiers for Air Quality and Energy Effect ........................................ 63
Table 11.1 Economic Development Factor – Measures Summary ........................ 66
Table 11.2 Project Consistency, Local Support and Development Actions Checklist ..................................................................................................... 67
Table 11.3 Rating Description- Intermodal Access and Efficiency Criteria ......... 69
Table 12.1 Land Use Factor – Measures Summary ................................................. 70
Table 12.2 Land Use Policy Consistency/Transportation-Efficient Land Use Support ............................................................................................... 71
Table 13.1 Typology – Factor Indicator Ranking..................................................... 73


HB2 Implementation Policy Guide
vii
List of Figures Figure 1.1 Anticipated HB2 Yearly Cycle ................................................................. 14
Figure 2.1 HB2 Project Eligibility and Application Process .................................. 15
Figure 4.1 HB2 Project Evaluation Process .............................................................. 30
Figure 5.1 CTB Prioritization & Programming Process ......................................... 40
Figure 13.1 Construction Districts, PDCs, and MPOS .............................................. 75
Figure 13.2 Weighted Population Density Indicator (Quartiles) ............................ 76
Figure 13.3 Population Growth Indicator (Quartiles) .............................................. 77
Figure 13.4 VMT per Lane Mile Indicator (Quartiles) .............................................. 78


HB2 Implementation Policy Guide
9
1.0 Introduction Transportation needs will almost always be greater than the funds available to address them. The signing of House Bill 2313 in 2013 created a more sustainable revenue source supporting transportation funding. While passage of this bill enacted the CTB to add approximately $4 billion in funding to the six-year improvement program, there are still many transportation needs that cannot be addressed with available revenues. To find a way to better balance transportation needs and prioritize investments for both urban and rural communities throughout the Commonwealth, new legislation – House Bill 2 (HB2) – was signed into law in 2014. HB2 requires the Commonwealth Transportation Board (CTB) to develop and implement a quantifiable and transparent prioritization process for making funding decisions for capacity- enhancing projects within the six-year improvement program.
The Secretary of Transportation’s office is leading the effort to develop and implement the HB2 prioritization process. Development of the process includes robust outreach with stakeholders, including VDOT and DRPT staff across the Commonwealth, metropolitan planning organizations, planning district commissions, and counties, cities, and towns. These stakeholders are providing local experience and insights that are helping to inform the design of the measures within each factor area, the weighting of factors, scoring of projects, as well as the project application process. In addition the Secretary of Transportation’s office has and will continue to brief the public on the process and seek comment.
Specifically, MPOs and PDCs are working with their regional stakeholders to provide direction on setting “weights” for the six HB2 factor areas. For regions that experience high levels of congestion, such as Northern Virginia and Hampton Roads, the congestion factor is required by legislation to be weighted the highest. For the rest of Virginia, transportation priorities vary greatly, ranging from focusing attention on relieving congestion and improving accessibility in places like the Fredericksburg region to stimulating the economy and encouraging job growth in regions like Lynchburg, Danville, and Staunton.
The ultimate goal in the implementation of HB2 is to ensure the best use of limited transportation funds. Transparency and accountability are crucial aspects of delivering a process that project sponsors will support. HB2 projects will be evaluated based on a uniform set of measures that are applicable statewide, while recognizing that factors should be valued differently based on regional priorities.
The HB2 implementation process will start this August, with projects initially selected by the CTB for inclusion in the draft six-year implementation program by April 2016.

HB2 Implementation Policy Guide
10
The HB2 process does not cover all types of projects within the six-year implementation program. There are many other sources of funding including maintenance and rehabilitation, safety, operations, and other Federal and Commonwealth funding categories detailed later in this guidance document.
This guidance document provides policy direction to the CTB on process roles and responsibilities, project eligibility, the project application process, evaluation measure definitions, project cost and scoring, and prioritization and programming considerations and rules.
1.1 HB2 LEGISLATION REQUIREMENTS Virginia House Bill 2, signed by Governor Terry McAuliffe on April 6, 2014 and effective as of July 1, 2014, requires the development of a prioritization process and directs the CTB to develop and use a scoring process for project selection by July 2016. The prioritization process will evaluate projects in the following factor areas: congestion mitigation, economic development, accessibility, safety, environmental quality and land use coordination (in areas with over 200,000 population). Factor areas will be weighted differently by highway construction district. Candidate projects will be screened to determine if they qualify to be scored.
Projects will be scored based on an objective and fair analysis applied statewide. HB2 also requires project benefits be analyzed relative to project cost. The Secretary of Transportation and CTB will make the evaluation process and results available to the public, so that the public will know how each project is scored and the rationale behind the CTB’s project selections.
The CTB will review the prioritized project list once the evaluation has been released, and will use the scoring, along with other information submitted to the CTB about each project to inform their funding decisions for the Six-Year Improvement Program (SYIP). The CTB is not required to fund the highest scoring projects but is expected to provide the rationale if a project with a lower score is funded over projects with higher scores.
House Bill 1887
HB 1887, approved by the General Assembly in February 2015, specifies new funding allocation approaches and funding programs under consideration by the CTB applicable to the provisions of HB2. Two programs applicable to HB2 that are defined and assigned an allocation formula in HB1887 include the High-Priority Projects Program and Construction District Grant Program.
The High-Priority Projects Program (as defined in § 33.2-370) refers to projects of regional or statewide significance that address a transportation need identified for a corridor of statewide significance or a regional network in the Statewide Transportation Plan VTrans2040. The selection of projects and strategies for

HB2 Implementation Policy Guide
11
funding under this program are to be screened, evaluated, and selected according to the process established pursuant to HB2.
The construction district grant programs (as defined in § 33.2-371) refers to projects and strategies solicited from local governments that address a need in the Statewide Transportation Plan. The selection of projects and strategies for funding under this program are to be screened, evaluated, and selected according to the process established pursuant to HB2.
In this program, candidate projects and strategies from localities within a highway construction district are compared against projects and strategies within the same construction district. The bill specifies an allocation formula based on the old “40-30-30” used to distribute primary, secondary and urban construction funds. It ensures that each district will receive the same percentage share of funds under the Construction District Grant Program as they would have received under the old “40-30-30” formula.
1.2 ROLES AND RESPONSIBILITIES
Commonwealth Transportation Board
The CTB will oversee the HB2 project evaluation process. The CTB will review the scored project list once the evaluation has been released, and will use the scoring, along with other information submitted to the CTB about each project to inform their funding decisions regarding the allocation of annual discretionary funds and inclusion of projects for the Six-Year Improvement Program (SYIP). The CTB is not beholden to fund the highest-scoring projects; it may use professional judgment, among other considerations, to make final funding decisions. However, if the CTB makes funding decisions that are not consistent with the HB2 evaluation scoring, they will provide the rationale for their decision.
Office of the Secretary of Transportation
Under the Secretary of Transportation’s Office, the Virginia Department of Transportation (VDOT) and the Department of Rail and Public Transportation (DRPT) will manage the application process and will review the projects against the HB2 project screening criteria to determine which projects will be eligible to compete in the HB2 project prioritization review and evaluation. These agencies will also be responsible for conducting the calculations and determining the ratings of each project. The Secretary of Transportation’s Office will provide the final evaluation to the CTB and will make the final evaluation public.
Technical Evaluation Team
A technical evaluation team will be responsible for conducting the measure calculations and making the measure qualitative rating assessments for each
HB2 Implementation Policy Guide
12
factor area, for each of the submitted, screened projects in the HB2 process. This evaluation team will be comprised of technical staff from DRPT and VDOT. The staff appointed to the technical evaluation team will be subject matter experts that are experienced with the data, analytical tools and qualitative content reported for each measure.
Duties of the internal technical evaluation team may include:
Screening submitted projects according to the screening criteria
Evaluating project preparation
Calculating scores for submitted projects according to the methodologies set out in Appendices A-F
It has been proposed that there may be a second technical evaluation team to conduct the evaluations for a selection of, or all projects, to determine if the evaluation process provides consistent results despite a difference in team composition. This group would provide a review of the calculated measures for each group of projects.
External Peer Review
To ensure the quality assurance and control (QA/QC) of the HB2 evaluation process, an external peer review group, consisting of representatives from groups such as the Virginia Association of Counties (VACO) and Virginia Municipal League (VML), will be assembled to provide a review of the calculated measures for each group of projects. Once the technical evaluation team finalizes the scoring of all submitted projects, the external peer group will assemble to review projects, evaluations and scores to determine whether there are inconsistencies in scoring.
1.3 STAKEHOLDER INPUT To develop a fair and informed HB2 project prioritization process that would work across all modes and throughout the Commonwealth, extensive stakeholder input was considered in the development of the HB2 prioritization process. Numerous meetings were held to obtain the input of jurisdictions, agency stakeholders and the public body across the Commonwealth.
In the Fall of 2014, the Deputy Secretary met with each MPO across the state to discuss the HB2 prioritization process. The draft revised FY 2015-2020 Six-Year Improvement Program, including information on the HB2 prioritization process, was shared with the public during fall public meetings held in nine districts in September and October. A well-attended HB2 information session was also held at the Governor’s Transportation Conference in November, and a stakeholder survey was distributed at the session.

HB2 Implementation Policy Guide
13
On January 8, 2015, a stakeholder outreach session was broadcast to each of the District offices and gave stakeholders an opportunity to provide feedback on potential measures and process issues. Additional outreach meetings were conducted on-site in each of the district with agency stakeholders in February and March.
Stakeholder engagement will continue to be required for each annual implementation of the HB2 submission process and evaluation. Collaboration and involvement will continue throughout the entire process. At a minimum, the opportunities for stakeholder input will include the following:
Application phase: Stakeholders will have the opportunity to provide input as to what projects the jurisdictions/MPOs/PDCs should consider moving forward in the process through the development of an application for HB2 funds. Stakeholders will also work with the state to ensure that projects are defined in sufficient detail for HB2 evaluation.
Analysis and Scoring phase: By January of each HB2 cycle, it is anticipated that the evaluation of projects selected for HB2 prioritization evaluation will be complete, and a scoring will be made public. Stakeholders will have the opportunity to review assumptions and calculations.
Results and Programming phase: Every year, during the development of the SYIP, stakeholder input is received during public hearings held following the release of the draft SYIP. Stakeholders will have the opportunity to provide input upon the projects that were funded from the HB2 discretionary funds.
1.4 ANNUAL HB2 CYCLE Each year, HB2 is planned to operate according to the anticipated yearly cycle illustrated in Figure 1.1. Candidate projects will be solicited from eligible entities in August of each year, with project applications due October 1st. From there, VDOT and DRPT will screen, review, and evaluate the projects per the HB2 process from November through early January. By mid-January, the list of projects and scores will be released to the public and the CTB, allowing the CTB to consider the evaluated project lists for inclusion in the SYIP. In April, the draft SYIP will be released by the CTB, followed by public hearings to gather input. In June, the revised final SYIP will be released. The following July, the next year’s process begins again.
HB2 Implementation Policy Guide
14
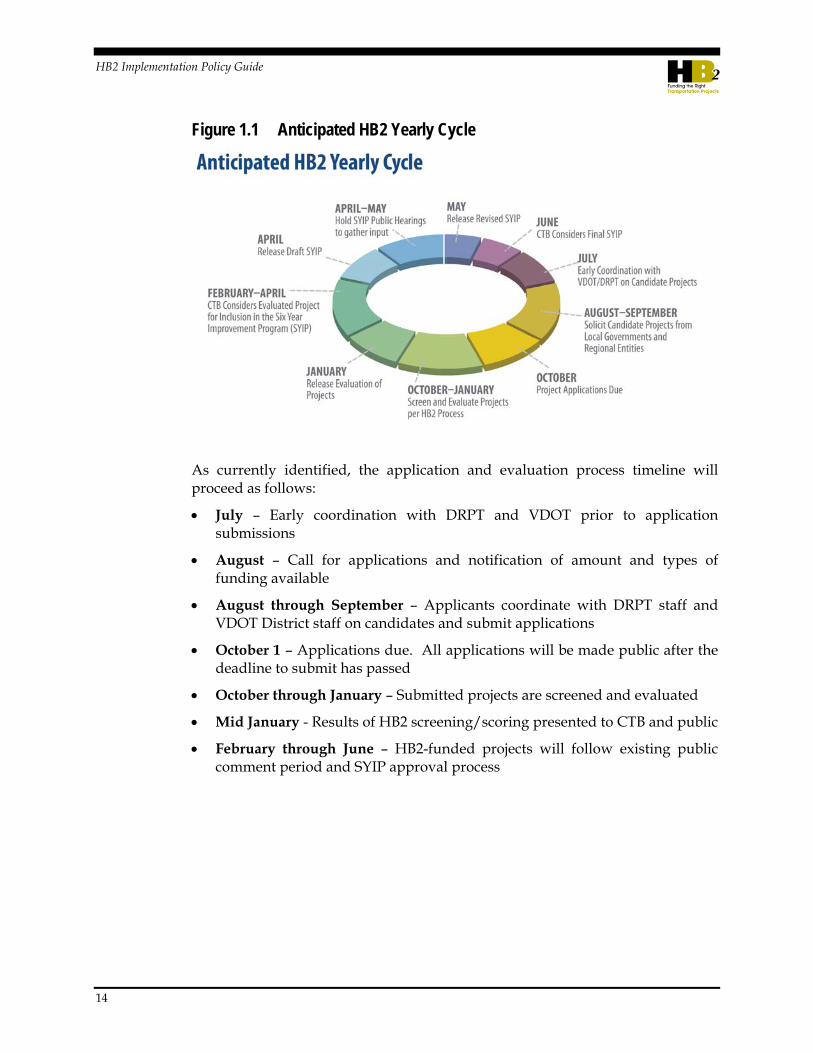
Figure 1.1 Anticipated HB2 Yearly Cycle
As currently identified, the application and evaluation process timeline will proceed as follows:
July – Early coordination with DRPT and VDOT prior to application submissions
August – Call for applications and notification of amount and types of funding available
August through September – Applicants coordinate with DRPT staff and VDOT District staff on candidates and submit applications
October 1 – Applications due. All applications will be made public after the deadline to submit has passed
October through January – Submitted projects are screened and evaluated
Mid January - Results of HB2 screening/scoring presented to CTB and public
February through June – HB2-funded projects will follow existing public comment period and SYIP approval process

HB2 Implementation Policy Guide
15
2.0 Project Eligibility and Application Process This section summarizes general project eligibility, screening, and application process considerations for HB2 implementation. Prospective projects must meet or exceed certain qualifications to be considered for evaluation in HB2, and sponsors must provide specific information for eligible projects. The types of projects and entities eligible for consideration are described in this section, along with funding sources not affected by HB2, and characterizations of entities eligible to submit projects. Figure 2.1 illustrates the process of screening projects for HB2 eligibility and preparation prior to the application process.
Figure 2.1 HB2 Project Eligibility and Application Process
Project Application
Does project address a need in VTrans for COSS, Regional
Network, or UDA?
Does submitting entity meet eligibility criteria?
Internal QA/AC Review -DRPT and Districts
-Project Scope -Project Schedule -Cost Estimate
Does project have a clear scope, reasonable cost
estimate, and schedule?
Is there sufficient information/data to
assess project benefits?
Prepare HB2 project submission application
Develop schedule to conduct analysis needed to evaluate
following cycle
Is there enough time to refine scope and estimates and/or compile needed information before application deadline?
District/CO work to collect data and/or
develop assumptions
Yes
No
No
No No Yes
Yes Yes
Yes
Provide information on alternative funding program or develop project for re-consideration
HB2 Implementation Policy Guide
16
Eligibility Requirements
A large part of the HB2 process is dependent on the types of projects submitted. When determining eligibility considerations for HB2, VDOT and DRPT took into account a number of considerations, including:
– Providing an opportunity for all levels of government to apply
– Regional priority setting prior to project submittal
– Project preparation to ensure that projects can be reliably evaluated
– Linking the type of project an applicant may submit to the scale of the capacity need being addressed
– Regional politics as an obstacle to some jurisdictions submitting projects
– Some projects may fall into more than one project type category
– Eligibility of CTB for submitting projects
Types of Projects
Within the HB2 process, there are several types of projects that will be considered for funding. Projects that meet a need identified in VTrans 2040 for a CoSS, Regional Network or UDA will be considered. In addition, highway, transit, rail, road, operational improvements and transportation demand management projects will be considered.
Legislation excludes certain project types from being considered for HB2 funding such as routine highway maintenance, rehabilitating aging pavements and bridges, and transit and rail asset maintenance. At the discretion of the CTB, projects that are fully funded and have completed environmental review in the SYIP may be exempt.
Funding Sources
Projects with a variety of funding sources are eligible to be considered in the HB2 process. Statewide discretionary federal funds are also required to go through the HB2 process. However, the following funding categories are excluded from the HB2 process: Congestion Mitigation and Air Quality, Highway Safety Improvement Program, Transportation Alternatives, Revenue Sharing program, and secondary/urban formula funds. Regional funds for Northern Virginia and Hampton Roads are also excluded from the HB2 process.
As described in section one, HB 1887 specifies new funding program that will be applicable to the provisions of HB2. HB 1887 allocates funds through two new HB 1887 funding programs; funds will no longer be distributed through the old mechanisms in the 2012 temporary formula. The high- priority projects program will address projects of regional or statewide significance and will compete statewide for funding. The construction district grant programs will set aside

HB2 Implementation Policy Guide
17
funds for each district and the CTB will fund projects selected from those submitted by localities within the district.
Entities Eligible to Submit Projects
While many entities across the Commonwealth have expressed a desire to be part of the HB2 process, a select group of entities are eligible to submit projects for consideration. Regional entities, including Metropolitan Planning Organizations (MPO) and Planning District Commissions (PDCs), are eligible to submit projects, along with counties, and those cities, and towns that maintain their own infrastructure. In October, the staff recommendation to the CTB concerning varying the Varying the types of projects an applicant can submit based on the type of capacity need being addressed
Stakeholder feedback to date has encouraged as much flexibility as possible with regard to who is eligible to submit projects. The revised staff recommendations are presented below in Table 2.1.
Table 2.1 Eligibility to Submit Projects
Project Type Regional Entity (MPOs, PDCs) Locality (Counties, Cities, Towns) Public Transit Agencies
Corridor of Statewide Significance
Yes Yes, with a resolution of support from relevant regional entity
Yes, with resolution of support from relevant regional entity
Regional Network
Yes Yes Yes, with resolution of support from relevant entity
Urban Development Area
No Yes No
2.2 SCREENING
Screening Process & Administration
All projects submitted for the HB2 process must pass through an initial screening process conducted by the technical evaluation team. The project screening is a critical component because it links the planning and programming processes to ensure the overarching transportation goals of the Board are advanced. If a project does not meet the capacity and operations needs of VTrans 2040, it cannot move forward in the HB2 process.
VTrans 2040 assesses the State’s transportation needs at three scales, with each scale receiving its own set of guiding principles and approach in the plan:
Corridor of Statewide Significance (COSS) - Interregional travel market
Regional Networks - Intraregional travel market

HB2 Implementation Policy Guide
18
Urban Development Areas (UDA) - Local activity center market
Reflecting the organization of VTrans 2040, HB2 requires that every capital project clearly state which of the three scales primarily best fit the proposed investment. This geographic designation will determine which screening criteria that VDOT and DRPT applies to the proposal. As VTrans 2040 is under development, the screening criteria are outlined here at a high level and are subject to change.
Corridors of Statewide Significance
Corridors of Statewide Significance (COSS) represent key multi-modal travel corridors that move people and goods within and through Virginia. These corridors are intended to primarily serve long-distance / interregional travel. Currently there are 12 corridors in Virginia designated as COSS. COSS conform to the following criteria:
The corridor has multiple modes or is an extended freight corridor
The corridor connects regions, states, and/or major activity centers
The corridor provides for a high volume of travel
The corridor provides a unique statewide function or addresses a statewide goal
Screening Criteria for COSS Projects
1. Project is submitted by an eligible applicant
2. Project conforms to the geographic definition of a COSS
3. The project meets a need identified by VTrans 2040 for the corridor. Corridor needs reflect the guiding principles of COSS investments:
a. Increasing safety and operations
b. Improving reliability
c. Complementing transportation mode choice
d. Reducing severe congestion and bottlenecks
Regional Networks
Regional Networks refer to multimodal networks that facilitate intra-regional travel within urbanized areas. They fill in a gap between Corridors of Statewide Significance that serve statewide objectives, and UDAs which serve local objectives. Regional Networks is a new concept introduced in VTrans 2040, and as such work is underway to define and identify networks.
Screening Criteria for Regional Network Projects
1. Project is be submitted by an eligible applicant

HB2 Implementation Policy Guide
19
2. The project meets a need identified by VTrans 2040 for Regional Networks. Regional Network investments should follow the following guiding principles:
a. Focus on economic competiveness and accessibility
b. Opportunity to link Region’s economic vision with future transportation needs
c. Extensive outreach to determine desired economic future of each region
Urban Development Areas
Urban Development Areas (UDAs) are a statewide designation for compact areas where jurisdictions intend to concentrate future population growth and development. UDAs have been designated through each jurisdiction’s comprehensive planning process; across the state there is a great deal of variation in the size and nature of UDAs. However, some jurisdictions have included locally designated growth areas in their comprehensive plans, places that are similar to UDAs in land use characteristics, but that are not classified as UDAs.
Pursuant with the Code of Virginia (Section 15.2-2223.1) a UDA is defined as:
Urban development areas are areas that may be appropriate for development at a density on the developable acreage of at least four single-family residences, six townhouses, or 12 apartments, condominium units, or cooperative units per acre, and an authorized floor area ratio of at least 0.4 per acre for commercial development, any proportional combination thereof, or any other combination or arrangement that is adopted by the locality and meets the intent of the code.
Urban development areas shall incorporate principles of traditional neighborhood design.
There are currently 77 certified UDAs in the state of Virginia but an additional 194 locally designated growth areas that are similar to UDAs in planned development context. The Virginia Office of Intermodal Planning and Investment (OIPI) has initiated a technical assistance program to support communities that would like to designate additional UDAs, including those jurisdictions with existing locally designated growth areas.
Screening Criteria for UDA Projects
1. Project is be submitted by an eligible applicant
2. Project serves at least one eligible UDA or “UDA-like” area
3. The project meets a need identified by VTrans 2040 for UDAs. UDA investments should follow the following guiding principles:
a. Context sensitive multi-modal transportation solution

HB2 Implementation Policy Guide
20
b. Last-mile access to jobs and non-work attractions
c. Safe bicycle and pedestrian circulation
d. Improve connections to local multi-modal networks and regional transportation options
2.3 APPLICATION PROCESS In order to support the success of the evaluation process, project sponsors will need to coordinate with VDOT and DRPT early in the process to share information on prospective applications. This coordination phase will allow project descriptions, cost estimates, and potential benefits to be developed and refined and will facilitate the application and evaluation process. HB2 project submittals are encouraged to include sufficient information to be evaluated and also need to meet specific application requirements.
Project Preparation
Projects submitted as candidates for HB2 funding will be held to a basic standard of development to assure that they can be evaluated reliably. VDOT and DRPT intend to provide support to project sponsors prior to application to help project sponsors understand and meet expectations. The CTB intends to request project sponsors submit a notice of intent (NOI) in advance of submitting a project application. The NOI will help the Technical Evaluation Team to coordinate early with the project sponsors to provide support.
HB2 project applications must include the following information:
Scope - The scope should define the limits of the project, its physical and operational characteristics, and physical and/or operational footprint.
Schedule - The schedule should clearly define the expected process for further project development including key milestones, work activities, related activities, approvals/approval timelines.
Cost - Cost estimate should be consistent with the level of development of the project, project type, and project scale and complexity. Projects incurring one-time and ongoing operations and non-construction costs (i.e. purchase of transit vehicles) should clearly identify those costs.
Certain projects that are based on conceptual planning-level recommendations, have not been formally scoped or have not completed the NEPA process may benefit from additional planning/pre-scoping level work prior to committing resources to fund the entire project. Planning and pre-scoping resources exist within VDOT, DRPT, localities, regional planning bodies, and some other entities (e.g., SPR, PL, Pre-scoping, FTA 5303, FTA 5304, etc.). Resources are unlikely to be sufficient to fund every potential request for assistance in project development related to the HB2 process.

HB2 Implementation Policy Guide
21
Application Submittal
VDOT and DRPT’s goal is to formulate an application process that remains simple and straightforward for applicants. Additionally, staff from both agencies are available for support throughout the process. It is important for applicants to reach a consensus with VDOT and DRPT staff on the scope, schedule and estimate for project submission. A key guiding theme is to develop a process that does not require applicants to invest significant time and resources for submission of project information, or require the use of consultants to develop an eligible application. VDOT and DRPT staff will be available to provide support and tools for applicants in compiling data and information needed for application.
Appendix A includes a draft application form and a list of types of information that will likely need to be provided. The application process is expected to be electronic and map-based (i.e., VA Roads) to facilitate automated population of key data elements. This has the potential to reduce the likelihood of data entry errors and improve consistency with VDOT’s current scoping form.

HB2 Implementation Policy Guide
22
3.0 Evaluation Measures This section summarizes the evaluation measures that will be used in the HB2 screening and evaluation process, and the methods in which those evaluation measures were selected for use. HB2 legislation requires that the measures be quantifiable and objective, that the analysis of a project’s benefits are relative to its cost (essentially a benefit-cost analysis using the HB2 factors), and that the CTB consider all modes of transportation. The law requires that the measures fall into six factor areas, listed below:
Safety
Congestion Mitigation
Accessibility
Environmental Quality
Economic Development
Land Use Coordination (for areas over 200,000 population)
Using the framework of the six factor areas, VDOT and DRPT used an extensive process to develop the measures for HB2. The team researched best practices from other state DOTs and MPOs, established a sub-work group focused on measures, held a peer exchange workshop, surveyed stakeholders, and held outreach meetings with key stakeholders. From these working groups and activities, the team gained a key understanding of some guiding principles that should be included in HB2, formalized into six guiding principles:
Analyze what matters to people and has a meaningful impact
Ensure fair and accurate benefit-cost analysis
Be both transparent and understandable
Work for both urban and rural areas
Work for all modes of transportation
Minimize overlap between measures

HB2 Implementation Policy Guide
23
3.1 SAFETY MEASURES The goal of the HB2 safety measures is to address multimodal transportation safety concerns through best practice crash reduction strategies. Listed below in Table 3.1 are brief summaries of the measures. Additional information about the measures, methodologies, and other details are available in Appendix B.
Table 3.1 Safety Measures
ID Measure
Name Measure
Description Methodology/Scoring Approach Factor Weight
S.1 Expected reduction in total fatalities and severe injuries
Number of annual fatal and severe injury crashes expected to be avoided due to project
Quantitative/detailed project description required
Use FHWA and Virginia specific Crash Modification Factor (CMF) data as a guide to set expected crash reduction
Sum the number of annual crashes (fatality and severe injury) where project is located, multiply by potential expected crash reduction to obtain potential crashes reduced.
Non-motorized: Use CMF data as applicable, considering differences by facility type
Transit: Demonstrate crash reduction associated with expected reduction in VMT
Units/Scoring: Total potential reduction in crashes
50%
S.2 Expected reduction in the rate of fatalities and severe injuries per 100 million vehicle miles traveled
Number of annual fatal and severe injury crashes per VMT expected to be avoided due to project
Quantitative / Detailed project definition required
Use FHWA and Virginia specific Crash Modification Factor (CMF) data as a guide to set expected crash reduction
Calculate annual crashes (fatal and severe injury) per annual VMT within project limits, multiply by potential expected crash reduction to obtain potential change in crash rate.
Non-motorized: Use CMF data as applicable, considering differences by facility type
Transit: N/A (100% of score for S1 only)
Units/Scoring: Potential reduction in crash rate
50%

HB2 Implementation Policy Guide
24
3.2 CONGESTION MITIGATION MEASURES The goal of the two HB2 congestion mitigation measures are to enhance the ability of the transportation system to move people and reduce travel delay across the State. Listed below in Table 3.2 are brief summaries of the measures. Additional information about the measures, methodologies, and other details are available in Appendix C.
Table 3.2 Congestion Mitigation Measures
ID Measure
Name Measure
Description Methodology/Scoring Approach Factor Weight
C.1 Person throughput
Change in peak period corridor total (multimodal) person throughput in the project corridor
Quantitative, corridor based analysis
Requires estimate of year 2025 no-build person throughput (based on trend line or regional travel model derived demand growth)
Requires information on total throughput capacity change and determines build corridor demand based on expected usage (through simple Highway Capacity Manual approach or use of regional travel demand models).
Alternatively, project sponsor may provide more refined travel demand information if available
Units/Scoring: Change in persons throughput (during peak period)
50%
C.2 Person hours of delay
Change in the amount of peak period person hours of delay in LOS E or worse conditions in the project corridor
Quantitative, corridor based analysis
Calculate the decrease in the number of peak period person hours of delay in the corridor based on level of service E for 2025. Build and no-build scenario (2025 planning year) peak hour demand and capacity (or saturated flow rate), are divided to determine a peak hour volume to capacity ratio for each future scenario. Demand is consistent with data used in Measure C.1.
Based on a standard statewide speed – flow equation tailored by facility/corridor type, peak hour volume to capacity ratios are converted to peak hour congested speeds.
Vehicle hours of delay are calculated using the congested speeds. Average auto occupancies are used to convert vehicle hours of delay into person hours of delay.
Total future person hours of delay in the build-scenario are subtracted from total future peak period person hours of delay in the no-build scenario to determine the total delay reduction.
Units/Scoring: Decrease in peak period person hours of delay
50%

HB2 Implementation Policy Guide
25
3.3 ACCESSIBILITY MEASURES The goal of the three HB2 accessibility measures is to enhance worker and overall household access to jobs and other opportunities, and provide multiple and connected modal choices. Listed below in Table 3.3 are brief summaries of the measures, and additional information is available in Appendix D.
Table 3.3 Accessibility Measures
ID Measure
Name Measure
Description Methodology/Scoring Approach Factor Weight
A.1 Access to work destinations
Change in cumulative jobs accessibility (within 45 minutes)
Virginia accessibility tool (GIS based / regional analysis)
Uses the population weighted cumulative accessibility (based on congested travel times) by block group (reported by mode)
Adjusts congested speeds or transit network based on project definition
Estimates project build population weighted cumulative accessibility associated with travel time change (using accessibility tool)
Year 2025 land use forecasts will be used. A local government may submit a market study that demonstrates the project will support land development that varies from adopted comprehensive plan and such assumptions will be used to determine projects benefits
Units/Scoring: assigns a project ranking based on the absolute change in cumulative jobs accessibility (total access to jobs within 45 minutes weighted by travel time)
60%
A.2 Access to non-work destinations
Change cumulative non-work accessibility (within 30 minutes).
Essential destinations include education (K-12, colleges, and universities), health care, and recreation (public parks)
Virginia accessibility tool (GIS based / project corridor specific analysis)
Uses the existing population weighted non-work accessibility index (based on congested travel times) by block group within the project corridor (reported by mode)
Adjusts project corridor link congested speeds or transit network based on project definition
Estimates project build population weighted cumulative accessibility associated with travel time change (using accessibility tool)
Year 2025 land use forecasts will be used A local government may submit a market study that demonstrates the project will support land development that varies from adopted comprehensive plan and such assumptions will be used to determine projects benefits
Units/Scoring: assigns a project ranking based on the absolute change in cumulative non-work accessibility (total access to essential destinations within 30 minutes weighted by travel time)
20%
A.3 Access to multimodal choices
Assessment of the project support for connections between modes,
Rating (checklist) approach based on project type and elements
Validate points based on project location/GIS analysis
Scale potential benefits by expected number of daily
20%

HB2 Implementation Policy Guide
26
and promotion of multiple transportation choices.
users within project corridor
Scoring: Assigns points based on the extent and quality of connections between modes, extent of accommodation for non-motorized users, travel demand management strategies, and provision of traveler information, scaled by daily users

HB2 Implementation Policy Guide
27
3.4 ENVIRONMENTAL QUALITY MEASURES The goals of the three HB2 environmental quality measures are to reduce criteria pollutant emissions and energy consumption, and provide accessibility benefits to disadvantaged populations. Listed below in Table 3.4 are brief summaries of the measures, and additional information is available in Appendix E.
Table 3.4 Environmental Quality Measures
ID Measure Name Measure
Description Methodology/Scoring Approach Factor Weight
E.1 Air quality and energy environmental effect
Potential of project to reduce criteria air pollutant and greenhouse gas emissions
Rating (checklist) approach based on project type and elements that promote alternative modes of travel and energy efficient technologies, or mitigate delay at freight bottlenecks.
Scale benefits by expected number of daily users within the region
Scoring: Points awarded for project elements that promote reducing fuel consumption and emissions, scaled by total users
50%
E.2 Access to jobs for disadvantaged populations
Change in cumulative job accessibility for disadvantaged populations and accessibility for non-auto modes (within 45 minutes)
Virginia accessibility tool (GIS based / regional analysis)
Considers locations of disadvantaged populations (Title 6 definition) cumulative accessibility (based on congested travel times) by block group (reported by mode).
Adjusts congested speeds or transit network based on project definition
Estimates project build disadvantaged population weighted cumulative accessibility associated with travel time change (accessibility tool)
Units/Scoring: assigns a project score based on the absolute change in cumulative jobs accessibility (total access to jobs within 45 minutes weighted by travel time)
40%
E.2 Access to essential destinations for disadvantaged populations
Change in cumulative non-work accessibility for disadvantaged populations accessibility for non-auto modes (within 30 minutes).
Essential destinations include education (K-12, colleges, and universities), health care, and recreation (public parks)
Virginia accessibility tool (GIS based / project corridor specific analysis)
Uses the existing disadvantaged population weighted non-work accessibility index (based on congested travel times) by block group (reported by mode)
Adjusts congested speeds or transit network based on project definition
Estimates project build disadvantaged population weighted non-work accessibility index associated with travel time change (accessibility tool)
Units/Scoring: assigns a project score based on the absolute change in cumulative non-work accessibility (total access to essential destinations within 30 minutes weighted by travel time)
10%

HB2 Implementation Policy Guide
28
3.5 ECONOMIC DEVELOPMENT MEASURES Particularly for rural areas across the Commonwealth, economic development is a critical issue. The goals of the two HB2 economic development measures are to support existing economies, enhance opportunities for economic development, and improve intermodal freight movement. Listed below in Table 3.5 are brief summaries of the measures. Additional information about the measures, methodologies, and other details are available in Appendix F.
Table 3.5 Economic Development Measures
ID Measure
Name Measure
Description Methodology/Scoring Approach Factor Weight
ED.1 Project support of planned economic development in project area
Assessment of progress made toward new economic development (new and expansion of existing) at the local level by the public and private sector.
Rating (checklist) approach based on regional and local economic development activity in the project corridor
Progress will be assessed through use of a checklist of desired actions or steps achieved toward specific commercial developments in the project corridor, such as local or regional comprehensive economic development strategies (CEDS) or partnerships, zoning or development planning actions, and utility provision
Scoring: Rate projects based on level of support, scaled by measure of development magnitude (scaling factor TBD based on data availability and ability to apply evenly statewide)
70%
ED.2 Intermodal access and reliability
Rate projects based on the extent to which the project is deemed to enhance access to critical intermodal locations, interregional freight movement, and/or freight intensive industries and supports increased reliability for freight movement in congested corridors.
Rating (checklist) approach based on project location, definition, and access to freight locations and networks
Level to which the project enhances access to existing or planned distribution centers, intermodal facilities, manufacturing industries or other freight intensive industries
Level to which the project supports or connects to a primary truck freight route (STAA designated National Network)
Level to which the project enhances access or reduces congestion at or adjacent to VA ports/ airports
Scoring: Points assigned based on level of support, scaled by the total freight tonnage or value within the project corridor
30%

HB2 Implementation Policy Guide
29
3.6 LAND USE COORDINATION MEASURES The coordination between transportation and land use is an issue within jurisdictions throughout Virginia. HB2 legislation mandates the use of this factor area for metropolitan areas in the State with a 2010 total population of 200,000 or more. Localities with a 2010 population beneath that threshold can voluntarily choose to use this factor area as well. The goals of the two HB2 land use coordination measures are to improve the consistency of the connection between local comprehensive plan goals for transportation efficient land use and transportation infrastructure design, multimodal accommodation, and system operations. Listed in Table 3.6 are brief summaries of the measures, and additional information is available in Appendix G.
Table 3.6 Land Use Coordination Measures
ID Measure
Name Measure Description Methodology/Scoring Approach Factor Weight
L.1 Future land use consistency
Degree to which project will support transportation efficient land use patterns and local policies
Rating (checklist) approach based on project location, definition, and relationship with transportation efficient land use goals and local land use plans/policies
Project sponsor provides information regarding project’s impact on local plans and policies
Scoring: Points assigned by project sponsor, no scaling
50%
L.2 Change in VMT per capita
Forecasted percentage change in the VMT per capita for the MPO region**
Quantitative measure at the MPO region level. VMT/capita serves as a surrogate measure of the extent to which the regional plan includes a comprehensive land use approach to better balance jobs and households and encourage mode shift or manage travel demand.
Change from existing conditions (MPO baseline) to 2040 CLRP Forecasts (or nearest year available based on most recent adopted CLRP) excluding through-trip VMT
Scoring: Percent change in VMT per capita
50%
* Note: Required for metropolitan areas with total population of 200,000 or more per 2010 census, however other regions can ask to use it.1 (Fredericksburg Area MPO, Hampton Roads TPO, Northern Virginia Transportation Authority, Richmond Regional TPO, Roanoke Valley TPO)
** Note: Future VMT forecasts should be associated with a federally approved fiscally constrained regional long-range transportation plan.
1 Refer to 33.1-23.5:5.D.6 “For metropolitan planning areas with a population over 200,000, the prioritization
process shall also include a factor based on the quantifiable and achievable goals pursuant to subsection B of 33.1-23.03 of the Code of Virginia.” Subsection B of 33.1-23.03 states the following: “The Statewide Transportation Plan shall establish goals, objectives, and priorities that cover at least a 20-year planning horizon, in accordance with federal transportation planning requirements. The plan shall include quantifiable measures and achievable goals relating to, but not limited to, congestion reduction and safety, transit and high-occupancy vehicle facility use, job-to-housing ratios, job and housing access to transit and pedestrian facilities, air quality, movement of freight by rail, and per capita vehicle miles traveled.”

HB2 Implementation Policy Guide
30
4.0 Project Evaluation and Rating This section summarizes how projects will be evaluated and rated once submitted to the HB2 process. VDOT and DRPT’s guiding principles for the HB2 process aim to keeping the entire process transparent and accountable, allowing for the comments of the public and the CTB to be heard. The flowchart illustrated in Figure 4.1 below illustrates the general process of HB2 project evaluation and rating, and will be explored in more details within this section.
Figure 4.1 HB2 Project Evaluation Process
Screened HB2 Project
Calculation of HB2 Measures
Measure Values and
Weighting Factor Weighting
Advance list of scored projects to CTB for
Prioritization
Project Scoring
Project Cost
Internal/External Review for QA/QC

HB2 Implementation Policy Guide
31
4.1 CALCULATION OF HB2 MEASURES The technical evaluation team will collect and calculate measures listed in Section 3, spanning the six factor areas. This will be an open process and will involve State collaboration and review from an external team of stakeholders to ensure transparency. Methodologies and specific scoring methods are listed in Appendix A-F for each of the factor areas.
4.2 INTERNAL/EXTERNAL REVIEW A key step in the rating process will be to perform QA/QC review of the calculated measures for each project. This review will be conducted by an internal technical group as well as by an external policy group. The internal technical evaluation team, consisting of VDOT and DRPT staff, will be responsible for developing and reviewing the scoring and evaluations of submitted projects in the HB2 process. Duties of this group may include:
Screening submitted projects according to the screening criteria
Evaluating project preparation
Calculating scores for submitted projects according to the methodologies set out in Appendices B-G
Once the technical evaluation team finalizes the scoring of all submitted projects, the results will be reviewed by a policy review group consisting of stakeholder representatives such as VACO and VML staff. Scoring inconsistencies will be identified. Finally, once a reviewed set of scores is finalized, projects will move on to factor weighting process, by region, listed below.
4.3 FACTOR WEIGHTING HB2 legislation (includes the following language related to factor weighting:
B.1. The prioritization process shall be based on an objective and quantifiable analysis that considers, at a minimum, the following factors relative to the cost of the project or strategy: congestion mitigation, economic development, accessibility, safety, and environmental quality.
B.3. The Commonwealth Transportation Board shall weight the factors used in subdivision 1 for each of the state's highway construction districts (9). The Commonwealth Transportation Board may assign different weights to the factors, within each highway construction district, based on the unique needs and qualities of each highway construction district.
B.4. The Commonwealth Transportation Board shall solicit input from localities, metropolitan planning organizations, transit authorities, transportation authorities, and other stakeholders in its development of the prioritization process pursuant to this section. Further, the Board shall explicitly consider input provided by an applicable

HB2 Implementation Policy Guide
32
metropolitan planning organization or the Northern Virginia Transportation Authority when developing the weighting of factors pursuant to subdivision 3 for a metropolitan planning area with a population over 200,000 individuals.
6. That, for Northern Virginia and Hampton Roads highway construction districts, the Commonwealth Transportation Board, pursuant to subdivision B.3 of § 33.1-23.5:5 as created by this act, shall ensure that congestion mitigation, consistent with § 33.1-13.03:1 of the Code of Virginia, is weighted highest among the factors in the prioritization process. For metropolitan planning areas with a population over 200,000, the prioritization process shall also include a factor based on the quantifiable and achievable goals pursuant to subsection B of § 33.1-23.03 of the Code of Virginia.
The language within subdivision B.3 related to weighting factors by construction districts and within districts recognizes the diversity within each of the nine construction districts as it relates to transportation needs and investment priorities. The development of the weighting scheme must also consider two special cases (noted in subdivision 6):
1. In the Northern Virginia and Hampton Roads construction districts, congestion mitigation should be weighted the highest of the six factors (greater than 16.7% if within an MPO boundary) or the five factors (greater than 20.0% if outside an MPO boundary, this case only applies in the Hampton Roads district).
2. Metropolitan planning areas (as defined by the U.S. Census Bureau) with a population over 200,000 will include a factor based on the goals, objectives, and priorities of the Statewide Transportation Plan (VTrans), referred to as the land use coordination factor.
Approach for Subdividing Construction Districts
Within the Commonwealth, there are 21 PDCs and 15 MPOs. The PDC and MPO boundaries will be compared with construction district boundaries to inform subdividing construction districts for factor weighting. As a starting point for developing potential factor weights, an individual weighting approach for each of the 36 MPO and PDC areas was deemed overly complex (refer to Appendix H for a map and listing of these areas). The alternative approach organizes weighting through an analysis of transportation, land use and demographic indicators of each of the 36 areas.
Three initial key indicators were reviewed to support development of a draft typology scheme:
Population Weighted Density – Regional average population density by census tract
Projected Population Growth – Total regional growth 2010 to 2040 based on Weldon Cooper Center forecasts.
Average Daily VMT per Lane Mile – Measure of transportation system supply and demand.
HB2 Implementation Policy Guide
33
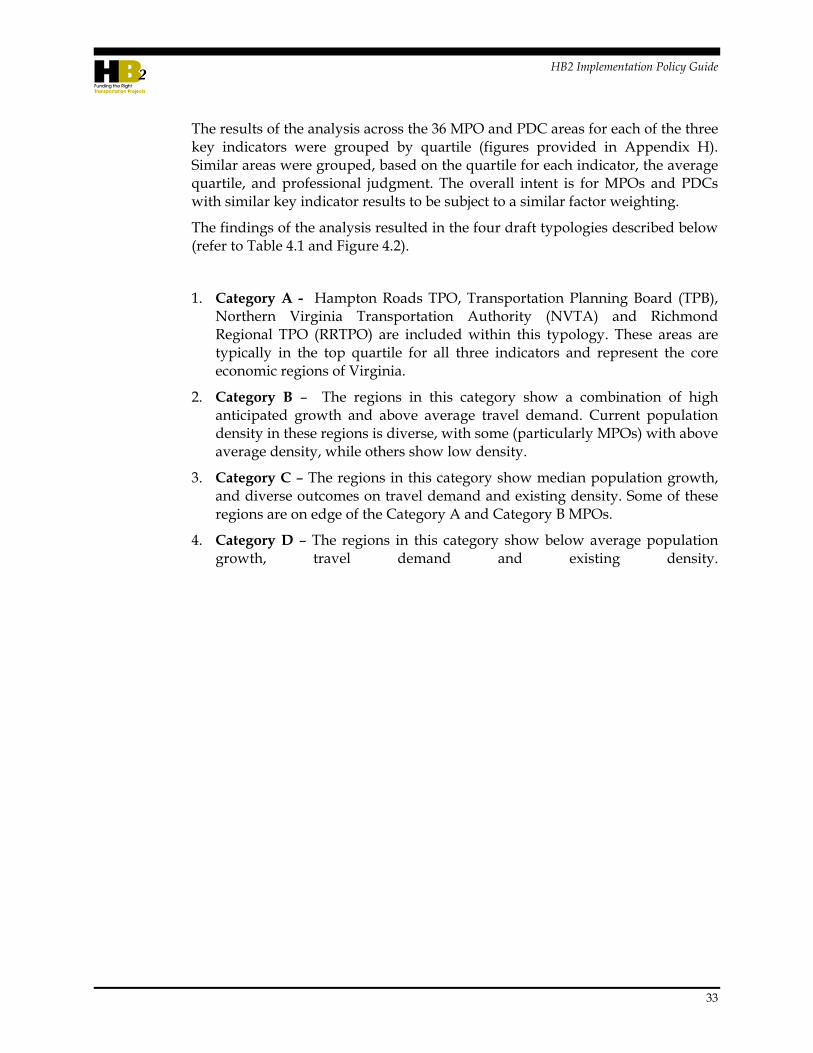
The results of the analysis across the 36 MPO and PDC areas for each of the three key indicators were grouped by quartile (figures provided in Appendix H). Similar areas were grouped, based on the quartile for each indicator, the average quartile, and professional judgment. The overall intent is for MPOs and PDCs with similar key indicator results to be subject to a similar factor weighting.
The findings of the analysis resulted in the four draft typologies described below (refer to Table 4.1 and Figure 4.2).
1. Category A - Hampton Roads TPO, Transportation Planning Board (TPB), Northern Virginia Transportation Authority (NVTA) and Richmond Regional TPO (RRTPO) are included within this typology. These areas are typically in the top quartile for all three indicators and represent the core economic regions of Virginia.
2. Category B – The regions in this category show a combination of high anticipated growth and above average travel demand. Current population density in these regions is diverse, with some (particularly MPOs) with above average density, while others show low density.
3. Category C – The regions in this category show median population growth, and diverse outcomes on travel demand and existing density. Some of these regions are on edge of the Category A and Category B MPOs.
4. Category D – The regions in this category show below average population growth, travel demand and existing density.

HB2 Implementation Policy Guide
34
Figure 4.2 PDC – MPO Draft Typology

HB2 Implementation Policy Guide
35
Table 4.1 PDC-MPO Draft Typology
Name Population
Density Population
Growth VMT/Lane
Mile Typology
Transportation Planning Board (TPB) 4 4 4 Category A
Northern Virginia Regional Commission 4 4 4 Category A
Hampton Roads TPO (HRTPO) 3 3 4 Category A
Richmond Regional TPO (RRTPO) 3 3 4 Category A
WinFred MPO 4 4 4 Category B
Fredericksburg Area MPO (FAMPO) 3 4 4 Category B
Northern Shenandoah Valley RC* 3 4 4 Category B
George Washington RC* 2 4 4 Category B
Richmond Regional PDC* 2 4 4 Category B
Charlottesville-Albemarle MPO 4 2 3 Category B
Harrisonburg-Rockingham MPO 4 3 2 Category B
New River Valley MPO 4 2 3 Category B
Rappahannock-Rapidan RC 2 4 3 Category B
Thomas Jefferson PDC* 2 4 3 Category B
New River Valley PDC* 3 2 3 Category B
Roanoke Valley TPO (RVTPO) 4 1 3 Category B
Staunton-Augusta-Waynesboro MPO 3 3 2 Category B
Tri-Cities MPO 4 2 2 Category B
Roanoke Valley-Alleghany PDC* 3 2 3 Category B
Bristol MPO 4 2 2 Category C
Central Virginia MPO 4 1 2 Category C
Crater PDC* 1 4 2 Category C
Region 2000 LGC* 2 3 2 Category C
Accomack-Northampton PDC 1 3 2 Category C
Central Shenandoah PDC* 1 3 2 Category C
Danville MPO 3 2 1 Category C
Kingsport MPO 3 1 2 Category C
Middle Peninsula PDC 1 3 1 Category D
Mount Rogers PDC* 2 1 2 Category D
Commonwealth RC 1 2 1 Category D
Lenowisco PDC 2 1 1 Category D
Northern Neck PDC 1 2 1 Category D
West Piedmont PDC* 2 1 1 Category D
Cumberland Plateau PDC 1 1 1 Category D
Hampton Roads PDC* 1 1 1 Category D
Southside PDC 1 1 1 Category D
* Note: PDC defined as the remainder of the region outside the MPO boundary. In many cases, these regions include partial counties (eg. Goochland County is partially within RRTPO and the Richmond Regional PDC). If a project is within the MPO boundary in a partial county, the project should use the weighting associated with the MPO.

HB2 Implementation Policy Guide
36
A preliminary draft weighting scheme is presented in Table 4.2. Final percentages will be determined, in part, based on feedback from the MPOs and PDCs. Where MPO boundaries cover a partial county, the assumption is that any project partially or wholly within the MPO boundary will use the assigned MPO weighting approach.
Table 4.2 Preliminary Draft Weighting
Factor Congestion Mitigation
Economic Development Accessibility Safety
Environmental Quality Land Use
Category A 35%** 10% 25% 10% 10% 10%*
Category B 15% 20% 25% 15% 10% 15%*
Category C 10% 20% 30% 30% 10%
Category D 10% 30% 20% 30% 10%
Note* - For metropolitan planning areas with a population over 200,000, the prioritization process shall also include a factor based on the quantifiable and achievable goals in VTrans. TPB, HRTPO, RRTPO, FAMPO and RVTPO all meet this definition. Other potential MPOs in the Category B typology (refer to Attachment 4) will not include this factor in the weighting scheme (referred to as the land use factor in Table 1 and Table 2).
Note** - For Northern Virginia and Hampton Roads construction districts, congestion mitigation is weighted highest among the factors in the prioritization process.
4.4 PROJECT COST HB2 mandates that the prioritization process be based on several factors relative to the cost of the project:
“The prioritization process shall be based on an objective and quantifiable analysis that considers, at a minimum, the following factors relative to the cost of the project or strategy: congestion mitigation, economic development, accessibility, safety, and environmental quality.”
For the purposes of HB2 project scoring, project benefits will be calculated relative to HB2-funded costs only. The calculation of scores based on total cost will be provided to the CTB for comparison purposes.
Using only the HB2 costs directly accounts for the financial benefit of private, local, or other funding, and reflects the increased leveraging power of state resources. It is acknowledged that this definition of project cost may favor localities with more local financial resources to commit to transportation projects as well as localities with access to regional funds (e.g., Regional Surface Transportation Program Congestion Mitigation and Air Quality improvement program, Hampton Roads Transportation Accountability Commission, Northern Virginia Transportation Authority .

HB2 Implementation Policy Guide
37
HB2 costs will be used as the basis for the official project score. However information on both HB2 cost and total cost will be provided to the Board for comparison purposes and to show the range of the score between two costs.
4.5 PROJECT SCORING HB2 requires an analysis of the project benefits for each factor relative to the cost of the project. Each project will be scored by calculating values for each of the evaluation measures, converting those values into a score for each factor, and then by weighting the factor scores according to one of several potential weighting frameworks approved by the CTB. Ultimately, a weighted project score will be developed based on the project score divided by the cost of the project.
Key Terms
Measure Value –Data calculated for the project that describes the characteristics of the project. Wherever possible, the HB2 measure values should be calculated so they are proportional to the size or impact of the project, even for qualitative measures.
Measure Score – Numerical score given to each measure based on the measure value as a percentage of the maximum value.
Factor Score – Measures scores within a factor area multiplied by their measure weights.
Project Score – Factor scores multiplied by factor weights based on the area where the project is located. This represents the total benefits of the project.
Project Cost-Effectiveness Index – Project score divided by the HB2-funded cost of the project. This index will allow projects to be compared in terms of their benefit per HB2 dollar invested.
Methodology
Step 1 - Normalization of the Measure Values. Within each factor, for each measure, the highest value will be determined after calculating the measures for each project. The highest measure value will be given a score of 100 percent. Other measure values will be compared to the highest value, and the percentage of the highest value will be used as the measure score. An example of normalization is shown in the table below.

HB2 Implementation Policy Guide
38
Step 2 – Apply Measure Weights. Once each measure score has been assigned for a factor, the measure weighting is applied. Each measure within the five or six factors will have a measure weight which will determine the percentage of the factor score carried by each measure. Once the measure weighting has been applied, the sum of the measure scores will produce the factor score.
C.1: Person Throughput C.2: Reduction in
Person Hours of Delay
Total Factor Score ‐
Congestion
Measure Weight
50% 50%
Value Score Value Score
Project 1 1200 8.0 10 1.1 (50%*8.0) + (50% *1.1) = 4.55
Project 2 6,000 40.0 500 55.5 (50%*40.0) + (50%*55.5) = 47.8
Project 3 15,000 100.0 900 100.0 (50%*100) + (50% *100) = 100.0
Step 3 – Apply Factor Weights. The factor score is then multiplied by the weighting percentage assigned to that factor by the predetermined weighting typology. This process is repeated for all applicable factors – their sum producing the final HB2 project score.
Project 2
(Category B Weights)
Congestion Mitigation
Economic Development
Accessibility Safety Environmental
Quality Land Use
Final Project Score
Weight 15% 20% 25% 15% 10% 15%
Factor Score
47.8 76.4 49.1 58.9 81.9 68.3
Weighted Score
7.17 15.28 12.27 8.83 8.19 10.24 62.00
Congestion Mitigation: C.2: Reduction in Person Hours of Delay
Project 1 Project 2 Project 3
Measure Value
10 Hrs 500 Hrs 900 Hrs
Measure Score 1.1 55.5 100

HB2 Implementation Policy Guide
39
Step 4 – Calculate Cost-Effectiveness. The project score is then divided by the HB2-funded cost of the project to determine the value of score for every dollar invested. For example, assume that Project 2 is requesting $15 million in HB2 funds out of a total cost of $30 million. The project score is 62.0, the cost-effectiveness index would be 4.1 per million dollars of HB2 funds invested. If the total project costs were used, instead of HB2 funds only, the cost-effectiveness index would be 2.1 per million dollars of cost.
Under this scoring process the maximum measure values may change on a year-to-year basis depending on the characteristics of the projects that are submitted. The aim of this method is to score each project on a scale proportional to its benefits and relative to its cohort of projects rather than an arbitrary scale.

HB2 Implementation Policy Guide
40
5.0 CTB Prioritization & Programming This final section summarizes CTB prioritization and programming methods that will be used in the HB2 process, specifically how HB2 scored projects will be reviewed, and ultimately, incorporated into the SYIP. The flowchart in Figure 5.1 below illustrates the basic process of the final stages of the HB2 Annual Process, in which the CTB will begin with the scoring results from the HB2 evaluation and rating process, and funding decisions for the draft SYIP.
First, the HB2 review teams will present the screening and scoring results to both the CTB and the public. The CTB will give guidance on program development, and begin to narrow down their funding decisions for projects that will funded in the draft SYIP. Their decision will be represented in the draft SYIP. After the draft SYIP is presented, VDOT and DRPT will hold a public comment period that will allow eligible entities to comment on the process, on screening decisions, and on the scoring of individual projects. CTB will take into account public comments based on the draft SYIP, ultimately approving the final SYIP for implementation in June 2016.
Figure 5.1 CTB Prioritization & Programming Process
HB2 Scoring Results
Present Screening/Scoring Results to CTB and Public
CTB Guidance on Program Development
Funding Decisions for Draft SYIP
Public Comment Period
Revise and Adopt Final SYIP
HB2 Implementation Policy Guide
41
5.1 FUNDING DECISIONS FOR DRAFT SYIP Pursuant to Section 33.2-214 of the Code of Virginia, each year the CTB must approve a capital improvement program that outlines planned spending for transportation projects for proposed construction development or study for the next six years. The SYIP includes projects on the interstate, primary, secondary, and urban highway systems, as well as transit and rail projects. The CTB updates the SYIP each year as revenue estimates are updated, priorities are revised, project schedules and costs change, and study results are known.
VDOT and DRPT will utilize information from the fall transportation meetings and results of the scoring process to develop a draft SYIP. The draft SYIP is presented to the CTB each spring. At that time the draft SYIP is made available for public comment. A final SYIP is presented to the CTB in June each year for approval. Upon adoption of the SYIP by the CTB, the new SYIP goes into effect on July 1.
Once the scoring is complete, additional considerations will be used to develop a recommended list of improvements for the CTB to consider in developing the next capital improvement program. These include:
Public feedback from fall transportation meetings
Overall availability of funding and eligible uses of such funding
Leveraging of outside funding sources and maximizing the use of federal funds
Project development considerations – timeframe and extent of federally required location studies
Project segmentation - starting the next phase of a multi-segment roadway improvement, e.g. to complete a major multi-segment project
The prioritization process does not require that the CTB funds projects in order of their scoring. Further, the CTB is not required to select the highest scoring project. The process is a means to assist the CTB in evaluating and comparing proposed improvements. The CTB continues to retain final decision making authority on improvements to be included in the SYIP.
5.2 PUBLIC COMMENT PERIOD The CTB provides numerous opportunities for the public to provide input on transportation projects and priorities as part of the continuing transportation planning process. VDOT and DRPT hold annual Fall Transportation Meetings in the construction districts, providing public and elected officials with an opportunity to identify transportation priorities and to review and comment on the current SYIP. The next round of project selection will be initiated with a call for candidate projects. VDOT and DRPT also hold an annual planning and programming meeting inviting representatives from all MPOs and PDCs to

HB2 Implementation Policy Guide
42
attend and provide their transportation priorities prior to the annual development of the SYIP. Each spring, the draft SYIP is made available for public comment and VDOT and DRPT host public hearings. Attendance at the Fall Transportation Meetings and spring public hearings generally includes elected state officials, city and town officials, members of County Boards of Supervisors, representatives of advocacy groups, representatives from MPOs and PDCs, and the general public. Comments are accepted both verbally and in writing at the meeting or via regular mail or email after the meeting.
Following public engagement, the CTB will release the draft scoring process in March 2015 and adopt the final scoring process in June 2015. There will be a call for candidate projects in the late summer of 2015. Projects will be screened and scored through late 2015.
5.3 ADOPTION OF SYIP Once the projects are scored and public input from the formal public comment period based on the draft SYIP are received, the CTB will select the final list of projects for funding to be included in the draft SYIP, with the final program approved in June 2016 and becomes effective July 1st. Annually and in order to meet its statutory obligation, the CTB will adopt a SYIP in June of each year.
Key milestones for the adoption the first SYIP (FY 2017-FY 2022) that includes HB2 projects. Early Fall of 2015: Call for candidate projects
Early 2016: Projects will be screened and scored, followed by public input
Spring 2016: CTB will select the final list of projects for funding to be included in the draft SYIP.
June 2016: Final program adopted
5.4 ANNUAL PROCESS ISSUES
Changes in Project Scope/Schedule/Cost
In general, once a project has been screened, scored, and selected for funding by the (CTB), it will remain (SYIP) as a funding priority. Certain circumstances may warrant a re-evaluation of the project score and funding decision.
Important Considerations:
It is important to ensure the integrity of the HB2 scoring process, the original intent/benefits of scored projects, and the CTB’s allocation decisions. Changes to these basic elements could result in funding projects that are not as cost effective when decisions to fund those projects are made by the CTB.

HB2 Implementation Policy Guide
43
In addition, allowing minor adjustments within the established thresholds ensures that minor changes to a project scope and/or estimate can be addressed through business rules without requiring CTB action, potentially causing project delays.
A project that has been selected for funding must be re-scored if either of the following conditions apply:
1. There is a change in the scope of the project that is significant enough to impact the anticipated benefits associated with the project or to require the location decision, NEPA, or public hearing to be revisited; OR
2. There is an estimate increase prior to contract award that forces the total cost of the project over the thresholds for the original score/latest re-score, unless local or other exempt funding is identified to support the increase. The threshold for re-scoring a project should be based on the total cost of the project:
Total Cost <$5 million: 20% increase prior to award of the construction contract requires re-scoring
Total Cost >$5 million: 10% increase prior to the award of the construction contract requires re-scoring
$5 million maximum increase prior to the award of the construction contract regardless of total cost
CTB action is required to confirm the commitment to funding the project based on the new score prior to the transfer of previous and/or program funds. Cost increases below the thresholds above will be addressed according regular business rules in accordance with the CTB policy for fund transfers.
In order to cover estimate increases, funds will be reprogrammed from projects with surplus allocations due to estimate decreases, contract award savings, schedule changes, etc. or the lowest priority project with eligible funds and backfilled in a later cycle as necessary to advance projects to the next phase or award. It is recommended that an annual review will be conducted on a sampling of projects to ensure that the scope and benefit of selected projects has not changed significantly. Project estimates will also be monitored to determine if the thresholds need to be adjusted.
Re-Rating Projects
If a submitted project is not selected for funding during a cycle, the CTB will allow eligible entities will be able to re-submit the project he next cycle. If a project is selected for funding in an approved SYIP and in the next cycle or any future cycle, program constraints require de-funding lower priority HB2 selected projects beyond the current six-year constraint, however those projects are not eliminated from funding consideration. In the re-submission, the project will be

HB2 Implementation Policy Guide
44
treated as a new project, and will be re-rated and re-ranked along with the other projects.
5.5 IMPROVEMENTS TO PROCESS AND MEASURES HB2 is a new step forward for the Commonwealth of Virginia, the CTB is breaking new ground in moving towards a prioritized transportation funding structure. As the process moves into its second and third cycle, HB2 will continue to evolve and improve. Advances in technology, data collection, and reporting tools will upgrade and modernize HB2 for a growing Virginia, and CTB looks forward to using these tools to provide a more balanced and equitable distribution of the Commonwealth’s transportation funds.
5.6 OUTSTANDING ISSUES This draft policy guide summarizes the HB2 measures and process based on current staff recommendations. Over the coming months, there are a few issues where additional refinement and discussion will be needed:
Changes to measures and weighting based on stakeholder input. Stakeholder comments were received at the February and March outreach meetings, but have not been incorporated into revisions to the measures or process.
How often projects will be evaluated (annual or biannual cycle). In the initial year of HB2 implementation, projects will be recommended for the Six-Year Improvement Program. It has not been determined yet whether the project application and evaluation process will be conducted annually or biannually.
How CTB will use project scores to make funding decisions. As noted earlier, HB2 project scores will help the CTB select the most cost-effective projects to fund. Other considerations will also shape funding decisions. The process for determining how scores will translate into funded projects still needs to be further defined.
Normalization of scores and scaling of measures. Staff are continuing to investigate the impact of normalization and scaling methods on overall project scores.

HB2 Implementation Policy Guide
45
6.0 Appendix A: Project Application Figure 6.1 displays a draft application form that includes the types of project information that will be needed. Figure 6.2 is an initial listing of the types of evaluation data that may need to be developed for each project, with the state and sponsor responsibility indicated. If the local sponsor is providing the information, the state Technical Evaluation Team will verify data using independent sources.
In addition, the following information on project status could be provided, if available, with a submittal as additional information for consideration:
Plan status (e.g., Comprehensive Long Range Plan (CLRP), locality comprehensive plan, Transit Development Plan (TDP), Small Urban Area Transportation Study (SUATS), etc.)
Prior phases of the project that are under construction or have been completed
Preliminary work complete (e.g., feasibility study, 30% plans, etc.)
Right-of-way status (secured, in-process, none needed, etc.)
Utility conflicts/conditions (none, relocation needed, etc.)
Permit and approval status (federal approvals needed/obtained, state/regional permits needed/obtained, local approvals needed/obtained)
Status with regard to construction readiness (additional study needed, additional design/design completion needed, ROW needed, shovel ready, etc.)
Status of project relative to support of others (e.g., developer, university, hospital, etc.).
Additional project processes/needs to fulfill federal/state/regional/local requirements (e.g., federal strategy, payback of federal funds, 10-year rule violation, etc.)

HB2 Implementation Policy Guide
46
Figure 6.1 Draft HB2 Funding Application

HB2 Implementation Policy Guide
47
Figure 6.2 HB2 Measure Data Responsibility
Responsibility
Congestion Mitigation State Applicant
Increase in Person Throughput X *
Decrease in Person Hours Delay X *
Safety
Reduction in # of Fatal and Severe Injury Crashes X
Reduction in # of Fatal and Severe Injury Crash Rate X *
Accessibility
Increase Access to Jobs X
Increase Access to Essential Destination X
Connects Modes X
Accommodates other modes X
Real Time Traveler Info X
TDM X
Number of users X
Land Use and Transportation Coordination
Promote Walkable X
In‐Fill X
Jobs housing X
UDA support X
VDOT Access Management X
Per Capita VMT Reduction X
Environment
Increase Rail Transit X
Encourage bike ped X
Rideshare Bus Transit X
Truck Bottleneck X
Trucks to Rail X
Non Auto Access to job Disadvantaged Groups X
Non Auto Access to Essential Destinations Disadvantaged Groups X
Economic Development
DHCD Enterprise Zones X
CEDS support X
Develop Plans Submitted X
Dev Plans approved X
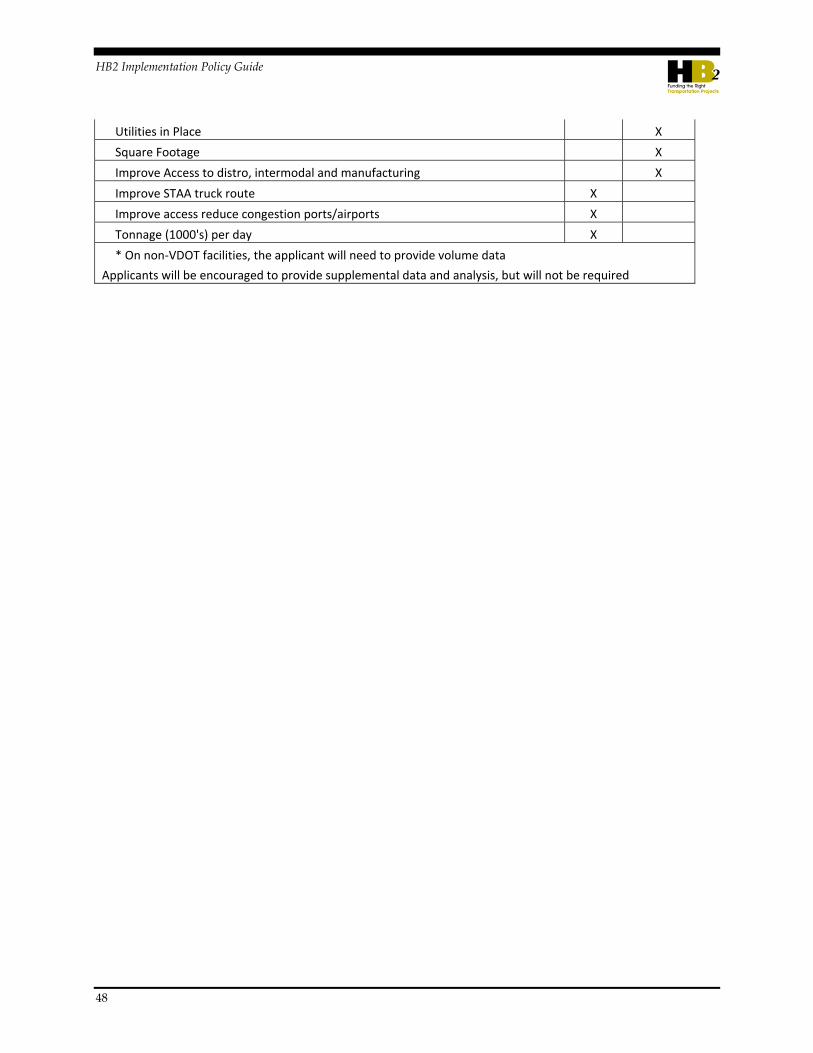
HB2 Implementation Policy Guide
48
Utilities in Place X
Square Footage X
Improve Access to distro, intermodal and manufacturing X
Improve STAA truck route X
Improve access reduce congestion ports/airports X
Tonnage (1000's) per day X
* On non‐VDOT facilities, the applicant will need to provide volume data
Applicants will be encouraged to provide supplemental data and analysis, but will not be required
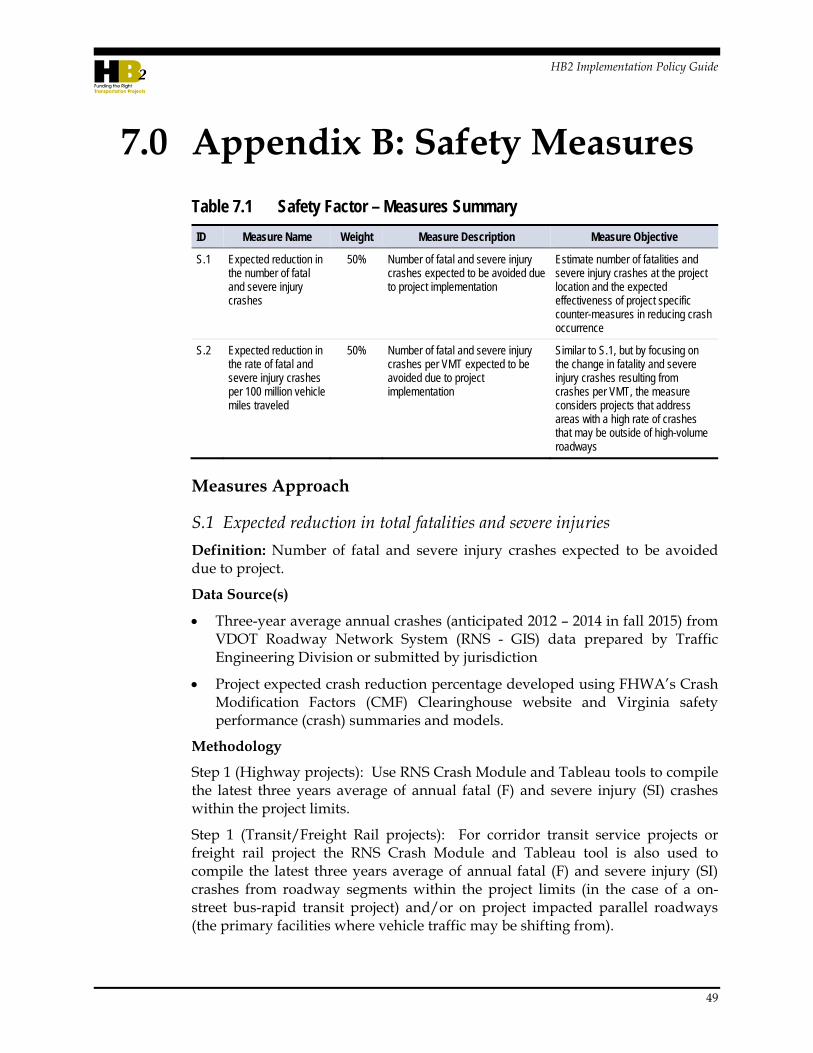
HB2 Implementation Policy Guide
49
7.0 Appendix B: Safety Measures
Table 7.1 Safety Factor – Measures Summary
ID Measure Name Weight Measure Description Measure Objective
S.1 Expected reduction in the number of fatal and severe injury crashes
50% Number of fatal and severe injury crashes expected to be avoided due to project implementation
Estimate number of fatalities and severe injury crashes at the project location and the expected effectiveness of project specific counter-measures in reducing crash occurrence
S.2 Expected reduction in the rate of fatal and severe injury crashes per 100 million vehicle miles traveled
50% Number of fatal and severe injury crashes per VMT expected to be avoided due to project implementation
Similar to S.1, but by focusing on the change in fatality and severe injury crashes resulting from crashes per VMT, the measure considers projects that address areas with a high rate of crashes that may be outside of high-volume roadways
Measures Approach
S.1 Expected reduction in total fatalities and severe injuries
Definition: Number of fatal and severe injury crashes expected to be avoided due to project.
Data Source(s)
Three-year average annual crashes (anticipated 2012 – 2014 in fall 2015) from VDOT Roadway Network System (RNS - GIS) data prepared by Traffic Engineering Division or submitted by jurisdiction
Project expected crash reduction percentage developed using FHWA’s Crash Modification Factors (CMF) Clearinghouse website and Virginia safety performance (crash) summaries and models.
Methodology
Step 1 (Highway projects): Use RNS Crash Module and Tableau tools to compile the latest three years average of annual fatal (F) and severe injury (SI) crashes within the project limits.
Step 1 (Transit/Freight Rail projects): For corridor transit service projects or freight rail project the RNS Crash Module and Tableau tool is also used to compile the latest three years average of annual fatal (F) and severe injury (SI) crashes from roadway segments within the project limits (in the case of a on-street bus-rapid transit project) and/or on project impacted parallel roadways (the primary facilities where vehicle traffic may be shifting from).

HB2 Implementation Policy Guide
50
Step 2: Based on a preset of CMFs applicable to HB2 project types (list under development), the sponsor selects the most appropriate overall project expected crash reduction (PECR) percentage (PECR=1-CMF), for each proposed project (alternatively a project sponsor could enter a PECR for the specific project if documentation reasoning use of a project level PECR is included). If crash reductions for project elements are unknown but a risk reduction is expected, document expected risk reductions.
Step 3: For roadway projects the average annual total fatal and severe injury crashes is multiplied by the PECR to estimate the number of crashes expected to be reduced.
The methodology varies by project type, as described below.
Roadway -
For linear roadway widening (capacity) projects, the process above is applied using crashes on the highway segment/sections from the begin and end mile points of the project limits.
For intersections, in Step 1, total fatal and severe crashes within the project limits of the major roadway approaches (highest volume and crashes unless the project is only improving the minor approaches) of the intersection will be used.
For roadways on new location, total fatal and severe crashes on the most reasonable alternative route would be identified similar to Step 1 above. The facility type statewide 3-year fatal and severe crashes per mile average for the new roadway would represent the build condition. The difference between the alternative route and the build corridor average equates to the crash reduction.
For new interchange locations and interchange ramp modifications on the freeway, the major highway/freeway crashes in the project limits will be used. If a new directional or loop ramps are being added to an interchange the crashes and AADT on the minor (crossing) route projects limits will be used.
Transit – The methodology described for roadway projects cannot be used for transit infrastructure and service given the limited information available on safety benefits to the roadway users. For on-road transit projects, for example a bus-only lane or new transit route in mixed traffic, and for off-road (dedicated guideway) transit projects, safety benefits will be estimated based on expected shift from auto to transit use due the project with the assumption that dedicated transit vehicles have minimal crash rates.
The transit service safety analysis includes the following steps:
Step 1: Project sponsor identifies segments of highway with new on-road transit service and key parallel roadway(s) to new on-road and fixed guideway transit projects that will experience the primary travel shifts. The sponsor also provides

HB2 Implementation Policy Guide
51
an estimate of the expected percent modal shift from highway (VMT) to transit due to the project on each highway segment impacted. The after project VMT will be one minus the percent model shift (VMT After = 1 - % VMT Reduced)
Step 2: The existing (most recent year matching the crashes) three year annual average F+SI crash rates for the on-road segments and parallel roadways to new service segments are compiled. Existing F+SI crash rates (before project) are calculated for each segment/section as explained in Step 2 above.
Step 3: The expected after project annual F+SI crashes for on-road and parallel roadway segments/sections is calculated as the existing crash rate (before) multiplied by the (reduced) VMT after.
Step 4: The expected number of F+SI crashes reduced = Existing annual average F+SI crashes minus the expected after project annual F+SI crashes summed for all project segments/sections .
Bicycle/Pedestrian – The methodology described for roadway projects will be used for bicycle and/or pedestrian projects based on the proposed segment and/or intersection improvement CMFs. CMFs are currently being reviewed to determine whether they are effective at assessing potential reductions in fatal and severe injury bicycle and pedestrian crashes. Depending on the CMFs available through FHWA and other sources, other alternative arrangements may be developed to assess the safety benefit of these project types (for example, based on bicycle facility classification or facility separation from travel lanes).
Freight Rail – It is possible that any off-road freight rail capacity related project that improves opportunity for modal shift from trucks to rail could improve highway safety. The same approach as described for transit would be applied here (except the focus in on the 3-year average of truck related fatal and severe injury crashes in the parallel corridor).
Scoring Value
Total change in fatal and severe injury crashes.
S.2 Expected reduction in crash rate
Definition: Number of fatal and severe injury crashes per VMT expected to be avoided (reduction) due to project.
Data Source(s)
Three-year average annual crashes (anticipated 2012 – 2014 in fall 2015) from VDOT RNS (GIS) data prepared by Traffic Engineering Division or submitted by jurisdiction for S1.
Existing AADT by roadway segment from VDOT RNS or jurisdiction, and segment(s) distance to calculate annual VMT.

HB2 Implementation Policy Guide
52
Project expected crash reduction percentage developed using FHWA’s Crash Modification Factors (CMF) Clearinghouse website and Virginia safety performance (crash) summaries and models for S1.
Methodology
Step 1: The most recent year AADT is compiled to calculate the annual VMT for the same segment(s) used to collect crash data for the S1 measure.
Step 2: The project location segment or corridor sections VMT are matched with the S1 expected F+SI crashes reduced by the project from S1.
Step 3: Using information from Step 2 for roadway and bike/pedestrian projects, the overall F+SI crash rate avoided (reduction) expected as a result of the project improvements is calculated as the S1 reduced annual crashes divided by the segment or sections VMT. For longer projects covering several sections with different AADT values, the average annual crash rate reduction is the sum of the sectional reduced crashes over the sum of the sectional VMT.
The methodology varies by project type, as described above for S1 crash reduction assessments. Transit service improvements will be considered as follows:
Transit – The methodology described for roadway projects cannot be used for transit projects. For on-road and off-road (dedicated guideway) transit projects, only S.1 measure of the total F+I crash reduction will be used and all of the transit safety score will be based on the S.1 result
Freight Rail – It is possible that any off-road freight rail capacity related project that improves opportunity for modal shift from trucks to rail could improve highway safety.
Scoring Value
Total change in fatal and severe injury crash rate.

HB2 Implementation Policy Guide
53
8.0 Appendix C: Congestion Mitigation Measures
Table 8.1 Congestion Mitigation Factor – Measures Summary
ID Measure Name Weight Measure Description Measure Objective
C.1 Person Throughput 50% Change in corridor total (multimodal) person throughput attributed to the project.
Assess the potential benefit of the project in increasing the number of users served within the peak period.
C.2 Person Hours of Delay
50% Decrease in the number of person hours of delay in the corridor based on level of service E
Assess the potential benefit of the project in reducing peak period person hours of delay.
Measures Approach
C.1 Person Throughput
Definition: Change in corridor total (multimodal) person throughput attributed to the project.
Data Source(s)
2025 project no-build peak period person volume in the project corridor where the project improvement is located. Data is derived from a regional travel demand models as applicable or the Statewide Planning System.
2025 project build peak period person volume in the project corridor where the project improvement is located. Data is derived from a regional travel demand model as applicable or the Statewide Planning System capacity and volume data modified through Highway Capacity Manual (HCM) methods.
Methodology
The methodology is a quantitative, corridor based analysis that requires an estimate of future no-build and project build person throughput. Note, the definition of project corridor is critical to the outcome of this measure, particularly in urban areas, and has not yet been finalized. It is anticipated that project corridor definition will vary by mode and travel market (e.g. corridors of statewide significance, regional networks, urban development areas).
Step 1: Summarize future 2025 peak period person vehicle volume and transit ridership data where applicable, within the project corridor from regional travel demand model projections or the Statewide Planning System AADT forecasts. Alternatively, the project sponsor will be permitted to submit a 2025 forecast from a detailed project study. Vehicle volumes are reported as person trips based

HB2 Implementation Policy Guide
54
on average vehicle occupancy statistics for Virginia (for projects in a corridor with a managed lane, managed lane volume and occupancy is needed).
Step 2: The approach to determine the change in capacity depends on the project location and tool availability.
Non-MPO area projects – Demand for project capacity (or saturated hourly flow rate) expressed as passenger car equivalents is determined using methods derived from the HCM.
MPO regionally significant projects (roadway capacity and fixed guideway transit) – The project is coded directly into the applicable regional travel demand model consistent with current modeling practices.
MPO other projects (intersections, operations, bus transit, bike/pedestrian) – Change in project capacity (or saturated hourly flow rate) expressed as passenger car equivalents is determined using methods derived from the HCM.
Step 3: The approach to determine the demand for person throughput depends on the project location and tool availability.
Non-MPO area projects – Change in project capacity (% increase in capacity) is applied to the year 2025 no-build person throughput to calculate the change in person throughput.
MPO regionally significant projects (roadway capacity and fixed guideway transit) – The project is tested through the regional travel demand model, and model outputs are used to summarize project build person throughput.
MPO other projects (intersections, operations, bus transit, bike/pedestrian) – Change in project capacity (% increase in capacity) is applied to the year 2025 no-build person throughput to calculate the change in person throughput.
The methodology described above varies by project type, as described below.
Roadway: For roadway capacity projects, the process above is applied.
Transit: For transit capacity projects, the process above is applied, using forecasted 2025 ridership per hour rather than peak period person volume.
Bicycle/Pedestrian: For a stand-alone bicycle and/or pedestrian project, bicyclist and pedestrian volume per hour is used rather than peak period person volume. Where this data does not exist, usage will be estimated based on population density and demographics.
Freight Rail: Freight rail projects having a capacity impact on the roadway system will use the process described above.
Scoring Value
Total change in person throughput (persons per hour) due to the project.

HB2 Implementation Policy Guide
55
C.2 Person Hours of Delay
Definition: Decrease in the number of peak period person hours of delay in the project corridor based on a level of service E capacity threshold.
Data Sources/Analytical Tools
Same no-build and build person volume data from Measure C.1, plus LOS E capacity and estimated peak hour congested speeds (no-build and build, based on volume/capacity ratio) in the corridor where the project improvement is located. Data is derived from a regional travel demand model as applicable or the Statewide Planning System capacity and volume data modified through Highway Capacity Manual (HCM) methods.
Methodology
The methodology is a quantitative, corridor based analysis that requires an estimate of future no-build and project build person throughput and congested travel speeds. Note, the definition of project corridor is critical to the outcome of this measure, particularly in urban areas, and has not yet been finalized. It is anticipated that project corridor definition will vary by mode and travel market (CoSS, regional networks, UDAs).
Step 1: Calculate 2025 no-build and build travel demand. Use the same person vehicle volume and transit ridership data, as applicable, within Measure C.1, Step 1 through Step 3, for 2025 no-build and project build conditions.
Step 2: Calculate congested speeds. The approach to determine no-build and build congested speeds is based off existing regional volume delay functions or Chapter 29 Corridor Analysis Methodology in the 2000 Highway Capacity Manual (approach to be determined, likely to vary depending on project type as described in measure C.1, steps 2 and 3).
Step A: Future no-build and build scenario peak hour demand (based on a 2025 planning year), expressed as passenger car equivalents, and LOS E capacity or saturated flow rate for the build and no-build scenario, also expressed as passenger car equivalents, are divided to determine a peak hour volume to capacity ratio for the no-build and build.
Step B: Based on a standard, statewide speed – flow equation tailored by facility/corridor type, the future build and no-build peak hour volume to capacity ratios are converted to peak hour congested speeds. The LOS E congested speed is also determined.
Step 3: Calculate hours of delay. Vehicle hours of delay are calculated using the congested speeds. Average auto occupancies are used to convert vehicle hours of delay into person hours of delay. Total future person hours of delay in the build-scenario are subtracted from total future peak period person hours of delay in the no-build scenario to determine the total delay reduction.

HB2 Implementation Policy Guide
56
The methodology varies by project type, as described below.
Roadway – The above approach above applies to linear roadway capacity projects. For intersection or interchange projects, change in delay is a function of the improvement type (approach to be determined – anticipated that maximum score would be received for a grade separation project, with a lower score for ramp capacity improvements or signalization/intersection geometry improvements). Managed lane projects would also receive a maximum score. Operational improvements will be assessed separately based on empirical research on benefits by project type.
Transit – New transit service supports change in delay both on the transit system and highway network. For transit trips, estimate total person travel time savings for existing and new transit users in the peak hour. The person travel time savings for existing users is associated with any improvement in frequency or travel time associated with the project. The person travel time savings for new users is associated with any travel time savings associated with a shift from the auto mode. For the highway network, total demand is reduced, which may lead to a reduction in delay on parallel facilities. The process described above for roadways will also be tested for transit.
Bicycle/Pedestrian – No reduction in person hours of delay is assumed for a stand-alone bicycle and/or pedestrian project.
Freight rail – For freight rail related projects, change in delay is a function of the improvement type (approach to be determined – anticipated that maximum score would be received for a rail capacity enhancement such as adding parallel tracks or raising bridges for double-stack or a roadway capacity enhancement addressing an identified truck bottleneck, with a lower score for operational related enhancements).
Scoring Value
Total peak-period person delay reduction.

HB2 Implementation Policy Guide
57
9.0 Appendix D: Accessibility Measures
Table 9.1 Accessibility Factor – Measures Summary
ID Measure Name Weight Measure Description Measure Objective
A.1 Access to work destinations
60% Change in project corridor population weighted accessibility index by mode (depending on project type)
Measure assesses the change in cumulative access to employment opportunities as a result of project implementation based on the accessibility tool.
A.2 Access to non-work destinations
20% Change in project corridor population weighted non-work accessibility index by mode (depending on project type)
Measure assesses the change in cumulative access to non-work destinations (health care, education, recreation) as a result of project implementation based on the accessibility tool.
A.3 Access to multimodal choices
20% Assessment of the project support for connections between modes, and promotion of multiple transportation choices
Measure assigns more points for projects that enhance interconnections among modes, provide accessible and reliable transportation for all users, encourage travel demand management, and potential to support emergency mobility.
Measures Approach
A.1 Access to Work Destinations
Definition: The accessibility tool (currently in pilot testing) reports the existing cumulative accessibility to jobs within 45 minutes at the individual U.S. Census block group level statewide. The tool reports the cumulative accessibility by mode (auto, transit, bike/pedestrian) and a combined multimodal cumulative accessibility. The cumulative accessibility represents the total number of jobs from each block group, based on a travel time decay function, where jobs within a shorter travel time are weighted more than jobs farther away. Travel times are based on congested roadway travel times and real transit operating schedules.
As part of the estimation of change in project corridor person hours of delay (measure C.2), an estimate of the project build congested speed will also be developed. The project build congested speed will be entered into the underlying congested network within the accessibility tool, and a change in cumulative accessibility by block group can be estimated.

HB2 Implementation Policy Guide
58
Data Source(s)
Accessibility tool
Change in project corridor congested speed or transit operations
Methodology
The accessibility tool currently reports a cumulative accessibility by mode and a multimodal accessibility for each block group in Virginia. The analysis of project benefits considers how an improvement in travel time expands accessibility to jobs at the block group level (without consideration of regional boundaries). Year 2025 land use forecasts will be used. A local government may submit a market study that demonstrates the project will support land development that varies from adopted comprehensive plan and such assumptions will be used to determine projects benefits.
Step 1: Update congested roadway speeds or transit network. Based on analysis conducted in the congestion factor for measure C.2, post-project implementation congested speeds are generated and applied to the roadway network underlying the accessibility tool. For transit projects, the project corridor and basic operational information (peak period frequency and travel times) are coded into the transit network (based on General Transit Feed Specification (GTFS) data, which is a common format for public transportation schedules and associated geographic information) underlying the accessibility tool.
Step 3: The accessibility tool is used to report a project build cumulative accessibility for each block group within Virginia. For each project, a build condition cumulative accessibility by block group is reported (depending on mode, e.g. for roadway projects the auto mode index is reported, for transit projects the transit mode index is report, for multimodal projects the multimodal index is reported, etc.).
Step 4: For those block groups that show a change in cumulative accessibility, the change by block group is weighted by block group population in order to determine a population weighted total sum change in cumulative accessibility.
Scoring Value
Total change in cumulative jobs accessibility.
A.2 Access to Non-Work Destinations
Definition: This measure considers the relationship of the project corridor to important local destinations, including health care, education, and recreation. The approach is identical to measure A.1, however cumulative accessibility is based on cumulative access to non-work destinations.
Data Source(s)
Virginia Economic Development Partnership (VEDP) GIS data including colleges and universities and hospitals.

HB2 Implementation Policy Guide
59
GIS data of all public and private elementary, middle, and high-schools
GIS data of recreational locations – National, State and local parks, trails
Methodology
The same approach would be followed as measure A.1, however a different version of the accessibility tool will be utilized that develops a non-work accessibility index based on the location of defined health care centers, educational institutions, and recreational facilities. Prior to conducting the analysis, the specific definition of the locations to include (refer to potential data sources above) should be refined (e.g. level of health care facilities included, extent of universities, colleges, and schools included, and extent of recreational facilities included). This analysis would look at the number of essential destinations within 30 minutes, with destinations closer worth more (using the same decay function as for jobs accessibility). A local government may submit a market study that demonstrates the project will support land development that varies from adopted comprehensive plan and such assumptions will be used to determine projects benefits.
Scoring Value
Total change in cumulative essential destinations accessibility.
A.3 Access to Multimodal Choices
Definition: This measure considers the relationship of the project corridor (based on proximity to other modes and sponsor input on project definition) to alternative transportation modes, and the quality of those modes. The objective is to recognize projects that enhance connections between modes or create new connections.
Data Source(s)
GIS data of transit routes or transit service areas, all rail transit stations (from GTFS data as described for accessibility tool)
DRPT/VDOT GIS data of park-and-ride lots
VDOT GIS data of on and off-road bicycle facilities (incomplete dataset at this time)
Methodology
Step 1: The project sponsor provides project level detail on the extent of connections and accommodation of multiple modes as part of the project definition and self assign points in consistent with descriptions in Table 9.2.
Step 2: The project corridor is entered into a GIS database and overlaid with a layer including all multimodal transportation options. The GIS analysis is recommended to inform the validation of sponsor scoring in Table 9.2.
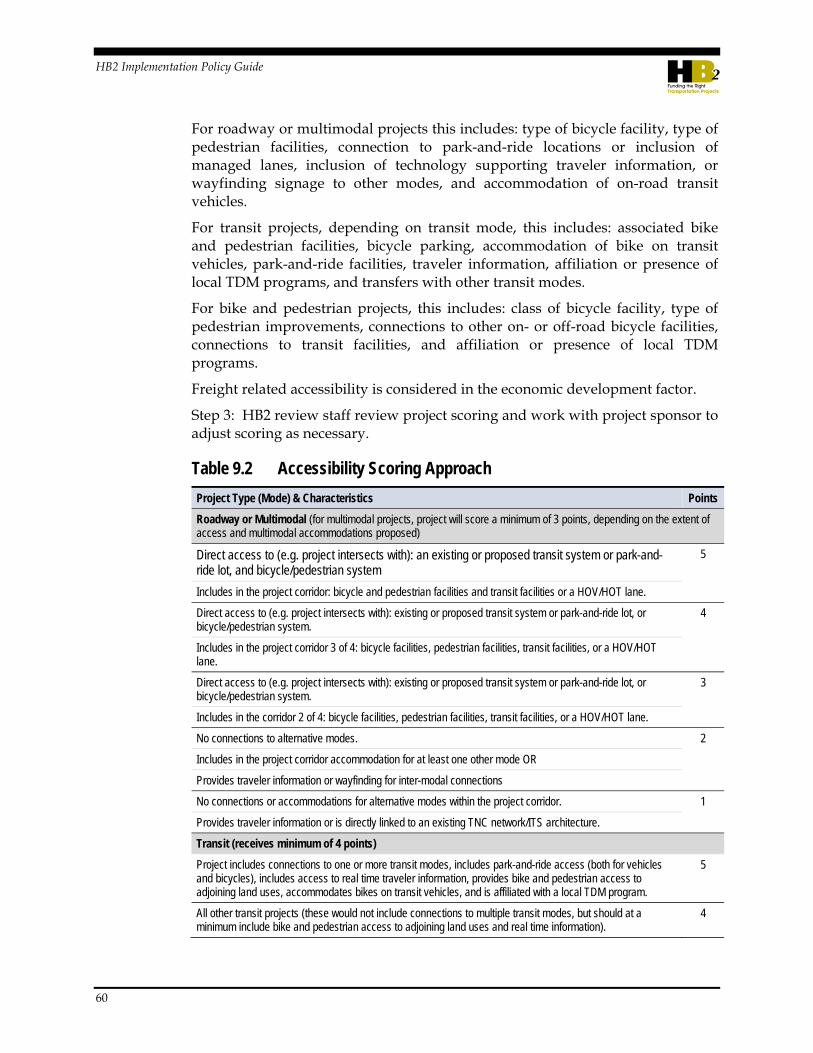
HB2 Implementation Policy Guide
60
For roadway or multimodal projects this includes: type of bicycle facility, type of pedestrian facilities, connection to park-and-ride locations or inclusion of managed lanes, inclusion of technology supporting traveler information, or wayfinding signage to other modes, and accommodation of on-road transit vehicles.
For transit projects, depending on transit mode, this includes: associated bike and pedestrian facilities, bicycle parking, accommodation of bike on transit vehicles, park-and-ride facilities, traveler information, affiliation or presence of local TDM programs, and transfers with other transit modes.
For bike and pedestrian projects, this includes: class of bicycle facility, type of pedestrian improvements, connections to other on- or off-road bicycle facilities, connections to transit facilities, and affiliation or presence of local TDM programs.
Freight related accessibility is considered in the economic development factor.
Step 3: HB2 review staff review project scoring and work with project sponsor to adjust scoring as necessary.
Table 9.2 Accessibility Scoring Approach
Project Type (Mode) & Characteristics Points
Roadway or Multimodal (for multimodal projects, project will score a minimum of 3 points, depending on the extent of access and multimodal accommodations proposed)
Direct access to (e.g. project intersects with): an existing or proposed transit system or park-and-ride lot, and bicycle/pedestrian system
5
Includes in the project corridor: bicycle and pedestrian facilities and transit facilities or a HOV/HOT lane.
Direct access to (e.g. project intersects with): existing or proposed transit system or park-and-ride lot, or bicycle/pedestrian system.
4
Includes in the project corridor 3 of 4: bicycle facilities, pedestrian facilities, transit facilities, or a HOV/HOT lane.
Direct access to (e.g. project intersects with): existing or proposed transit system or park-and-ride lot, or bicycle/pedestrian system.
3
Includes in the corridor 2 of 4: bicycle facilities, pedestrian facilities, transit facilities, or a HOV/HOT lane.
No connections to alternative modes. 2
Includes in the project corridor accommodation for at least one other mode OR
Provides traveler information or wayfinding for inter-modal connections
No connections or accommodations for alternative modes within the project corridor. 1
Provides traveler information or is directly linked to an existing TNC network/ITS architecture.
Transit (receives minimum of 4 points)
Project includes connections to one or more transit modes, includes park-and-ride access (both for vehicles and bicycles), includes access to real time traveler information, provides bike and pedestrian access to adjoining land uses, accommodates bikes on transit vehicles, and is affiliated with a local TDM program.
5
All other transit projects (these would not include connections to multiple transit modes, but should at a minimum include bike and pedestrian access to adjoining land uses and real time information).
4

HB2 Implementation Policy Guide
61
Project Type (Mode) & Characteristics Points
Bicycle/Pedestrian (standalone bicycle/pedestrian project receives minimum of 4 points)
Project includes connections to other bicycle and pedestrian networks and provides wayfinding signage for users (and may provide access to transit). For bicycle projects, off-road or on-road buffered or clearly delineated facilities are required. For pedestrian projects, pedestrian signals, marked crosswalks, refuge islands, and other treatments are required (as appropriate).
5
All other bicycle and pedestrian projects (these may not include access to multiple modes or existing bicycle and pedestrian networks).
4
Scoring Value
Total project points are then multiplied (scaled) by the number of non-SOV users.

HB2 Implementation Policy Guide
62
10.0 Appendix E: Environmental Quality Measures
Table 10.1 Environmental Quality Factor – Measures Summary
ID Measure Name Weight Measure Description Measure Objective
E.1 Air quality and energy environmental effect
50% A measure that quantifies the potential benefits of a project based on ability to improve air quality and reduce greenhouse gas emissions.
Measure rates a project’s potential benefit to air quality and ability to increase energy efficiency or alternative energy use weighted by the total number of users served.
E.2 Access to jobs for disadvantaged populations
40% Regional change disadvantaged population cumulative access to jobs for non-auto modes of transportation.
Measure assesses the change in existing cumulative access to employment opportunities as a result of project implementation based on the Virginia accessibility tool.
E.3 Access to essential destinations for disadvantaged populations
10% Regional change in disadvantaged population cumulative access to essential destinations for non-auto modes of transportation.
Measure assesses the change in existing cumulative access to essential destinations (health care, education, recreation) as a result of project implementation based on the Virginia accessibility tool.
Measures Approach
E.1 Air Quality and Energy Effect
Definition
The Air Quality and Energy Effect measure describes the level of benefit that a project is projected to have on air quality and greenhouse gas emissions (or alternative energy use). The objective of this measure is to recognize projects that are expected to contribute to improvements in air quality and reductions in greenhouse gas emissions.
Data Source(s)
Project sponsor answers defined qualifiers as described below based on project definition.
Total project corridor passenger throughput (as determined in the congestion factor).
Methodology

HB2 Implementation Policy Guide
63
Air quality and energy effect is determined by reviewing a project sponsor responses (collected through the project nomination) to the qualifications identified in Table 10.2. The methodology applies to all project types.
Step 1: The project sponsor self assesses the project based on Table 10.2 (10 point potential maximum). The nomination form includes space for the sponsor to provide clarifications/justifications for the points awarded.
Step 2: HB2 review staff receive each project nomination and reviews the information provided. As appropriate, staff contact project sponsors to address any questions or unexplained scoring.
Table 10.2 Qualifiers for Air Quality and Energy Effect
Qualifier Points Awarded
Purpose: Improve air quality and reduce greenhouse gas emissions. How well does the project contribute to reducing criteria pollutant and greenhouse gas emissions? Criteria pollutants include NOx, VOC, PM2.5 as designated under the Clean Air Act (choose all that apply).
Project supports and/or encourages more pedestrian and bicycle activity.
Logic: Zero emissions mode, maximum points possible.
4
Project increases rail transit and/or passenger rail use.
Logic: Fixed guideway transit services emit 1/3 or less the amount of emissions per passenger mile as the average SOV.
3
Project supports and/or encourages ridesharing (carpooling or vanpooling)
Logic: Ridesharing emits 1/2 or less the amount of emissions per passenger mile as the average SOV.1
2
Project increases local or commuter bus transit use.
Logic: Bus transit service emits 2/3 or less the amount of emissions per passenger mile as the average SOV.1
1
Project reduces traffic delay at a congested intersection, interchange, or other bottleneck with a high percentage of truck traffic (greater than 8 percent of AADT)
Logic: Focus on PM and NOx criteria pollutant emissions.
1
Project encourages or enables shifts from truck to freight rail goods movement 0.5
Project supports and/or encourages use of privately operated hybrid, electric, or alternative fuel vehicles (may include special accommodations for hybrid or electric vehicles, or space or infrastructure for electric vehicle parking/charging)
0.5
Project includes energy efficient infrastructure or fleets, including: hybrid or electric buses, LED lights and signals, electronic/open road tolling, alternative energy infrastructure (e.g. roadside solar panels).
0.5
Scoring Value
After HB2 staff review and confirm points assigned in Table 10.2, total project points are multiplied (scaled) by the number of users (for each individual mode, e.g. if the project supports pedestrian activity, how many potential pedestrians).

HB2 Implementation Policy Guide
64
E.2 Non-auto Access to Work Destinations for Disadvantaged Populations
Definition: The accessibility tool (currently in pilot testing) reports the existing cumulative accessibility to jobs within 45 minutes at the individual U.S. Census block group level statewide. The tool reports the cumulative accessibility by mode (auto, transit, bike/pedestrian) and a combined multimodal cumulative accessibility. The cumulative accessibility represents the total number of jobs from each block group, based on a travel time decay function, where jobs within a shorter travel time are worth more than jobs farther away. Travel times are based on congested roadway travel times and real transit operating schedules.
Data Source(s)
Accessibility tool
2010 U.S. Census data (focused on Title VI populations), refer to: http://www.virginiadot.org/business/bu-civil-rights-maps.asp as an example of Virginia specific 2000 Census data and disadvantaged (or underserved) populations.
Methodology
Identical approach to measure A.1, however the accessibility tool instead is used to assess the change only for disadvantaged populations instead of total population. For this measure, the change in cumulative jobs accessibility would be weighted by the disadvantaged population of those block groups showing an increase in access.
Scoring Value
Total change in cumulative jobs accessibility (for disadvantaged populations).
E.3 Non-Auto Access to Essential Destinations for Disadvantaged Populations
Definition: This measure considers the relationship of the region to important local destinations, including health care, education, and recreation. The approach is identical to measure E.2, however cumulative accessibility is based on the location of essential non-work destinations.
Data Source(s)
Virginia Economic Development Partnership (VEDP) GIS data including colleges and universities and hospitals.
GIS data of all public and private elementary, middle, and high-schools
GIS data of public recreation locations – National, State and local parks, trails
Methodology
Identical approach to measure A.2, however the accessibility tool instead is used to assess the change only for disadvantaged populations instead of total population. For this measure, the change in cumulative essential destinations

HB2 Implementation Policy Guide
65
accessibility would be weighted by the disadvantaged population of those block groups showing an increase in access.
Scoring Value
Total change in cumulative essential destinations accessibility (for disadvantaged populations).

HB2 Implementation Policy Guide
66
11.0 Appendix F: Economic Development Measures
Table 11.1 Economic Development Factor – Measures Summary
ID Measure Name Weight Measure Description Measure Objective
ED.1 Project Consistency with Economic Development Plans, Local Support and Development Activity
70% Assessment of progress made toward new economic development (new and expansion of existing) at the local level by the public and private sector.
The intent of this measure is to assess if the project is supporting new and existing economic development and the progress made toward development in the project corridor at the local level. Progress will be assessed through use of a checklist of desired actions.
ED.2 Intermodal access and efficiency
30% Rate projects based on the extent to which the project is deemed to enhance access to critical intermodal locations, interregional freight movement, and/or freight intensive industries and supports increased reliability for freight movement in congested corridors.
The intent of this measure is to assess the:
Level to which the project enhances access to distribution centers, intermodal facilities, manufacturing industries or other freight intensive industries;
Level to which the project supports enhanced efficiency on a primary truck freight route (or high volume/ high value truck or rail freight corridor);
Level to which the project enhances access or reduces congestion at or adjacent to VA ports/ airports
Measures Approach
ED.1 Project Consistency with Economic Development Plans, Local Support and Development Activity
Definition: Assessment of project based on sponsor input regarding the project support of economic development priorities as stated in jurisdiction/ MPO/PDC/other regional plans; the jurisdiction/MPO/PDC stated support of the project, as well as steps achieved toward specific developments, zoning actions, and utility provision in the project corridor. Progress will be assessed through use of a checklist of desired actions.
Data Sources: Project description and supporting information provided by the project sponsor.

HB2 Implementation Policy Guide
67
Methodology: The focus of this measure is on project consistency/support of local/county/PDC/regional economic development plans and support of real, planned non-residential development (residential only developments are not considered) within the project corridor (definition to be determined). Project assessment is based on use of a checklist, which is shown in Table 11.2 below. Validation (a brief narrative) of the existence of the actions in the checklist is included as part of the project nomination. The project would be awarded up to 1 point for each question below, points are summed. (The detailed approach for Question 1 is listed below Table 11.2).
Table 11.2 Project Consistency, Local Support and Development Actions Checklist
Rating Description Value
1. Is the project consistent with the objectives of the MPO/PDC/local jurisdiction economic development strategy/plan/goals (this plan may be an official Comprehensive Economic Development Strategy certified by the Economic Development Administration) or another region or locally adopted plan or economic development partnership)?
0, 0.5, or 1
2. Is this project within or does it provide access to a Virginia Enterprise Zone or Technology Zone (yes = 1, no = 0).
0 or 1
3. Does the local comprehensive plan (future land use or zoning map) and or zoning code/ordinance formally recognize the potential development (1/2 point) and is the project consistent with locality/private industry goals for providing access to the development location (1/2 point)?
0, 0.5, or 1
4. Have development plans been submitted for review (1/2 point) or approved (1 point) by the locality? 0, 0.5 or 1
5. Are required utilities (sewer/water, broadband, etc…) in place (1 point) or are they programmed for development (1/2 point)?
0, 0.5, 1
Total (maximum points in rows above) 5
Question 1 guidance: To determine whether a project is consistent with MPO/PDC/local jurisdiction economic development strategy/goals, the project sponsor should conduct the following steps:
Step 1: Identify the MPO/PDC/local jurisdiction economic development strategy/goals for the geographic area in which the transportation project is proposed (the strategy or goals may be found in a stand alone document or as part of another document, such as a comprehensive plan).
Step 2: Review the goals, objectives and strategies noted in the document(s).
Step 3: Review the document to determine if the proposed transportation project is specifically cited in the document(s) as a key project desired to support local/regional economic development.
Step 4: Award points to the proposed project as follows:
If the proposed transportation project is specifically mentioned as a key project in at least one of the MPO/PDC or local jurisdiction economic development strategy/plan documents, the project is considered “consistent”, and is awarded 1 pt.

HB2 Implementation Policy Guide
68
If the proposed transportation project clearly supports an economic development objective or strategy, that project is considered “consistent” and is awarded 0.5 pts.
If the projects is in conflict with or does not in any way support stated economic development goals, the project is not considered “consistent” and is awarded 0 points.
Scoring Value
The total points would be multiplied (scaled) by a factor reflecting the magnitude of the development within the locality or regional economy (scaling factor TBD). Factors discussed with stakeholders include square footage, number of jobs, total amount of private investment, and total tax value of the development.
ED.2 Intermodal access and efficiency
Definition: Measure rates each project based on the extent to which the project is deemed to enhance access to critical intermodal locations and/or freight intensive industries and supports increased efficiency for freight movement in congested corridors.
Data Sources:
Project description and supporting information provided by project sponsor
Project description, if applicable, in the Virginia Multimodal Freight Study (2014)
STAA Truck Routes and Restrictions2
Methodology: Project description will be reviewed and assessed based on the extent to which the project is deemed to enhance access to critical intermodal locations and/or freight intensive industries and supports increased efficiency for freight movement in congested corridors.
Points are assigned through a qualitative assessment of the project description and supplementary information submitted by the project sponsor. Flexibility is provided in the project nomination for sponsors to describe the manner in which the project is expected to enhance access to critical intermodal locations, interregional freight movement, and/or freight intensive industries and supports increased efficiency for freight movement in congested corridors. The project rating is based on the extent to which the project is deemed to enhance access to critical intermodal locations, freight networks, and/or freight intensive industries and supports increased efficiency for freight movement in congested corridors.
2 http://gis.vdot.virginia.gov/vatruckweb/VaTruckRestrictions.aspx

HB2 Implementation Policy Guide
69
This comparison supports a determination of the level of economic enhancement on a 0 to 6 scale as summarized in Table 11.3.
Table 11.3 Rating Description- Intermodal Access and Efficiency Criteria
Rating Description Value
1. Level to which the project enhances access to existing or planned distribution centers, intermodal transfer facilities (excluding ports and airports), manufacturing industries or other freight intensive industries
Project provides direct access (within 1 mile) to existing or planned locations 2
Project provides indirect access (greater than 1 mile, less than 3 miles) to existing or planned locations
1
No direct or indirect access 0
2. Level which the project supports enhanced efficiency on a primary truck freight route
Project is on the designated STAA National and Virginia Network or a STAA Virginia Access Route3
2
Project directly connects to designated STAA National and Virginia Network or a STAA Virginia Access Routes
1
Project is not on and does not connect to the designated STAA National and Virginia Network 0
3. Level to which the project enhances access or reduces congestion at or adjacent to Virginia ports or airports
Project is on a designated truck route and provides direct access to (within 1 mile) existing or planned ports or airports (measured from designated entry gates to port or air cargo facilities)
2
Project is on a designated truck route and provides indirect access to (greater than 1 mile, less than 3 miles) existing or planned ports or airports (measured from designated entry gates to port or air cargo facilities)
1
No direct or indirect access 0
Total (sum of score) 0 - 6
Scoring Value
Total points received based on the assessment in Table 11.3 are multiplied (scaled) by total freight tonnage or freight value (approach TBD) within the project corridor.
3http://gis.vdot.virginia.gov/vatruckweb/VaTruckRestrictions.aspx

HB2 Implementation Policy Guide
70
12.0 Appendix G: Land Use Coordination Measures
Table 12.1 Land Use Factor – Measures Summary
ID Measure Name Weight Measure Description Measure Objective
L.1 Land Use Policy Consistency
50% Project receives points based on definition and extent of consistencies with project corridor local land use policies.
The intent of this measure is to determine degree to which the project will support transportation efficient land use patterns and local policies.
L.2 VMT per capita 50% Assessment of the percent change in VMT per capita for the MPO, from existing to the 2040 CLRP forecasts.
The intent of this measure to is determine the level to which the set of projects proposed by the MPO in the most recent approved CLRP affect the number of VMT per capita.
*Note: Applies only to metropolitan areas with total population of 200,000 or more per 2010 census4 (Fredericksburg Area MPO, Hampton Roads TPO, National Capital Regional TPB, Richmond Regional TPO, Roanoke Valley TPO)
Measures Approach
L.1 Future Land Use Policy Consistency
Definition: Measure reports the project consistency with policies and planning activities that support land use and transportation planning coordination. The approach is consistent for bicycle, pedestrian, transit, roadway and multimodal projects. VDOTs Transportation Efficient Land Use and Design Guide and DRPTs Multimodal System Design Guide are good resources to understand the objectives and scoring details of this measure.
Data Sources: Project Application.
Methodology: Projects applications should indicate if the project is consistent with the policy and planning criteria listed in Table 12.2, and should provide information (such as official plan names and policy statements) in the project application to support the response (see scoring and rating approach). VDOT
4 Refer to 33.1-23.5:5.D.6 “For metropolitan planning areas with a population over 200,000, the
prioritization process shall also include a factor based on the quantifiable and achievable goals pursuant to subsection B of 33.1-23.03 of the Code of Virginia. “Subsection B of 33.1-23.03 states the following: “The Statewide Transportation Plan shall establish goals, objectives, and priorities that cover at least a 20-year planning horizon, in accordance with federal transportation planning requirements. The plan shall include quantifiable measures and achievable goals relating to, but not limited to, congestion reduction and safety, transit and high-occupancy vehicle facility use, job-to-housing ratios, job and housing access to transit and pedestrian facilities, air quality, movement of freight by rail, and per capita vehicle miles traveled.”

HB2 Implementation Policy Guide
71
staff will review the project application against these criteria to confirm consistency.
Table 12.2 Land Use Policy Consistency/Transportation-Efficient Land Use Support
Policy and Planning Criteria Points (up to 1 per question)
1. Does the project promote walkable/bicycle friendly, mixed-use development?
1
2. Does the project promote in-fill development?
Does the project support a local/regional redevelopment or infill development strategy?
1
3. Does the project support development that will improve job-to-housing balance?
1
4. Does the project promote designated urban development areas or other locally designated growth areas?
Is the project consistent with or does the project support Traditional Neighborhood Development design components as defined in Section 15.2-2223.1
Does the project enhance access to a designated urban development area or other locally designated growth area within an approved locality comprehensive plan?
1
5. Does the project support VDOT access management policies, where applicable?
Does the corridor have an existing access management plan in place, or zoning overlay that manages access?
1
Scoring Value
Within the application process, sponsors self assign points and provide associated documentation. HB2 staff will review the application details and clarify information with sponsors as necessary.
L.2 Change in VMT per Capita
Definition: Quantitative measure reports the percent change in the VMT per capita for the MPO regional network (from existing conditions baseline). The future VMT is based on CLRP forecasts, excluding all through vehicle trips (eg. trips without an origin or destination within the MPO boundary). The percent change comparison supports a determination of the level of support/consistency between planned transportation investments and future land use on a 1 to 5 scale. The purpose of the measure is to encourage MPOs to design the CLRPs in a manner which minimizes the growth in per capita VMT.
Data Sources: MPO CLRP fiscally constrained regional network model output for baseline and forecast year (not including through trips). For the Northern Virginia Transportation Authority, the National Capital Region Transportation Planning Board model associated with the 2014 CLRP will be reviewed at the county level to assess only Virginia data.
Methodology: VDOT will work with the MPOs to develop an estimate of regional per capita VMT derived from the regional network model for the
HB2 Implementation Policy Guide
72
base and forecast year (not including through trips). A model run specific to the impacts of the project would not be conducted, all projects in a region would get the same score. If the project is consistent with the currently adopted CLRP and the CLRP reduces VMT per capita, the project will score high.
Scoring Value
Based on the percent change in the VMT per capita for the MPO regional network for a future year from existing conditions (2010 baseline), points would be assigned for each project.

HB2 Implementation Policy Guide
73
13.0 Appendix H: Factor Weighting For each HB2 factor area, indicators summarized at the MPO and PDC scale by factor helped inform factor weights by typology. The following factor indicators were considered:
Congestion Mitigation – Average peak hour vehicle delay per household
Economic Development – GDP per capita, Average annual wages
Accessibility – Average commute length, daily transit revenue hours per capita
Safety – Annual fatalities + severe injuries per VMT
Environmental Quality – Annual criteria pollutant emissions and emissions per capita
Transportation & Land Use Coordination – Jobs/household balance (U.S. Census)
The average quartile for each factor indicator and typology, and the strength of the relationship (how many regions show the same pattern) were reviewed. Based on the conclusions of this review, the most critical factor areas by typology are established. Table 13.1 presents the rank order of need/priority based on the factor indicator analysis (top 3 factors only).
Table 13.1 Typology – Factor Indicator Ranking
Factor Congestion Mitigation
Economic Development Accessibility Safety
Environmental Quality Land Use
Category A 1 2 3
Category B 2 1 3
Category C 3 1 2
Category D 1 3 2

HB2 Implementation Policy Guide
74
Table 13.2 PDC-MPO Listing
ID Type PDC/MPO Construction District
1 PDC Lenowisco PDC Bristol
2 PDC Cumberland Plateau PDC Bristol
3 PDC Mount Rogers PDC Bristol, Salem
4 PDC New River Valley PDC Salem
5 PDC Roanoke Valley-AlleghanyPDC Salem, Staunton
6 PDC Central Shenandoah PDC Staunton
7 PDC Northern Shenandoah Valley RC Staunton
8 PDC Transportation Planning Board (TPB) Northern Virginia, Culpeper*
8 PDC Northern Virginia Transportation Authority Northern Virginia
9 PDC Rappahannock-Rapidan RC Culpeper
10 PDC Thomas Jefferson PDC Culpeper, Lynchburg
11 PDC Region 2000 LGC Salem, Lynchburg
12 PDC West Piedmont PDC Salem, Lynchburg
13 PDC Southside PDC Lynchburg, Richmond
14 PDC Commonwealth RC Lynchburg, Richmond
15 PDC Richmond Regional PDC Richmond
16 PDC George Washington RC Fredericksburg
17 PDC Northern Neck PDC Fredericksburg
18 PDC Middle Peninsula PDC Fredericksburg
19 PDC Crater PDC Richmond, Hampton Roads
20 PDC Accomack-Northampton PDC Hampton Roads
21 PDC Hampton Roads PDC Hampton Roads
22 MPO Hampton Roads TPO (HRTPO) Hampton Roads, Fredericksburg
23 MPO Tri-Cities MPO Richmond
24 MPO Richmond Regional TPO (RRTPO) Richmond
25 MPO Fredericksburg Area MPO (FAMPO) Fredericksburg
26 MPO WinFred MPO Staunton
27 MPO Charlottesville-Albemarle MPO Culpeper
28 MPO Harrisonburg-Rockingham MPO Staunton
29 MPO Staunton-Augusta-Waynesboro MPO Staunton
30 MPO Central Virginia MPO Salem, Lynchburg
31 MPO Danville MPO Lynchburg
32 MPO Roanoke Valley TPO (RVTPO) Salem
33 MPO New River Valley MPO Salem
34 MPO Bristol MPO Bristol
35 MPO Kingsport MPO Bristol
* Note: The 2010 Census extended the Washington DC-VA-MD Urbanized Area into a portion of Fauquier County, including the Town of Warrenton. Federal planning regulations require that this portion be included in the metropolitan planning area. Fauquier County became an official member of TPB in July, 2014.

HB2 Implementation Policy Guide
75
Figure 13.1 Construction Districts, PDCs, and MPOS

HB2 Implementation Policy Guide
76
Figure 13.2 Weighted Population Density Indicator (Quartiles)
U.S. Census 2010 population data and Weldon Cooper Center population projections for the year 2040 at the county and city scale were used to develop MPO and PDC level population growth estimates. The analysis was constrained by the boundaries of the 134 counties and cities. The growth percentages, particularly for MPOs covering partial counties are not representative of actual growth forecasts within the MPO boundary. For example, growth of the Charlottesville-Albemarle MPO relied on the population growth only of Charlottesville City, while the growth projected for Albemarle County was assigned to the Thomas Jefferson PDC.

HB2 Implementation Policy Guide
77
Figure 13.3 Population Growth Indicator (Quartiles)

HB2 Implementation Policy Guide
78
Figure 13.4 VMT per Lane Mile Indicator (Quartiles)