hazard assessment and review of available studies: part b
TRANSCRIPT


DRAFT: DO NOT CITE OR QUOTE
Part B
Hazard Assessment and Review ofAvailable Studies

DRAFT: DO NOT CITE OR QUOTE
2
List of Contents
4 Human Epidemiological Studies . . . . . . . . . . . . . . . . . . . . . . . . . . . . . . . . . . 74.1 Colon Cancer . . . . . . . . . . . . . . . . . . . . . . . . . . . . . . . . . . . . . . . . . . . . . 74.2 Non-Hodgkins Lymphoma . . . . . . . . . . . . . . . . . . . . . . . . . . . . . . . . . . . . 74.3 Soft Tissue Sarcoma . . . . . . . . . . . . . . . . . . . . . . . . . . . . . . . . . . . . . . . . 84.4 Other Hematologic Cancers: Hodgkins Disease, Leukemia, Multiple
Myeloma . . . . . . . . . . . . . . . . . . . . . . . . . . . . . . . . . . . . . . . . . . . . . . . . . 94.5 Ovarian Cancer . . . . . . . . . . . . . . . . . . . . . . . . . . . . . . . . . . . . . . . . . . . . 94.6 Breast Cancer . . . . . . . . . . . . . . . . . . . . . . . . . . . . . . . . . . . . . . . . . . . . 104.7 Prostate Cancer . . . . . . . . . . . . . . . . . . . . . . . . . . . . . . . . . . . . . . . . . . 104.8 Stomach Cancer . . . . . . . . . . . . . . . . . . . . . . . . . . . . . . . . . . . . . . . . . . 104.9 Summary . . . . . . . . . . . . . . . . . . . . . . . . . . . . . . . . . . . . . . . . . . . . . . . . 104.10 Conclusions . . . . . . . . . . . . . . . . . . . . . . . . . . . . . . . . . . . . . . . . . . . . . 12
5 Chronic Rodent Bioassay Studies . . . . . . . . . . . . . . . . . . . . . . . . . . . . . . . . 145.1 Mayhew et al., 1986 . . . . . . . . . . . . . . . . . . . . . . . . . . . . . . . . . . . . . . . 175.2 Thakur Studies . . . . . . . . . . . . . . . . . . . . . . . . . . . . . . . . . . . . . . . . . . . 19
5.2.1 Serial Sacrifice Protocol (Thakur, 1991a) . . . . . . . . . . . . . . . . . 195.2.2 Terminal Sacrifice Protocol (Thakur, 1992a) . . . . . . . . . . . . . . . 21
5.3 Morseth, 1998 . . . . . . . . . . . . . . . . . . . . . . . . . . . . . . . . . . . . . . . . . . . . 225.4 Pettersen and Turnier, 1995 . . . . . . . . . . . . . . . . . . . . . . . . . . . . . . . . . 255.5 Hazelette and Green, 1987 . . . . . . . . . . . . . . . . . . . . . . . . . . . . . . . . . . 265.6 F-344 Two-Year Bioassays . . . . . . . . . . . . . . . . . . . . . . . . . . . . . . . . . . 27
5.6.1 Serial Sacrifice Protocol (Thakur, 1991b) . . . . . . . . . . . . . . . . . 275.6.2 Terminal Sacrifice Protocol (Thakur, 1992b) . . . . . . . . . . . . . . . 28
5.7 Pinter et al., 1990 . . . . . . . . . . . . . . . . . . . . . . . . . . . . . . . . . . . . . . . . . 305.8 Pinter et al., 1990 . . . . . . . . . . . . . . . . . . . . . . . . . . . . . . . . . . . . . . . . . 305.9 Summary and Discussion of the Two-Year Bioassay Studies . . . . . . . . 33
6 Genotoxicity Studies . . . . . . . . . . . . . . . . . . . . . . . . . . . . . . . . . . . . . . . . . . . 356.1 Mutation Studies . . . . . . . . . . . . . . . . . . . . . . . . . . . . . . . . . . . . . . . . . . 366.2 Chromosome Aberration Studies . . . . . . . . . . . . . . . . . . . . . . . . . . . . . 38
6.2.1 In Vitro Assays . . . . . . . . . . . . . . . . . . . . . . . . . . . . . . . . . . . . . . 386.2.2 In Vivo Assays . . . . . . . . . . . . . . . . . . . . . . . . . . . . . . . . . . . . . . 40
6.3 Other Indicators of DNA Damage or Mutagen Exposure . . . . . . . . . . . 416.4 Mutagenicity Studies in Plants . . . . . . . . . . . . . . . . . . . . . . . . . . . . . . . 426.5 Metabolites of Atrazine . . . . . . . . . . . . . . . . . . . . . . . . . . . . . . . . . . . . . 42
6.5.1 Diaminochlortriazine metabolite (DACT – 6-chloro-1,3,5-triazine-

DRAFT: DO NOT CITE OR QUOTE
3
2,4-diamine; didealkyl atrazine) . . . . . . . . . . . . . . . . . . . . . . . . . 436.5.2 G-28279 metabolite - 6-chloro-N-ethyl-1,3,5-triazine-2,4-diamine;
deisopropyl atrazine . . . . . . . . . . . . . . . . . . . . . . . . . . . . . . . . . 436.5.3 G-30033 metabolite - 6-chloro-N-(1-Methyl ethyl)-1,3,5-triazine-
2,4-diamine; deethyl atrazine . . . . . . . . . . . . . . . . . . . . . . . . . . 436.5.4 Hydroxy-atrazine, G-34048 . . . . . . . . . . . . . . . . . . . . . . . . . . . . 44
6.6 Close Structural Analogues: Simazine and Propazine . . . . . . . . . . . . . 456.6.1 Simazine . . . . . . . . . . . . . . . . . . . . . . . . . . . . . . . . . . . . . . . . . . . 466.6.2 Propazine . . . . . . . . . . . . . . . . . . . . . . . . . . . . . . . . . . . . . . . . . . 47
6.7 Summary and Discussion of Mutagenicity Data . . . . . . . . . . . . . . . . . . 48
7 Estrogenic Activity . . . . . . . . . . . . . . . . . . . . . . . . . . . . . . . . . . . . . . . . . . . . . 497.1 In Vivo Assays . . . . . . . . . . . . . . . . . . . . . . . . . . . . . . . . . . . . . . . . . . . . 497.2 In Vitro Assays . . . . . . . . . . . . . . . . . . . . . . . . . . . . . . . . . . . . . . . . . . . 537.3 Special Carcinogenicity Bioassay Study (Morseth, 1998) . . . . . . . . . . 577.4 Noncancer Effects Relevant to Estrogenic Activity . . . . . . . . . . . . . . . . 58
7.4.1 Subchronic Dog Studies . . . . . . . . . . . . . . . . . . . . . . . . . . . . . . . 597.4.2 Subchronic Rat Studies . . . . . . . . . . . . . . . . . . . . . . . . . . . . . . . 617.4.3 Chronic Dog Studies . . . . . . . . . . . . . . . . . . . . . . . . . . . . . . . . . 627.4.4 Multi-Generation Reproduction Studies . . . . . . . . . . . . . . . . . . . 637.4.5 Rat Developmental Toxicity Studies . . . . . . . . . . . . . . . . . . . . . . 657.4.6 Rabbit Developmental Toxicity Studies . . . . . . . . . . . . . . . . . . . 66
7.5 Overall Conclusions of Estrogenic Activity Data . . . . . . . . . . . . . . . . . . 68
8 Structure Activity Relationship . . . . . . . . . . . . . . . . . . . . . . . . . . . . . . . . . . . 69
9 Hormonal and Estrus Cyclicity Studies . . . . . . . . . . . . . . . . . . . . . . . . . . . . 749.1 Rat Reproductive Aging Process . . . . . . . . . . . . . . . . . . . . . . . . . . . . . 76
9.1.1 Sprague-Dawley . . . . . . . . . . . . . . . . . . . . . . . . . . . . . . . . . . . . . 769.1.2 Fischer-344 . . . . . . . . . . . . . . . . . . . . . . . . . . . . . . . . . . . . . . . . 799.1.3 Summary of the Reproductive Aging Process in SD and F-344 Rats
. . . . . . . . . . . . . . . . . . . . . . . . . . . . . . . . . . . . . . . . . . . . . . . . . . 809.1.4 Strain Differences in Reproductive Aging and Mammary Tumors
. . . . . . . . . . . . . . . . . . . . . . . . . . . . . . . . . . . . . . . . . . . . . . . . . . 839.1.5 Studies in Which Premature Aging Was Artificially Delayed or
Induced and How Mammary Tumor Incidences Were Affected . 869.1.6 The Correlation Between Increased Days in Estrus and Mammary
Tumors in a Two-Year Bioassay . . . . . . . . . . . . . . . . . . . . . . . . 879.1.7 Summary and Discussion of the Hypothesis that Mammary Tumors
Are Induced by the Reproductive Aging Process . . . . . . . . . . . . 88
DRAFT: DO NOT CITE OR QUOTE
4
9.2 The Hypothesis that Atrazine Exposure Induces an Early Onset ofAttenuated LH Surge, Increased Days In Estrus, and Prolonged Exposureto Estradiol . . . . . . . . . . . . . . . . . . . . . . . . . . . . . . . . . . . . . . . . . . . . . . 899.2.1 Time-to-Tumor . . . . . . . . . . . . . . . . . . . . . . . . . . . . . . . . . . . . . . 909.2.2 Conclusions Of The Time-to-Tumor Data . . . . . . . . . . . . . . . . . . 989.2.3 Alterations in the Ovary and Vagina . . . . . . . . . . . . . . . . . . . . . 989.2.4 Summary And Discussion From The Ovarian Histomorphology and
Estrous Cycle Measurements In F-344 and SD Strains . . . . . . 1099.2.5 Serum Estradiol and Prolactin Levels . . . . . . . . . . . . . . . . . . . 1119.2.6 Summary And Discussion Of The Hormone Measurements and
Histomorphologic Alterations In F-344 And SD Strains . . . . . . 1179.2.7 Preovulatory LH Levels . . . . . . . . . . . . . . . . . . . . . . . . . . . . . . 1219.2.8 Summary And Discussion Of The LH Surge Studies . . . . . . . 128
9.3 The Site of Action for Atrazine Attenuation of the LH Surge . . . . . . . . 1309.4 The Data Examining the Association Between Atrazine Exposure and An
Attenuated Proestrus Afternoon LH Surge, Increased Days and Estrusand a Prolonged Exposure to an Elevated Level of Estradiol . . . . . . . 1329.4.1 Atrazine Exposure Results in an Earlier Onset of Increased Days in
Estrus . . . . . . . . . . . . . . . . . . . . . . . . . . . . . . . . . . . . . . . . . . . . 1339.4.2 Atrazine Exposure Results in an Earlier Onset of Increased Serum
Estradiol Levels . . . . . . . . . . . . . . . . . . . . . . . . . . . . . . . . . . . . 1339.4.3 Atrazine Exposure Results in an Earlier Onset of Attenuated LH
Surges . . . . . . . . . . . . . . . . . . . . . . . . . . . . . . . . . . . . . . . . . . . 1349.4.4 Atrazine Exposure Results in an Earlier Tumor Onset . . . . . . . 134
9.5 Pituitary Adenomas . . . . . . . . . . . . . . . . . . . . . . . . . . . . . . . . . . . . . . . 1359.5.1 Onset of Pituitary Alterations Following Atrazine Exposure . . . 1359.5.2 Role of Early Onset of Pituitary Alterations in Mammary
Carcinogenesis . . . . . . . . . . . . . . . . . . . . . . . . . . . . . . . . . . . . . 1369.5.3 Pathogenesis of Pituitary Alterations . . . . . . . . . . . . . . . . . . . . 1379.5.4 Summary and Conclusion for Pituitary Alterations . . . . . . . . . . 138
DRAFT: DO NOT CITE OR QUOTE
5
List of Tables
Table 4-1. Odds Ratios (OR), Risk Ratio (RR) or Correlation Coefficient . . . . . . . . . 13
Table 5-1. Summary of Female Mammary Tumor Incidence in Two- and One-Year Rodent Bioassays Using Atrazine . . . . . . . . . . . . . . . . . . . . . 15
Table 5-2. Summary of Female Pituitary Adenoma Incidence in Two- and One -Year Rodent Bioassays Using Atrazine . . . . . . . . . . . . . . . . . . . . 16
Table 5-3. Mammary Tumor Incidence in the Mayhew Study (as determined by US EPA, 1988) . . . . . . . . . . . . . . . . . . . . . . . . . . . 18
Table 5-4. Mortality in the Mayhew Study (as determined by US EPA, 1988) . . . . . 18
Table 5-5. Pituitary â-Adenoma Incidences by Timepoint in Thakur Serial Sac, 1991a . . . . . . . . . . . . . . . . . . . . . . . . . . . . . . . . . . . 20
Table 5-6. Female Mammary Gland Tumor Incidences in the SD Terminal Sacrifice Protocol (Thakur, 1992a)(calculated using Cox-Tarone and Gehan-Breslow tests) . . . . . . . . . . . . . . . . . . . . . 22
Table 5-7. Mammary Gland Tumor Incidence in Intact Animals in Morseth, 1998 Study . . . . . . . . . . . . . . . . . . . . . . . . . . . . . . . . . . 24
Table 5-8. Number Of Animals With Mammary Tumors In The Pettersen and Turnier, 1995 Study . . . . . . . . . . . . . . . . . . . . . . . . . . 26
Table 5-9. Female Mammary Tumor Incidence In F-344 Terminal Sacrifice Protocol In The Thakur Terminal Sacrifice Study (1992b) . . . . . . . . . . . . . . 29
Table 5-10. Mammary Tumors In Males in Pinter et al., 1990 . . . . . . . . . . . . . . . . . . 31
Table 5-11. Mammary Gland Fibroadenomas in MaleF-344 Rats by 12 Week Time Periods (Solleveld, 1984) . . . . . . . . . . . . . . . . . . . . . . 32
Table 7-1. In vitro and in vivo Hormonal Studies with Atrazine . . . . . . . . . . . . . . . . . 50

DRAFT: DO NOT CITE OR QUOTE
6
Table 8-1. Results of Two-Year Bioassays with Alkylamino, alkoxy, and alkythio-triazine Compounds . . . . . . . . . . . . . . . . . . . . . . . . . . . . . . . . . 70
Table 8-2. Results of Two-Year Bioassays with Chloro-triazine Compounds . . . . . . 70
Table 9-1. Mammary Tumor and Pituitary Adenoma Historical Control Incidence Data For Sprague-Dawley Females At 24 Months . . . . . . . . . . . . 75
Table 9-2. Relationship of Reproductive Aging and Mammary Tumor Incidence In Various Rodent Strains . . . . . . . . . . . . . . . . . . . . . . . 85
Table 9-3. Time to Mammary Tumor in the Female SD Rat- Thakur (1992a) Terminal Sacrifice Protocol . . . . . . . . . . . . . . . . . . . . . . . . . 91
Table 9-4. Time to Mammary Tumor in the Two-year Morseth (1988) Study . . . . . . 92
Table 9-5. Time to Mammary Tumor with Simazine in SD rats (McCormick et al., 1988) . . . . . . . . . . . . . . . . . . . . . . . . . . . 93
Table 9-6. Time to Mammary Tumor with Propazine in SD rats (Jessup, 1980a) . . . 94
List of Figures
Figure 8-1. Structures of Atrazine and Major Metabolites . . . . . . . . . . . . . . . . . . . . . 71
Figure 8-2. Structure of the Amino-s-Triazine Ring . . . . . . . . . . . . . . . . . . . . . . . . . . 72
Figure 8-3. Structure of Chlorsulfuron . . . . . . . . . . . . . . . . . . . . . . . . . . . . . . . . . . . . 72
Figure 8-4. Structures of Simazine and Propazine . . . . . . . . . . . . . . . . . . . . . . . . . . 73
Figure 9-1. Summary of the Reproductive Aging Process in Different Rat Strains . 82

DRAFT: DO NOT CITE OR QUOTE
7
Chapter 4
4 Human Epidemiological Studies
Several epidemiologic studies have examined cancers among populations withexposures relevant to the assessment of atrazine, especially among farmers or farmresidents (Table 4-1). Most are case control studies, although others include ecologicinvestigations and a worker mortality study associated with triazine manufacturing.
4.1 Colon Cancer
Associations between herbicide use by farmers and colon cancer inKansas was investigated in a case-control study (Hoar et al., 1985). Startingwith 57 cases of colon cancer and 948 controls, the odds ratio (OR) for thesubset using triazine herbicides was 1.4 (95% C.I. 0.2-7.9). The sample size inthis group was very small with only two cancer cases with confirmed exposure totriazines and 43 controls. The study author stated that the data did not supportan association between colon cancer and herbicide exposure
An ecologic study of ecodistricts in Canada compared triazine exposuresand cancer incidences (Van Leeuwen et al., 1999). Association of triazineexposure with several cancers, including colon, were examined. Significantnegative associations were found in both sexes (p = 0.041 in females and 0.006in males).
4.2 Non-Hodgkins Lymphoma
Zahm et al. (1993b) pooled results of three case-referent studiesconducted in three midwestern states that investigated atrazine exposure in thedevelopment of non-Hodgkins lymphoma (NHL). Starting with 993 males withNHL and 2918 controls, persons were queried as to their pesticide exposures. An OR = 1.4 (95% CI 1.1-1.8) was found for atrazine use and NHL. However,when adjustments were made for use of 2,4-dichloroacetic acid andorganophosphate use, the OR = 1.2 (0.9-1.7). The authors concluded that therewas essentially no risk of NHL attributable to farm use of atrazine.

DRAFT: DO NOT CITE OR QUOTE
8
NHL was investigated among women who lived or worked on a farm ineastern Nebraska (Zahm et al., 1993a). The OR for those who reported thatthey lived on a farm where atrazine was used was 1.4 (95% CI 0.6 - 3.0) with 11cases and 31 controls. For those women who reported having personally usedatrazine the OR = 2.2 (0.1 - 31.5) with only one case and two controls. Cyanazine was also investigated and the OR for NHL and those who reportedusing cyanazine was 1.3 ( 0.3 - 4.5) with four cases and 12 controls. The studyauthor noted that there were too few subjects in any of these analyses toadequately assess associations.
Correlations were made between pesticide use (1993) and NHL incidence(1988-1992) among California counties (Mills, 1998). There were negativecorrelations for white males and females and Hispanic males; the correlationwas positive for Hispanic females (0.12), but it was not statistically-significant.
An ecologic study of ecodistricts in Canada compared triazine exposuresand cancer incidences (Van Leeuwen et al., 1999). Association of triazineexposure with several cancers, including NHL, were examined. No associationwas found in females and a negative association was found in males.
A mortality study of workers in two triazine manufacturing plants that wassupplied to EPA (Delzell and Sathiakumar, 1996) did not find any significantexcesses of deaths for any disease category. There were, however, two casesof NHL in plant workers - one of whom was relatively young (31 years). Thesetwo cases do not provide evidence of an association between atrazine exposureand NHL, but do indicate that further follow-up of workers in these triazinemanufacturing plants would be helpful.
4.3 Soft Tissue Sarcoma
A population-based case-control study of soft-tissue sarcoma (STS) inKansas demonstrated that there was no increased risk among farmers (Hoar etal., 1986). The lack of association persisted when years of herbicide use orfrequency of herbicide use were considered. Analyses examining atrazinespecifically were not conducted.
A study previously described above (Mills, 1998) examined associationsbetween pesticide use and STS. Positive correlations were not noted for eithermales or females for atrazine use and STS.

DRAFT: DO NOT CITE OR QUOTE
9
4.4 Other Hematologic Cancers: Hodgkins Disease, Leukemia, MultipleMyeloma
Hoar et al. (1986) examined associations between herbicide use andHodgkins disease (HD). An OR for atrazine exposure and HD was not reportedin the study, but for herbicide use in general the OR was 0.9 (95% CI 0.5 - 1.5). The study author did not consider herbicide exposure to be associated with HD.
Association of pesticide exposure (including atrazine and cyanazine) toleukemia was investigated in a population-based case-control study of adultwhite men in Iowa and Minnesota (Brown et al., 1990). The OR in those whoreported mixing, loading and applying atrazine or cyanazine was 1.0 (0.6 - 1.5)for atrazine and 0.9 (0.5 - 1.6) for cyanazine.
Mills (1998) also examined associations between pesticide use andleukemia. Positive correlations were not noted for either Hispanic or whitemales or females for atrazine use and leukemia.
Triazine exposure and multiple myeloma in Iowa farmers wasinvestigated in a case-control study by Burnmeister (1990). The OR for triazineuse and multiple myeloma was 1.29 and was not significant.
4.5 Ovarian Cancer
A case-control study of epithelial ovarian cancer was conducted in womanbetween the ages of 20 and 69 who lived in a province in Italy where triazineherbicides are used in farming (Donna et al., 1989). A relative risk (RR) of 2.7(95% CI 1.0 - 6.9) was found for subjects who reported that they definitely hadbeen exposed to triazine herbicides; the sample size in this subgroup was sevencases and seven controls. The authors considered that there was some risk ofovarian cancer among women who were exposed to triazines.
An ecologic study of ecodistricts in Canada compared triazine exposuresand cancer incidences (Van Leeuwen et al., 1999). Association of triazineexposure with several cancers, including ovarian, were examined. Noassociation between atrazine exposure and ovarian cancer was found.

DRAFT: DO NOT CITE OR QUOTE
10
4.6 Breast Cancer
An ecologic study of counties in Kentucky compared measures of triazineexposures (ground and surface water measurements, and acres of land plantedwith corn and triazine application rates) with state cancer incidences (Kettles etal., 1997). For the years 1993-1994, the OR = 1.14 (95% CI 1.08 - 1.19) forcounties with medium triazine exposure, compared with OR = 1.2 (1.13 - 1.28)for high exposure counties. Although only slightly greater than 1.0, these OR'swere still statistically-significant (p<0.0001).
4.7 Prostate Cancer
Pounds of atrazine applied in California counties during the calendar year1993 were compared with state cancer incidences (Mills, 1998). A statistically-significant correlation coefficient of 0.67 was obtained for blacks and prostatecancer. The correlation coefficients for whites, Asians and Hispanics were notstatistically significant.
4.8 Stomach Cancer
An ecologic study of ecodistricts in Canada compared triazine exposuresand cancer incidences (Van Leeuwen et al., 1999). Association of triazineexposure with several cancers, including stomach, were examined. A significantpositive association was found in both sexes (p = 0.242 in females and 0.046 inmales).
4.9 Summary
Colon cancer does not appear to be associated with triazine exposure assuggested by a non-significant OR of 1.4 in a single study (Hoar, 1985). Thesample size in this study for triazine use was, however, very small. An ecologicstudy found negative associations between atrazine exposure and colon cancerin both sexes (Van Leeuwen et al., 1999).
Soft tissue sarcoma does not appear to be associated with atrazineexposure. The correlation coefficient from Mills, 1998 was not significant andthe OR from Hoar et al. (1986) was 0.9. Hodgkins disease does not appear toassociated with atrazine as indicated by an OR of 0.9 in Hoar et al. (1986).

DRAFT: DO NOT CITE OR QUOTE
11
Two studies examined an association of atrazine to leukemia. One foundan OR of 1.0 (Brown, et al., 1990) and the other found a correlation coefficientwhich was not significant (Mills, 1998). Leukemia does not appear to beassociated with atrazine exposure.
Triazine exposure and multiple myeloma do not appear to be associated.The OR in a single study was 1.29 (Burnmeister, 1990). This OR was notsignificant.
The results in regards to non-Hodgkins lymphoma (NHL) are mixed, butoverall indicative of a lack of association of triazines with NHL. One study founda significant association with an OR of 2.5 (Hoar, et al., 1985). When the datafrom this study is pooled with data from two other studies, a much lower OR of1.4 is found (Zahm, 1993b). The Zahm, 1993b study represents the pooled datafrom three separate studies. Thus, the sample size is quite large -- 130 casesand 249 controls. The positive Hoar et al., 1985 study, by comparison, had 14cases and 43 controls. An OR of 2.2 was found for women who had reportedusing atrazine (Zahm, 1993a). The sample size in this study was very small withonly one case and two controls. A fourth study failed to find any positivecorrelations for either Hispanics or white males or females for atrazine use andNHL (Mills, 1998). The low OR in the pooled study with a large sample size,combined with the lack of positive correlations in Mills, 1998, indicates thatatrazine has not yet been clearly shown to be associated with atrazine. Furtherresearch in this area is desirable though given the positive association seen inHoar, et al., 1985 and the previously described incidence of two cases of NHL inworkers employed at triazine manufacturing plants.
The most clear associations between atrazine and cancer occurs forovary, breast and prostate cancer. Interestingly, all three of these cancers areknown to be hormone-responsive. These associations should not be consideredas conclusive evidence of an association of atrazine with these tumor typesthough.

DRAFT: DO NOT CITE OR QUOTE
12
Two of the associations (breast and prostate cancer) were found inecologic studies. Ecologic studies contain inherent limitations and causal effectscan not be found from ecologic studies. The primary limitation of an ecologicstudy is that chemical exposure can not be confirmed. Exposure inepidemiologic studies can sometimes be uncertain. For example, interview-based studies rely on a persons memory to determine exposure and a recall biasmay be evident. But in ecologic studies exposure is most uncertain. In ecologicstudies the researcher has no idea at all if the persons who contracted cancerhad any exposure at all to the chemical in question. The researcher only knowsthat the person lived in a county in which the chemical was used or lived in acounty which had chemical contamination of the water supplies.
The association with ovarian cancer seen in Donna, et al., 1989, is alsoweakened by confounding variables. The most dramatic weakness in this studyis the small sample size in the "defiantly exposed" group. This group consists ofonly seven cases and seven controls. Furthermore, close examination of thisgroup reveals that it may be even smaller. A description of the exposure of theseven women in the "defiantly exposed" group is included as an appendix to thestudy. Examination of the descriptions in the appendix show that three out of theseven did not actually recall exposures to triazines at all. Rather, these threenoted only that they had worked in fields where herbicides were used, but thatthey could not recall the names of the herbicides. The small sample size limitsof the defiantly exposed group weakens the conclusions from this study.
4.10 Conclusions
The results of the human epidemiology studies do not provide clearevidence of an association between triazines and cancer. Some of the studies,particularly those in which hormone-responsive cancers such as breast, ovaryand prostate, were examined, are suggestive of a possible association. There isalso suggestive evidence of a possible association of triazine exposure andNHL. Further epidemiologic research is needed - especially in the area ofhormone-responsive cancers.

DRAFT: DO NOT CITE OR QUOTE
13
Table 4-1. Odds Ratios (OR), Risk Ratio (RR) or Correlation Coefficient
Study Cancer Risk Measure or CorrelationHoar et al., 1985 Colon Triazines: OR = 1.4 95% CI= 0.2 - 7.9
Hoar et al., 1986 Non-Hodgkinslymphoma1
Triazines: OR = 2.5 95% CI= 1.2 - 5.4
Donna et al., 1989 Ovary Triazines: RR = 2.7 95% CI= 1.0 - 6.9
Brown et al., 1990 Leukemia Atrazine: OR = 1.0 95% CI= 0.6 - 1.5Cyanazine: OR = 0.9 95% CI= 0.5 - 1.6
Burmeister, 1990 Multiplemyeloma
Triazines: OR = 1.3 95% CI not given
Zahm et al., 1993a Non-Hodgkinslymphoma inwomen
Use on farm: OR = 1.4 95% CI= 0.6 - 3.0Personal use: OR = 2.2 95% CI= 0.1 - 31.5
Zahm et al., 1993b Non-Hodgkinslymphoma inmen
Atrazine: OR = 1.4 95% CI= 1.1 - 1.8
Kettles et al., 1997 Breast Triazine exposure Medium: OR = 1.14 95% CI = 1.08 - 1.19 High: OR = 1.2 95% CI = 1.13-1.28
Mills, 1998 Prostate2 Statistically-significant correlation = 0.67between atrazine exposure and prostatecancer in blacks, but not in whites, Hispanicsand Asians
Van Leuwen et al.,1999
Stomach3 Female p= +0.242Male p = +0.046
1Soft tissue sarcoma and Hodgkins disease were also investigated and determined, bythe study author, not to have a significant association with atrazine exposure.
2Leukemia, non-Hodgkins lymphoma, soft tissue, brain and testis cancer wereexamined, but a significant correlation was seen only with prostate cancer.3 Bladder, colon, brain, NHL and ovary cancer were also examined, but either noassociation or a negative association was seen in each case.

DRAFT: DO NOT CITE OR QUOTE
1Data from the studies referred to here as Thakur, 1991a, Thakur, 1991b, Thakur1992a and Thakur 1992b, have been published in the open literature as Wetzel et al.1994.
14
Chapter 5
5 Chronic Rodent Bioassay Studies
The carcinogenicity of atrazine in the female Sprague-Dawley (SD) rat has beenconfirmed in several two-year bioassays. These studies show that atrazine exposureresults in an increased incidence and an early onset of mammary tumors in female SDrats (Mayhew et al., 1986; Thakur, 1991a1; Thakur, 1992a; Morseth, 1998; Pettersenand Turnier, 1995). No tumor response is seen in SD male rats, however.
A two-year bioassay in both sexes of the mouse was negative forcarcinogenicity, as were two-year bioassays in male and female F-344 rats (Hazeltteand Green, 1987; Thakur, 1991b; Thakur, 1992b).
Table 5-1 displays summaries of the mammary tumor incidence and onset in allthe rodent bioassays that have been submitted to the Agency and also a study from theopen literature (Pinter et al., 1990). Additional details concerning these studies can befound in the discussion that follows. Appendix Table 1 also summarizes in furtherdetail the results from the studies performed in the SD rat.
Table 5-2 displays summaries of pituitary adenoma incidences in all the rodentbioassays that have been submitted to the Agency. Pituitary tumor onset is difficult todetermine as pituitary tumors are not palpable as are mammary tumors. However, in aserial sacrifice study, an early onset of pituitary tumors can be discerned in female SDrats (Thakur, 1991a). Only female pituitary tumor incidence is displayed in Table 5-2.

DRAFT: DO NOT CITE OR QUOTE
15
Table 5-1. Summary of Female Mammary Tumor Incidence in Two- and One-Year Rodent Bioassays Using Atrazine
StudySpecies/
StrainDuration
Mammary TumorIncidence
Mammary Tumor Onset
Mayhew et al.,1986
Rat/SD 2 year Statistically-significant increase infemale carcinomas at 3.5mg/kg/day when adjusted forsurvival
Not determined in this study
Thakur, 1991a Rat/SD 2- year withserialsacrifices
A significant positive trend forfibroadenomas is seen.
The percentage of carcinomasoccurring in the first year of the studywas 0 in controls, 33% at 4.23mg/kg/day, and 50% at 26.23mg/kg/day.
Thakur, 1992a Rat/SD 2- year No statistically-significantincreases in femalefibroadenomas or carcinomasseen at either 3.79 or 24.01mg/kg/day
The percentage of carcinomas andadenomas occurring in the first year ofthe study in controls was 0% while at3.79 mg/kg and 23.01 mg/kg/day 27.3and 33.3% of the carcinomasappeared in the first year of the study.
Morseth, 1998 Rat/SD, bothOVX andintact
2-year No tumors seen in OVX animals.Carcinoma, and fibroadenomaincidences at 3.1 mg/kg/day areincreased two-fold over controlvalues in intact animals.
The mean week of onset forcarcinomas and adenomas in controlswas 72.6 while the mean week ofonset for the 1.5, 3.1, 4.2 and 24.4mg/kg/day groups was 77.2, 78.6,64.4 and 64.8.
Pettersen andTurnier, 1995
Rat/SD 1-year six carcinomas/adenomas andfour fibroadenomas are seen atthe 23.9 mg/kg/day groupcompared to one carcinoma andtwo fibroadenomas in the controlgroup.
The increased incidence of tumors atone year indicates an earlier onset.
Hazelette andGreen, 1987
Mouse/CD-1 91 weeks No increase in any tumor in eithersex with exposures up to 386mg/kg/day for males and 483mg/kg/day for females
Not altered in Atrazine exposedanimals
Thakur, 1991b Rat/F-344 2- year withserialsacrifices
No increase in any tumor in eithersex with exposures up to 34mg/kg/day in both
Not altered in Atrazine exposedanimals
Thakur, 1992b Rat/F-344 2-year No increase in tumors of any kindin either sex with exposures up to20 mg/kg/day for males and 26mg/kg/day for females
Not altered in Atrazine exposedanimals
Pinter et al.,1990
Rat/F-344 Lifetime Statistically-significant increase inmale benign mammary tumors
Increased survival in dose groupsversus controls resulted in delayedtime of onset

DRAFT: DO NOT CITE OR QUOTE
16
Table 5-2. Summary of Female Pituitary Adenoma Incidence in Two- and One -Year Rodent Bioassays Using Atrazine
StudySpecies/
StrainDuration
Pituitary Adenoma Incidence by Dose Group (doses in mg/kg/day)
Mayhewet al., 1986
Rat/SD 2 year Control= 47/68 (69%); 0.5 = 41/63 (65%); 3.5 = 49/68 (72%);25= 47/65 (72%); 50= 35/63 (56%)
Thakur,1991a
Rat/SD 2- yearwith serialsacrifices
Control = 22/70 (31%); 4.23 = 16/70 (23%); 26.23 = 20/70 (29%)
Thakur,1992a
Rat/SD 2- year Control = 43/58 (74%); 3.79 = 45/58 (78%); 23.01 = 46/60 (77%)
Morseth,1998
Rat/SD,both OVXand intact
2- year OVX - Control = 42/80 (53%); 1.5= 39/80 (49%); 3.1 = 35/80 (44%); 4.2 = 42/80 (53%); 24.4 = 41/80 (51%) Intact - Control = 56/80 (70%); 1.5= 60/80 (75%); 3.1 = 52/80 (65%); 4.2 = 56/80 (70%); 24.4 = 54/80 (68%)
Petersen andTurnier, 1995
Rat/SD 1-year Control= 2/55 (4%); 0.8 = 5/55 (9%); 1.7 =6/55 (11%); 2.8 = 4/55 (7%); 4.1 = 1/55 (2%); 23.9 =5/55 (9%)
Hazelette andGreen, 1987
Mouse/CD-1 91 weeks Control= 0/60; 1.6 = 0/60; 47.4 = 0/60; 246.9 = 3/60 (5%); 482.7= 0/60
Thakur,1991b
Rat/F-344 2- yearwith serialsacrifices
Control= 9/67 (13%); 0.68 = 6/69 (9%); 4.82 = 7/65 (11%), 14.05= 5/66 (8%); 34.33 = 5/67 (7%)
Thakur,1992b
Rat/F-344 2-year Control = 22/60 (37%); 0.49 = 26/60 (43%), 3.43 = 20/58 (34%);9.87= 19/59 (32%); 20.17 = 13/59 (22%)
Pinter et al.,1990
Rat/F-344 Lifetime Control = 32/41 (78%); 18.75 = 23/43 (53%); 37.5 = 35/50 (70%)
5.1 Mayhew et al., 1986

DRAFT: DO NOT CITE OR QUOTE
17
The initial study that raised concerns about the possible carcinogeniceffects of atrazine exposure was a carcinogenicity study conducted in male andfemale Sprague-Dawley rats at dietary dose levels of 0, 10, 70, 500 or 1000 ppm(0, 0.5, 3.5, 25 or 50 mg/kg/day). The Maximum Tolerated Dose (MTD) waslikely exceeded in this study at the 1000 ppm dose in females. Mortality wassignificantly increased from 49% mortality at 104 weeks in the controls to 75%mortality at 104 weeks in females of the 1000 ppm group (see Table 5-4). Terminal body weight was also significantly decreased in 1000 ppm females inthis study. There was a 27.2% decrease in group mean body weight (p<0.01) inthe 1000 ppm females compared to controls. Male survival in the 1000 ppmgroup was significantly increased at 1000 ppm compared to controls, but bodyweight was significantly decreased compared to controls - 18.7% less thancontrols at 104 weeks. Based on the decreased body weight and increasedmortality seen in females, and the decreased body weight seen in males, 1000ppm is deemed to exceed the MTD of Atrazine in this strain of rats. Thesecond-highest dose in this study, 500 ppm, likely is very close to the MTD. Male body weight at this dose is reduced 8.2% compared to controls at 104weeks while male survival is not significantly altered compared to controls. Female survival is not significantly altered at this dose compared to controls, butbody weight is reduced by 18.9% (p<0.05) compared to controls at 104 weeks. Based on the lack of significant effect in males seen at the 500 ppm dose andthe uncertain effect seen in females (lack of a significant increase in mortalitywith a significant decrease in body weight) it seems likely that 500 ppm is veryclose to the MTD for atrazine in this strain of rat.
The conclusions drawn about the MTD of atrazine are important giventhat 1000 ppm exceeds the MTD and 500 ppm is assumed to be very close tothe MTD. Thus, subsequent two-year carcinogenicity studies have used a doseof 400 ppm as the high dose to have the high dose be slightly below the MTD.
The mammary tumor incidences seen in this study are reported below inTable 5-3 and mortality is shown in Table 5-4.

DRAFT: DO NOT CITE OR QUOTE
18
Table 5-3. Mammary Tumor Incidence in the Mayhew Study (as determined by US EPA, 1988)
Tumor TypeDose (mg/kg/day)
Control 0.5 3.5 25 50
adenocarcinomas/carcinosarcomascombined
15/8817%
0.000**
16/6724%0.39
27/6939%
0.024*
27/6840%
0.019*
45/6051%
0.000**
adenomas andfibroadenomascombined
20/8823%0.446
24/6537%0.110
21/6930%0.373
21/6831%0.373
20/8922%0.468
NOTE: Significance for the trend is indicated at control. Significance of pairwisecomparison vs. controls is noted at dose group.
Incidence values are number of tumor bearing animals over number of animals atrisk
*1p< 0.05; **p<0.01 as indicated by Peto Prevalence Test
Table 5-4. Mortality in the Mayhew Study (as determined by US EPA, 1988)
Dose (mg/kg/day)
Control 0.5 3.5 25 50
Mortality atterminalsacrifice
34/5949%**
39/7056%
40/7057%
44/7063%
52/6975%**
NOTE: Significance for the trend is indicated at control. Significance ofpairwise comparison noted at dose group. Statistical test used are cox's or Generalized Krushkal-Wallis.
**p<0.01

DRAFT: DO NOT CITE OR QUOTE
19
A type of statistical analysis that examines tumor incidence and mortalityis the Peto Prevalence test. The results of this test are displayed in Table 5-3. The results of this test showed that for the 70, 500 and 1000 ppm groups therewas a statistically-significant (SS) pairwise increase in incidence of mammaryadenocarcinomas and carcinosarcomas combined at 70, 500 and 1000 ppm,and that there was a dose-related trend for these tumors that was also SS (p<0.01). The study authors of the Mayhew report also conducted Cox-Tarone andGehan-Breslow tests to examine tumor incidence in light of the decreasemortality in the females. The results from these tests were similar to the resultsfrom the Peto test.
5.2 Thakur Studies
These are four studies - two using the SD strain and two using F-344strain. These studies consisted of both terminal (all animals sacrificed aftertwo-years exposure) and serial sacrifice (10 animals per group sacrificed atvarying timepoints) protocols. The studies using the SD strain are discussedbelow while the studies with the F-344 strain are discussed in section 5.6Appendix Table 2 displays summaries of the study design for these studies.
5.2.1 Serial Sacrifice Protocol (Thakur, 1991a)
Seventy SD female rats (no males were used) were exposedthrough the diet to doses of atrazine (97%) at 0, 70 and 400 ppm (0, 4.23and 26.23 mg/kg/day) for two years. Ten females per dose weresacrificed at one, three, nine, 12, 15, 18 and 24 months.
Mortality was increased in a dose-dependent manner. There werefive unscheduled deaths in the control group, six in the 70 ppm group,and eight at 400 ppm. Using the Gehan-Breslow test there was astatistically- significant (SS) negative trend for survival (survivaldecreased as the dose increased). Another statistical test - theCox-Tarone test - did not indicate a significant trend in either direction. Astatistically-significant reduction in body weights were found at severaltimepoints in the 400 ppm group compared to controls.

DRAFT: DO NOT CITE OR QUOTE
20
The results of this study is significant in regards to pituitary tumors. Because pituitary tumors cannot be detected by palpation, a serialsacrifice study is the most appropriate way to determine onset for pituitarytumors. Pituitary tumor incidences by timepoint are displayed in Table5-5, below. The hormonal basis for early onset of pituitary tumors isdiscussed in section 9.2.6
Table 5-5. Pituitary â-Adenoma Incidences by Timepoint in Thakur Serial Sac, 1991a
Sacrificetime (mo.)
Control 4.23 mg/kg/day 26.63 mg/kg/day
1 0 0 03 0 0 09 0 0 2
12 2 2 615 5 3 418 9 5 624 6 6 2
0-12 2 2 80-24 22 16 20
NOTE: Ten animals in each group. Unscheduled sacrificeanimals are included in this table

DRAFT: DO NOT CITE OR QUOTE
21
5.2.2 Terminal Sacrifice Protocol (Thakur, 1992a)
Sixty SD females (no males were used) were exposed through thediet to doses of atrazine of 0, 70 and 400 ppm (0, 3.79 and 23.01mg/kg/day) for two years (Appendix Table 2 summarizes the protocolused for the Thakur studies with both SD and F-344 rats). Mortality washigh in the controls and increased in a dose-related manner. Mortalitywas 48% in controls, 58% in the 70 ppm group, and 63% in the 400 ppmgroup. Two survival tests were contradictory in determining whether or notthis increase in mortality was significant. Analysis with theGehan-Breslow test showed a negative trend in survival with dose(increased mortality with increasing dose) while a Cox-Tarone test foundthat the increases in mortality were not significant. Group mean bodyweights were significantly decreased, compared to controls, at the 400ppm group as early as four weeks and remained significantly decreasedup to, and including, week 76. Body weight gains were significantlydecreased for the period from study initiation to week 76. Both absolutebody weight at week 104 and body weight gain from week five to 104 ofthe 400 ppm group, were lower than controls, but notstatistically-significantly. Group mean food consumption in the 400 ppmgroup was decreased compared to controls for the first 13 weeks of thestudy. After 13 weeks though, there was no significant difference. Theonly finding at gross necropsy that may have been related to compoundexposure was an increase in enlarged spleens in the 400 ppm dosegroup. The control and 70 ppm groups were observed to have five andthree animals with enlarged spleens, respectively, while the 400 ppmgroup had 15. This finding was not observed in the Mayhew study, in theThakur terminal sacrifice study, or in any other bioassays that followedthe Thakur series of studies.
Histopathology revealed that mammary and pituitary neoplasmswere a common occurrence. Table 5-6 displays mammary tumorincidence data by tumor type. There was not a statistically-significantincrease in fibroadenomas or carcinomas at the doses tested, comparedto controls. This is true whether or not mortality is taken into accountthrough Cox or Gehan-Breslow tests. Table 5-6 displays the p valuescalculated by the study authors for mammary tumor incidences.
Table 5-6. Female Mammary Gland Tumor Incidences in

DRAFT: DO NOT CITE OR QUOTE
22
the SD Terminal Sacrifice Protocol (Thakur, 1992a)(calculated using Cox-Tarone and Gehan-Breslow tests)
Dose (mg/kg/day)
Control 3.79 23.01
Fibroadenoma
p valueCox-TaroneGehan- Breslow
39/60 (65%)
30/59 (51%)
0.91410.6401
41/60 (68.3%)
0.10700.2114
Carcinoma
p valueCox-TaroneGehan- Breslow
17/60 (28%)
13/59 (22%)
0.83160.7613
22/60 (33.6%)
0.1590 0.0810
5.3 Morseth, 1998
Atrazine (97.1%) was administered to 800 female Sprague-Dawley rats.The rats were divided into two groups of 400 each. One group wasovarectomized (OVX) while the other was left intact. Atrazine was mixed withthe diet at dose levels of 0 (control) 25, 50, 70 and 400 ppm (0, 1.5, 3.1, 4.2,24.4 mg/kg/day for intact animals and 0, 1.2, 2.5, 3.5, and 20.9 mg/kg/day forOVX animals) for two years. There were 80 females at each dose level - 20 fora 12-month sacrifice and 60 for a 24-month sacrifice.
The trend for survival was statistically-significantly (SS) decreased in thedosed groups compared to the controls. Survival was as follows: 43.3% incontrols; 31.7% - 25 ppm; 28.8% - 50 ppm; 31.6% - 70 ppm; 21.7% 400 ppm. Body weight was SS reduced in the first half of the study in the 400 ppm group(other groups were not significantly altered), but by the end of the study bodyweights were similar to control values.

DRAFT: DO NOT CITE OR QUOTE
23
Neoplastic histopathological findings were mostly limited to the pituitaryand the mammary gland. Neither intact nor OVX dosed animals showed anincrease in pituitary tumors compared to their respective controls, but intactanimals did show a 20-30% greater incidence of pituitary adenomas comparedto OVX animals.
There were few mammary tumors in the interim sacrifice animals, which isnot surprising given that these animals were sacrificed after only one-year. Excluding the interim sacrifice and looking only at those animals that weresacrificed at 24 months and those that died prematurely, there was an increasein mammary tumor incidence at all intact dose groups compared to controls. Looking at carcinomas alone incidence values are: 18.3%; 36.7%; 33.9%; 20%;and 41.7% for the control, 25, 50, 70 and 400 ppm dose groups respectively. Fibroadenomas alone were: 26.6%; 40%; 52.5%; 45%; and 40% for the control,25, 50, 70 and 400 ppm dose groups respectively.
Table 5-7 below displays a statistical analysis of mammary tumorincidence in intact animals using a Peto's Prevalence Test. Incidence valuesshown below differ from those described in the paragraph above becauseinterim sacrifice animals are included in the analysis shown in Table 5-8(USEPA, 1999c). A different survival-adjusted statistical analysis (Cox-Tarone)conducted by the study author showed significant pairwise increases at 3.1mg/kg/day for fibroadenomas compared to control, but did not show significantpairwise comparison to control for the 1.5 mg/kg/day group.

DRAFT: DO NOT CITE OR QUOTE
24
Table 5-7. Mammary Gland Tumor Incidence in Intact Animals in Morseth, 1998 Study
Dose (mg/kg/day)
Controls 1.5 3.1 4.2 24.4
Fibroadenoma 16/78(21%)0.233
25/79(32%)0.030*
34/77(44%)0.000**
29/78(37%)0.014*
25/77(32%)0.014*
Carcinoma 12/80(15%)0.002**
18/80(22%)0.112
20/79(25%)0.067
14/80(18%)0.395
27/80(34%)0.007**
Adenoma 0/28 0/24 1/20 (5%) 0/21 0/15
NOTE: Significance for the trend is indicated at control. Significance ofpairwise comparison noted at dose group. Incidence values are number oftumor bearing animals over number of animals at risk.
*p<0.05; **p<0.01
Not a single mammary tumor of any sort was seen in any OVX animal. The lack of mammary tumors in OVX animals provides evidence indicates thatan intact ovary is mandatory for mammary tumorogenesis in the SD female. Theresults found in OVX animals will be discussed more fully in section 7.3. Bi-weekly estrous cycle measurements were also made in this study. Theresults of these measurements are discussed below under section 9.2 EstrousCycle.

DRAFT: DO NOT CITE OR QUOTE
25
5.4 Pettersen and Turnier, 1995
This study exposed female SD rats (55 per group) through the diet todoses of atrazine of 0, 15, 30, 50, 70, or 400 ppm (0, 0.8, 1.7, 2.8, 4.1, or 23.9mg/kg/day). This study was a serial sacrifice protocol in which 10 animals ineach group were sacrificed at 3, six, and nine months and the remaining 25animals were sacrificed at one year following initiation of dosing. Dosingappeared to be adequate, as body weights in the last 10 months of the studywere reduced 8 to 12% in the 400 ppm animals compared to controls. Bodyweight gains over the last 10 months of the study were reduced 11 to 18% in the400 ppm group compared to controls. There were no differences in survivalamong dose groups in this study. No mammary tumors were seen in the three-and six-month sacrifices. There was a significant positive dose-related trend inmammary tumors as well as a significant increase in mammary tumors betweencontrol and 400 ppm animals using a pairwise comparison. Table 5-8 displaystumor incidences from this study.

DRAFT: DO NOT CITE OR QUOTE
26
Table 5-8. Number Of Animals With Mammary Tumors In The Pettersen and Turnier, 1995 Study
Dose(mg/kg/day)
0 0.8 1.7 2.8 4.1 23.9
3 and 6months
0/20 hadtumors
0/20 hadtumors
0/20 hadtumors
0/20 hadtumors
0/20 hadtumors
0/20 hadtumors
9 month F=1/10 C=11
no othertumors
0/10 hadtumors
0/10 hadtumors
F=1/10 C=1/10F=1/10
12 month(TerminalSac)
C=1/25F=1/25A=0/25
C=1/24F=2/24A=0/24
C=0/25F=2/25A=1/25
C=1/25F=0/25A=1/25
C=1/24F=3/24A=1/24
C=5/25F=3/25A=1/25
Total C/A=1/55F=2/55
C/A=2/55F=2/55
C/A=1/55F=2/55
C/A=2/55F=0/55
C/A=2/55F=4/55
C/A=7/55F=4/55
NOTE: Numerator is the number of animals with tumors, denominator is the number ofanimals examined
C=adenocarcinoma; F= fibroadenoma; A = adenoma
1This tumor occurred in an animal scheduled to be sacrificed at 12 months but found deadon study day 218.
5.5 Hazelette and Green, 1987
Atrazine (purity not given) was administered to CD-1 mice through thediet to 59-60 animals/sex/dose, at dose levels of 0,10,300,1500 and 3000 ppm(male/female mean daily dose 0/0, 1.4/1.6, 38.4/47.9, 194.0/246.9, 385.7/482.7mg/kg/day)for 91 weeks. The doses given were adequate as indicated by toxiceffects, such as a decrease in mean body weight gain of both sexes(23.5%/11%, M/F) and an increase in cardiac thrombi in the females, are seen atboth 1500 and 3000 ppm, while no dose-related toxic effects are seen at 10 and300 ppm. There was also an increase in mortality (p < 0.05) in 3000 ppmfemales, but not males, with only 25% of the females surviving versus 39-43% ofthe females surviving in the other female dose groups. At the doses tested,there was not a treatment-related increase in tumor incidence when compared tocontrols.

DRAFT: DO NOT CITE OR QUOTE
27
5.6 F-344 Two-Year Bioassays
5.6.1 Serial Sacrifice Protocol (Thakur, 1991b)
Seventy F-344 rats (females only) per dose were exposed adlibitum to diet that had been mixed with atrazine (97.1%) to theappropriate doses of 0 (negative control), 10, 70, 200 and 400 ppm (0,0.68, 4.82, 14.05, 34.33 mg/kg/day). Ten animals per dose group weresacrificed after approximately one, three, nine, 12, 15, and 18 monthsexposure to the test article.
There was not an increase in mortality due to compound exposure,and there was no increased incidence of clinical signs in dosed animalscompared to controls. The doses tested appeared to be sufficiently highbecause there was a decreased absolute body weight and body weightgain in the 400 ppm group compared to the controls. Group meanabsolute body weight in the 400 ppm group compared to controls wasalso significantly decreased compared to controls at several time pointsthough the final mean body weight was not significantly decreasedcompared to controls. The final group mean body weight for the 400 ppmgroup was 6.6% less than the mean control value. During the course ofthe study the 400 ppm animals gained an average of 116.7 gm comparedto the weight gain in the control group of 133.3 gm (14% less thancontrols). This difference in body weight gain was statistically-significantat a p value of 0.05. There was not an increase in mammary tumors orany other type of tumor at any dose group.

DRAFT: DO NOT CITE OR QUOTE
28
5.6.2 Terminal Sacrifice Protocol (Thakur, 1992b)
Sixty F-344 rats per sex per dose were fed technical grade atrazinethrough the diet at doses of 0 (negative control), 10, 70, 200 and 400 ppm(0, 0.49, 3.43, 9.87 and 20.17 mg/kg/day for males and 0, 0.61, 4.35,12.71, and 26.18 mg/kg/day for females) for two years. Mortality in eithersex was not affected by treatment. Male control mortality was 30% whilemale mortality in the 400 ppm group was 32%. Mortality in the other maledose groups was slightly lower than controls, ranging from 22 to 25%. Female mortality was 22% in the controls and 27% in the 400 ppm group. Female mortality in the other dose groups ranged from 17 to 25%. Bodyweights and body weight gains were adversely affected by compoundexposure, especially at the 400 ppm dose in each sex. Mean group bodyweights were statistically-significantly reduced versus controls at the four,13, 24, 52, 76 and 104 week timepoint in the both the male and female400 ppm group. Percent body weight reductions ranged from 5.1 to 9.3%in the males and 5.3 to 6.4% in the females. Percent body weight gainswere also significantly decreased in both sexes of the 400 ppm group forall the time periods examined - 0-4, 0-13, 0-24, 0-52, 0-76 and 0-104weeks. The range of percent reductions compared to controls was 11.3to 15.9% in males and 10.7 to 17.4% in females. The reduction inpercent body weight gain, compared to controls, in males for the entirestudy (weeks 0-104) was 11.3% and for females it was 11.6%. Meangroup food consumption was significantly decreased (4.8% versuscontrols) for the 0-104 week period in 400 ppm males, but was notsignificantly decreased in females. There were no findings at grossnecropsy that could be attributed to compound exposure and organweights were not altered between control and dosed animals.

DRAFT: DO NOT CITE OR QUOTE
29
The incidence of mammary gland fibroadenomas was increased indosed females compared to controls. This increase was not statistically-significant. Even at its highest dose level the percentage of animals withfibroadenomas was below the historical level for the laboratory where theThakur studies were conducted. There were no increases in mammarytumors of any type in dosed males versus controls. Two out of the 55control males examined at histopathology were found to have a mammarytumor (both were fibroadenomas). Only one out of 54 males in the 10ppm group and one out of 58 in the 400 ppm group were found to havemammary tumors (one fibroadenoma and one carcinoma) while not malesin the 70 and 200 ppm group had a mammary tumor of any type. Therefore, dosing with atrazine did not increase mammary tumorincidence in F-344 males.
Table 5-9. Female Mammary Tumor Incidence In F-344 Terminal Sacrifice Protocol In The Thakur Terminal Sacrifice Study (1992b)
Dose (mg/kg/day)
Control 0.5 3.4 9.9 20.2 HistoricalControl
Fibroadenoma
Unadjusted p value
2/60(3.3%)
0.2514
5/60 (8.3%)
0.2198
5/60 (8.3%)
0.2195
7/60(11.7%)
0.0815
6/59(10.2)
0.1295
Mean = 14.9%Range= 3-23%
Carcinoma
Unadjusted p value
2/60(3.3%)
0.4640
0/60(0%)
0.2479
2/60(3.3%)
0.0907
3/60(5%)
0.5000
2/59(3.4%)
0.6843
Mean = 3.8%Range= 2-15%
NOTE: Historical control data from Hazelton Labs, 1984

DRAFT: DO NOT CITE OR QUOTE
30
5.7 Pinter et al., 1990
The Pinter et al. study exposed Fischer-344 rats of both sexes to atrazine(98.9%) that was mixed in the diet at concentrations of 0, 500 and 1000 ppm. The control groups started with 56 males and 50 females; the 375/500 ppmgroup started with 55 males and 53 females; and the 750/1000 ppm groupstarted with 53 males and 55 females. Unlike most carcinogenicity assayswhere surviving animals are sacrificed after approximately 104 weeks on study,in this study animals were allowed to live out their natural life span, except forfour males and six females that were sacrificed moribund. Table 5-10 displaysthe mammary tumor incidence in males in Pinter et al., 1990.
Table 5-10. Mammary Tumors In Males in Pinter et al., 1990 1
Control 375 ppm 750 ppm
Total number oftumor-bearing males
1/48 1/51 8/53
Total number ofbenign tumors
1/48 1/51 9/53**
Total number ofmalignant tumors
0/48 0/51 1/53
1Data from Table 2 in Pinter et al., 1990. **p<0.01 using Fisher Exact test comparing high dose group tolow dose group.
5.8 Pinter et al., 1990
The Pinter et al. study exposed Fischer-344 rats of both sexes to atrazine(98.9%) that was mixed in the diet at concentrations of 0, 500 and 1000 ppm (the500 and 1000 ppm doses were reduced to 375 and 500 ppm after eight weeks oftreatment due to toxicity). The control groups started with 56 males and 50females; the 375/500 ppm group started with 55 males and 53 females; and the750/1000 ppm group started with 53 males and 55 females. Unlike mostcarcinogenicity assays where surviving animals are sacrificed afterapproximately 104 weeks on study, in this study animals were allowed to live outtheir natural life span, except for four males and six females that were sacrificedmoribund. Table 5-10 displays the mammary tumor incidence in males in Pinteret al., 1990.

DRAFT: DO NOT CITE OR QUOTE
31
Table 5-10. Mammary Tumors In Males in Pinter et al., 1990 1
Control 375 ppm 750 ppm
Total number oftumor-bearing males
1/48 1/51 8/53
Total number ofbenign tumors
1/48 1/51 9/53**
Total number ofmalignant tumors
0/48 0/51 1/53
1Data from Table 2 in Pinter et al., 1990. **p<0.01 using Fisher Exact test comparing high dose group tolow dose group.
Mammary gland tumors in the dosed females in this study were notaltered in incidence compared to controls. Mammary gland tumors in dosedmales were altered. The incidence of benign tumors (adenomas,fibroadenomas, and fibromas) was one tumor in 48 animals in controls, 1/51 inthe 375 ppm group and 9/53 in the 750 ppm group. The study authorsperformed a statistical analysis to determine if this increase in tumors wassignificant. The authors found that when a pairwise comparison was donebetween the 750 ppm group and the 375 ppm group there was a significantincrease at 750 ppm (p<0.01). Generally dose groups are compared to controlsto determine changes in tumor incidence following dosing. The study authorschoose not to perform a pairwise comparison to controls in this case, however,because the animals in the control group died much sooner than the animals ineither dose group. The last control male died before study week 120; the last375 ppm male died between week 120 and 130; and the last 750 ppm male diedbetween weeks 130 and 140. The differences in survival in this study confoundthe results. The study authors state: "The tumors in the high-dose groupappeared later in time than those in the control or low-dose group." The onetumor in the control group occurred at week 111 and the sole tumor in the 375ppm group occurred at 119 weeks. By contrast, the average mean time of tumorappearance in the 750 ppm group was 121.3 week ± 15.4 weeks. The increasein tumors seen in the older animals could be due to the exposure to atrazine orcould also be due to the simple fact that these were old animals.
Mammary tumors in F-344 males have been shown to increase in

DRAFT: DO NOT CITE OR QUOTE
32
incidence in untreated males as they age (Solleveld, 1984). Table 5-11 displaysmammary tumor incidences in untreated, aged F-344 males. Table 5-11showsthat a difference of only a few months can greatly increase the incidence ofmammary tumors as the rats age. Tumor incidences double as the rats age from98-110 weeks to 111-123 weeks. Incidences double again as the rats age from111-123 weeks to 124 to 136 weeks.
Table 5-11. Mammary Gland Fibroadenomas in MaleF-344 Rats by 12 Week Time Periods (Solleveld, 1984)
98-110Weeks
111-123Weeks
124-136 Weeks
>137 Weeks
MammaryFibroadenoma
3/77(4%)
13/143(9%)
27/148(18%)
22/95(23%)
The study authors seem to realize the possible relationship between theage of the high-dose males and their high tumor incidences. The authors citeSolleveld (1984) in an attempt to show that, even given the increased tumorincidence in aged males, the atrazine exposed males had increased tumorincidences. Pinter et al., (1990) notes:
"The incidence of benign mammary gland tumors in maleF344 rats was reported to be 2.2% for 110 to 16 weeks; inthe life span studies (more than 116 weeks), however,13.4% of the male animals had benign mammary glandtumors [Solleveld, 1984 is cited]. In our study, 16.9% of thehigh-dose, males had benign mammary tumors."
The 2.2% the authors of the Pinter et al. study refer to in the above quoteis historical control data from untreated males in several National ToxicologyProgram two-year bioassays. The 13.4% is historical control data for mammarytumors in untreated males greater than 116 weeks in age in life-span studies. The difference between 2.2% mammary tumor incidence at 116 weeks in thetwo-year bioassays and the 13.4% in the life span studies again emphasizes thedramatic increases in tumors that occur as the animals age beyondapproximately two years of age.

DRAFT: DO NOT CITE OR QUOTE
33
The study authors seem to believe that atrazine exposure is inducing theadditional tumors between 13.4% and 16.9%. However, the study author'sTable 2 on page 537 of their publication shows that only eight of 53 (15%, not16.9%) males had a mammary tumor of any sort. The origin of the 16.9% valueis unknown. The true difference - according to the data the study authorspresent in their Table 2 - is between the 13.4% and 15%. Additionally, therewas one incidence of an adenocarcinoma in the high-dose males. The Pinter etal. publication does not include any description of which male had thiscarcinoma but if this tumor occurred in an animal that did not also have a benigntumor then the number of animals with benign tumors drops to seven out of 53 --13.2% -- almost identical to the 13.4% cited by the study authors from theSolleveld (1984) paper.
It is concluded that the authors of this study have not made a case thatthe increase in male benign mammary tumors is due to atrazine exposure. Thetumors appearing in the high-dose males do not appear to be found at a rate anyhigher than what would be expected for F-344 males of a comparable age.
5.9 Summary and Discussion of the Two-Year Bioassay Studies
Increased incidences of mammary fibroadenomas or carcinomas wereseen in three out of four separate two-year bioassay studies usingSprague-Dawley rats.
Atrazine exposure in a two-year bioassay using CD-1 mice did not resultin increased incidences of mammary tumors in either sex, despite the compoundbeing given to the mice at doses that resulted in decreases in body weight gainof 23.5% in females and 11% in males and a significant increase in mortality infemales.

DRAFT: DO NOT CITE OR QUOTE
34
Atrazine exposure in two separate two-year bioassays using the F-344strain of rats also did not result in increased incidences of mammary tumors.One of the bioassays used rats of both sexes (terminal sacrifice protocol) anddid not see increases in mammary tumors in either sex, while the other studyemployed only females (serial sacrifice protocol) without seeing an increasedincidence of mammary tumors. Dosing was adequate in both studies asindicated by the 14% decrease in female body weight gain the 400 ppm dosegroup compared to controls (serial sacrifice protocol) and the 11.3% (% ) and11.6% (&) reductions in percent body weight gain at 400 ppm compared tocontrols in the terminal sacrifice study. Doses of atrazine that producedequivalent, or even less than, reductions in body weight in the two-yearbioassays with the SD strain reductions) produced mammary tumors. Forexample, in Thakur, 1992a (the terminal sacrifice protocol), female body weightsgains were reduced 12 to13% at 104 weeks in the 400 ppm group; in Mayhew etal. (1986) female body weight in the 70 ppm group were reduced only 3.25, yetthis was still sufficient to produce mammary tumors.
A study by Pinter et al. (1990) also showed a lack of carcinogenic effectfor atrazine in F-344 females. This study did find an increase in benignmammary tumors in F-344 males when high-dose males were compared to low-dose males. However, this study was a life-span study rather than a two-yearbioassay and the males of the high-dose group (in which the increases in benignmammary tumors were seen) survived significantly longer than males in thecontrols or low-dose group. Examination of the tumor incidence in the high-dosemales from this study suggest that mammary tumor incidences were most likelycomparable to what would be expected for males of this strain and age.

DRAFT: DO NOT CITE OR QUOTE
35
Chapter 6
6 Genotoxicity Studies
An important question to address in the hazard assessment is whether atrazinealso has the potential to be DNA reactive and act as an initiator within the context ofthe multistage model of carcinogenesis. Thus, following initiation (i.e., a mammarygland cell acquires a mutation that results in unregulated proliferation), tumorpromotion (i.e., clonal expansion of the genetically altered cell) in the mammary tissuewould then be hormonally-mediated. The most desirable data to address this issuewould be information on genetic alterations in the relevant target tissue. Thisinformation is not available for atrazine. There are a large number of studies usingstandard genotoxicity assays to evaluate the mutagenic potential of atrazine.
Atrazine has been examined for its ability to induce mutations inmicroorganisms, insect, and plants, and to induce chromosomal aberrations in vitro andin vivo in both mammalian and nonmammalian organisms. Additionally, atrazine hasbeen tested in other assays using endpoints that are indicative of DNA damage, but arenot measures of mutation per se (e.g., genetic recombination, sister chromatidexchanges, DNA strand breakage, and unscheduled DNA synthesis).
Although more than 50 studies are available on atrazine, some findingsreported in the literature are presented in insufficient detail for evaluation or results areinconclusive due to study design problems. Furthermore, the results on atrazine areinconsistent even within the same test system and genetic endpoint evaluated. Thus,in evaluating the mutagenic potential it is important to take a weight- of- evidenceapproach that considers the overall response patterns or trends for mutation,chromosomal damage, and other indicators of DNA damage. In looking at the overalltrends in the database, it is important to consider the type of end point evaluated andthe test system/organism used. More emphasis is placed on end points that are directmeasures of mutation and chromosomal aberrations rather than indicators of DNAdamage (e.g., sister chromatid exchanges, DNA strand breaks). Also, results frommammalian systems are emphasized more than results from assays usingnonmammalian organisms. Likewise, mammalian in vivo data are preferred over datafrom in vitro tests.

DRAFT: DO NOT CITE OR QUOTE
36
As summarized in Appendix Table 5 Most of the mutagenicity studies on atrazinehave been reported as negative. The majority of these negative results come frommutation studies in bacteria. Beyond the bacteria results, the response profile foratrazine is heterogenous and closer to a split between negatives and positives. Nevertheless, the response patterns or trends for mutation and chromosomal damagetend to be more convincing for the number and type of negative responses found afteratrazine treatment than for the positive data, which typically were weak, observed athigh treatment concentrations of atrazine, or were not repeatable. Data on severalmetabolites of atrazine and its close structural analogues (propazine and simazine) donot support a mutagenic potential for these compounds. Therefore, the totality ofevidence does not support a mutagenic potential for atrazine, and indicates that adirect DNA reactive/mutagenic mode of action is unlikely to be an influence of atrazineon mammary gland tumor development (or at any other site). A discussion of theliterature supporting this conclusion follows.
6.1 Mutation Studies
As summarized in Appendix Table 5, most studies on atrazine formutation induction are bacteria tests with a few assays in yeast, fungi and in thefruit fly Drosophila melanogaster. There is no compelling evidence for mutationinduction as a mode of carcinogenic action for atrazine given the consistentnegative responses in bacterial tests, and the inconsistent positive responsesacross other phylogenetic lines (where responses tended to be weak, found athigh doses, and/or were not reproducible).
When atrazine was evaluated in the Ames assay (with a variety ofSalmonella typhimurium tester strains) by several different laboratories, it wasconsistently negative even when a mammalian liver metabolic activation systemwas incorporated (Seiler, 1973; Poole and Simmon et al., 1977; Lusby et al.,1979; Bartsch et al., 1980; Sumner et al., 1984; Deparde, 1986; Kappas,1988;Mersch-Sundermann et al., 1988; Zeiger et al., 1988 1992; Ruiz and Marzin,1997).
There are no acceptable mutation studies in: Butler and Hoagland, 1989;Anderson et al., 1972; Morichetti et al. 1992, mammalian systems. AlthoughAdler (1980) reported a negative result for a gene mutation test (HPRT assay) inV79 cells, this paper does not contain sufficient detail to allow an independentassessment of the finding.

DRAFT: DO NOT CITE OR QUOTE
37
Tests in yeast and fungi have yielded heterogenous results. For example,mutation induction was reported in Schizosaccharomyces pombe with or withoutplant cell activation (Mathias, 1987) and in Aspergillus nidulans only withmammalian cell activation (Benigni et al., 1979). When atrazine was evaluatedin Saccharomyces cerevisiae without exogenous activation, a negative resultwas reported in one paper (Emnova et al., 1987), while a weak positive findingwas observed by Morichetti et al., 1992. The reported positives are mostly foundat high doses of atrazine. Furthermore, gene conversion and mitoticrecombination, which are indicators of DNA damage, were not increased in yeastand fungi exposed to atrazine (de Bertoldi et al., 1980; Emnova et al., 1987;Kappas, 1988), except when plant cell activation was incorporated into the assay(Plewa and Gentile, 1976). Because these lower eucaryotic assays haveintrinsic rates of positive responses that occur sporadically, this conflictingdatabase in fungi and yeast must be interpreted carefully in the context of theweight-of- evidence and results from other organisms.
Microbial systems (Salmonella, E. coli, yeast) have been used asindicators of mutational damage after atrazine treatment in host-mediatedassays (Adler, 1980; Simmon et al., 1977). The mouse host-mediated assays onatrazine have yielded mix results, with Salmonella (injected intraperitoneally)being negative and E. coli and yeast (injected into the mouse testes) as positive. However, because of the variability in cell recovery, these assays are not viewedas reliable indicators of mutagenicity.
Some information is available in insects. In general, positive results inDrosophila were reported for somatic mutation in the spot wing test (Tripathy etal., 1993; Torres et al., 1992) or in the sex-linked recessive lethal assay(Tripathy et al., 1993; Murnik and Nash, 1977) under certain conditions (larvalfeeding or at high doses). Murnik and Nash (1977) tested atrazine, simazineand cyanazine in the Drosophila sex linked recessive lethal assay. The authorsfurther concluded that, "these triazine herbicides may be weak mutagens," andthat "Much larger experiments are needed to determine with confidence themutagenic potential of the herbicides." The results reported by Murnik and Nash(1977) were considered inconclusive by an expert Gene-Tox panel because ofthe inadequate sample size used and possible variability confounding theinterpretation (Lee et al., 1983).

DRAFT: DO NOT CITE OR QUOTE
38
6.2 Chromosome Aberration Studies
Several studies are available for the induction of chromosome aberrationsin mammal systems using both in vitro and in vivo assays. Although the in vitroresults have been conflicting, the majority of available in vivo data indicate thatatrazine is not clastogenic (chromosome breaking), particularly in the bonemarrow or in germ cells of the mouse. The few positive findings found in vitrotests are likely the result of cellular toxicity or stress and not a direct DNAmechanism of action. It should be noted that in vitro cytogenetic assays tend tohave a relatively high frequency of sporadic positive responses that are usuallyassociated with toxicity or other nonmutagenic events (e.g., high osmolality, lowpH) (Brusick et al., 1998).
6.2.1 In Vitro Assays
Atrazine did not produce chromosomal aberrations in Chinesehamster cells (Ishidate, 1988). A marginal increase in chromosomeaberrations (less than a doubling in the response over background, andmay be within the variation of background) was reported in humanperipheral blood lymphocytes up to 1.0 Fg/mL (Meisner et al., 1992;Meisner et al., 1993). By contrast, Lioi et al., 1998, reported a largeincrease in the incidence of chromosome aberrations in human bloodperipheral blood lymphocytes was reported at a similar dose (Lioi et al.,1998). It should be noted that agents that are mutagenic/clastogenicgenerally induce sister chromatid exchanges (SCE’s) at lower doses. Thus, in the study by Lioi et al. (1998), it is unusual that such a strongdose-related response for chromosome aberrations was accompanied byonly a marginal increase in SCE’s (which was not dose-related) over thesame concentration range (5 to 51 FM). Other studies using humanperipheral blood lymphocytes, found atrazine to be negative up to aconcentration of 10 Fg/mL (Dunkelberg et al., 1994) or up to 50 Fg/mL(Kligerman et al., 2000a) for SCE induction.

DRAFT: DO NOT CITE OR QUOTE
39
The lack of a clear SCE response suggests that the Lioi et al.positive findings for chromosome aberrations may reflect cellular toxicityor stress. Lioi et al. state that their positive chromosomal aberrationresponse for atrazine “...indicated an induction of a pro-oxidant state ofthe cells as an initial response to pesticide exposure.” given the increasefound for glucose 6-phosphate dehydrogenase activity in exposed cells. Positive results were reported using flow cytometry methods in Chinesehamster ovary cells (Rayburn and Biradar, 1995.) This study is flawedand considered inconclusive because the method of cell lysis and stainingof the nuclei used by the authors may have introduced artifacts. Flowcytometry analysis (which essentially measures the distribution of DNAbetween cells undergoing mitosis) is not as reliable as direct cell analysisby microscopy for evaluating clastogenicity. Many factors can alter theflow cytometry results, such as cleanliness of the machine, flow rate, cellnumber, air bubbles, incomplete cytolysis, incomplete RNA’ase digestionand sample preparation, thus making it different to interpret inducedgenetic changes by a chemical versus induced artifacts due to studyconduct.
EPA NHEERL conducted an in vitro cytogenetic study on atrazine(as well as simazine and cyanazine) to resolve the contradictorycytogenetic findings reported in the literature on human peripheral bloodlymphocytes. No induction of chromosomal aberration or SCE’s wasfound in human peripheral blood lymphocytes after exposure to atrazineup to a dose of 50 Fg/mL (Kligerman, et al., 2000a).

DRAFT: DO NOT CITE OR QUOTE
40
6.2.2 In Vivo Assays
Atrazine administered in drinking water at 20 Fg/mL (20 ppm), wasfound to be negative in a 30- and 90-day mouse ( B6C3F1 males andfemales) study using metaphase analysis to evaluate the incidence ofchromosomal aberrations (Meisner et al., 1992; Roloff et al., 1992). Itshould be noted that bone marrow cytogenetic evaluations with outchromosome painting are insensitive for chronic studies. Atrazine testednegative in a mouse (Tif:MAGf) bone marrow assay evaluatingmicronuclei induction (Ceresa, 1988a). The study by Ceresa (1988a)consisted of two parts. In the first phase, both sexes of mice were dosedwith a single gastric intubation of 2250 mg/kg atrazine in carboxymethylcellulose, with animal sacrifices at 16, 24 or 48 hours following treatment. In the second phase of the study, both sexes of mice were treated with asingle dose of atrazine at 562.5, 1175 or 2250 mg/kg with bone marrowcells harvested 24 hours post-treatment.
More recently, Gebel et al. (1997) examined a variety ofherbicides, including atrazine in the mouse bone marrow micronucleiassay. In this study, NMRI mice of both sexes were gavaged with severaldoses of atrazine dissolved in corn oil up to 1750 mg/kg, and 48 hourslater the animals were sacrificed. The results from this study showed thatatrazine only induced a small increased in micronuclei in female mice at adose of 1400 mg/kg that is approximately 80% of the LD50. It should benoted that this is a very high dose of atrazine because at the next higherdose (1750 mg/kg), half the animals died (i.e., it was the LD50). The studyauthors state that “(A)trazine... revealed significant aneugenic/clastogenicactivities in the micronucleus test in vivo in female NMRI mice. However,these results only could be achieved in female animals at doses near tothe maximum tolerated dose. Thus, an in vivo genotoxic potential for ...Atrazine seems questionable.” Although Adler (1980) cites a mouse bonemarrow cytogenetic study in which atrazine was given by oral gavage andwas found to be positive for clastogenetic effects at 2000 mg/kg (also avery high dose), no further details were provided to evaluate theacceptability of this finding. It should be noted that EPA’s NHEERL foundboth atrazine and simazine to be negative for micronuclei induction inmice (Kligerman, et al., 2000b).

DRAFT: DO NOT CITE OR QUOTE
41
Atrazine has been evaluated in dominant lethal assays for germcell chromosomal damage. In a negative study by Hertner (1993), malemice were exposed via oral gavage up to 2400 mg/kg bw of atrazine. Males were mated sequentially with untreated virgin females at differentdays to allow evaluation of exposed male gametes at various germ cellstages of development. There were no significant increases forresorptions or dead fetuses at any dose. Although Adler (1980) cites adominant lethal study in the mouse in which atrazine given by oral gavagecaused an increase in dominant lethal mutations at 1500 and 2000 mg/kg,the lack of details precludes an independent assessment of the study.
6.3 Other Indicators of DNA Damage or Mutagen Exposure
Atrazine has been negative for the induction of unscheduled DNAsynthesis (UDS) in rat hepatocyte cultures (Hertner, 1992; Puri and Muller,1984). In the study by Hertner (1992), there was no evidence of UDS whenhepatocytes from adult male Tif:RAIf rats were exposed in vitro to atrazine atseveral concentrations up to 1670 Fg/mL for 16 to 18 hours (139 Fg/mL was aprecipitating concentration). In agreement, atrazine exposure did not induceUDS in the study by Puri and Muller (1984), which also used primary rathepatocytes from adult male Tif:RAIf rats that were exposed to severalconcentrations of atrazine for five hours up to 150 µg/mL, where precipitation ofthe test article occurred.
Ribas et al. (1995) used the single cell-gel electrophoresis assay (SCGE,or the comet assay) to examine DNA strand breakage in human lymphocytestreated in vitro with several concentrations up to 200 µg/mL of atrazine for fourhours both with and without S9 rat liver activation. In this study, atrazine wasfound to cause a marginal increase in alkaline labile sites only in the absence ofmammalian liver S9 activation. The study authors refer to the atrazine results asa “weak positive” and noted: “The extent of DNA migration showed that only incultures treated without S9 fraction there was a slight but significant increaseand this took place only when the concentrations were high (100 and 200µg/mL).” The weak positive findings by Ribas et al. were similar to the weakeffect reported by another laboratory using the DNA alkaline elution assay todetect DNA strand breakage in stomach, kidney, and liver of Sprague-Dawleyfemale rats treated with a single oral dose of 875 mg/kg of atrazine or with 350mg/kg of atrazine given five or 15 successive days (Pino et al., 1988). Anotherstudy using an excision repair assay to evaluate atrazine for DNA damage in

DRAFT: DO NOT CITE OR QUOTE
42
human lymphocytes up to a dose of 100 µg/mL, reported negative results withoutactivation (Surrallés et al., 1995). Although a positive finding was reported inanother comet assay evaluating DNA damage in the tadpole, Rana catesbeiana(Clements et al., 1997), it is uncertain whether this finding can be attributed toatrazine because the study was conducted with commercial formulation (Aatrex)that was of low atrazine purity (43%). It should be noted that Roundup wasreported as positive in this study. The active ingredient in Roundup, glyphosate,is nonmutagenic when tested in standard genotoxicity assays (Flowers and Kier,1978; Li, 1983; Shirasu et al., 1978). Atrazine was also found to negative in anSOS chromotest (Ruiz and Marzin, 1997).
6.4 Mutagenicity Studies in Plants
Plant assays have yielded mix results. The induction of mutations but notchromosome aberrations have been observed in Zea mays (Morgun et al.,1982). Conflicting results are reported in Hordeum vulgare for both mutationand chromosome aberrations (Wuu and Grant, 1966; Stroev, 1968; Muller et al.,1972). The induction of chromosome aberrations is found when a high enoughdose is evaluated in Vicia faba (Wuu and Grant, 1967). Although themetabolism in plants is qualitatively similar to that in mammalian, quantitativedifferences may exist in certain plant systems that may allow for expression ofmutagenicity.
6.5 Metabolites of Atrazine
Metabolism of the triazine herbicides, atrazine, simazine and propazine,in mammalian species results primarily in chloro-s-triazine metabolites(Simoneux, 1995). The major pathway for metabolism of the triazine herbicidesin plants is hydroxylation (Simoneux, 1995). The major plant metabolite ishydroxy-atrazine. Several standard mutagenicity studies on hydroxy-atrazineand a variety of these chloro-metabolites (Diaminochlortriazine, G-28279, andG-30033) have been consistently negative for mutagenicity, and thus do notappear to exhibit a mutagenic potential (summarized in Appendix Table 4).
Though not truly a metabolite of atrazine, the mutagenic potential of N-nitrosoatrazine is also discussed.
6.5.1 Diaminochlortriazine metabolite (DACT – 6-chloro-1,3,5-
DRAFT: DO NOT CITE OR QUOTE
43
triazine-2,4-diamine; didealkyl atrazine)
DACT (the structure is shown in Figure 8-1) was negative in theSalmonella/Ames assay when evaluated up to the limit concentration of5000 µg per plate in tester strains TA 98, TA100, TA1535, and TA1537with and without metabolic activation from the S9 fraction of Aroclor-treated rats (Deparde and Karimi, 1987). In an UDS assay using isolatedhuman fibroblasts, DACT was also negative up to 600 µg/mL (whichexceeded the solubility limit of 400 µg/mL) (Meyer, 1987).
6.5.2 G-28279 metabolite - 6-chloro-N-ethyl-1,3,5-triazine-2,4-diamine; deisopropyl atrazine
G-28279 (structure is shown in Figure 8-1) was tested up to aconcentration 5000 µg per plate and found to be negative in theSalmonella/Ames assay when evaluated in tester strains TA 98, TA100,TA1535, and TA1537 with and without metabolic activation from the S9fraction of Aroclor-treated rats (Deparde, 1990). G-28279 was alsonegative for inducing UDS in exposed hepatocytes from adult maleTif:RAIf rats when tested up to a cytotoxic dose (800 µg/mL) (Gelnick,1991a). G-28279 was tested at the maximum tolerated dose of 480mg/kg without inducing an increase in micronuclei in bone marrow cells ofexposed adult Tif:MAGf mice of both sexes (Ogorek, 1991a).
6.5.3 G-30033 metabolite - 6-chloro-N-(1-Methyl ethyl)-1,3,5-triazine-2,4-diamine; deethyl atrazine
G-30033 (structure is shown in Figure 8-1) was tested up to aconcentration 5000 µg per plate and found to be negative in theSalmonella/Ames assay when evaluated in tester strains TA 98, TA100,TA1535, and TA1537 with and without metabolic activation from the S9fraction of Aroclor-treated rats (Deparde, 1989). G-30033 was alsonegative for inducing UDS in exposed hepatocytes from adult maleTif:RAIf rats when tested up to a cytotoxic dose (1000 Fg/mL) (Gelnick,1991b). G-30033 was tested at the maximum tolerated dose of 480mg/kg without inducing an increase in micronuclei in bone marrow cells ofexposed adult Tif:MAGf mice of both sexes (Ogorek, 1991b).

DRAFT: DO NOT CITE OR QUOTE
44
6.5.4 Hydroxy-atrazine, G-34048
Hydroxy-atrazine (structure is shown in Figure 8-1) was negativewhen evaluated at concentrations up to 5000 Fg/plate in Salmonellatester strains TA 98, TA100, TA1535 and TA1537 (Deparde, 1988). Tests were conducted in the presence and absence of mammalianmetabolic activation S9 fraction of Tif:RAIf rats treated with Aroclor 1254. When hepatocytes from adult male Tif:RAIf rats were exposed to hydroxy-atrazine at concentrations up to 1500 µg/mL (precipitation seen at doses$12.5 µg/mL), no increase in UDS was found (Hertner, 1988). Hydroxy-atrazine was negative in a UDS assay in which human fibroblast cellswere exposed in vitro to concentrations up to 1500 µg/mL undernonactivating conditions only (Meyer, 1988). In vivo, hydroxy-atrazinewas tested up to the limit dose of 5000 mg/kg without inducing anincrease in micronuclei in bone marrow cells of exposed adult Tif:MAGfmice (Ceresa, 1988c).
6.5.5 N-Nitrosoatrazine
N-Nitrosoatrazine (NNAT) can be formed in vitro when atrazine andnitrite are mixed at an acid pH (Wolfe, et al., 1976). Because nitrites andatrazine can be found together in drinking water, the hypothesis has beenadvanced that NNAT can be formed in the acid pH found in the stomach. The formation of NNAT in the stomach in vivo has yet to be demonstrated.
The genotoxicity of NNAT has been tested in the Ames assay, V-79 mutation assay, newt micronucleus test, and a clastogenicity assayusing human lymphocytes.
Results of a modified Ames assay (available only as an abstract)showed NNAT to cause an increase in revertants in the TA 100 and 98strains with hamster S9 fraction at 525 µg/plate and 1 mg/plate,respectively (Weisenberger et al., 1987). The study authors consideredthese results to be "mildly mutagenic.” This abstract also noted thatatrazine was tested and found to be nonmutagenic.

DRAFT: DO NOT CITE OR QUOTE
45
A V79 assay (available only as an abstract) was considered by thestudy investigators to produce results that indicated that NNAT was"strongly mutagenic" (Weisenberger et al., 1988). This abstract alsonoted that atrazine was tested and found to be nonmutagenic.
A micronucleus assay using peripheral red blood cells (RBC) fromnewt larvae resulted in an increase micronuclei at doses of 7.5 and 15ppm after a 12 day exposure while no increase in micronuclei was seen at3.75 ppm (Haridon, 1993).
A clastogenicity assay in lymphocytes from normal humanvolunteers found that NNAT at doses as low as 0.0001 µg/mL producedsignificant elevations of chromosome break frequency and percent ofcells with aberrations. A significant elevation of the mitotic index was notobserved at 0.0001 µg/mL. Mitotic index was significantly increased atthe next highest dose of 0.001 µg/mL (Meisner, et al., 1993).
6.6 Close Structural Analogues: Simazine and Propazine
As discussed in Chapter 8, atrazine is an s-triazine pesticide and isclosely related to simazine and propazine as 2-chloro-4,6-bis-(alkyamino)-s-triazines. To further explore the mutagenicity of atrazine, the availabledatabases on propazine and simazine were also evaluated. The availablestudies are predominantly negative, and thus do not provide convincingevidence of a mutagenic potential for simazine or propazine. Although therewere some positives reported they tended to be marginal, found at very highconcentrations or were not reproducible.

DRAFT: DO NOT CITE OR QUOTE
46
6.6.1 Simazine
As summarized is in Appendix Table 6 simazine has beenevaluated in bacterial for mutation including various Salmonella testerstrains and found to be negative by several different laboratories evenwhen metabolic activation was incorporated into the assay (Mersch-Sundermann et al., 1988; Simmon et al., 1977; Jones et al., 1984; Seiler,1973; Lasinski, Kapeghian, and Green, 1987; Fahrig, 1974). Simazinewas negative for the induction of gene mutation and gene conversion inS. cerevisiae (Fahrig, 1974; Siebert and Lemperle, 1974; Simmon et al.,1977; Jones et al., 1984; Emnova et al., 1987). Like atrazine, conflictingresults were reported in plant and insect studies. Only one mammalian invitro gene mutation assay was found for simazine that reported a weakpositive in the presence of metabolic activation (Jones et al., 1984). Thisstudy is considered inconclusive by an expert Gene-Tox panel (Mitchell etal., 1997). Simazine is also negative at concentrations up to the solubilitylimit in the primary rat hepatocyte UDS assay (Hertner, 1992).
Most in vitro cytogenetic assays on simazine are inconclusive dueto study design problems, but negative results have been reported for theinduction of SCE’s and chromosomal aberrations. To resolve theinconclusive cytogenetic literature, EPA NHEERL recently evaluatedsimazine in human peripheral blood lymphocytes with in vitro exposuresup to 37.5 Fg/mL (a dose at the limit of toxicity and solubility) and foundno induction of either chromosomal aberrations or SCE’s (Kligerman etal., 2000b). In vivo, simazine was tested up to the limit dose of 5000mg/kg without inducing an increase in micronuclei in the bone marrow ofexposed adult Tif:MAGf mice of both sexes (Ceresa, 1988b). EPA’sNHEERL found simazine to be negative when evaluated by the mousemicronucleus test (Kligerman, et al., 2000b).
DRAFT: DO NOT CITE OR QUOTE
47
6.6.2 Propazine
The available genotoxicity studies on propazine are summarized inAppendix Table 7. Propazine has been negative in bacterial mutagenicityassays (Kappas, 1988; Shirasu, 1975). Propazine has also beenevaluated in vitro for the induction of gene mutation (at the HPRT locus)in Chinese hamster lung cells (V79) under both activating andnonactivating conditions (Ciba-Geigy, 1986). Studies without metabolicactivation exposed V79 cells for 21 hours up to 1000 µg/mL of atrazine. Studies with metabolic activation exposed V79 cells for five hours up to2000 µg/mL of atrazine along with the S9 fraction from Arochlor-treatedmale rats. In the experiment without S9 activation, a weak positiveresponse (dose-related) was found at concentrations 400 µg/l. Anequivocal response that was not dose-related was seen in the experimentwith S9 activation.
Propazine was negative for UDS when tested up to the solubilitylimit in (62.5 µg/mL) exposed hepatocytes from adult, male TiF:RAIf rats(Puri, 1984). Propazine was reported to be negative for chromosomeaberrations in Chinese hamster cells in vitro (Ishidate, et al., 1981;Ishidate 1983),and negative for the induction of micronuclei when testedup to 5000 mg/kg in adult female Chinese hamsters (Ciba-Geigy, 1984).

DRAFT: DO NOT CITE OR QUOTE
48
6.7 Summary and Discussion of Mutagenicity Data
The genetic toxicology database for atrazine shows consistent negativeresults for bacterial mutation assays. Beyond the bacterial tests, the database isheterogeneous and contains conflicting test responses. Reported positiveresponses tended to be weak and found at high doses of atrazine. No subset ofdata points clearly establishes a direct DNA reactive mode of action for atrazineassociated with the carcinogenicity. Although the DNA damaging potential ofatrazine can not be entirely dismissed in Drosophila and plants, these findingmay be the result of species specific metabolism. Although some positivefindings were reported for clastogenicity in mammalian systems, theseresponses were in conflict with other studies using the same assay approachand may be associated with toxicity. Data on several metabolites of atrazineand its close structural analogues (propazine and simazine) do not support amutagenic potential for these chemicals.
In summary, the totality of evidence does not support a mutagenicpotential for atrazine, and indicates that a direct DNA reactive/mutagenic modeof action is unlikely to be a component of atrazine-induced mammary glandneoplasia (or on tumor development at any other site).
N-nitrosoatrazine has been shown to be mutagenic in four different typesof mutagenicity assays. However, the chemical reaction which generates NNAThas never been demonstrated to occur in vivo, and cancer bioassays in femaleSwiss mice and female Wistar rats failed to show a carcinogenic responsefollowing NNAT exposure (Weisenberger,1990 - abstract).
In conclusion, exposure to atrazine is not likely to pose a mutagenichazard to humans, especially at lower exposure levels experienced by humans.

DRAFT: DO NOT CITE OR QUOTE
49
Chapter 7
7 Estrogenic Activity
Several studies employing both in vitro and in vivo assays are availableconcerning the potential of atrazine to act as an estrogen agonist (i.e., mimic the effectsof estradiol exposure). Some of the assays also test the ability of atrazine to functionas a progesterone mimic. The results of these studies together provide evidence thatatrazine does not have direct estrogenic effects. These studies are discussed belowand their results are also summarized in Table 7-1.
7.1 In Vivo Assays
Tennant et al. conducted a study known as the uterotrophic responseassay. This is an accepted procedure for measuring estrogenic activity (Korachand McLachlan, 1995). As an in vivo assay, it incorporates aspects such asmetabolism, serum binding and pharmacokinetics. Exposure to an estrogenicagent increases the weight of the uterus by causing cellular proliferation ofendometrial cells, leading to an increase in thickness of the uterineendometrium. Rats or mice are exposed to the suspected estrogenic agent forthree or four days, sacrificed, and their uterine weight is compared to that of thecontrol animals. Immature or OVX animals are used to decrease interferencefrom endogenous estrogens.
In this study, OVX Sprague-Dawley rats were treated for three days with20, 200 or 300 mg/kg of atrazine. An increase in uterine weights over controlswas not found.
Tennant et al. (1994a) also evaluated atrazine for uterine thymidineincorporation. This test measures an increase in uterine cell proliferation. Rather than measuring proliferation of uterine cells by weighing the uterus, thistest measures the incorporation of thymidine into cellular DNA prior to celldivision.
In this assay, female Sprague-Dawley rats were fed radiolabeledthymidine in their diet and then exposed to 1, 10, 50, 100 or 300 mg/kg/dayatrazine for three days. The atrazine-treated animals had less thymidineincorporation into uterine cells than did control rats.

DRAFT: DO NOT CITE OR QUOTE
50
Table 7-1. In vitro and in vivo Hormonal Studies with Atrazine
Study Type Dose/Duration Results
In vivoUterine bioassay inOVX SD females1
Atrazine and DACT at 0, 20, 200 or 300mg/kg for three days.
Simazine at 100 and 300 mg/kg/day forthree days.
An increase in uterine weight indicates estrogenic activity+ control - estradiol at 2 µg stimulated uterine weight gain; Atrazine/DACT/Simazine - uterine weights in dose groups were similar to control weights.
In vivoProgesterone receptorbinding assay in OVXSD females 1
Atrazine at 0, 50 or 300 mg/kg for threedays followed by 5 Fg/kg E2
An increase in the ability of progesterone receptor (PR) to bind its agonist indicatesestrogenic activity+ control - estradiol at 2 µg increased PR binding of agonist; Atrazine - 300 mg/kg/day decreased the ability of PR to bind a PR agonist; DACT - 300 mg/kg/day decreased the ability of PR to bind a PR agonist; Simazine - 300 mg/kg/day decreased the ability of PR to bind a PR agonist
In vitroUterine Thymidine Incorporation assay1
Atrazine at 0, 1.0, 10, 50, 100 or 300 mg/kg for three days followed by 0.15Fg of E2
An increase in uterine thymidine incorporation indicates estrogenic activity+ control - estradiol at 0.15 µg increased uterine thymidine incorporation; Atrazine - 300 mg/kg/day decreased uterine thymidine incorporation;DACT - 300 mg/kg/day decreased uterine thymidine incorporation; Simazine - 300 mg/kg/day decreased uterine thymidine incorporation
In vitroMCF-7 Cell ProliferationAssay2
Atrazine/simazine at 0.01, 0.1, 1.0, 10 and100 µM for 11 days
An increase in the proliferation of MCF-7 cells indicates estrogenic activity+ control - 1 nM estradiol induced a two-fold increase in cell number; Atrazine/simazine - no increase in cell numbers was seen at any dose of thesecompounds
In vitroGel-shift assay for PR-PRE complex2
Atrazine/simazine at 1 µM An increase in the retardation through an electrophoretic gel of a complex consisting of PR+ PR agonist + PR DNA binding region, indicates estrogenic activity+ control - 1 nM estradiol resulted in a large increase in the retardation of the complexthrough a gel; Atrazine/simazine -Movement of the complex through the gel was not altered by thesecompounds

DRAFT: DO NOT CITE OR QUOTE
51
In vitroLuciferase reporter geneassays in MCF-7 cells2
Atrazine/simazine at 10-9, 10-8, 10-7, 10-6, 10-
5 MAn increase in luciferase activity indicates estrogenic activity+ control - estradiol at doses as low as 10-12 M resulted in increases in luciferase activityAtrazine/simazine - no increase in luciferase activity was seen with either compound atany dose.
In vitroEstrogen receptorcompetitive bindingassay using uteri fromrats that had notpreviously beenexposed to triazines.3
Atrazine/simazine/DACT at 10-10, 10-9, 10-8, 10-7 10-6, 10-5, 10-4, and 10-3 forequilibrium conditions
A variety of experiments were also run inwhich conditions favored triazine binding tothe estrogen receptor. These were termeddisequilibrium conditions.
Displacement of estrogen from its receptor indicates estrogenic activityNo displacement of estradiol from its receptor was observed at any dose with any of thetriazine compounds under equilibrium conditions
Under conditions that favor triazine binding to the estrogen receptor (disequilibriumconditions) triazine will displace estrogen from its receptor.
In vitroEstrogen receptorcompetitive bindingassay using uteri fromrats previously exposedto triazines3
Atrazine/simazine/DACT at 50 and 300mg/kg/day for two days to OVX SD females
Displacement of estrogen from its receptor indicates estrogenic activityAt 50 mg/kg/day displacement of estrogen from it receptor was not significantly alteredwith any of the triazine compounds. At 300 mg/kg/day there was a significant decrease in estrogen binding with all threetriazine compounds.
In vitroYeast assay usingtransfected humanestrogen receptor4
Both maximal (1.0x 10⁻⁹ M, in this system)and submaximal (2.5 x 10⁻⁹ M)concentrations of atrazine, and thechloratrazine metabolites alone and invarying combinations were tested
An increase in â-galactosidase activity indicates binding of atrazine to the estrogenreceptorNether atrazine alone, nor any of the many combinations of atrazine with the atrazinemetabolites caused an increase in â-galactosidase activity.
In vitroEstrogen receptormediated growth inyeast5
Atrazine and simazine at 10 µM Growth of the yeast indicates estrogenic activity+ control - Yeast colonies exposed to estradiol at 1nM proliferated.Atrazine/simazine - Yeast colonies exposed to atrazine and simazine did not proliferate.
In vivoUterine peroxidaseassay using uteri fromfemale SD rats
Atrazine and simazine at 50, 150, and 300mg/kg/day were exposed female SD ratthrough gavage for three days
Uterine peroxidase activity indicates estrogenicity+ control- estradiol at 10 µg/day results in a 10-fold increase in uterine peroxidaseactivity.Atrazine/simazine - neither compound at any dose increased uterine peroxidase activity.
1Tennant et al., 1994a.; 2Safe et al., 1995.; 3Tennat et al., 1994b.; 4Graumann et al., 1999; 5Conner et al., 1996.

DRAFT: DO NOT CITE OR QUOTE
52
7.2 In Vitro Assays
Safe et al. (1995) used MCF-7 cells, a human breast cancer cell line thatproliferates best in the presence of estrogen, to evaluate the potential estrogenicactivity of atrazine. In this method, cells are grown in culture medium that hasbeen charcoal-filtered to ensure that it is free of estrogens. The assay isconducted by adding the suspected estrogenic compound to the cell's mediumand measuring cell proliferation, usually by counting the cells.
MCF-7 cells exposed to 10 µM atrazine did not show increased
proliferation over control cells in this study.
Tennant et al. (1994b) evaluated the ability of atrazine, simazine anddiaminochlorotriazine (DACT, a metabolite of both atrazine and simazine) tobind to the rat uterine estrogen receptor. A uterine cytosol extract was preparedfrom female Sprague-Dawley rats. These preparations are expected to be richin estrogen receptors. The uterine cytosol was incubated with radiolabeledestrogen and one of the test chemicals. After an appropriate incubation time,estrogen bound to its receptor was separated from unbound estrogen. Highlevels of unbound estrogen would indicate that one of the test compounds wascompeting with estrogen for binding to estrogen receptors.
Neither atrazine, simazine, nor DACT treatment was able to compete withestrogen for binding to the estrogen receptor. No competitive binding wasapparent under conditions of equilibrium. Only when excessive amounts oftriazines were used (10,000-fold molar excess), was a slight competitive bindingobserved. Atrazine, simazine and DACT were not considered, under theconditions of this study, to effectively compete with estrogen for binding to theestrogen receptor.
Tennant et al. (1994b) also used an assay approach similar to the onedescribed above with the exception that the triazines were administered by oralgavage, and uterine slices were incubated with radiolabeled estrogen instead ofcytosol extracts. The advantage of this method compared to the test without invivo preincubation is that exposure to the triazine compounds is done in vivo.

DRAFT: DO NOT CITE OR QUOTE
53
In this study OVX female Sprague-Dawley rats were exposed to 50 or 300mg/kg/day of either atrazine, simazine, or DACT for two days. The animals weresacrificed, uterine slices were prepared, and incubated with radiolabeledestrogen. Dosing at 300 mg/kg/day statistically reduced estrogen binding by33% with atrazine, 39% with simazine and 24% with DACT. Dosing at 50mg/kg/day reduced estrogen binding by 18% with atrazine, 21% with simazineand 13% with DACT, but values were not statistically-significant. At high doses,triazine compounds are able to bind to rat uterine estrogen receptors in vivo.
Conner et al. (1996) used the reporter gene assays to evaluate atrazine. In these experiments two constructs---a Gal4-HEGO chimeric receptor and aGAL4-regulated promoter containing five ERE’s and the luciferase gene--wereplaced into the MCF-7 cell line. The luciferase gene is a reporter gene whoseproduct can be easily measured because it emits light when cells are exposed toa compound that binds the estrogen receptor.
Treatment of these MCF-7 cells with estrogen in the nM range producedlarge increases in luciferase activity compared to controls. However, treatmentwith atrazine or simazine at doses as high as 10 µM failed to produce anyincreases in luciferase activity compared to controls. These experiments showthat, in this system, atrazine and simazine fail to bind to the estrogen receptor.
Conner et al. (1996) evaluated atrazine estrogen-dependent growth yeaststrain. The PL3 yeast strain requires for growth a medium supplemented withthe amino acids histidine and leucine, and the pyrimidine base uracil. If theseyeast cells were transformed so as to contain the human estrogen receptor, thenestrogen could take the place of uracil and allow growth of this strain on histidineand leucine-containing medium. ER-positive PL3 cells in media supplementedwith histidine, leucine and estrogen will show growth after only one day ofculture and continue to proliferate for at least five days.
ER-positive PL3 cells supplemented with histidine, leucine and either 10 µM atrazine or 10 µM simazine show no proliferation even after five days ofculture. This study demonstrates that, in a yeast cell expressing human ER,neither atrazine nor simazine have estrogenic effects.

DRAFT: DO NOT CITE OR QUOTE
54
Bradlow et al. (1995) and Safe and McDougal (1998) examined the 16á to2-hydroxyestrone metabolite ratios after atrazine treatment. Estradiol formsmany metabolites. It has been hypothesized by some investigators that the ratioof the 16 metabolites to the 2-hydroxyestrone (2-OHE) metabolites may be afactor in mammary carcinogenesis. It is believed that a high 16á to 2-OHE ratiomay be correlated with mammary carcinogenesis (Telang et al., 1997). Nevertheless, others question whether this ratio is truly predictive.
Bradlow et al. (1995), exposed MCF-7 cells to several different chemicalsincluding atrazine. MCF-7 cells were placed in medium containing [16á-3H]estradiol (to determine 16á metabolite levels) and [2-3H] estradiol (to determine2-OHE metabolite levels) and atrazine at 1× 10⁻⁵ M. Incubation was for 48 hoursfollowing which measurements of the various metabolites were made. The 16áto 2-OHE ratio in the atrazine exposed cells was approximately seven to ninetimes higher than the negative control and three to four times higher than ratiosseen with the known mammary carcinogen dimethyl benzanthracene (DMBA).
Safe and McDougal (1998) exposed MCF-7 cells to several differentchemicals including atrazine. Exposure to atrazine was at 1×10⁻⁵ M for 48 hoursfollowed by another 48 hours of atrazine plus [16á-3H]estradiol or 48 hours ofatrazine plus radiolabeled [2-3H]estradiol. The ratio of 16ámetabolites to 2-OHEmetabolites was not increased following exposure to atrazine (in fact it wassomewhat decreased compared to negative controls).
The results with atrazine in this assay have been contradictory; one groupof investigators (Bradlow et al., 1995) reported an increased ratio, supportive ofpotential carcinogenicity, while another group (Safe and McDougal, 1998) couldnot confirm these results.
Tran et al. (1996) used a yeast strain transfected with the human estrogenreceptor to evaluate atrazine. A yeast cell line was transfected with the humanestrogen receptor linked to the lacZ gene. This system is similar to that used byConner et al. described above; the major exceptions were that the cells areyeast rather than MCF-7, and the reporter system is â-galactosidase rather thanluciferase. To examine the role of different domains of the estrogen receptor,these investigators also transfected a gene encoding for the human estrogenreceptor minus the first 179 amino acids.

DRAFT: DO NOT CITE OR QUOTE
55
Atrazine, cyanazine, simazine and the DACT metabolite were used inconcentrations ranging from 207 nM to 2075 nM for atrazine, simazine andDACT, and up to 10,000 nM for cyanazine. All exposures included estradiol ateither 20 or 0.5 nM (referred to the by the study authors as maximal andsub-maximal concentrations, respectively). With both the full and the truncatedreceptor, no concentration of triazine, in combination with either 0.5 or 20 nM orestradiol, resulted in â-galactosidase activity greater than what was seen withestradiol alone.
The experiments done with the complete estrogen receptor plus 0.5 nMestradiol (but not 20 nM) showed that all four triazines resulted in lessâ-galactosidase activity than with estradiol alone. Studies with the truncatedreceptor showed that at all triazine doses with both 0.5 and 20 nM estradiol,â-galactosidase activity was not altered compared to estradiol alone. Undernone of the conditions tested did any of the triazines have estrogenic activity. Anti-estrogenic activity was seen, but only with the submaximal concentrationand not the maximal concentration of estradiol. Since, the anti-estrogenicactivity was not seen in the experiments done with the truncated receptor, it canbe assumed that the amino-terminus of the estrogen receptor is responsible forthe anti-estrogenic activity.
Experiments by Graumann et al. (1999) used also employed yeast thathad been transfected with DNA coding for the human estrogen receptor linked toa â-galactosidase expression system. Only the full receptor was used.
Yeast were exposed to atrazine or atrazine plus the atrazine metabolitesDesethyatrazine (DE; 6-chloro-N-ethyl-1,3,5-triazine-2,4-diamine) andDesisopropylatrazine (DI; 6-chloro-N-(1-Methyl ethyl)-1,3,5-triazine-2,4-diamine)over a variety of concentrations and combinations. Atrazine alone, atrazine plusDE, atrazine plus DI and all three together were used. Like the Tran et al. study,both maximal (1.0x 10⁻⁹ M, in this system) and submaximal (2.5 x 10⁻⁹ M)estradiol concentrations, along with varying concentrations and combination oftriazines, were used.
In agreement with the data of Tran et al. (1996), no concentration orcombination of triazines at either maximal or submaximal conditions resulted inan increase in â-galactosidase activity. In contrast to the Tran paper, noconcentration or combination of triazines at either maximal or submaximalconditions resulted in a decrease in â-galactosidase activity either.

DRAFT: DO NOT CITE OR QUOTE
56
The Tran and Graumann papers, using similar systems, found that noneof the triazine compounds tested possessed intrinsic estrogenic activity. Theresults in regards to anti-estrogenic activity are contradictory with one study(Tran) finding anti-estrogenic activity and one study (Graumann et al.,1999) notfinding such activity.
A study has been published which examines the upregulation ofaromatase activity by atrazine. Aromatase - also known as cytochrome P450 19(CYP19) - is the enzyme responsible for the conversion of androgens toestrogens (specifically, the catalysis of androstenedione to estrone andtestostrone to estradiol). An upregulation of CYP19 activity would be expectedto result in increased serum estrogen levels as an increased amount ofandrogens are converted to estrogens. An increase in CYP19 activity has beenobserved following atrazine treatment in a human adrenocortical carcinoma cellline - H295R (Sanderson et al., 2000).
7.3 Special Carcinogenicity Bioassay Study (Morseth, 1998)
As discussed in Chapter 5, in a two-year oncogenicity study (Morseth,1998), groups of estradiol-implanted OVX and intact female SD rats wereexposed to 97.1% atrazine at doses of 0, 25, 50, 70 and 400 ppm. The primarypurpose of this study was to examine the effect of ovariectomy on mammarytumor development in the SD rat following atrazine exposure. This study alsoprovides information concerning the potential estrogenic activity of atrazine inrelation to mammary carcinogenesis.
If atrazine induces mammary tumors by acting directly on mammary
epithelium, then OVX animals might be expected to develop mammary tumors asdo intact animals. Removal of the ovaries of an animal should not have affectedthe ability of atrazine to affect mammary epithelial cells and commencecarcinogenesis. However, the difference in mammary tumor incidence betweenOVX and intact animals was striking. Not a single OVX animal in any dosegroup developed a mammary tumor of any type. In contrast, among intactanimals, 38.3% of controls and 68.3% of the 400 ppm group developedmammary neoplasia.

DRAFT: DO NOT CITE OR QUOTE
57
Overall, the results from this study, showing a complete lack of mammarytumors in OVX animals, provides further evidence that atrazine does not inducemammary tumors by binding to and activating mammary tissue estrogenreceptors. This evidence is also consistent with the conclusion that mutagenicityis not a key component of atrazine's carcinogenicity.
7.4 Noncancer Effects Relevant to Estrogenic Activity
A variety of bioassays using atrazine have been submitted to the Agency. Many of these assays measure parameters that might be expected to be alteredwere atrazine acting as an estrogenic agent. This section examines subchronicdog and rat studies; chronic dog studies; multi-generation reproduction studiesin the rat; and developmental toxicity studies in the rat and rabbit, for alterationsin parameters that may be indicative of a possible estrogenic effect.
Alterations in the chronic dog and subchronic rat and dog studies thatwere considered to possibly indicate an estrogenic effect were: changes intestes or prostate weights in males; changes in ovarian or uterine weight infemales; histopathology findings in the testes (including seminiferous tubules) orprostate of males; histopathology findings in the ovaries, uterus, vagina ormammary gland of females.
Data in the multigeneration studies that were examined included: parental testes, ovary and uterine weights; parental histopathology findings inthe testes or prostate of males; histopathology findings in the ovaries, uterus,vagina or mammary gland of female parents; malformations or variations of thetestes and prostate of male offspring and the ovaries, uterus, vagina ormammary gland of female offspring; and, the ability of male offspring toimpregnate females and the ability of females to become pregnant and deliverhealthy pups.
In the developmental toxicity studies, data from visceral examinationswere examined for malformations or variations of the gonads in offspring. Inaddition, the ratio of male to female offspring was examined. Maternal organweights and histopathology were not determined in these studies (which wereconducted under the Subdivision F guidelines). Thus, maternal organ weightand histopathology data are not available to analyze for potential estrogeniceffects.

DRAFT: DO NOT CITE OR QUOTE
58
In addition to examining data from the above mentioned atrazinebioassays, data from bioassays with simazine and the atrazine/simazinemetabolites DACT, G-28279, and G-30033 were also scrutinized for potentialestrogenic effects.
7.4.1 Subchronic Dog Studies
Subchronic studies with atrazine and propazine in the dog are notavailable, but subchronic dog studies using simazine, G-28279 andG-30033 are available. Prostate and uterine weights were determined inthe G-28279 and G-30033 studies, but not in the simazine or DACTstudies.
Simazine. Testes weights in male Beagle dogs were decreased(46% decrease in absolute testes weight and 27% decrease intestes weight relative to body weight, compared to controls) in maleBeagle dogs exposed to the high dose of 133.6 mg/kg/day ofsimazine. Ovary weights in females were not significantly alteredat any dose including the high dose tested of 136 mg/kg/day. Noincreases in histopathology findings in either the male testes orprostate or the female ovaries, uterus, vagina or mammary glandwere observed in dose groups compared to controls (Tai et al.,1985a)

DRAFT: DO NOT CITE OR QUOTE
59
G-28279. Testes weights in male Beagle dogs exposed to the twohighest doses tested in this study of 18.9 or 33.4 mg/kg/day weredecreased. Compared to controls absolute testes weightdecreased 31.4% at 33.4 mg/kg/day and testes weight relative tobrain weight was decreased 36.7%. The decreases compared tocontrols in the 18.9 mg/kg/day group were 22.85 and 25.3% forabsolute testes weight and testes weight relative to brain weight. Prostate weight in these two dose groups were also reducedcompared to controls. The percent reductions at the high dosewere 60.2% and 62.6% for absolute weight and prostate weightrelative to brain weight. The reductions in the 18.9 mg/kg/daygroup were 51.55 and 51.9% for absolute weight and for prostateweight relative to brain weight. Ovary or uterus weights in thefemales of any dose group were not altered compared to controls.No increases in histopathology findings in either the male testes orprostate or the female ovaries, uterus, vagina or mammary glandwere observed in dose groups compared to controls (Thompson etal., 1992).
G-30033. Male testes and prostate weights were not significantlyaltered in Beagle dogs exposed to a high dose 28.85 mg/kg/day.Females ovary weights were not altered in females exposed to ahigh dose of 32.18 mg/kg/day. Both absolute uterine weights anduterine weight relative to brain weight were significantly decreasedin the high-dose females. However, these changes were deemedby the study reviewer to likely be secondary to body weight lossrather than a direct effect of G-30033 exposure. No increases inhistopathology findings in either the male testes or prostate or thefemale ovaries, uterus, vagina or mammary gland were observed indose groups compared to controls (Rudzki et al., 1992).

DRAFT: DO NOT CITE OR QUOTE
60
DACT. Male and female Beagle dogs used in this study showedno significant alteration in testes or ovary weight up to the highdoses of 24.1 and 32.7 mg/kg/day for males and femalesrespectively. There was no increase in histopathology findings inthe female ovary, uterus, vagina or mammary gland in dose groupscompared to controls. There was, however, an increasedincidence of hypospermia and hypospermatogenesis in all four ofthe 24.1 mg/kg/day males, while no animal in any of the othergroup, including the controls, displayed these findings (Thompsonet al., 1990).
7.4.2 Subchronic Rat Studies
Subchronic studies with atrazine and propazine in the rat are notavailable, but subchronic rat studies using simazine, G-28279 andG-30033 are available.
Simazine. Absolute testes weights were decreased (15.4%) inmale SD rats exposed to the high dose of 276 mg/kg/day ofatrazine while testes weights relative to body weight were notaltered compared to controls. Absolute ovary weights in thefemales exposed to either 142 or 276 mg/kg/day were reduced by20% and 40%, respectively, while relative ovary weights were notaltered compared to controls. No increases in histopathologyfindings in either the males testes or prostate or the femaleovaries, uterus, vagina or mammary gland were observed in anydose groups compared to controls (Tai et al., 1985b).

DRAFT: DO NOT CITE OR QUOTE
61
G-28279. Male SD rats showed increased testes weights relativeto body weight at the high dose tested (34.9 mg/kg/day) in thisstudy. Relative testes weights were increased 139% compared tocontrols, but absolute testes weights at this dose were within 5% ofcontrol values. Ovary weights were not significantly altered at anydose. No increases in histopathology findings in either the testesor prostate or the ovaries, uterus, vagina or mammary gland wereobserved in any dose groups compared to controls (Schneider,1992).
G-30033. Testes and ovary weights of the RAIf rats used in thisstudy were not significantly altered even at the high does of 35.1for males and 38 mg/kg/day for females. No increases inhistopathology findings in either the males testes or prostate or thefemale ovaries, uterus, vagina or mammary gland were observed indose groups compared to controls (Gerspach, 1991).
DACT. Sprague-Dawley rats were exposed to doses of DACT ofup to 34.1 mg/kg/day for males and 40.2 mg/kg/day for females.Testes weights relative to body weight were increased 22% at 34.1mg/kg/day and absolute testes weights were increased 6.6%compared to controls. No significant alterations in ovary weightswere noted at any dose. No increases in histopathology findings ineither the male testes or prostate or the female ovaries, uterus,vagina or mammary gland were observed (Pettersen et al., 1991).
7.4.3 Chronic Dog Studies
Chronic (12-month) dog studies with atrazine DACT, and simazineare available. Chronic dog studies with propazine, G-28279 and G-30033are not available.
Atrazine. The Beagle dogs used in this study showed nosignificant alteration in testes or ovary weights up to the high doseused of 33.65 and 33.8 mg/kg/day for males and females,respectively. There were no histopathology findings in the testes,prostate, ovaries, uterus, vagina or mammary gland (O'Connor etal., 1987).

DRAFT: DO NOT CITE OR QUOTE
62
Simazine. Doses of up to approximately 43 mg/kg/day did not altereither absolute or relative testes or ovary weights in beagle dogsexposed to simazine for one year. No increases in histopathologyfindings in either the male testes or prostate or the female ovaries,uterus, vagina or mammary gland were observed in dose groupscompared to controls.
DACT. The Beagle dogs used in this study showed no significantalteration in testes or ovary weights up to the high dose used of24.1 and 32.7 mg/kg/day for males and females, respectively.There was no increased incidence of histopathology findings in thefemale ovary, uterus, vagina or mammary gland in dose groupscompared to controls. There was an increased incidence ofhypospermia and hypospermatogenesis in two of the four 24.1mg/kg/day males, but not in any other group, including the controls(Thompson et al., 1990).
7.4.4 Multi-Generation Reproduction Studies
Atrazine. Sprague-Dawley rats were exposed to atrazine atconcentrations up to a high dose of 39 mg/kg/day for males and42.8 mg/kg/day for females. Testes weight relative to body weightwas significantly increased in both parental generations at the highdose (11.1% increase in the F0 generation and 11.1% increase inthe F1 generation). Although slightly decreased compared tocontrols, absolute testes weights were within 10% of controlvalues. Ovary weights were not significantly altered compared tocontrols. There was no increased incidence of histopathologyfindings in the testes, prostate, uterus, vagina or ovaries(histopathology was not done on the mammary gland) at any dosein either generation of parental animals, compared to controls. There were no necropsy or histopathology findings in the maleoffspring of atrazine-treated dams that would indicate excessivematernal exposure to estrogens (Mainiero et al., 1987).

DRAFT: DO NOT CITE OR QUOTE
63
Simazine. Sprague-Dawley rats were exposed to simazine atconcentrations up to a high dose of 28.89 mg/kg/day for males and34.96 mg/kg/day for females. Testes weight relative to body weightwas significantly increased in both parental generations at the highdose (11.5% increase in the F0 generation and 20% increase in theF1 generation). Absolute testes weights were within 10% of controlvalues for both parental generations at this dose. Ovary weightsrelative to body weights were significantly increased in the F1
parental generation only at the high dose. Absolute ovary weightsin both parental generations at all doses, were not significantlyaltered compared to controls. There was not an increasedincidence of histopathology findings in the testes, prostate, uterus,vagina or ovaries (histopathology was not done on the mammarygland) at any dose in either generation of parental animals,compared to controls. There were no necropsy or histopathologyfindings in the male offspring of atrazine-treated dams that wouldindicate excessive maternal exposure to estrogens (Epstein et al.,1991).
Propazine. Sprague-Dawley rats were exposed to doses of up to50 mg/kg/day of propazine in this three-generation study. F0
paternal testes weights relative to body weight, at the high doseonly, were significantly increased (15.6%) compared to controls. Absolute testes weights at this dose (and every other dose) in thisgeneration were within 5% of control values. Testes weightrelative to body weight in the F1 generation was not significantlyaltered though it was increased 16.6% in the high-dose groupscompared to controls. Absolute testes weight in all dose groupswas within 5% of control values. Testes weights relative to bodyweights were significantly increased (22%) compared to controls inthe high-dose of the F2 generation parents. Absolute testesweights were within 5% of control values for all other dose groupstests in this generation. Ovary weights in the first two generationswere not significantly different, either absolutely or relative to bodyweight, than control ovary weights. Ovary weights in the F2
generation parents were significantly decreased (27.6%) at themid-dose of5 mg/kg/day. The ovary weights at the other two doses in thisgeneration were higher than the ovary weights at 5 mg/kg/day andwere within 10% of control values. There was not an increased

DRAFT: DO NOT CITE OR QUOTE
64
incidence of histopathology findings in the testes, prostate, uterus,vagina or ovaries (histopathology was not done on the mammarygland) at any dose in any generation of parental animals,compared to controls. There were no necropsy or histopathologyfindings in the male offspring of atrazine-treated dams that wouldindicate excessive maternal exposure to estrogens (Jessup, 1979).
7.4.5 Rat Developmental Toxicity Studies
Atrazine. Pregnant Sprague-Dawley rats were exposed to up to100 mg/kg/day of atrazine from days six to 15 of their pregnancies. There were no findings, in the visceral examinations, of anymalformations or variations in the gonads at any dose. The sexratios in all the dose groups were similar to the control sex ratio(Ginkis, 1991).
Simazine. Pregnant Sprague-Dawley rats were exposed to up to600 mg/kg/day of simazine from days six to 15 of theirpregnancies. There were no findings, in the visceral examinations,of any malformations or variations in the gonads at any dose. Thesex ratios in all the dose groups were similar to the control sexratio (Mainiero et al., 1986).
Propazine. Pregnant Sprague-Dawley rats were exposed to up to600 mg/kg/day of propazine from days six to 15 of theirpregnancies. There were no findings, in the visceral examinations,of any malformations or variations in the gonads at any dose. Thesex ratios in all the dose groups were similar to the control sexratio (Fritz, 1976).
DACT. Pregnant Sprague-Dawley rats were exposed to up to 150mg/kg/day of DACT from days six to 15 of their pregnancies. There were no findings, in the visceral examinations, of anymalformations or variations in the gonads at any dose. The sexratios in all the dose groups were similar to the control sex ratio(Hummal et al., 1989).

DRAFT: DO NOT CITE OR QUOTE
65
G-30033. Pregnant Tif:RAI rats were exposed to up to 100mg/kg/day of G-30033 from days six to 15 of their pregnancies.There were no findings, in the visceral examinations, of anymalformations or variations in the gonads at any dose. The sexratios in all the dose groups were similar to the control sex ratio(Gerspach, 1991).
G-28279. Pregnant Tif:RAI rats were exposed to up to 100mg/kg/day of G-28279 from days six to 15 of their pregnancies.There were no findings, in the visceral examinations, of anymalformations or variations in the gonads at any dose. The sexratios in all the dose groups were similar to the control sex ratio(Marty, 1992).
7.4.6 Rabbit Developmental Toxicity Studies
Atrazine. Pregnant New Zealand White rabbits were exposed toup to 75 mg/kg/day of atrazine from days seven to 19 of theirpregnancies. There were no findings, in the visceral examinations,of any malformations or variations in the gonads at any dose. Thesex ratios in all the dose groups were similar to the control sexratio (Arthur, 1984a).
Simazine. Pregnant New Zealand White rabbits were exposed toup to 200 mg/kg/day of simazine from days seven to 19 of theirpregnancies. There were no findings, in the visceral examinations,of any malformations or variations in the gonads at any dose. Thesex ratios in all the dose groups were similar to the control sexratio (Arthur, 1984b).
Propazine. Pregnant New Zealand White rabbits were exposed toup to 50 mg/kg/day of atrazine from days seven to 19 of theirpregnancies. One male offspring in the mid-dose group of 10mg/kg/day was found to have absent testes. Otherwise, there wereno findings, in the visceral examinations, of any malformations orvariations in the gonads at any dose. The sex ratios in all the dosegroups were similar to the control sex ratio (Knapp, 1995).

DRAFT: DO NOT CITE OR QUOTE
66
The bioassays described above provide little evidence of an estrogeniceffect. Dosing in utero with estrogenic agents has been associated with findingssuch as cryptochidism, hypospadias and anorchism (Daston et al., 1997; Danzo,1998). Developmental toxicity studies in both the rat and rabbit andmultigeneration reproduction studies in the rat, failed to show an increasedincidence of these, or any other, abnormalities of the gonads. Multigenerationreproduction studies in the rat did not indicate that male offspring of atrazine-treated dams had any difficulties impregnating females although decreasedfertility in males exposed to increased levels of estrogen or estrogen mimickingcompounds in utero, has been described (Daston et al., 1997; Danzo, 1998). Developmental toxicity studies in both the rat and rabbit and multigenerationreproduction studies in the rat, failed to show any alterations in sex ratioscompared to controls. Ample evidence is available that estrogen exposure canresult in germ cell depletion in the seminiferous tubules within a few weeks ofcommencement of estrogen administration (Blanco-Rodríguez andMartínez-García, 1996).
Subchronic rat and dog studies and chronic dog studies failed to showany histopathology alterations in the seminiferous tubules or in any part of thetestes, or in the prostate. Excessive exposure to estrogen induces proliferationof the uterine endometrium. Subchronic rat and dog studies and chronic dogstudies failed to show any histopathology alterations in the uterus, and, in thestudies where uterine weights were determined, no alteration in uterine weightsin response to triazine exposure were noted either. Excessive estrogenexposure might also be expected to result in alterations in the vagina - such asvaginal hyperplasia and vaginal wall thickening, or changes in the ovaries - suchas an increase in ovarian stromal cells or enlarged ovaries. Subchronic rat anddog studies and chronic dog studies failed to show any histopathologyalterations in the vagina or ovaries following exposure to the triazines. Ovarianweights were also not affected by triazine exposure.
The only potential endocrine alteration that is consistently seen in thesebioassays is an alteration in either relative or absolute testes weight. Thisalteration is, however, somewhat variable. In seven rat studies and one dogstudy testes weights were increased; in two rat studies weight were decreased;in three dog studies and one rat study testes weights were not altered. Thus, ina total of 14 studies, testes weight was increased in eight studies, decreased intwo, and not altered in four. Excessive estrogen stimulation would be expectedto decrease testes weight.

DRAFT: DO NOT CITE OR QUOTE
67
The studies described above do not indicate an estrogenic effect ofatrazine, simazine, propazine, DACT, G-30033, or G-28279. All the parametersexamined for possible estrogenic effects were unaltered save one- testesweight. The testes weight alterations were variable, and the majority of the timethey were altered, they were increased when one would expect that they wouldbe decreased.
7.5 Overall Conclusions of Estrogenic Activity Data
Multiple studies that examine the estrogenic activity of atrazine, simazineand DACT have been reviewed by the Agency. Most, but not all, studiesindicate that these chemicals do not possess estrogenic activity. Utertrophicresponse assays, uterine thymidine incorporation assays, MCF-7 cellproliferation assays, luciferase reporter gene assays in MCF-7 cells, in vivoprogesterone receptor binding assays, uterine peroxidase assays, and estrogenreceptor mediated growth in were all negative for estrogenic or progesteroneactivity of the triazine herbicides.
The few that yielded positive results were performed under conditions thatfavored an estrogenic effect of atrazine, or were performed at very high doselevels relative to the doses that induce mammary tumors in SD females.
A study examining atrazine's effects on aromatase activity indicated anupregulation of aromatase in vitro activity following atrazine treatment. The rolethis finding may play in bringing about an increase in serum estrogen in vivo isunclear as this study was conducted in a cell line and assays such as utertrophicresponse assays, and uterine thymidine incorporation assays, conducted in vivo,were negative.
An examination of the data from several bioassays (chronic, subchronic,developmental, and reproductive studies) employing atrazine, simazine,propazine and the major atrazine metabolites did not provide any evidence of anestrogenic effect resulting from exposure to these compounds.

DRAFT: DO NOT CITE OR QUOTE
68
Chapter 8
8 Structure Activity Relationship
Atrazine belongs to a class of compounds known as triazines in reference to thetriazine ring structure that they contain. Several compounds containing triazine ringsare presently registered for use in the U.S. as pesticides. Many of these pesticides(but not all) will have nitrogen atoms attached to carbon two and four. Compounds withthis moiety are more appropriately referred to as “amino-s-triazines.” These triazine-containing chemicals can be divided into a several classes of compounds: sulfonylurea-triazine compounds (that do not have the nitrogen at C2 and 4);alkyamino, alkythio-triazines, alkoxy-triazines and chloro-triazines. Atrazine is achlorotriazine. The distinction between the chemical classes lies in the groupsattached to the R1 position of the triazine ring (C6). Chloro-triazines will have achlorine atom at the R1 position. The alkyamnio-triazines will have an alkyamniomoiety at R1 and the alkoxy will have an hydroxyl moiety at R1. Alkythio compoundswill have an alkythio group at R1. Sulfonylurea compounds will have, at R1, asulfonated urea moiety to which another structure, frequently a benzene ring, isattached. The structures of atrazine and several atrazine metabolites are shown inFigure 8-1. The structures of the amino-s-triazine ring itself and of chlosulfuron, arepresentative example of a sulfonylurea compound, are shown in Figures 8-2 and 8-3. The structures of the chloro-triazine pesticides simazine and propazine are shown inFigure 8-4.
Two-year bioassay studies using female Sprague-Dawley rats have beenperformed on several of the triazine compounds. As shown in Tables 8-1 and 8-2,(Only those studies that used Sprague-Dawley or CD rats, were submitted to EPA asguideline studies, and have undergone an EPA review are included in these tables)bioassay results demonstrate that the triazine ring structure, in and of itself, is notcarcinogenic for mammary tumors in the female Sprague-Dawley rat (Spencer, 1991).Not shown in Tables 8-1 and 8-2 are the results from five two-year bioassays usingsulfonyurea compounds. Four out of the five studies with sulfonyurea compounds werenegative for carcinogenicity. The fact that four out of five sulfonyurea and three out offour alkyl amino, alkoxy, or alkythio-triazine compounds failed to induce tumors,including mammary tumors, in SD rats indicates that simply containing a triazine ring isnot sufficient to render a compound carcinogenic. Chlorine at the R1 position seems topromote an increased carcinogenic potential. For example, all four of the chlorotriazinecompounds are able to induce mammary tumors in female Sprague-Dawley rats. The

DRAFT: DO NOT CITE OR QUOTE
69
importance of a chlorine in the R1 position is further demonstrated by the lack ofcarcinogenicity seen with hydroxyatrazine (2-hydroxy-4-ethyl amino-6-isopropyl amino-s-triazine) (Chow and Hart, 1995). Hydroxyatrazine is a major plant metabolite ofatrazine that differs from atrazine only in that the chlorine at R1 is replaced by ahydroxyl-group.
Table 8-1. Results of Two-Year Bioassays with Alkylamino, alkoxy, and alkythio-triazine Compounds
ChemicalSpecies/
StrainResults Reference
CyromazineR1 - NH2
Rat-Sprague-Dawley
Negative for oncogenicity indoses up to 3000 ppm
Blair, et al., 1981
PrometrynR1- SCH3
Rat-Sprague-Dawley
Negative for oncogenicity indoses up to 1500 ppm
Chau, et al.,1991
TerbutrynR1-SCH3
Rat-CD®BR
Positive for female mammarytumors at 3000 ppm
Ciba-Geigy, 1980
PrometonR1- OCH3
Rat-Sprague-Dawley
Negative for oncogenicity indoses up to 1000 ppm
O’Conner, et al., 1988
Table 8-2. Results of Two-Year Bioassays with Chloro-triazine Compounds
ChemicalSpecies/
StrainResults Reference
AtrazineR1- Cl
Rat-Sprague-Dawley
Positive for female mammarytumors at 70 ppm
Mayhew, et al., 1986
SimazineR1- Cl
Rat-Sprague-Dawley
Positive for female mammarytumors at 100 ppm
McCormick, et al.,1988
PropazineR1- Cl
Rat-Sprague-Dawley
Positive for female mammarytumors at 3 ppm
Jessup, 1980a
CyanazineR1- Cl
Rat-Sprague-Dawley
Positive for female mammarytumors at 5 ppm
Bogdanffy, 1990

DRAFT: DO NOT CITE OR QUOTE
70
The lack of carcinogenicity of the hydroxyatrazine metabolite is further supportedby decisions reached by the HED Metabolism Committee (MARC) which concluded in aSeptember 29, 1995 meeting that: "For atrazine, the residues of concern for cancerdietary risk are parent and chloro metabolites" (US EPA, 1995).
Figure 8-1. Structures of Atrazine and Major Metabolites

DRAFT: DO NOT CITE OR QUOTE
71
Figure 8-2. Structure of the Amino-s-Triazine Ring
Figure 8-3. Structure of Chlorsulfuron

DRAFT: DO NOT CITE OR QUOTE
72
N
N
N
Cl
NH NH
C2H5C2H5
Figure 8-4. Structures of Simazine and Propazine
Simazine Propazine
Of special interest when looking at structural analogues of atrazine is thefunctional similarity between those compounds most similar to atrazine (simazine,propazine and cyanazine) in regards to carcinogenicity. Like atrazine, all three ofthese compounds are positive for mammary tumors in the female Sprague-Dawley rat(see Table 8-2) and all three have been tested in two-year mouse bioassays and havebeen found to be negative for carcinogenicity (Hazelette and Green, 1988; Jessup,1980b; Gellatly, 1981). Like atrazine, genotoxicity studies with simazine and propazinedo not support a mutagenic potential for these compounds (see Chapter 6 - StructuralAnalogs of atrazine of this document). Mutagenicity studies with cyanazine haveyielded mixed results, although the presence of the cyano group in cyanazineconfounds comparison of this compound with the three other chloro-s-triazines relativeto mutagenicity.

DRAFT: DO NOT CITE OR QUOTE
73
Chapter 9
9 Hormonal and Estrus Cyclicity Studies
The four previously described two-year bioassays in the SD rat clearlydemonstrated that atrazine may increase mammary tumor incidence or decreaselatency in the SD female. Atrazine exposure may also decrease pituitary adenomalatency in the SD female, but does not appear to alter pituitary tumor incidence. Reviews of numerous mutagenicity studies indicates that DNA damage does notappear to be contributing to these carcinogenic effects. Furthermore, results indicatethat atrazine does not appear to be acting as a xenoestrogen to induce mammarytumors. The two-year bioassays with the CD-1 mouse and the F-344 rat demonstratedthat there are strain/species differences in the carcinogenic effects of atrazine.
The lack of a mutagenic or exogenous estrogenic effect of atrazine, combinedwith the known hormonal dependence of rat mammary tumors, suggests that aperturbation of an endogenous hormonal mechanism may be responsible for theincrease in mammary tumors and decreased latency of pituitary adenomas seenfollowing atrazine exposure in the SD rat.
Mammary tumors and pituitary adenomas in the SD female are both verycommon occurrences. The historical control data shown in Table 9-1 demonstrates thehigh background tumor incidence rate for these tumor types in the female SD rat. Thebackground tumor incidence rates of mammary tumors in SD males is <2% - muchlower than in females (Lang, 1992; McMartin et al., 1992). Pituitary adenomas, on theother hand, are very common in the SD male. Spontaneous pituitary adenoma ratesare approximately 60% in SD males (Lang, 1992; McMartin et al., 1992).
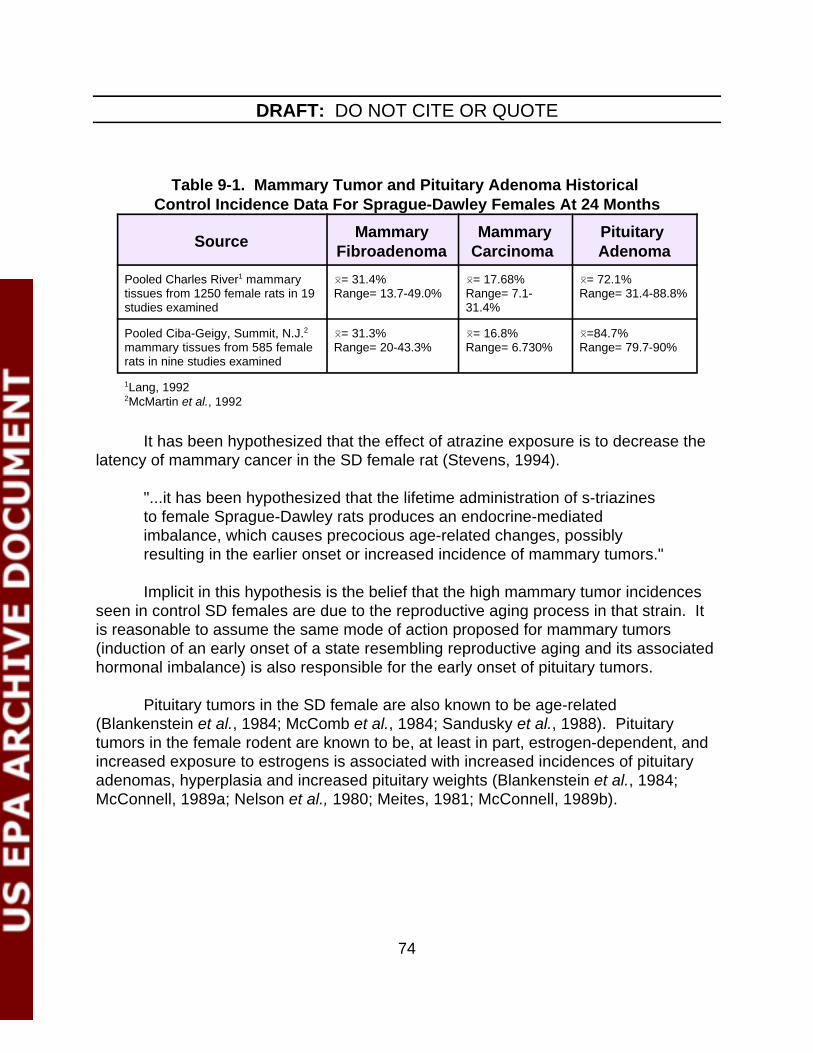
DRAFT: DO NOT CITE OR QUOTE
74
Table 9-1. Mammary Tumor and Pituitary Adenoma Historical Control Incidence Data For Sprague-Dawley Females At 24 Months
SourceMammary
FibroadenomaMammary
Carcinoma Pituitary Adenoma
Pooled Charles River1 mammarytissues from 1250 female rats in 19studies examined
0= 31.4%Range= 13.7-49.0%
0= 17.68%Range= 7.1-31.4%
0= 72.1%Range= 31.4-88.8%
Pooled Ciba-Geigy, Summit, N.J.2
mammary tissues from 585 femalerats in nine studies examined
0= 31.3%Range= 20-43.3%
0= 16.8%Range= 6.730%
0=84.7%Range= 79.7-90%
1Lang, 19922McMartin et al., 1992
It has been hypothesized that the effect of atrazine exposure is to decrease thelatency of mammary cancer in the SD female rat (Stevens, 1994).
"...it has been hypothesized that the lifetime administration of s-triazinesto female Sprague-Dawley rats produces an endocrine-mediatedimbalance, which causes precocious age-related changes, possiblyresulting in the earlier onset or increased incidence of mammary tumors."
Implicit in this hypothesis is the belief that the high mammary tumor incidencesseen in control SD females are due to the reproductive aging process in that strain. Itis reasonable to assume the same mode of action proposed for mammary tumors(induction of an early onset of a state resembling reproductive aging and its associatedhormonal imbalance) is also responsible for the early onset of pituitary tumors.
Pituitary tumors in the SD female are also known to be age-related(Blankenstein et al., 1984; McComb et al., 1984; Sandusky et al., 1988). Pituitarytumors in the female rodent are known to be, at least in part, estrogen-dependent, andincreased exposure to estrogens is associated with increased incidences of pituitaryadenomas, hyperplasia and increased pituitary weights (Blankenstein et al., 1984;McConnell, 1989a; Nelson et al., 1980; Meites, 1981; McConnell, 1989b).
DRAFT: DO NOT CITE OR QUOTE
75
9.1 Rat Reproductive Aging Process
Mammary tumors are recognized as a common and expected occurrencein female SD rats, and appear to be increased primarily in aging animals. Theage-related nature of the mammary tumors in female SD rats has beencommented on by various authors (Cooper, 1983; Cutts and Noble, 1964). Theage-related nature of the mammary tumors in SD females is illustrated by themammary tumor incidences in control animals in the two-year oncogenicitystudies described in this document. The great majority (75%) of the mammarytumors in control rats in the Thakur study (1991a) occurred when the rats weregreater than one-year old. The other Thakur study (1992a) also had 75% of themammary tumors in controls appearing after one year of age. A third two-yearoncogenicity study found that 82% of the mammary tumors in control animalsoccurred when the animals were greater than one-year old (Morseth, 1998).
Understanding the hypothesis that the mechanism of reproductive agingin the female Sprague-Dawley leads to a high incidence of mammary tumors infemales of that strain necessitates understanding the processes of reproductiveaging in SD rats that are believed to lead to increased incidences of mammarytumors. At this point, a brief review and summary of these processes in the SDrat are presented. For comparisons sake, the reproductive aging process in theF-344 rat is also presented.
9.1.1 Sprague-Dawley
9.1.1.1 Alterations at the Ovary And Vagina
For reasons that are not yet completely understood, anaging female SD rat experiences a dampening of the preovulatorypituitary gonadotropin (luteinizing hormone, LH) surge (Zou, 1996;Cooper and Walker, 1979; Huang et al., 1978). The preovulatoryLH surge is responsible for inducing ovulation and, when theamplitude of the surge falls below a critical threshold, there isfailure to ovulate. The ovaries of females with subthreshold LHsurges will have reduced numbers of, or no, functional corpea lutea(CL), an increased number of secondary and antral follicles, andan increased number of follicles undergoing atresia (Smith andConn, 1983; Cooper et al., 1996; Huang and Meites, 1975). Theincrease in numbers of unruptured follicles results in prolongedexposure to moderately elevated levels of serum estrogens as

DRAFT: DO NOT CITE OR QUOTE
76
these follicles continue to secrete estrogen. Eventually, theunovulated follicles do undergo the process of atresia. Thus, theovaries of aging SD rats will display increased numbers of atreticfollicles. In the aging SD rat, each successive wave of follicles thatundergoes atresia is replaced by a new crop that will again sustainthe serum estradiol levels at a moderately elevated level.
Corpea lutea form from follicles that have ovulated andundergo the process of "lutenization" in which the granulosa cellsof the follicle begin to secrete progesterone instead of estradiol. Because follicle ovulation is reduced in aging SD females, CLnumbers will be reduced.
The vaginal smears of aging SD rats will consist primarily ofcornified epithelial cells reflecting the tonic level of estradiol in theserum and the absence of, or low levels of, progesterone. Thepresence of vaginal cornification day after day as a result of theaging process is termed "constant estrus."
These changes typically begin to take place in a normallyaging rat at approximately nine months of age. A typical estrouscycle in a young SD rat (< nine months in age) is four or five daysin length. The first two days are diestrus, the third is proestrus andthe fourth is estrus. Five-day cycles typically have an extra day ofdiestrus. During the aging process, cycles first become irregularand then the majority of the females transition into constant estrus.In the final months of the females life, she may become completelyacyclic. Vaginal smears performed on animals at this time willindicate that the animals are in a state of extended or persistentdiestrus.
The above described pattern should be considered ageneral rule only. The exact age at which these changes takeplace and their exact order may vary with the individual rat or withseparate colonies of rats (LeFevere and McClintock, 1988).

DRAFT: DO NOT CITE OR QUOTE
77
9.1.1.2 Alterations at the Pituitary
Age-associated pituitary alterations have beenwell-described in the SD female. Pituitary weight, pituitaryhyperplasia and pituitary adenomas have all been reported to beincreased in aged female rats that undergo constant estrus as theirprimary mode of reproductive aging (SD and Long-Evans, forexample) (Cónsole et al., 1997; McComb et al., 1984). Aproliferation of the cells of the anterior pituitary that secreteprolactin (i.e., lactotrophs) has been shown to be responsible formuch of the increase in pituitary weight and hyperplasia seen inthe aged female SD. The great majority of the pituitary adenomasseen in the aging female SD have also been found to haveoriginated from lactotrophs (Sandusky et al., 1988).
An increase in lacotroph number might be expected to resultin increased serum prolactin levels in the aging rat as these cellscontinue to secrete prolactin. Increased serum prolactin levels areseen in aged SD females, and these increased serum prolactinlevels have been correlated with increased pituitary weight,increased pituitary hyperplasia, and increased incidence ofpituitary adenomas (Baird et al., 1990; McComb et al., 1986; vanPutten et al., 1988).
The alterations seen at the pituitary are believed to be dueto the prolonged exposure to moderately elevated levels of serumestrogens that occur following anovulation (Nelson et al., 1980;Goya et al., 1990; McConnell, 1989b). Serum estrogen is known tobe mitogenic to pituitary lactotrophs, and the prolonged exposureto moderately elevated serum estradiol levels likely mediates theincreases in pituitary weight, hyperplasia and adenomas seen inthe aging SD female. Additionally, estrogen appears to damagetuberoinfundibular neurons in the hypothalmus to inhibit productionof prolactin inhibiting factor (PIF) (Sarkar et al., 1982). PIF inhibitsthe production by the pituitary of prolactin. Thus, inhibition of itsproduction by estrogen would have the effect of increasingprolactin production by the pituitary.

DRAFT: DO NOT CITE OR QUOTE
78
9.1.2 Fischer-344
9.1.2.1 Alterations at the Ovary and Vagina
Like the young-adult Sprague-Dawley female, theyoung-adult female F-344 typically displays regular four- to five-day estrous cycles. However, unlike the SD female, the ability ofthe aging F-344 rat to obtain an ovulatory LH surge is notcompromised. Also, unlike the SD female that develops a patternof constant estrus within the first year of life, the regular ovariancycles present in the F-344 give way to a pattern of repetitivepseudopregnancies (Huang et al., 1978; McConnell, 1989a; Estes,1982). In this condition, ovulation occurs periodically and thenewly formed CL are maintained for extended periods (10 to16days). There are two distinct changes in the pattern of hormonesecretion that are present in the pseudopregnant female -increases in serum prolactin and serum progesterone. First, thereare two, daily prolactin peaks that occur just before lights on andjust before lights out. In response to the elevated prolactin levels,the ovarian CL are maintained. The functional CL are responsiblefor the elevated levels of progesterone present in these animals. In addition to CL, the ovaries of an aging F-344 will contain amoderate number of antral and secondary follicles, and a moderatenumber of atretic follicles. Again, these findings are in contrast tothe SD female that will contain few, if any CL, many secondary andantral follicles, and many atretic follicles. Also, in contrast to theconstant estrus female that is characterized by uninterruptedcornification (typical of the aging SD rat), the vaginal cytology ofthe pseudopregnant female is primarily leukocytic. This vaginalsmear pattern is similar to that seen during the diestrus period ofthe estrous cycle and this pattern may be referred to as "persistentdiestrus," although the term “repetitive pseudopregnancy” is alsoused, and is the more descriptive term. As was the case with theSD, in the final months of the F-344 females life, she may becomecompletely acyclic. The same disclaimer about variability in SD ratreproductive aging process applies to the F-344. The descriptionabove can only be seen as a generality.

DRAFT: DO NOT CITE OR QUOTE
79
9.1.2.2 Alterations at the Pituitary
The alterations seen in the pituitary of the female SD are notseen in the aging F-344 rat. The incidence of pituitary adenomasin female F-344 rats at two-years of age is much less than theincidence of pituitary adenomas in female SD rats at two-years ofage (Sandusky et al., 1988). Increases in pituitary weights andpituitary hyperplasia are also not commonly seen in the agingF-344 female.
9.1.3 Summary of the Reproductive Aging Process in SD and F-344Rats
Characteristics of reproductive aging in the female SD have beenthroughly studied (Cooper, 1983; Cooper et al., 1996; LeFevere andMcClintock, 1988; Meites et al., 1980). The appeal of hypothesizing thatthese events may result in mammary carcinogenicity comes from theprolonged exposure to estrogen and prolactin that results from theseevents. As noted above -- the increased days spent in estrus in the agingSD female appears to be related to the attenuated LH surge, whichresults in numerous unovulated ovarian follicles constantly producingestrogen. The prolonged exposure to estrogen acts at the pituitary tostimulate increased prolactin production.
The role of prolonged or inappropriate exposure to estrogen andprolactin in mammary carcinogenicity in rats has been well-established(Nandi et al., 1995; Russo et al., 1990; Cutts and Noble, 1964; Meites,1972). It is reasonable to hypothesize that the prolonged exposure toestrogen and prolactin that results from the normal reproductive agingprocess in SD females may be responsible for the high levels ofmammary tumors normally seen in this strain. This hypothesis was firstadvanced as long ago as 1966 (Durbin et al., 1966).

DRAFT: DO NOT CITE OR QUOTE
80
The mode of reproductive aging in the F-344 rat is different fromthat of the SD female. Reproductive aging in the F-344 does not result inprolonged estrogen exposure. Prolactin levels are increased in the agingF-344, as are progesterone levels.
A summary of the different modes of reproductive aging in the SD,and F-334 is shown in Figure 9-1.

DRAFT: DO NOT CITE OR QUOTE
81
Figure 9-1. Summary of the Reproductive Aging Process in Different Rat Strains F-344
< Normal cycle is a four to five days with 25% of the timespent in estrus, 25% spent in proestrus and 50% spent indiestrus;
< Reproductive aging becomes evident at approximately 12months;
< Reproductive aging is characterized by increased prolactinsurges that leads to maintenance of the corpea lutea;
< There is an increase in the days spent in diestrus, andincreased exposure to progesterone.
< In very aged animals, acyclicity is common
Sprague-Dawley, Long Evans, Wistar1
< Normal cycle is a four to five day cycle with 25% of the timespent in estrus, 25% spent in proestrus and 50% spent indiestrus;
< Reproductive aging becomes evident at approximately nineto 12 months;
< Reproductive aging is characterized by decreasedgonadotropin surges that leads to maintenance of primary,secondary and antral ovarian follicles;
< An irregular cycling pattern develops followed by anincrease in the days spent in estrus, and prolongedexposure to estrogen;
< Pituitary alterations such as increase in pituitary weight,increases in pituitary hyperplasia and pituitary -adenomasbecome common as the animal ages;
< Acyclicity develops in the final months of life
< Normal cycling º irregular cycles º prolonged estrus º acyclicity
(begins around (occurs in the last few 5-6 weeks old) months of life
$ 21 months of age)
1There may be temporal differences between and among strains

DRAFT: DO NOT CITE OR QUOTE
2Implantation of pituitaries under the renal capsule results in high levels of prolactin secretionfrom the implanted pituitaries.
3Lesions in this area of the brain result in production of high levels of pituitary prolactin.
82
9.1.4 Strain Differences in Reproductive Aging and MammaryTumors
Evidence supporting the hypothesis that the normal reproductiveaging process in the SD female leads to mammary tumors in this straincan be found by comparing the hormonal environment associated withreproductive aging and mammary tumor historical control values in theF-344 to the SD. Direct experimental evidence implicating thereproductive aging process of the SD is also available and is discussedbelow.
9.1.4.1 The Different Hormonal Environments of the SDand F-344 Rats During Reproductive Aging
The hormonal environment of the normally aging SD femaleis one of increased exposure to both estrogen and prolactin. Thehormonal environment of the normally aging F-344 rat is one ofincreased exposure to prolactin and progesterone.
Increased or prolonged exposure to estrogen or prolactin isimplicated in mammary carcinogenesis. Female rats that havebeen implanted subcutaneously with pellets of estrogen have veryhigh incidences of mammary tumors and an earlier onset of thosetumors than would be expected (Cooper, 1983; Cutts and Noble,1964). Animals that have had pituitaries implanted under theirrenal capsule2 or have been given lesions in the arcuatenucleus-median eminence of the hypothalmus3 also have highincidences and earlier onset of mammary tumors (Welsch et al.,1970a and 1970b). In contrast, increased or prolonged exposureto progesterone does not increase the incidence or decrease theonset of mammary tumors in the rat (Welsch, 1987).
DRAFT: DO NOT CITE OR QUOTE
83
Increased exposure to either estrogen or prolactin increasesmammary tumor risk in the rat, while increased exposure toprogesterone - in the absence of increased exposure to eitherestrogen or prolactin - does not increase mammary tumor risk.Progesterone can, in fact, be anti-carcinogenic. The ratio ofestrogen to progesterone is an important aspect to consider whenexamining mammary carcinogenesis. Progesterone has beenshown to "oppose" estrogen. This means that high levels ofprogesterone can counteract high levels of estrogen and reducethe increased risk of mammary cancer seen with high serumestrogen levels. The molecular mechanism by which progesteroneopposes estrogen's actions appears to be by down-regulation ofmammary, hypothalamic and pituitary estrogen receptors(Mauvais-Jarvis et al., 1987; Libertun et al., 1979; Cho et al., 1993;Brann et al., 1988).
9.1.4.2 Different Mammary Tumor Historical ControlValues in the SD and the F-344
The Thakur studies described above show the low incidenceof mammary tumors in control F-344 females. Charles RiverLaboratories has reported relatively low historical control rates forfemale F-344 mammary carcinomas (1.5%) and fibroadenomas(12%) while control rates for other types of mammary tumors areeven lower (Lang, 1990). A recent report of the spontaneousneoplasms seen in the National Toxicology Program (NTP) two-year bioassays confirms a low mammary carcinoma rate for F-344females (3.1%), but finds that the fibroadenoma incidence rates arenow 41.2% after having increased from 28% in 1985 (Haseman etal., 1998). Hazelton Labs reports the historical control incidence ofF-344 female mammary carcinomas (adenocarcinomas andcarcinomas combined) as 3.8% and the rate of fibroadenomas as14.9% (Hazelton Labs, 1994). The values for backgroundmammary tumors in the F-344 are much lower than in the SD (withthe exception of adenocarcinomas in the NTP studies). Thesedifferences in background mammary tumor incidences could bedue the different mechanisms of reproductive aging.

DRAFT: DO NOT CITE OR QUOTE
84
Historical control data from rat strains other than the SD andF-344 confirms that animals whose predominant mode ofreproductive aging is constant estrus have higher backgroundmammary tumor incidences than F-344. Table 9-2 displays themode of aging in several strains of rats and the historical controlincidence of mammary tumors in each strain.
Table 9-2. Relationship of Reproductive Aging and Mammary Tumor Incidence In Various Rodent Strains
Strain/Species
Reproductive AgingSpontaneous
Mammary TumorIncidence
References
SD/rat Constant estrus -30% fibroadenoma-12% carcinoma
Aging -- Estes, 1982
Tumors -- Lang, 1992
Wistar/rat Constant estrus -25% fibroadenoma-13% carcinoma
Aging -- Mora et al., 1994a; Moraet al.,1994b
Tumors -- Walsh and Poteracki,1994
Long-EvansHooded/rat
Constant estrus -50% with eitherfibroadenoma orcarcinoma
Aging -- Estes, 1982
Tumors -- Cooper, 1983
F-344/rat Pseudopregnancy -12% fibroadenoma-2% carcinoma
Aging -- Estes, 1982
Tumors -- Lang, 1990

DRAFT: DO NOT CITE OR QUOTE
85
9.1.5 Studies in Which Premature Aging Was Artificially Delayed orInduced and How Mammary Tumor Incidences Were Affected
Experimental evidence is available that examines the relationshipbetween reproductive aging and mammary carcinogenesis.
9.1.5.1 Mammary Tumor Onset Is Delayed in Rats Fed aDiet Supplemented with L-tyrosine
Supplementing the diet of the female Long-Evans rat withthe amino acid L-tyrosine will delay the onset of constant estrus(Cooper and Walker, 1979). These studies showed thatapproximately 95% of the female Long-Evans rats on regular dietswill be in constant estrus by 13 months of age while 60% of thefemales fed L-tyrosine will still be cycling normally at 16 months ofage. Mammary tumor onset in the Long-Evans females fedL-tyrosine supplemented diets was also delayed. Mammary tumorincidence in control LE females was 67% by 19 to 21 months ofage. No female fed an L-tyrosine supplemented diet had amammary tumor at 19 to 21 months. Even at 25 months of age,L-tyrosine supplemented animals tumor incidence rates are only25%.
The implication from these findings is that the delay in theappearance of mammary tumors is due to the delay in the onset ofconstant estrus (i.e., the delay in reproductive aging).

DRAFT: DO NOT CITE OR QUOTE
86
9.1.5.2 Mammary Tumor Onset Is Accelerated in FemalesReceiving High Levels of Estrogen ThroughImplants
The hormonal state of constant estrus rodents is one ofmoderately elevated levels of serum estrogen and low levels ofserum progesterone (Huang et al., 1978). Ovariectomizing femalerodents and then exposing them to a chronically high level ofestrogen through subcutaneous implants of silastic tubingcontaining estrogen will mimic the hormonal state seen in constantestrus females and these females will develop mammary tumorsmuch earlier than control animals (Cooper, 1983). The mammarytumor incidence rate at 12 months for Long-Evans females whowere OVX at four months of age and given implants is 100% whilethe control rate is less than 5%.
9.1.5.3 Mammary Tumor Onset Is Accelerated in FemalesWhose Reproductive Aging Has Been Acceleratedby Exposure to Constant Light
Rats exposed to constant light (rather than a light cycle suchas 12 hours light/12 hours dark or 14 hours light/10 hours dark)show an earlier onset of constant estrus. Such rats show anincreased incidence and earlier onset (latency was decreased by34% compared to animals on light/dark cycles) of mammarytumors- primarily adenocarcinomas (Molina et al., 1981).
9.1.6 The Correlation Between Increased Days in Estrus andMammary Tumors in a Two-Year Bioassay
Estrous cycle evaluations were performed in a two-year bioassayusing SD females (tumor data from this study - Morseth, 1998 - isdiscussed in section 5.3 while estrous cycle data is discussed belowunder section 9.2.3 – Results of Estrous Cycle Measurements in the SDrat - Thakur, 1999). These evaluations showed that the percent of totaldays spent in estrus was significantly higher in animals with mammarytumors than in those without. Tumor latency was also reduced in animalsthat spent a longer time in estrus.
9.1.7 Summary and Discussion of the Hypothesis that Mammary

DRAFT: DO NOT CITE OR QUOTE
87
Tumors Are Induced by the Reproductive Aging Process
The hypothesis that the mode of reproductive aging in some strainsof rat (including the SD) may contribute to mammary tumor formation hasreceived attention for many years. The hypothesis is well established inthat:
< Female SD rats undergo a mode of reproductive aging thatresults in extended periods of estrus;
< These periods of extended estrus result in prolongedexposure to moderately elevated serum estrogen derivedfrom unovulated ovarian follicles;
< Serum estrogen acts at the pituitary to increase prolactinsecretion;
< Increased exposure to estrogen and prolactin increases therisk of mammary carcinogenicity in rats.
The connection between the mode of reproductive aging andmammary carcinogenicity can be confirmed by examining rodent strains inthat reproductive aging involves induction of a primarily constant estrusstate. The estrous cycles of the SD, Wistar, and Long-Evans strain of ratall progress through a state of constant estrus as the animals age and allthese strains have high background incidences of mammary tumors. Theestrous cycle of the aging F-344 strain of rat is primarily one ofpseudopregnancy and background mammary tumor incidences in theF-344 rat are low.

DRAFT: DO NOT CITE OR QUOTE
88
Experimental evidence showing the relationship betweenreproductive aging and mammary carcinogenicity is provided by studies inwhich the reproductive aging process in rats was either delayed oraccelerated resulting in mammary tumor onset being delayed oraccelerated. Delaying the onset of reproductive aging by feeding rats dietsupplemented with L-tyrosine delayed the onset of mammary tumors. Accelerating the reproductive aging process by creating a hormonal statethat mimics the hormonal state of reproductive aging results in mammarytumors appearing at a much earlier age. Accelerating the reproductiveaging process by exposure to constant light also accelerates the onset ofmammary tumors.
9.2 The Hypothesis that Atrazine Exposure Induces an Early Onset ofAttenuated LH Surge, Increased Days In Estrus, and ProlongedExposure to Estradiol
It is postulated that atrazine induces an early onset or increasedincidence of mammary tumors by inducing an early occurrence of an attenuatedLH surge, increased days in estrus, and prolonged exposure to estrogen andprolactin. The evidence testing this hypothesis can be found in six areas:
< Examination of the time-to-tumor in atrazine exposed rats;
< Examination of serum estradiol levels in atrazine exposed rats;
< Examination of alterations in the ovary (early onset of decreasedCL, increased antral, secondary and atretic follicles) and vagina(early onset of increased days in estrus) of atrazine exposed rats;
< Examination of the pre-ovulatory LH surge in atrazine exposedrats.
< Examination of pituitary alterations in atrazine-exposed rats.
< Examination of mammary gland alterations that are indicative ofprolactin exposure in atrazine-exposed rats.

DRAFT: DO NOT CITE OR QUOTE
89
9.2.1 Time-to-Tumor
Examination of the onset time of mammary tumors in female SDrats in the two-year bioassays (excluding the Mayhew study that is notamenable to this type of analysis) shows that atrazine exposure didinduce an earlier onset of carcinomas (Tables 9-3 and 9-4). An earlyonset of fibroadenomas was less evident, but nevertheless, there alsoappeared to be an early of onset of this tumor type. Onset time wasdetermined in these studies by examining the histopathology data and theclinical observations and correlating the appearance, by palpation, ofeach mass that was subsequently confirmed by histopathology to be amammary tumor. Analysis of the onset time for mammary tumors in thetwo-year bioassays with structurally related s-triazines simazine andpropazine, are also considered (Tables 9-5 and 9-6). Additional dataconcerning onset time can be obtained from a one-year study submittedby the registrant (Pettersen and Turnier, 1995).

DRAFT: DO NOT CITE OR QUOTE
90
Table 9-3. Time to Mammary Tumor in the Female SD Rat- Thakur (1992a) Terminal Sacrifice Protocol
Dose (mg/kg/day) and Tumor Type
0 Fib
3.79 Fib
23.01 Fib
0 Carc
3.79 Carc
23.01Carc
0 wk ofappear 76.4 76.1 72.7 78.9 72.5 65.4
#52wk 2/35(5.7%)
1/27(3.7%)
3/39(7.7%)
0/14(0%)
3/11(27.3%)
6/18(33.3%)
p-value 0.379 0.598 0.552 0.024* 0.072 0.021*
53-78 wk 16/35(45.7%)
15/27(55.6%)
18/39(46.2%)
8/14(57.1%)
3/11(27.3%)
5/18(27.8%)
p-value 0.414 0.304 0.578 0.099 0.138 0.094
79-104 wk 17/35(48.6%)
11/27(40.7%)
18/39(46.2%)
6/14(42.9%)
5/11(45.5%)
7/18(38.9%)
p-value 0.15 0.361 0.510 0.423 0.608 0.553
Notes: The dose shown is in mg/kg/day.
Fib= fibroadenomas. Carc= carcinomas and adenomas combined.
*p#0.05

DRAFT: DO NOT CITE OR QUOTE
91
Table 9-4. Time to Mammary Tumor in the Two-year Morseth (1988) Study
Dose (mg/kg/day) and Tumor Type
0Fib
1.5 Fib
3.1 Fib
4.2 Fib
24.4 Fib
0 Carc
1.5 Carc
3.1 Carc
4.2 Carc
24.4 Carc
0
wk ofappear 76.1 72.4 73.7 73.3 76.3 72.6 77.2 78.6 64.4 64.8
#52wk 0/15(0%)
1/18(5.6%)
3/26(11.5%)
1/26(3.8%)
1/22(4.5%)
1/11(9.1%)
2/15(13.3%)
0/14(0%)
2/10(20.0%)
6/23(26.1%)
p-value 0.549N 0.546 0.244 0.634 0.595 0.047* 0.619 0.440N 0.462 0.252
53-78 wk 9/15(60.0%)
11/18(61.1%)
13/26(50.0%)
14/26(53.8%)
9/22(40.9%)
5/11(45.5%)
6/15(40.0%)
7/14(50.0%)
6/10(60.0%)
7/23(30.4%)
p-value 0.104N 0.614 0.386N 0.479N 0.211N 0.110N 0.548 0.570 0.410 0.315
79-104 wk 6/15(40.0%)
6/18(33.3%)
10/26(38.5%)
11/26(42.3%)
12/22(54.5%)
5/11(45.5%)
7/15(46.7%)
7/14(50.0%)
2/10(20.0%)
10/23(43.5%)
p-value 0.092 0.486N 0.590N 0.575 0.297 0.526 0.632 0.570 0.221N 0.600
NOTEs: The dose shown is in mg/kg/day.
Fib= fibroadenomas. Carc= carcinomas and adenomas combined.
Trend for the dose is shown in the control column. "N" indicates that the trend is negative; otherwise trend is positive. *p#0.05

DRAFT: DO NOT CITE OR QUOTE
92
Table 9-5. Time to Mammary Tumor with Simazine in SD rats (McCormick et al., 1988)
Dose (mg/kg/day) and Tumor Type
0 Fib
0.52 Fib
5.3 Fib
63.1 Fib
0 Carc
0.52 Carc
5.3 Carc
63.1Carc
0 wk ofappear
86 81.7 89.6 68.8 83.4 80.7 82.1 65.9
#52wk 1/23(4.3%)
1/28(3.6%)
0/18(0%)
6/42(14.3%)
2/18(11.1%)
3/17(17.6%)
2/20(10.0%)
13/44(29.5%)
p-value 0.029* 0.704 0.561 0.212 0.026* 0.472 0.656 0.110
53-78 wk 6/23(26.1%)
7/28(25.0%)
3/18(16.7%)
26/32(61.9%)
3/18(16.6%)
4/17(23.5%)
4/20(20.0%)
18/44(40.9%)
p-value 0.000** 0.590 0.370 0.006** 0.013* 0.466 0.563 0.059
79-104 wk 16/23(69.6%)
20/28(71.4%)
15/18(83.3%)
10/42(23.8%)
13/18(72.2%)
10/17(58.8%)
14/20(70.0%)
13/44(29.5%)
p-value 0.000**N 0.563 0.260 0.000** N 0.000** N 0.316 N 0.583 N 0.003** N
NOTEs: The dose shown is in mg/kg/day.
Fib= fibroadenomas. Carc= carcinomas and adenomas combined.
Trend for the dose is shown in the control column. "N" indicates that the trend is negative;otherwise trend is positive.
*p#0.05; **p#0.01.

DRAFT: DO NOT CITE OR QUOTE
93
Table 9-6. Time to Mammary Tumor with Propazine in SD rats (Jessup, 1980a)
Dose (mg/kg/day) and tumor type
0 Fib
0.2 Fib
6.4 Fib
68 Fib
0 Carc
0.2 Carc
6.4 Carc
68 Carc
0 wk ofappearance
84 80.6 77.6 75.7 90.2 77.8 85.2 77.28
#52wk 1/21(4.8%)
0/21(0%)
1/17(5.9%)
0/19 (0%) 0/7(0%)
0/15(0%)
0/13(0%)
2/25(8.0%)
p-value 0.406 0.500N 0.701 0.525N 0.170 1.000 1.000 0.605
53-78 wk 4/21(19.0%)
10/21(47.6%)
8/17(47.1%)
13/19(68.4%)
2/7(28.6%)
8/15(53.3%)
4/13(30.8%)
11/25(44.0%)
p-value 0.005** 0.050 0.067 0.002** 0.430 0.268 0.664 0.389
79-104 wk 16/21(76.2%)
11/21(52.4%)
8/17(47.1%)
6/19(31.6%)
5/7(71.4%)
7/15(46.7%)
9/13(69.2%)
12/25(48.0%)
p-value 0.010*N 0.099N 0.065N 0.006** N 0.220N 0.268N 0.664N 0.254N
NOTEs: The dose shown is in mg/kg/day.
Fib= fibroadenomas. Carc= carcinomas and adenomas combined.
Trend for the dose is shown in the control column. "N" indicates that the trend is negative; otherwisetrend is positive.
*p#0.05; **p#0.01.

DRAFT: DO NOT CITE OR QUOTE
94
9.2.1.1 Thakur, 1992a
The mean week of fibroadenoma onset in controls in thisstudy was 76.4 weeks. The mean week of fibroadenoma onset inthe 3.79 mg/kg/day and 23.01 mg/kg/day groups was 76.1 and72.7, respectively. The mean week of onset for carcinomas was78.9 in controls while the mean week of onset for carcinomas andadenomas in the 3.79 mg/kg/day and 23.01 mg/kg/day groups was72.5 and 65.4.
The percentage of carcinomas and adenomas occurring inthe first year of the study in controls was 0% while at 3.79 mg/kg/day and 23.01 mg/kg/day 27.3 and 33.3% of thecarcinomas appeared in the first year of the study.
9.2.1.2 Thakur, 1991a
The percentage of fibroadenomas occurring in the first yearof the study in the controls was 16.7. At 4.23 mg/kg/day and 26.23mg/kg/day the percentage was 0 and 20%.
The percentage of carcinomas occurring in the first year ofthe study was 0 in controls and 33% at 4.23 mg/kg/day and 50% at26.23 mg/kg/day.

DRAFT: DO NOT CITE OR QUOTE
95
9.2.1.3 Morseth, 1998
The mean week of fibroadenoma onset in controls in thisstudy was 76.1 weeks. The mean onset in the 1.5, 3.1, 4.2 and24.4 mg/kg/day groups was 72.4, 73.7, 73.3 and 76.3 weeks,respectively. The mean week of onset for carcinomas andadenomas in controls was 72.6 while the mean week of onset forthe 1.5, 3.1, 4.2 and 24.4 mg/kg/day groups was 77.2, 78.6, 64.4and 64.8, respectively.
The percentage of fibroadenomas in the control group thatoccurred in the first year of the study was 0. The percentage offibroadenomas that occurred in the first year of the study in the 1.5,3.1, 4.2 and 24.4 mg/kg/day groups was 5.6, 11.5, 3.8 and 4.5,respectively. The percentage of carcinomas and adenomas thatoccurred in the first year of the study was 9.1 and the percentagethat occurred in the 1.5, 3.1, 4.2 and 24.4 mg/kg/day groups was13.3, 0, 20, 26.1, respectively.
There was an increased mammary tumor incidence at the 53week interim sacrifice, which also indicates and earlier tumoronset. There were no fibroadenomas at the 53 week sacrifice inthe 20 females of the control group, but in the dose groups thefibroadenoma rates were 1/20, 2/19, 2/20, 1/20 in the 1.5, 3.1, 4.2and 24.4 mg/kg/day groups, respectively.
9.2.1.4 Pettersen and Turnier, 1995
The percentage of animals with fibroadenomas in thecontrols was 5.9 and the percentage that occurred at the 0.8, 1.7,2.8, 4.1 and 23.9 mg/kg/day dose groups was 5.9, 5.9, 0, 8.8, and8.8, respectively. The percentage of animals with carcinomas andadenomas in the control group was 2.9 and the percentage thatoccurred at the 0.8, 1.7, 2.8, 4.1 and 23.9 mg/kg/day dose groupswas 2.9, 2.9, 5.9, 5.9 and 14.7, respectively.

DRAFT: DO NOT CITE OR QUOTE
96
9.2.1.5 McCormick et al., 1988 (simazine)
The mean week of fibroadenoma onset in controls in thisstudy was 86 weeks. The mean onset in the 0.52, 5.3, and 63.1mg/kg/day groups was 81.7, 89.6 and 68.8 weeks, respectively.The mean week of onset for carcinomas and adenomas was 83.4for controls and 80.7, 82.1 and 65.9 for the 0.52, 5.3, and 63.1mg/kg/day groups, respectively.
The percentage of fibroadenomas occurring in the first yearof the study in controls was 4.3 and the percentage of the 0.52,5.3, and 63.1 mg/kg/day groups occurring in the first year of thestudy was 3.6, 0, and 14.3, respectively. The percentage ofcarcinomas occurring in the first year of the study in controls was11.1 and the percentage occurring in the dose groups was 17.6, 10and 29.5, respectively.
9.2.1.6 Jessup, 1980a (propazine)
The mean week of fibroadenoma onset in controls in thisstudy was 84 weeks. The mean fibroadenoma onset in the 0.2, 6.4and 68 mg/kg/day groups was 80.6, 77.6 and 75.7 weeks,respectively. The mean week of carcinoma onset in controls was90.2 and the mean week of onset for the 0.2, 6.4 and 68 mg/kg/daygroups was 77.8, 85.2 and 77.3, respectively.
The percentage of fibroadenomas occurring in the first yearof the study was 4.8 and the percentage of fibroadenomasoccurring in the first year in the 0.2, 6.4 and 68 mg/kg/day groupwas 0, 5.9, and 0, respectively. The percentage of carcinomas thatoccurred in the first year of the study in controls was 0 and thepercentage occurring in the dose groups was 0, 0, and eight,respectively.

DRAFT: DO NOT CITE OR QUOTE
97
9.2.2 Conclusions Of The Time-to-Tumor Data
The data from four two-year and one-year bioassays demonstratethat there is a decreased time-to-tumor for mammary tumors in the femaleSD rat following atrazine exposure. The earlier onset is more evident forcarcinomas and adenomas than for the fibroadenomas. The mean weekof carcinoma onset drops with atrazine exposure in both of the two-yearstudies with atrazine for which mean week of tumor onset is applied andalso drops with exposure in the two-year bioassays with simazine andpropazine.
The percentage of carcinomas occurring in the first year of thestudy is increased with exposure in three two-year bioassays withatrazine and is also increased in a one-year bioassay. Both the simazineand propazine studies showed an increase in percent of carcinomas andfibroadenomas occurring in the first year in dosed animals compared tocontrols.
9.2.3 Alterations in the Ovary and Vagina
9.2.3.1 Sprague-Dawley
Aging SD rats normally undergo alterations in their estrouscycles. These alterations are described above under the section9.1 and are summarized in Figure 9.1. In brief, the alterations in anormally aging SD female rat are an increase in the percentage ofdays of the estrous cycle spent in estrus from 25% prior to ninemonths old to >40% after nine months old. The increase in daysspent in estrus occurs at the expense of days spent in diestrus andproestrus.
DRAFT: DO NOT CITE OR QUOTE
98
Eldridge et al. (1993a) examined estrous cycle alterations infemale SD rats in response to atrazine exposure. Care should betaken when reading this document not to confuse the study that isreferred to as Thakur, 1991a and the study referred to as Eldridge,1993a. The Thakur and Eldridge studies are, in fact, the samestudies. The hormone and estrous cycle evaluation are referred toin this document as Eldridge, 1993a while the animal necropsy andhistopathology portions of this study is referred to as Thakur,1991a.
Histomorphologic evaluation of the ovaries and other tissues(including the vagina and mammary gland) from theThakur/Eldridge studies was performed and is referred to asMcConnell, 1995 in this document. Only the histomorphologicevaluation of the ovaries and the vagina are discussed in thissection of the document. Discussed under section 9.2.5 is thehistomorphic evaluation of the mammary gland of atrazine-exposedrats.
Therefore, the three citations -- Thakur, 1991a; Eldridge,1993a; and McConnell, 1995 -- refer to different analysisperformed on the same group of SD or F-344 rats as part of thesame study.
Additionally, estrous cycles were evaluated in one month,six month and two-year studies -- Morseth, 1996a, 1996b, 1998). The protocol and measurements for estrous cycles in these studiesare described below.
9.2.3.2 Fischer-344
Aging F-344 rats normally undergo alterations in theirestrous cycles. These alterations are described above and aresummarized in Figure 9.1. In brief, a state of pseudopregnancy orpersistent diestrus becomes a common occurrence in F-344 rats asthey progress beyond approximately nine months of age. Theovaries of animals in persistent diestrus contain CL, a moderatenumber of secondary and antral follicles, and moderate numbers ofatretic follicles.

DRAFT: DO NOT CITE OR QUOTE
99
The same study that examined serum hormone levels inF-344 (Eldridge et al., 1993b) also examined estrous cyclealterations in response to atrazine exposure. Doses and sacrificeschedules for these two studies were previously described. Histomorphologic evaluation of the ovaries and other tissues(including the vagina, mammary gland, and pituitary) from theThakur/Eldridge studies was performed and is referred to asMcConnell, 1995 in this document.
9.2.3.3 Protocol For Examination of the Ovaries andEstrous Cycle Measurements
Thakur Studies. Two separate studies wereconducted: one with SD females and one with F-344females. In both studies, 10 animals per dose group weresacrificed after approximately one, three, nine, 12, 15, and18 months of exposure to atrazine. Two weeks beforescheduled sacrifice daily vaginal smears were performed. The smears were examined for the presence of keratinizedepithelium, nucleated epithelium and leucocytes. Thepresence of well-defined keratinized cells was taken to beindicative of estrus. The presence of leucocytes in thevaginal smears indicated diestrus and the presence ofmoderate- to- dense nucleated epithelium and moderatecornified epithelium was taken to be indicative of proestrus. Following the 14 days of smear collection animals weresacrificed at their next proestrus day. Thus, some animalswere sacrificed on their scheduled sacrifice date (on day 15after vaginal smears were begun) while others weresacrificed in the week following their scheduled sacrificedate (on days 16 to 21 following initiation of vaginal smears,depending on when their next proestrus phase occurred). Any animals that had not had a proestrus phase by day 21after initiation of vaginal smears was sacrificed on day 21. Surviving animals were sacrificed at 24 months, againfollowing the procedure described above whereby eachanimal is sacrificed on a proestrus phase, if possible.
DRAFT: DO NOT CITE OR QUOTE
100
Results of the estrous cycle evaluations wereexamined at: the dose groups at each individual timepointcompared to controls; for trend within dose at eachindividual timepoint; and the effect of treatment over time. These are the same parameters for which the hormonemeasurements were analyzed.
The ovaries of all females in these studies (both theSD and F-344 studies) were examined by standardhistomorphologic techniques for several parametersincluding (but not limited to): absence of CL; reducednumber of CL; presence of secondary and antral follicles;presence of atretic follicles.
The parameters of absence of CL and reducednumber of CL were graded as simply being "present" or"absent." The parameters of secondary, antral follicles, andatretic follicles were graded on a scale of zero to five withzero indicating the parameter was absent and one to fiveindicating the parameter was present - the higher thenumber the more of the follicles were present.
Morseth, 1996a (one-month study). Vaginal smearswere performed after seven days of treatment and continueddaily for three weeks. The criteria for evaluation andclassification of vaginal smears was similar to that followedin the Thakur studies.
Morseth, 1996b (six-month study). Vaginal smearswere performed on the first day of treatment and continueddaily for 14 consecutive days every four weeks. Thus, ananimal was smeared in cycles of two weeks smearingfollowed by two weeks non-smearing. This cycle continuedthroughout the study. The criteria for evaluation andclassification of vaginal smears was similar to that followedin the Thakur studies.

DRAFT: DO NOT CITE OR QUOTE
101
Morseth, 1998 (two-year study). Estrous cyclesevaluations were performed on all intact females in thisstudy (80 per dose group). Vaginal smears were performedfor two consecutive weeks every two weeks starting onstudy week one. Thus, animals had two weeks of smearsfollowed by two weeks without smears. The criteria forevaluation and classification of vaginal smears was similarto that followed in the Thakur studies. Estrous cycle data forthe first 46 weeks of the study have been analyzed.
9.2.3.4 Results of Ovarian Histomorphology and EstrousCycle Measurements in the SD Rat (McConnell,1995 and Eldridge, 1993a)
The only study that performed histomorphologic examinationof the ovaries of atrazine-treated SD rats was the Thakur, 1991astudy. The histomorphologic data are presented in McConnell,1995 while the vaginal smear data (for determination of phase inestrous cycle) are presented in Eldridge, 1993a.
Ovarian Histomorphologic Examination (McConnell,1995). An early onset of anovulation is seen as early asthree months following atrazine exposure. After threemonths of exposure the number of control animals with anabsence of CL was zero of ten while the number of treatedanimals with no CL was one of ten at the 4.23 mg/kg/daygroup and two of ten in the 26.23 mg/kg/day group. Thissmall increase in animals with no CL indicates thatincidence of anovulation was increased in the dose groups. The fact that no CL were seen at all indicates that ovulationhad not even occurred in the recent past, as even the CLfrom previous cycles in which ovulation did occur hadregressed (i.e., become corpus albicans). The number ofanimals at three months with reduced numbers of CL wasincreased from two in the control group to three at 4.23mg/kg/day and three at 26.23 mg/kg/day. Reduced CLnumber also indicates anovulation, but in these animalsovulation likely did occur in the recent past as CL of sometype were present. The antral follicle group mean gradedindex (antral follicle score on the above described scale of

DRAFT: DO NOT CITE OR QUOTE
102
zero to five divided by the number of animals in the group)was 1.2 for control, 2.1 for 4.23 mg/kg/day and 2.2 for 26.23mg/kg/day. This increase in antral follicles again indicatesanovulation.
Evidence of early onset of anovulation was also seenat nine months. After nine months of exposure the numberof control animals with an absence of CL was six of tenwhile the number of treated animals with no CL was sevenof ten at the 4.23 mg/kg/day group and ten of ten in the26.23 mg/kg/day group. The antral follicle group meangraded index was 2.6 for control, 3.1 for 4.23 mg/kg/day and3.8 for 26.23 mg/kg/day.
By 12 months of exposure the ovarianhistomorphology indicated that nearly all the animals in alldose groups were not ovulating.
Estrous Cycle Evaluations (Eldridge, 1993a).Appendix Table 8 displays the results of the estrous cycleanalyses done with the SD rat in Eldridge, 1993a.
The estrous cycle results seen in this study are whatwould be expected in the SD strain of rat. The percent daysspent in estrus in control animals increases as the animalsage at the expense of days spent in diestrus, and proestrus. Linear regression analysis indicated that the decrease indiestrus and proestrus and the increase in estrus over theperiod of one to18 months was statistically- significant atp<0.01. The % days in both diestrus and proestrus are alsodecreased in a statistically-significant manner (p<0.01) inboth dose groups for the period from one to 18 months. Both dose groups showed a significant (p<0.01) trendtoward an increased % days spent in estrus from monthsone to 18. Such an increase was seen in controls, is to beexpected, and did not appear to be altered by exposure toatrazine.

DRAFT: DO NOT CITE OR QUOTE
103
The percent days of the cycle spent in estrus wasdramatically increased in dosed animals compared tocontrols at nine, 12 and 18 months. Females in the 4.23and 26.23 mg/kg/day groups at nine months spent anaverage of 34.3 and 44.8% of their days in estrus,respectively (p<0.05 at 70 and p<0.01 at 400 ppm). This iscompared to 24% spent in estrus at the controls. Thedose-related trend, as determined using aTerpstra-Jonckbeere Trend Test, showed a significantincrease in % days spent in estrus (p<0.01). At 12 monthsthere was also a dose-related trend (p<0.05) but theincreases in dosed groups compared to controls asdetermined by ANOVA were not significant at either dose.
The percent days in proestrus is similar in dosedanimals compared to controls for all timepoints. There is asignificant trend (p<0.01) in both dose groups for adecrease in % days spent in proestrus over time. Thisdecrease was seen in controls also and is to be expected. Atrazine exposure did not appear to effect this trend.
The percent days spent in diestrus was significantlydecreased in dose groups compared to controls at nine, 12and 18 months. Females at nine months spent a mean of44.8% of the days of the estrous cycle in diestrus. Dosedfemales spent 36.2% (p<0.05 compared to control) for the70 ppm dose and 25.9% (p<0.01 compared to control) of thedays in diestrus. The dose-related trend at nine months wassignificant at p<0.01. At 12 months there was also adose-related trend that was significant at p<0.01. The 4.23mg/kg/day group, at 12 months, was decreased 14%compared to control, but this was not statistically-significant. The 24.23 mg/kg/day group at 12 months was decreased28% compared to controls and this was significant (p<0.05). The trend at 18 months was decreased in a dose-relatedmanner (p<0.01) while both the 4.23 and 24.23 mg/kg/daygroups compared to controls by ANOVA were alsostatistically-significantly decreased (p<0.05, for both).
To summarize the estrous cycle data from this study:

DRAFT: DO NOT CITE OR QUOTE
104
-- When analyzed for effect over time it was seen thatanimals in both dose groups and the controlsexhibited an increase in % days in estrus and adecrease in % days in di- and proestrus as the studyprogressed. These alterations are to be expected inan aging SD female rat and exposure to atrazine didnot appear to affect these parameters compared tocontrols.
-- When analyzed for effect of dose it was seen thatthere was a significant increase, compared tocontrols, in percent days spent in estrus at nine, 12and 18 months in both dose groups. The percentdays spent in diestrus significantly decreased in bothdose groups compared to controls.
9.2.3.5 Results of Estrous Cycle Measurements in the SDRat (Morseth, 1996a and 1996b)
These studies examined the effect of atrazine on the estrouscycle and on plasma concentrations of the hormones LH andprolactin. The hormone measurement data from these studies willbe discussed below. Preovulatory LH levels, and the estrous cycleevaluations will be discussed here. The studies were of one month(Morseth, 1996a) and six months (Morseth, 1996b) in duration.
One-Month Study. Female SD rats were exposed to0, 2.5, 5, 40 and 200 mg/kg/day technical grade atrazine for28 to 31 days. Ninety females per dose group were used. Dosing was by gavage once a day, at approximately thesame time each day.

DRAFT: DO NOT CITE OR QUOTE
105
The results of the smears indicated an effect ofatrazine exposure on vaginal cycling. Atrazine exposureinduced a dose-dependent increase in the number ofanimals having irregular cycles. The nature of the irregularcycles was both an increase in estrous cycle blocks (twoconsecutive days in estrus) and an increase in diestrusblocks (four consecutive days in diestrus). The effects ofatrazine on the estrous cycle in this study are mostpronounced at 40 and 200 mg/kg/day with a statistically-significant increase in females displaying diestrus blocks atboth 40 and 200 mg/kg/day and a statistically-significantincrease in females displaying estrus blocks at 200mg/kg/day only (p 0.05 for both diestrus and estrus blocksusing pairwise comparison). These data are shown inAppendix Table 9.
Six-Month Study. Female SD rats were exposed,through the diet, to 0, 1.8, 3.65 and 29.4 mg/kg/daytechnical grade atrazine for six months. Ninety females perdose group were used.
A statistically-significant increase in percent days inestrus was evident as early as 3.5 months into the study inthe high dose group, and in the mid-dose group by 5.5months into the study. The low-dose group neverexperienced statistically-significant alterations in their estruscycles. These data are shown in Appendix Table 10.

DRAFT: DO NOT CITE OR QUOTE
106
9.2.3.6 Results of Estrous Cycle Measurements in the SDRat (Morseth, 1998)
The estrous cycle evaluations performed in this two-yearbioassay demonstrate that atrazine-treated females displayincreased days in estrus sooner than control animals. All animals,irrespective of dose group, spent a normal amount of time in estrus(approximately 25% of the days spent in estrus) for the first 10weeks of the study. By the 13 to 14 week measurement periodthough, the atrazine-treated animals began to display more daysspent in estrus. These increases were most evident in animals ofthe high-dose group while, for most timepoints, the other threedose groups showed only marginal increases in percent days inestrus. The differences between the control and dose groups weremost evident at week 25 to 26 where controls spent 53.7% of thedays in estrus compared to 63.8, 59.7, 55.4, and 72.1% of the daysin estrus for 1.5, 3.1, 4.2, and 24.4 mg/kg/day groups. AppendixTable 11 displays the percent days in estrus by dose group for allthe time periods up to 46 weeks. Animals dosed with atrazine alsoshowed an increase in the likelihood of having an estrus block ofseven days during one of the three measurement periods in the17-26 week interval. Again, this effect was most evident at thehigh-dose group, but was also seen at the other dose groups. Appendix Table 12 displays these data.
In addition to examining the amount of time spent in estrusby atrazine-treated animals compared to control animals, this studyalso examined the relationship between amount of time spent inestrus and mammary tumor incidence. There was a clearrelationship between the amount of time spent in estrus andmammary tumor onset. These data are shown in Appendix Tables13 and 14.

DRAFT: DO NOT CITE OR QUOTE
107
9.2.3.7 Results of Ovarian Histomorphology and EstrousCycle Measurements in the F-344 Rat (McConnell,1995)
The only study that performed histomorphologic examinationof the ovaries of atrazine-treated Fischer rats was the Thakur,1991b study. The histomorphologic evaluation data is presentedas McConnell, 1995 while the vaginal smear data (fordetermination of phase in estrous cycle) is presented as Eldridge,1993b. HED believes that the estrous cycle evaluation (vaginalsmears) reported in Eldridge, 1993b are unreliable. Thus, thesedata are not reported. The histomorphology data from McConnell,1995 are instead used to determine stage of the estrous cycle.
Ovarian Histomorphologic Examination in the F-344(McConnell, 1995). The great majority of F-344 rats in allgroups, both control and dose groups, maintained CLthroughout most of the study. Only at the final, 24-month,timepoint were there dramatic decreases in CL numbers. The atrazine-treated animals at this timepoint did not showdecreases in CL numbers any more severe than the controlanimals. The reduction in CL numbers at this late timepointappears to be a consequence of a natural progression of theanimals from persistent diestrus into acyclicity. All animalsin all dose groups maintained moderate numbers ofsecondary, antral and atretic follicles throughout the study -including the 24-month timepoint.

DRAFT: DO NOT CITE OR QUOTE
108
Histomorphology to Determine Stage of the EstrousCycle in the F-344 (McConnell, 1995). All animals in alldose groups appeared to maintain normal cycles throughthe first 12 months of the study. At the 15-month timepointapproximately half the animals in all dose groups (five of tenin control; three of ten at 0.68 mg/kg/day; 6 of 11 at 4.82mg/kg/day; five of ten at 14.05 mg/kg/day, and five of ten at34.33 mg/kg/day) were in a state of extended diestrus. Thestate of extended diestrus was indicated by the presence ofincreased vaginal mucification -- which is indicative ofextended diestrus (McConnell, 1989a). At the 18-monthtimepoint approximately 70 to 80% of the animals in all dosegroups displayed increased vaginal mucification. Thepersistent diestrus (or pseudopregnancy) that ischaracteristic in an aging F-344 was evident by 15 monthsand was quite common by 18 months. At 24 months theincidence of vaginal mucification was still high, but thepreviously mentioned reduction in animals with CL indicatedthat a progression towards acyclicity was occurring in theanimals in this study.
9.2.4 Summary And Discussion From The Ovarian Histomorphologyand Estrous Cycle Measurements In F-344 and SD Strains
Over the duration of the study, both strains of rat exhibited ovarianhistomorphology and estrous cycles that would be expected for thosestrains. The F-344 maintained CL throughout most the 24-month studyand showed an increase in days spent in diestrus (as indicated by vaginalmucification) at the post-12 month timepoints (McConnell, 1995). The SDshowed decreased numbers (and frequently, a complete absence of) CL,increases in secondary, antral and atretic follicles, and an increase inpercentage of days in estrus (as indicated by the vaginal smears) as thestudy progressed (Eldridge, 1993b; McConnell, 1995).

DRAFT: DO NOT CITE OR QUOTE
109
Atrazine exposure in the F-344 did not seem to alter estrouscycles; atrazine exposure in the SD increased the number of estrus anddiestrus blocks after as little as one month of exposure (Morseth, 1996a). Three months of exposure increased the percentage of days spent inestrus and decreased the percentage of days spent in diestrus, but notsignificantly so (Thakur, 1991a). By nine months of atrazine exposure thepercentage of days spent in estrus were significantly increased comparedto controls and the percentage of days spent in diestrus was significantlydecreased. The increase in estrus and diestrus blocks after one month ofatrazine exposure indicates that these females were cycling irregularly. The increased days spent in estrus at three and nine months indicatesthat the atrazine-exposed animals in this study were entering constantestrus sooner than the control animals.
As noted above, reproductive aging is manifested in the estrouscycle first as irregular cycling, then as constant estrus, and finally asacyclicity/persistent diestrus. Atrazine exposure was able to induceirregular cycling in the SD females after only one month of exposure -when the animals in this study were about three months of age.
The Thakur, 1991a; Eldridge, 1993a, and the two shorter durationMorseth studies indicate that atrazine exposure can alter estrous cyclicityin the female SD rat. Atrazine exposure did not seem to effect estrouscyclicity in the F-344 rat (McConnell, 1995).

DRAFT: DO NOT CITE OR QUOTE
110
The estrous cycle data from the Morseth two-year study (describedin Thakur, 1999) confirmed the findings from Eldridge (1993a) and theshorter duration Morseth studies (Morseth 1996a and 1996b). In thisstudy atrazine exposure resulted in SD females spending an increasedamount of time in estrus earlier than control animals. The high-dosegroup (26.23 mg/kg/day) females in the Thakur study showed a groupmean of 44.8% of the days in estrus at nine months. The control animalsreached this level of days in estrus, but not until 12 months when theirgroup mean days in estrus was 42.6%. The high-dose (24.4 mg/kg/day)females in the Morseth, 1998 study had a group mean of 47.8% of thedays in estrus during weeks 17 to 18. The control animals reached thislevel of days in estrus, but not until weeks 21 to 22 when their groupmean days in estrus was 45.6%. All four studies together provide strongevidence that atrazine can disrupt estrous cycles in the SD female andcan lead to an early onset of increased percent days in estrus comparedto control animals.
The Morseth (1998) study examines correlations between days inestrus and mammary tumor incidence and onset and demonstrates thatincreased days in estrus early in the life of an animal decreases the timeto onset of mammary tumors. This Morseth study also demonstrated thateven animals who are not spending increased time in estrus during theearly period of life, will show an increased risk of mammary cancer whenchronically fed atrazine.
9.2.5 Serum Estradiol and Prolactin Levels
Given the postulated mode of action, it is important that oneexamine serum estradiol and prolactin levels and confirm that they are, infact, altered following exposure to atrazine.
Serum hormone levels of estradiol (as well as progesterone,prolactin and corticosterone) in atrazine exposed SD female rats wereexamined in Eldridge, 1993a. Serum hormone levels of these fourhormones were examined in F-344 females in Eldridge, 1993b.

DRAFT: DO NOT CITE OR QUOTE
111
Serum corticosterone was measured as an indicator of stress whileestradiol, prolactin, and progesterone were measured because of theirroles (estrogen and prolactin as promoters of and progesterone as apossible inhibitor of) mammary carcinogenesis.
Eldridge 1993a and 1993b are discussed below. Thehistomorphological evaluation of the mammary gland in atrazine-exposedSD rats is also discussed below (McConnell, 1995)
9.2.5.1 Protocol and Rationale for Hormone Measurement
Doses and sacrifice schedules for these two studies werepreviously described. The protocol and measurements forhormone levels in these studies are described below.
Blood was collected from the trunk of all animals atscheduled sacrifice. Two weeks prior to each scheduled sacrificevaginal smears were performed. Animals were sacrificed duringproestrus, if possible. If, after 21 days of vaginal smears, ananimal was not in proestrus, then this animal was sacrificed,irrespective of what stage of the estrous cycle the animal was in. Blood samples were used for the determination of serum estradiol,progesterone, prolactin, and corticosterone. The hormonesestradiol, progesterone, and prolactin all are important in theregulation and maintenance of normal reproductive functioning inthe rat and could potentially play roles in mammary tumorpathogenesis. Corticosterone measurements were taken to testthe hypothesis that dosing the animals with atrazine producesstress (and thus an elevation of serum corticosterone levels) thatmay play a role in mammary gland neoplasia.

DRAFT: DO NOT CITE OR QUOTE
112
Radioimmunoassay techniques were used to measure levelsof each hormone. Standard curves were constructed and samplevalues were compared to the standard curve. The results of themeasurements were examined for alterations in:
< each individual timepoint compared to controls;
< trend within dose, and;
< effect of treatment over time.
9.2.5.2 Results of Hormone Measurements -- F-344(Eldridge, et al., 1993b)
The results of the hormone measurements did not revealany consistently statistically-significant alterations in serumhormone levels compared to controls for any of the hormonestested. There were occasional significant alterations such assignificantly decreased (p< 0.05) progesterone levels in the 4.82mg/kg/day dose and corticosterone levels in the 34.33 mg/kg/daygroup at the 12-month timepoint compared to controls; significantnegative trends in estradiol levels at the 12-month timepoint,progesterone levels at the 12- and 18-month timepoints, andcorticosterone levels at the 12- and 15-month timepoints, andprolactin levels displayed a significant positive trend at the three-month timepoint only. Careful consideration of these alterationsindicated that they did not appear to be related to atrazineexposure.
There were alterations in serum hormone levels that wereseen in control as well as treated rats. These were: decreases inestradiol levels in the later half of the study; significantly increasingprogesterone levels from one to18 months. Decreased estradioland increased progesterone are expected in rats undergoing areproductive aging process involving pseudopregnancy (Huang etal., 1978). Exposure to atrazine did not alter the age-relatedchanges in estradiol or progesterone levels.
An increase in prolactin levels might be expected in an

DRAFT: DO NOT CITE OR QUOTE
113
aging rat undergoing pseudopregnancy. However, consistentincreases in serum prolactin levels were not seen.
9.2.5.3 Results of Hormone Measurements - SD (Eldridgeet al., 1993a)
Appendix Table 15 displays the results of the hormonemeasurements in the SD females.
Serum progesterone and corticosterone levels did not showany significant dose-related alterations compared to controls. Serum prolactin levels in dosed groups did not show any significantdose-related alterations with the exception of the 26.23 mg/kg/daygroup that did however, show a negative trend (p<0.01) over thenine to 18 month period and a positive trend at nine months. These alterations in serum prolactin likely were related tocompound exposure.
Serum estradiol levels in the control rats in this studyshowed a positive trend (levels increased as time increased) overmonths one through nine. Exposure to atrazine did not alter thistrend. The 4.23 and 26.23 mg/kg/day dose groups also showed asignificantly positive trend from months one through nine. Thesetrends are expected as constant estrus would be expected to beginto set in as these animals approach nine months of age. Examination of the pairwise comparisons at three months indicatesthat treated animals had an early onset of increased serumestradiol levels compared to controls. At three months controlestradiol levels were 3.5 ng/mL, 70 ppm levels were 11.2, and 400ppm levels were 16.2 ng/mL. The increase at 70 ppm wassignificant at p<0.05, the increase at 400 ppm was significant atp<0.01 and the trend, determined using a Terpstra-JonckbeereTrend Test, was positive at p<0.05. At nine months control and4.23 mg/kg/day group estradiol levels were similar, but the 26.23mg/kg/day group compared to controls was increased 44%. Atnine months estradiol levels were elevated compared to control,but not significantly so.
Prolactin levels were not altered either as a result ofatrazine exposure or as result of aging in this study.

DRAFT: DO NOT CITE OR QUOTE
114
9.2.5.4 Results of the Histomorphologic Evaluation of theMammary Gland - SD (McConnell, 1995)
The mammary gland is clearly a hormone-responsive tissue. Various tissues in the mammary gland contain receptors for thehormones estrogen, progesterone and prolactin and exposure tothese hormones effects on these tissues. A detailedhistomorphologic analysis of mammary gland (and other) tissuesfrom the rats in the Thakur, 1991a study was performed. Thishistomorphologic analysis is referred to in this document asMcConnell, 1995.
The mammary glands were examined for these alterations:
< Acinar development - indicative primarily of estradiolexposure
< Acinar/lobular development- indicative of bothprolactin and progesterone exposure
< Secretory activity - indicative of prolactin, and to alesser extent, estrogen and progesterone exposure
< Dilated ducts with secretion - indicative of prolactin,and to a lesser extent, progesterone exposure
< Galactocele (milk cyst) - indicative of prolactin, and toa lesser extent, progesterone exposure
The alterations in the tissues of the acinar region areindicative of estrogen exposure (ductal epithelial hyperplasia andacinar development). The alterations related to milk production areprimarily prolactin-dependant (secretory activity, dilated ducts withsecretion, galactocele).

DRAFT: DO NOT CITE OR QUOTE
115
Appendix Table 16 displays the results of thehistomorphologic analysis of the mammary glands at months one,three, nine and 12 in the SD rats from Thakur, 1991a. Values at15, 18 and 24 months are not shown as these values are similar tocontrol values. The index weighted scores of several of the abovelisted parameters are shown in this table. An index weighted scoreassigns a numerical value to the severity of the finding assigned bythe pathologist. The higher the index weighted score, the moresevere was the finding in that group.
Increased prolactin exposure in the rat is associated withformation of galactoceles (milk cysts). Galactocele incidence andseverity in this study are shown in Appendix Table17. The resultsof the histomorphologic analysis are described below:
Acinar Development. An early onset of increasedexposure to estrogen is indicated by examination of thecolumn of Appendix Table 16 labeled "Acinar Development."The index scores at the one-month timepoint are slightlyhigher in the dose groups than in the control, but adose-response relationship was not seen. At the three-month timepoint the index scores are again increased overcontrol. The increase is at this timepoint is dose-relatedthough with the high dose being more severe than the lowdose. At both nine and 12 months the index score againindicate more severe acinar development in the dose groupscompared to the controls with the increase in severity beingespecially obvious at the high dose.
Acinar/Lobular Development. An early onset of thisparameter is evident. The one- and three-month timepointshave index scores in the dose groups that are similar to thecontrol index scores. The dose group index scores areclearly increased compared to controls at nine and 12 monthtimepoints though. This indicates that the atrazine-treatedanimals were exposed to elevated levels of prolactin at anearlier timepoint than the control animals.

DRAFT: DO NOT CITE OR QUOTE
116
Secretory Activity. The index scores for secretoryactivity also demonstrate an early onset of increasedprolactin exposure in the dose groups compared to thecontrols. Index scores at one and three months in the dosegroups were similar to control values, while index scores inboth dose groups were clearly elevated compared tocontrols at the nine- and 12-month timepoints.
Dilated Ducts with Secretion. Index scores at oneand three months in the dose groups were similar to controlvalues. The index scores for the 4.23 mg/kg/day groupcompared to controls were only slightly elevated. The indexscores for the 26.23 mg/kg/day group were greatly elevatedcompared to controls
Galactocele Incidence and Severity. No galactoceleswere observed in any group at the one- and three-monthtimepoints. At nine and 12 months galactoceles in the dosegroups were increased in both number and severity. By 15months galactocele incidence and severity were similarbetween control and dose groups.
9.2.6 Summary And Discussion Of The Hormone Measurements andHistomorphologic Alterations In F-344 And SD Strains
Serum corticosterone levels were not altered in F-344 or SDfemale rats by atrazine exposure. Serum corticosterone levels reflectstress and the lack of any alteration in these levels indicates that thedosing, and more importantly, the regular vaginal lavages, were notcausing the animals in these studies undue stress that may havecompromised the results of these studies.

DRAFT: DO NOT CITE OR QUOTE
117
Atrazine exposure in the F-344 females did not alter serumhormone levels of estradiol, progesterone or prolactin. Both control anddose groups did see decreases in serum estradiol levels for the latter halfof the study and a generally increasing level of progesterone for the oneto 18 month period. These changes in estradiol and progesterone are tobe expected in animals undergoing reproductive aging throughpseudopregnancy. What was not seen, but would be expected in ananimal undergoing reproductive aging through pseudopregnancy, wereincreases in serum prolactin levels.
Accurate serum prolactin levels from the rat can be difficult toobtain because many different factors can cause dramatic alterations inserum prolactin levels. For example, simple inadvertent stimulation of afemale rats nipples can induce large increases in serum prolactin(Freeman, 1981). Prolactin levels are also very sensitive to stress. A ratin pseudopregnancy is especially difficult to obtain accurate serumprolactin measurements from as these animals will display twice-dailyprolactin surges. Prolactin measurements from these animals will varydramatically depending on whether or not a measurement is taken duringa surge, and, if taken during a surge, at what point in the surge. Accurateprolactin measurements in a young, unmated rat, are easier to obtain asthese animals have relatively static prolactin levels except for have one,or possibly two, prolactin surges every four days (a proestrus afternoonsurge and, sometimes, a smaller surge on estrus) (Freeman, 1981;Butcher et al., 1974).
Despite these difficulties, it is still surprising that increasedprolactin levels were not measured in this study in the aging animals.

DRAFT: DO NOT CITE OR QUOTE
118
Atrazine exposure in the SD females did not alter serumprogesterone levels or serum prolactin levels in dose groups compared tocontrols. The serum estradiol levels in the SD rat were dramaticallyaltered by atrazine exposure and deserve special attention. Atrazineexposure resulted in an early exposure to high levels of estrogen. Thelevels of serum estrogen in the dosed groups of 70 and 400 ppm femalesat three months were 11.2 ± 12.6 and 16.2± 13 ng/mL compared to only3.5 ± 6.4 ng/mL in the control females at this time point. While thestandard deviations in these groups are large the increases are three toover four-fold, and the increases are statistically-significant using apairwise comparison. The atrazine exposed groups had higher serumestrogen levels than controls at the three-month timepoint. There wasalso a positive dose-related trend over the first nine months of the studyin estradiol levels. Exposure to such high levels of estrogen this early inthe rats life is not normal. Exposure to these levels of estrogen at ninemonths, as can be seen from Appendix Table 15, is normal. The earlyexposure to these high estrogen levels may be leading to an earlier onsetof mammary tumors.
As was the case with the F-344, increased prolactin levels wouldbe expected as a consequence of the normal aging process in the SD; yetincreases in serum prolactin were not seen in this study. Old SD femaleswith pituitary adenomas can have serum prolactin levels that areapproximately 13 times higher than in young SD females (Sarkar et al.,1982). An increase in all the groups (both control and atrazine-treated)would be expected as the pituitaries increased in size and pituitaryadenomas became common. By the 18- and 24-month timepoints themajority of the animals in all groups had pituitary adenomas; yet serumprolactin levels at these two timepoints were similar to control values. Increases in serum prolactin levels have been seen in numerous studiesin the published literature and are accepted to be a normal part of theaging process in the SD female and other rats that undergo constantestrus as the predominant mode of reproductive aging (Cónsole et al.,1997; McComb et al., 1984; Sandusky et al., 1988; Baird et al., 1990;McComb et al., 1986; van Putten et al., 1988).

DRAFT: DO NOT CITE OR QUOTE
119
The fact that measured serum prolactin levels were not increasedwith age in either strain must be considered a weakness in this study,despite the difficulties of such measurements. This is especially true inthe SD study where very large increases in serum prolactin levels shouldhave been evident.
Because of the lack of increased serum prolactin (as determinedby direct serum measurements) in the aged animals in Eldridge, 1993a,the histomorphologic data from this study was examined especiallyclosely for any signs of increased prolactin exposure.
The incidences and severity of all four parameters that indicateincreased exposure to prolactin (acinar/lobular development, secretoryactivity, dilated ducts with secretion, galactoceles) were increased inatrazine-treated groups compared to controls at the nine and 12-monthtimepoints. Index scores for values before nine months and after 12months were similar among dose groups. The increased index scores atnine and 12 months in dose groups compared to controls indicates anearly onset of increased prolactin exposure in the dose groups comparedto the control. With time, the normal aging process proceeds in thecontrol animals and by 15 months the control animals have "equalized" or"caught up" with the dose groups. Thus, index scores are similar for thetimepoints after 12 months. Index scores are similar for the timepointsprior to nine months because increases in prolactin require first thatestrogen be increased. The increased estrogen then acts at the pituitaryto induce lactotroph hyperplasia that results in increased prolactin levelsand, finally, increased incidence and severity of these mammary glandfindings. Appendix Table 15 shows increases in serum estradiol at threemonths in the dose groups compared to controls while Appendix table 16shows a dose-related increase in acinar development (primarily anestrogen-dependent effect) at three months in the dose groups comparedto control groups. The increased serum estrogen levels seen at threemonths are affecting the pituitary between three and by nine months thepituitary lactotrophs are proliferating and producing prolactin such that bynine months prolactin-dependent alterations at the mammary gland areevident in the dosed animals.

DRAFT: DO NOT CITE OR QUOTE
120
9.2.7 Preovulatory LH Levels
The effect of aging on the preovulatory luteinizing hormone (LH)surge, has been briefly discussed previously in this document. As inhumans, ovulation is triggered in rats by a sudden and dramatic increase(a surge) in serum LH levels. The attenuation of the preovulatory LHsurge in aging female rat strains, including the SD, has beenwell-described (Lu et al., 1979, Cooper et al., 1980). One- and six-monthstudies examining the effect of atrazine exposure on the preovulatory LHsurge are available (Morseth, 1996a; Morseth, 1996b; Minnema, 2000). These data show that atrazine exposures as short as one month candramatically attenuate the pre ovulatory LH surge. Plasma prolactin levelswere also determined in the Morseth, 1996a study and results of thisanalysis were reported. Plasma prolactin concentrations have beenshown to undergo a preovulatory surge in rats similar to the LH surge(Butcher et al., 1974). However, this document will not go into a detaileddiscussion of the effect of atrazine on the plasma prolactin surge simplybecause the role of this event in female rat inducing ovulation are not aswell described as a the LH surge.
9.2.7.1 Protocol for LH Surge Measurement -- One-MonthStudy (Morseth, 1996a)
Female SD rats were exposed to 0, 2.5, 5, 40 and 200mg/kg/day technical grade atrazine for 28 to 31 days. Ninetyfemales per dose group were used. Dosing was by gavage once aday, at approximately the same time each day. After 28 to 31 daysof atrazine exposure the animals were OVX. Vaginal smears wereperformed from days seven to the day prior to OVX to determinethe animals cycling patterns. Estradiol implants were placed ineach animal seven days following OVX and the animals weresacrificed three days later. Thus, OVX occurred 10 days prior tosacrifice and estradiol implants occurred three days prior tosacrifice. This protocol of OVX followed by estradiol implantation,followed by sacrifice has been previously used by otherinvestigators to induce an LH surge in SD female rats (Legan et al.,1975).
Ovarectomization of the animals followed by implantation of

DRAFT: DO NOT CITE OR QUOTE
121
estradiol implants was done in an attempt to synchronize theestrous cycles of the animals so that the LH surge in each animalwould occur at approximately the same time. This allows forcomparison of the surge between dose groups and also points theinvestigator to a specific time at which the LH surge should beoccurring. With this information the animals may be bled andserum LH levels measured. Animals were bled for serum hormonemeasurements at six different timepoints spread over 12 hours. The first two time points were 1100 and 1400 in biologic time(biologic time being time in the light cycle - biologic time 1200 ismid-point of the light cycle or noon of the light cycle). These firsttwo timepoints are baseline. The other timepoints for serummeasurement are biologic time 1600, 1800, 2000, and 2300. Thepeak of the LH surge would be expected to occur in the lateafternoon of the light cycle (around 1800 biologic time). Thisequates to the late afternoon of proestrus in a normally cycling rat. By 2300 biologic time the LH surge would be expected to be overand LH values should return to baseline levels.
Out of the 90 animals in each group 10 were "repeat bleed."These animals were bled at each timepoint from the jugular vein forthe first four bleedings, through the ocular venous plexus for thefifth bleed and the trunk for the last timepoint. The remaining 80animals in each dose group were sacrificed, and trunk blood wascollected according to the schedule shown in Appendix Table 18.

DRAFT: DO NOT CITE OR QUOTE
122
9.2.7.2 Results of LH Surge Measurements -- One-MonthStudy
The means and standard deviations for serum LHmeasurements from this study are shown in Appendix Table 19.
Non-repeat Bleed. Plasma LH values of the 200mg/kg/group were significantly decreased at 1600 and 1800compared to controls at that timepoint (specific p value notgiven). There were also non-significant decreases inplasma LH levels, compared to controls, in the 5 and 40mg/kg group (45.4% and 36.8%, respectively). There wasnot a great increase in the 200 mg/kg group in themagnitude of the peak response over its own baselinevalue. Control mean baseline (1100 and 1400 hours)values are 998 and 1122 pg/mL compared to a peak valueof 5138 pg/mL at 1800: approximately a five -fold increase. The baseline values for the 200 mg/kg group are similar tocontrols - 873 and 1099 pg/mL. However, the peak value inthe 200 mg/kg group is only 2752 pg/mL: an increase ofonly 2.5-fold.
Repeat Bleed. Peak values compared to controls inthe 200 mg/kg group were, as in the non-repeat bleed set,significantly decreased. The peak control value (1800hours) was 2650 pg/mL while the peak 200 mg/kg value was812 pg/mL (1800 hours). The 40 mg/kg group wasdecreased compared to controls (1450 pg/mL) but notsignificantly so. There was little increase in the 200 mg/kggroup in the magnitude of the response over its ownbaseline value. Control baseline values were 732 and 786pg/mL compared to peak values of 2650 pg/mL:approximately a 3.5-fold increase. Peak values in the 200mg/kg group were increased only about 45% over baselinevalues (812 vs. 514 and 453 pg/mL).

DRAFT: DO NOT CITE OR QUOTE
4Data from the study referred to here as Morseth 1996b has been published inthe open literature as Eldridge et al., 1999.
123
9.2.7.3 Summary of the Plasma LH Measurements fromthe One-Month Study
The plasma LH values seen in the control animals in boththe repeat and non-repeat bleed data indicate that one month ofatrazine exposure dramatically attenuates the preovulatory LHsurge in the high-dose group of 200 mg/kg/day. This effect is onlystatistically-significant in the high-dose group of 200 mg/kg, but itcan be seen in the 40 mg/kg/day group also.
The results seen in this study are confirmed by a separate28-day using similar protocols and identical doses (Minnema,2000). The LH surge, in this study, was statistically significantlyattenuated at both the 40 and 200 mg/kg/day doses.
9.2.7.4 Protocol for LH Surge Measurement -- Six-MonthStudy (Morseth, 1996b4)
The protocol for this study was very similar to the protocolfor the one-month study. The main differences were:
< duration of atrazine exposure (26 weeks);
< route of exposure (through the diet);
< and, dose levels (25, 50 and 400 ppm - 1.8, 3.65, and29.44 mg/kg/day).
Other than these differences, the six-month study wasconducted much the same as the one-month study. Animals wereOVX 10 days prior to sacrifice and implanted with estradiolimplants three days prior to sacrifice. Ninety females per groupwere used in a sacrifice schedule identical to that used in theone-month study (shown in Appendix Table 18). Blood collectionand plasma hormone measurements were performed identical tothe methods used in the one-month study.

DRAFT: DO NOT CITE OR QUOTE
124
DRAFT: DO NOT CITE OR QUOTE
125
9.2.7.5 Results of LH Surge Measurements -- Six-MonthStudy
The means and standard deviations for serum LHmeasurements from this study are shown in Appendix Table 20.
Non-repeat Bleed. Plasma LH values of the 400 ppmgroup were significantly decreased at 1400, 1800, and 2000hours compared to controls at those timepoints (specific pvalue not given). There was not a large increase in the 200mg/kg group in the magnitude of the response over its ownbaseline value (specific p value not given). Control meanbaseline (1100 and 1400 hours) values are 1900 and 2326pg/mL compared to a peak value of 3458 pg/mL at 1800: approximately a 1.6 -fold increase. The baseline values forthe 200 mg/kg group are slightly less than controls - 1863and 1420 pg/mL. However, the values at 1600 and 1800 inthe 200 mg/kg group are only 1913 and 1356 pg/mL. Theaverage of the 1100 and 1440 hour and 1600 and 1800 hourin the 200 mg/kg groups are essentially the same - 1641and 1634 pg/mL.
Appendix Table 20 displays the baseline values, peak LHvalues and % increase of peak values over baseline. Examinationof this table shows that at the high-dose group of 29.4 mg/kg/daythere is clearly a decrease in the strength of the LH surge. At thisdose level the surge does not seem to be occurring at all.

DRAFT: DO NOT CITE OR QUOTE
126
Repeat Bleed. Baseline values for plasma LH aresimilar among controls and all dose groups. There is astatistically-significant decrease at 1600, 1800, 2000, and2300 in the 29.4 mg/kg/group compared to controls. The 50ppm (3.65 mg/kg/day) group had a decrease at 1800 (25%)compared to controls. Compared to its own baseline values,the LH values in the 29.4 mg/kg group were not altered. Values at 1600 and 1800 are actually slightly lower thanbaseline values. Appendix Table 20 displays the baselinevalues, peak LH values and % increase of peak values overbaseline. Appendix Figure 1 displays a line graph of theresults from the repeat bleed group of this study.
9.2.7.6 Summary of the Plasma LH Measurements fromthe Six-Month Study
An attenuation of the LH surge at the high dose of 400 ppm(29.4 mg/kg/day) is clear. Examination of the data from AppendixTable 20 shows that plasma LH values for both the repeat andnon-repeat bleeds at this dose remain essentially flat over the sixtimepoints.
The other dose groups do not appear to be as affected byatrazine exposure. The non-repeat bleed data for the dose groupsis very similar to controls. There is a decrease in the strength ofthe LH surge at the mid-dose of 50 ppm (3.65 mg/kg/day), but themagnitude of this decrease is not large and given the variabilityinherent in this assay (as indicated by the large standarddeviations), it is difficult to draw firm conclusions based on thisdecrease.

DRAFT: DO NOT CITE OR QUOTE
127
9.2.8 Summary And Discussion Of The LH Surge Studies
In the non-repeat bleed set of the one-month study the baselinevalues for the 200 mg/kg/day group are similar to controls. However, thepeak value in the 200 mg/kg/day group is increased only 2.5 fold -- muchless than the five-fold increase seen in control peak values versus controlbaseline values. The results from the repeat bleed set for the one-monthstudy are even more indicative of an attenuated LH surge. Baselinevalues for both control and 200 mg/kg/day groups are, again, similar. Thepeak LH values are much less in the 200 mg/kg group compared to thecontrol though. Peak control LH values in the repeat bleed set wereincreased approximately 3.5-fold over baseline. Peak values in the 200mg/kg group were increased only about 45% over baseline values.
The results seen the six-month study in the 29.4 mg/kg/day groupalso indicate an attenuated LH surge. Both the repeat and non-repeatdata sets show plasma LH levels that are flat over time. Control LHvalues at their peak are about 67% above baseline values for the nonrepeat bleed data set and about 226% above baseline values in therepeat bleed set. Peak values in the 29.4 mg/kg group are 17%(non-repeat bleed) and 20% (repeat bleed) lower than baseline valuesthough.

DRAFT: DO NOT CITE OR QUOTE
128
A major factor to consider when drawing conclusions from thisstudy is, as indicated above, the large standard deviations in the data. Examination of the data shown in Tables 20 and 21 shows that thestandard deviations are quite large and, in fact, sometimes exceed themeans. An extreme amount of variability is to be expected with this typeof data. Variability can be expected between rats in both timing andmagnitude of the LH surge. Although the animals were synchronized byphotoperiod and by OVX, there will still be variability in timing of the surgeamong rats in a dose group. It is hoped that all the rats will have theirplasma LH levels be at their peak at 1800 hours when they are sacrificedand blood is collected. Clearly, however, this will not be the case. Somerats will experience a peak LH surge prior to 1800 hours and some after. The magnitude of the LH surge peak will also vary among rats. This isdue largely to the differential rate at which the animals reproductivesystems age. The variability of reproductive aging among female rats in aparticular strain has been well described (Cooper et al., 1986; Lu et al.,1994; LeFevere and McClintock, 1988). Because the LH surge isattenuated as part of the female SD rats reproductive aging process, thevariability in rate of reproductive aging means that animals of the samechronological age will have LH surges of varying magnitude.
Even given the variability inherent in the LH measurements in thistype of study, there are some conclusions that can be reached withconfidence. There is little doubt that in the one-month study at 200mg/kg/day and in the six-month study at 29.4 mg/kg/day, there is anattenuation of the LH surge. Appendix Figure 1 displays a line graph ofthe mean plasma LH levels in the repeat bleed group from the six-monthstudy displayed without standard deviation or standard error bars. Thedecreased LH surge at 3.65 mg/kg/day in the six-month study is lessapparent but may be considered biologically-significant.

DRAFT: DO NOT CITE OR QUOTE
129
9.3 The Site of Action for Atrazine Attenuation of the LH Surge
Experiments have been conducted examining the mechanisms underlyingthe attenuation of the LH surge produced by atrazine. The focus of theseexperiments has been the target site of action in the brain for atrazine. The LHfor the proestrus afternoon LH surge comes from the anterior pituitary and therelease of LH from the pituitary is controlled by gonadotropin releasing hormone(GnRH), which is produced in the hypothalamus. Thus, atrazine could bealtering the LH surge by acting at either the hypothalamus (and affecting GnRH -the signal to release LH) or by acting at the pituitary and directly affecting itsability to secrete LH.
Experiments examining the effects of atrazine exposure on thehypothalamus and pituitary were conducted at the Reproductive ToxicologyDivision of National Health and Environmental Effects Research Laboratories(Cooper et al., 1998, Cooper et al., 2000, Das et al., 1999, Das et al.,submitted). These studies, through the results of both in vivo and in vitroexperiments, demonstrate that atrazine appears to be attenuating the LH surgeby acting on the hypothalamus, rather than directly affecting the pituitary.
An in vivo experiment using the Long-Evans (LE) strain of rat,administered GnRH through a cardiac catheter to OVX atrazine-treated femalesto see if GnRH exposure could reverse the atrazine-induced attenuation of theLH surge. Females, in this study, given atrazine only showed an attenuation ofthe LH surge -- which was expected. Females given atrazine plus 50 ng/rat ofGnRH, did not display an attenuated LH surge. This provides evidence thatatrazine is affecting the ability of the hypothalamus to release GnRH.
An in vitro experiment using perfused anterior pituitaries removed fromuntreated female LE, showed that atrazine could not directly affect the ability ofthe anterior pituitary to secrete LH. Pituitaries perfused in vitro were able toproduce an LH surge when primed with estradiol. Adding 100 µM atrazine to theperfusion system did not affect the ability of the pituitaries to produce an LHsurge following estradiol priming.

DRAFT: DO NOT CITE OR QUOTE
130
These two experiments taken together provide evidence that atrazineinhibits the proestrus afternoon LH surge through an action on the hypothalamusrather than a direct action on the anterior pituitary. Specifically, it appears thatatrazine may somehow inhibit the hypothalamic secretion of GnRH.
Data from the Cooper lab indicates that a decrease in hypothalamicnorepinephrine levels may be responsible for the reduced capacity of thehypothalamus to secrete GnRH (Cooper et al., 1999a). In these studies,exposure of LE rats to a three-day exposure of 50, 100, 200 and 300 mg/mL/dayof atrazine resulted in significant depressions of hypothalamic norepinephrinelevels at all dose levels. This study is supported by in vitro studies usingtriazines and PC12 cells that showed that exposure through the medium of 50,100 and 200 µM atrazine resulted in dramatic decreases in norepinephrinerelease at all dose levels starting as early as six hours following the start ofexposure and continuing for up to 48 hours following exposure (Das, et al. ,1999).
Disruption of GABAergic neurotransmission by atrazine may also play arole in the decrease in GnRH release seen following atrazine exposure. Gamma-aminobutyric acid type a receptors (GABAA) are known to play a crucialrole in GnRH release. In vitro, atrazine (and cyanazine) have been shown todisrupt agonist binding to the GABAA receptor in cortex from male Long-Evansrats (Schafer, et al., 1999). Such disruption could contribute to the decreasedhypothalmic GnRH release seen following atrazine exposure.

DRAFT: DO NOT CITE OR QUOTE
131
9.4 The Data Examining the Association Between Atrazine Exposure andAn Attenuated Proestrus Afternoon LH Surge, Increased Days andEstrus and a Prolonged Exposure to an Elevated Level of Estradiol
This document presents several studies examining an associationbetween atrazine exposure and an early onset of alterations in the abovedescribed parameters - estrous cycle, serum estradiol levels; serum LH levels. A study is also available examining the correlation between estrous cycles andmammary tumor incidence/onset. The time of tumor onset is also examined inseveral studies in an attempt to confirm that normally occurring events(mammary tumor induction) are, in fact, occurring earlier following atrazineexposure.
The results indicate that atrazine exposure does appear to result in anearly onset of these parameters. Increased days in estrus, increased serumestradiol levels, attenuated LH surge, and onset of mammary tumors all occurearlier in atrazine-treated females than they do in untreated females.

DRAFT: DO NOT CITE OR QUOTE
132
9.4.1 Atrazine Exposure Results in an Earlier Onset of IncreasedDays in Estrus
One-month of atrazine exposure at 40 mg/kg/day induced estrusblocks. Longer term studies revealed that atrazine exposure at lowerlevels also has the ability to increase days in estrus if the exposure is oflong enough duration. A dose of 3.65 mg/kg/day in a six-month study wasable to induce an increase in days spent in estrus over controls as earlyas 5.5 months into the study. A dose of 4.23 mg/kg/day in a two-yearstudy (the low-dose tested in this particular study) induced an increasedpercentage of days spent in estrus at nine months -- an event that is notseen in control SD females in this study until about 12 months into thestudy. A separate two-year study showed that as little as 1.5 mg/kg/daycould induce an increase in percent days spent in estrus. This increasewas marginal and was not statistically-significant though. Furthermore,the increase in days in estrus seen at this dose was apparently not of themagnitude to increase a female rats risk of mammary cancer as there wasnot an increase in mammary tumor incidence or decrease in mammarytumor onset at this dose in this study. The next highest dose in the samestudy (3.1 mg/kg/day) also resulted in an increase in days in estrus. Theincrease in days estrus seen in this study was slightly greater than theincrease seen at 1.5 mg/kg/day, but was still not statistically-significant. Itwas apparently enough to cause an increase an animals risk formammary cancer as mammary cancer incidences at this dose wereincreased about two-fold over concurrent control values.
9.4.2 Atrazine Exposure Results in an Earlier Onset of IncreasedSerum Estradiol Levels
Atrazine exposure of only three months resulted in an increase inserum estradiol levels in SD females. Levels equivalent to those seen atthree months were not seen in control animals in this study until ninemonths. Because there was no intermediate timepoint between three andnine months in this study it is difficult to determine just when the controlanimals achieved serum estradiol levels equivalent to those seen in thedosed animals at three months. Clearly, though, the dosed animals hadhigher serum estradiol at three months than the controls did -- indicatingthat this parameter of reproductive aging was achieved earlier in thedosed rat than in the control rat.

DRAFT: DO NOT CITE OR QUOTE
133
9.4.3 Atrazine Exposure Results in an Earlier Onset of AttenuatedLH Surges
Atrazine exposure at high levels (40 and 200 mg/kg/day) was ableto attenuate the preovulatory LH surge after only one month of exposure. Exposure to atrazine at lower levels (29.4 mg/kg/day) significantlyweakened the LH surge after six months exposure. The lowest dose ofatrazine that was able to induce a weakening of the LH surge was 3.65mg/kg/day, but this weakening was not statistically-significant. It is notclear exactly when a normally aging animal would be expected toexperience an weakened LH surge, but the studies described hereshowed that the control animals did not experience a weakened LH surgewhen the concurrently run dosed animals did.
9.4.4 Atrazine Exposure Results in an Earlier Tumor Onset
Tumor onset times were consistently decreased following atrazineexposure. The decrease in tumor onset times implies that the process oftumor formation is occurring at an earlier chronological age due toatrazine exposure. Tumor incidence rate were not always increasedfollowing atrazine exposure- they were not increased in Thakur, 1992aand only the trend for fibroadenomas was increased in Thakur, 1991a. Tumor onset times were decreased in every study in which they wereexamined - Thakur, 1991a and 1992a; and Morseth, 1998.

DRAFT: DO NOT CITE OR QUOTE
134
9.5 Pituitary Adenomas
9.5.1 Onset of Pituitary Alterations Following Atrazine Exposure
Table 5-5 provides evidence that the latency period of pituitaryadenomas is decreased following atrazine exposure. Pituitary adenomasare known to be age-related in the rodent. The time to onset of otherage-related pituitary alterations may also be decreased in atrazineexposed SD females. As described above under section 9.1, pituitaryweights and incidences of pituitary hyperplasia are also increased in theuntreated female SD rat with age. There is evidence that an early onsetof increased pituitary weights and an early onset of pituitary hyperplasiamay also be occurring in response to atrazine exposure. AppendixTables 21 and 22 display absolute and relative (to body weight) pituitaryweights from Thakur, 1991a. Appendix Table 23 displays absolute andrelative (to body) pituitary weight from SD females exposed to atrazine forsix months in Morseth, 1996b.
Three months of exposure did not result in an increase in eitherabsolute or relative- to-body pituitary weights in the dose groupscompared to controls. By nine months of exposure there was a cleardose-related increase in both absolute and relative pituitary weights. Theeffect was still evident at 12 months, but only at the high dose and theeffect was less severe at the high dose at 12 months compared to ninemonths. Pituitary weights at 15, 18 and 24 months are comparable indose groups compared to controls. The incidence of pituitary focalhyperplasia (as recorded in the histopathology records of this study) wasmarginally increased in dose groups compared to the control at ninemonths. There was only one incidence of this histology finding in thecontrol group (it was assigned the grade "slight" by the examiningpathologist) while there were two incidences at 4.23 mg/kg/day (both"slight") and two incidences at 26.23 mg/kg/day (one "minimal" and one"slight"). The early onset of increased pituitary weights following atrazineexposure seen in Thakur, 1991a is confirmed in Morseth, 1996b. Bothabsolute and relative pituitary weights increases are >20% at 29.4mg/kg/day after six months of exposure.

DRAFT: DO NOT CITE OR QUOTE
135
9.5.2 Role of Early Onset of Pituitary Alterations in MammaryCarcinogenesis
The pituitary alterations - adenomas, hyperplasia and increasedpituitary weight - all result in increased serum prolactin levels (Baird et al.,1990; McComb et al., 1986; van Putten et al., 1988). The associationbetween increased prolactin exposure and mammary tumors has beenwell-described (Meites, 1972; Meites, 1981; Russo et al., 1990). Likewise, an association between pituitary alterations of the typesmentioned above and mammary tumors had been well-described(Blankenstein et al., 1984; McConnell, 1989a; Goya et al., 1990). Thestudies described in this document also provide evidence of anassociation between these pituitary alterations and mammary tumors. Appendix Table 24 shows that majority of SD females with mammarytumors also had pituitary adenomas. Females without mammary tumorsalso had high incidences of pituitary adenomas, but the incidences weregenerally lower than for animals with mammary tumors. Appendix Tables25a and b show that pituitary weights in females with mammary tumorswere higher than pituitary weights in females without mammary tumors. The mean absolute pituitary weight in animals with mammary tumors inMorseth, 1998 was 46% greater than the mean pituitary weight in animalsthat did not have mammary tumors. The difference was even moreapparent in the Thakur, 1992a study where the mean absolute pituitaryweight in females with mammary tumors was 94% greater than in thosewithout mammary tumors.

DRAFT: DO NOT CITE OR QUOTE
136
9.5.3 Pathogenesis of Pituitary Alterations
As has been previously discussed, estrogen is mitogenic to thepituitary lactotrophs of the rodent. It is therefore biologically plausible thatthe same increase in anovulation and accompanying prolonged exposureto serum estrogens that is believed to contribute to mammarycarcinogenesis following atrazine exposure would also contribute topituitary hyperplasia and neoplasia.
If an increase in serum estrogens leads to the afore-mentionedpituitary alterations then it would be reasonable to expect that increasesin serum estrogen would precede the pituitary alterations. Indeed,increases in serum estradiol are seen as early as three months followingthe initiation of atrazine exposure (Appendix Table 15). Dose-relatedincreases in acinar development (a histomorphologic alteration highlydependent on estrogen) are found following three months of exposurewhile dose-related increases of galactoceles, secretory activity and otherhistomorphologic alterations indicating prolactin exposure are not seenuntil nine months of exposure (Appendix Tables 16 and 17).
If estrogens derived from unovulated follicles contribute to pituitaryalterations then OVX animals would be expected to have lower incidencesof these pituitary alterations. The OVX animals in Morseth, 1998 did havelower incidences of pituitary adenomas, but not as much less as might beexpected. As previously noted, ovariectomy was able to reducemammary tumor incidences from about 50% having some sort ofmammary tumor to zero percent having any sort of mammary tumor. Theeffect of ovariectomy on the pituitary adenoma rate was much lesspronounced. Ovariectomy dropped the pituitary adenoma rate from about70% at terminal sacrifice for the intact animals to about 50% at terminalsacrifice in the OVX animals. Interestingly, though ovariectomy had onlymild impact on pituitary tumor incidences, ovariectomy was able todramatically reduce pituitary weights at the end of the study. Absolutepituitary weights at terminal sacrifice in the OVX animals were only abouta quarter the value of the intact animals. Relative pituitary weights wereonly 35% the weight in OVX compared to intact animals. Appendix Table26 displays these data. The dramatic decrease in pituitary weight inconjunction with only a mild decrease in pituitary adenoma incidence maybe explained by an earlier onset of the pituitary tumors in the intactanimals compared to the OVX. The data in Appendix Table 26 provides

DRAFT: DO NOT CITE OR QUOTE
137
evidence of an early onset of pituitary adenomas in intact animals versusOVX when it shows a 6% incidence of pituitary adenomas in the interimsacrifice OVX animals compared to a 17% incidence in interim sacrificeintact animals. The data in Appendix Table 26 also shows that OVXanimals had a much reduced incidence of "enlarged" pituitaries comparedto intact animals. The decreased incidence of enlarged pituitaries andthe reduced weight of the pituitaries may indicate that, though many OVXanimals still got pituitary tumors, these tumors occurred later in life andthus, by the time the animals were sacrificed, had not had as much time togrow and were thus of a smaller size.
A serial sacrifice study comparing OVX and intact animals wouldbe useful in determining if pituitary tumor onset is delayed in OVX animalsversus intact animals. While HED is not interested in pituitary tumoronset in OVX animals per se; the fact that pituitary tumors are not moredramatically decreased in OVX animals raises some doubts about a modeof action for atrazine-mediated pituitary tumors that depends onprolonged exposure to follicular-derived estrogen. Were the same modeof action to apply to pituitary tumors that applies to mammary tumors thenone would expect pituitary tumors to behave like mammary tumors whenthe ovaries are removed. That is, one would expect pituitary tumor ratesto drop to zero, or close to zero, following OVX.
9.5.4 Summary and Conclusion for Pituitary Alterations
There is ample evidence in the open literature that exposure tofollicular-derived estrogen in CE rats leads to an increased incidence ofprolactin-secreting pituitary adenomas and increased pituitary weight orfocal hyperplasia. Being that atrazine exposure seems to result in anearly onset of constant estrus and increased estradiol exposure, onewould expect that these pituitary alterations would also show an earlyonset following atrazine exposure. Pituitary weight data from Thakur,1991a and Morseth, 1996 both show an early onset of increased pituitaryweight following atrazine exposure. Pituitary adenoma data from Thakur,1991a shows that there is an early onset of pituitary adenomas followingatrazine exposure.

DRAFT: DO NOT CITE OR QUOTE
138
Further research is desirable into why ovariectomy does notreduce pituitary tumor incidence to the same extent as it does mammarytumors incidence despite there apparently having the mode of action.