hays fy19 prelims presentation - upload/media/files/h/hays/results-centre/hays fy19... · this...
TRANSCRIPT

PRELIMINARY RESULTS
For the year ended 30 June 2019

CAUTIONARY STATEMENT
This presentation contains certain statements that are neither reported financial results nor other historical information. The information containedin this presentation is not audited, is for personal use and informational purposes only and is not intended for distribution to, or use by, any personor entity in any jurisdiction in any country where such distribution or use would be contrary to law or regulation, or which would subject any memberof the Hays Group to any registration requirement. No representation or warranty, express or implied, is or will be made in relation to the accuracy,fairness or completeness of the information or opinions made in this presentation.
Statements in this presentation reflect the knowledge and information available at the time of its preparation. Certain statements included orincorporated by reference within this presentation may constitute “forward-looking statements” in respect of the Group’s operations, performance,prospects and/or financial condition. By their nature, forward-looking statements involve a number of risks, uncertainties and assumptions andactual results or events may differ materially from those expressed or implied by those statements. Accordingly, no assurance can be given thatany particular expectation will be met and reliance should not be placed on any forward-looking statement. Additionally, forward-lookingstatements regarding past trends or activities should not be taken as a representation that such trends or activities will continue in the future. Noresponsibility or obligation is accepted to update or revise any forward-looking statement resulting from new information, future events or otherwise.Nothing in this presentation should be construed as a profit forecast.
This presentation does not constitute or form part of any offer or invitation to sell, or any solicitation of any offer to purchase any shares in theCompany, nor shall it or any part of it or the fact of its distribution form the basis of, or be relied on in connection with, any contract or commitmentor investment decision relating thereto, nor does it constitute a recommendation regarding the shares of the Company or any invitation orinducement to engage in investment activity under section 21 of the Financial Services and Markets Act 2000. Past performance cannot be reliedupon as a guide to future performance. Liability arising from anything in this presentation shall be governed by English Law, and neither theCompany nor any of its affiliates, advisors or representatives shall have any liability whatsoever (in negligence or otherwise) for any losshowsoever arising from any use of this presentation or its contents or otherwise arising in connection with this presentation. Nothing in thispresentation shall exclude any liability under applicable laws that cannot be excluded in accordance with such laws.
2
AGENDA
OPERATING REVIEW ALISTAIR COX, CHIEF EXECUTIVE
FINANCIAL REVIEW PAUL VENABLES, FINANCE DIRECTOR
CURRENT TRADING PAUL VENABLES, FINANCE DIRECTOR
STRATEGY UPDATE ALISTAIR COX, CHIEF EXECUTIVE
APPENDICES
1
2
3
4
3

4
OPERATING REVIEWALISTAIR COXCHIEF EXECUTIVE

SOLID OPERATIONAL AND FINANCIAL PROGRESS DESPITE WEAKENING MACRO CONDITIONS
Continue to position the Group for long-term growth opportunities, while maximising our profits and cash along the way
Maximising financial performance
� Record Group and International net fees, including 19 country records� Operating profit up 4% at £248.8m ‡, despite more difficult market conditions� Solid profit performance in the UK, up 4%� Restructured several businesses, particularly in Eu rope
Further expansion and diversification
� 77% of net fees and 80% of operating profit generat ed outside of UK� Temp & Contracting 57% of Group net fees� International consultant headcount up 5% year-on-ye ar, including Germany +6%, USA
+8%, Japan +10% and China +10%� Eight new offices, plus significant Asian, European and Americas office expansions
Our focus remains on… We have delivered…
‡ Unless otherwise stated, FY19 operating profit, EPS and dividend cover are presented before exceptional costs of £15.1 million. There were no exceptional items in the prior year.* Represents the conversion of net fees into operating profit‡. Unless otherwise stated all growth rates are LFL (like-for-like) year-on-year net fees and profits, representing organic growth at constant currency.
Sector-leading financial efficiency
� Conversion rate* down 70bps y-o-y to 22.0%, as grow th slowed through the year� Strong cash performance, with record c.£130m cash� Core dividend up 4% and proposed c.£80m special div idend. Total FY19 dividend of
c.£138m (FY18: c.£128m)
CORE DIVI
EPS
OP PROFIT
NET FEES
+4% to 3.97p
+4% to 11.92p
+4% to £248.8m
+6% to £1,129.7m
‡
‡
5

SOLID PERFORMANCE DESPITE WEAKER CONDITIONS IN H2, PARTICULARLY IN CONSTRUCTION & PROPERTY
4% net fee growth, operating profit ‡ flat
� Good growth of 7% in Temp (68% of ANZ fees), with a record level of 22,000 Temps. Perm down 4%
� Australia net fees up 5%, with growth across most states and many specialisms
� Australia Private sector up 4%; Public sector up 7%
� NSW and Victoria (57% of Australia net fees) grew 7% and 5% respectively. Good growth in Queensland, up 7%, although Western Australia weaker, down 4%
� Australian specialism growth led by IT up 21% and Resources & Mining up 15%. C&P down 7%, A&F down 5%
� Consultant headcount in Australia up 1%, and opened two new offices
� New Zealand (5% of ANZ net fees) tough, down 17%
ANZ net fees (£m)FY17
FY18
FY19
180.7
199.4
198.5
6
‡ FY19 operating profit excludes exceptional items. There were no exceptional items in the prior year.Unless otherwise stated, all growth rates are LFL (like-for-like), representing organic growth at constant currency. Conversion rate represents percentage movement versus prior year. Consultant numbers represent closing numbers, and percentage changes are 30 June 2019 closing number versus 30 June 2018 closing number.

GOOD PERFORMANCE DESPITE SIGNIFICANT REDUCTION IN BUSINESS CONFIDENCE
£134m£133m
9% net fee growth, operating profit ‡ up 7%
� Good growth of 8% in Flex (Temp up 19%, Contracting up 3%). Strong Perm growth of 16%
� Fee growth slowed to 4% in H2 from 14% in H1
� Good growth in our largest specialisms, with IT up 9% and Engineering up 6%
� Strong growth in newer specialisms (c.31% of fees) with A&F up 16%, Sales & Marketing up 17% and Legal up 44%
� Continued investment in offices and systems
i. Two new offices and completed three office expansions (Cologne, Mannheim, Dresden)
ii. Enhancements to operational and back office systems
� Headcount up 6% in FY19, but down 1% in H2 19
Germany net fees (£m)FY17
FY18
FY19
230.3
276.0
299.8
7
‡ FY19 operating profit excludes exceptional items. There were no exceptional items in the prior year.Unless otherwise stated, all growth rates are LFL (like-for-like), representing organic growth at constant currency. Conversion rate represents percentage movement versus prior year. Consultant numbers represent closing numbers, and percentage changes are 30 June 2019 closing number versus 30 June 2018 closing number.

SOLID PERFORMANCE, WITH PROFIT UP 4%, DRIVEN BY GOOD COST CONTROL, DESPITE UNCERTAINTIES
2% net fee growth, operating profit ‡ up 4%
� Temp net fees up 4%, Perm flat. Profit growth supported by good cost control
� Good performance in Public sector, up 11%
� Tougher conditions in the Private sector (73% of UK&I), with net fees down 1% as client confidence was impacted by increased economic uncertainty
� Net fee performance varied by region, with South West & Wales up 14% and London up 2%. Scotland and the South East down 9% and 8% respectively
� Solid performance in Ireland, with net fees up 4%
� IT up 11%, Office Support up 4%, A&F up 3% and C&P up 1%. Education remains tough, down 10%
� Average headcount down 1% as we focused on consultant productivity
UK&I net fees (£m)FY17
FY18
FY19
252.9
258.2
263.8
8
‡ FY19 operating profit excludes exceptional items. There were no exceptional items in the prior year.Unless otherwise stated, all growth rates are LFL (like-for-like), representing organic growth at constant currency. Conversion rate represents percentage movement versus prior year. Consultant numbers represent closing numbers, and percentage changes are 30 June 2019 closing number versus 30 June 2018 closing number.
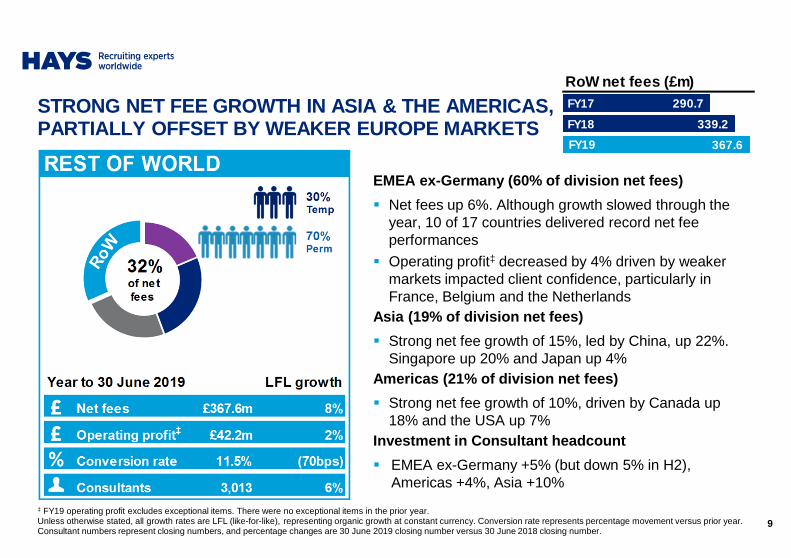
STRONG NET FEE GROWTH IN ASIA & THE AMERICAS, PARTIALLY OFFSET BY WEAKER EUROPE MARKETS
EMEA ex-Germany (60% of division net fees)
� Net fees up 6%. Although growth slowed through the year, 10 of 17 countries delivered record net fee performances
� Operating profit‡ decreased by 4% driven by weaker markets impacted client confidence, particularly in France, Belgium and the Netherlands
Asia (19% of division net fees)
� Strong net fee growth of 15%, led by China, up 22%. Singapore up 20% and Japan up 4%
Americas (21% of division net fees)
� Strong net fee growth of 10%, driven by Canada up 18% and the USA up 7%
Investment in Consultant headcount
� EMEA ex-Germany +5% (but down 5% in H2), Americas +4%, Asia +10%
RoW net fees (£m)FY17
FY18
FY19
290.7
339.2
367.6
9
‡ FY19 operating profit excludes exceptional items. There were no exceptional items in the prior year.Unless otherwise stated, all growth rates are LFL (like-for-like), representing organic growth at constant currency. Conversion rate represents percentage movement versus prior year. Consultant numbers represent closing numbers, and percentage changes are 30 June 2019 closing number versus 30 June 2018 closing number.
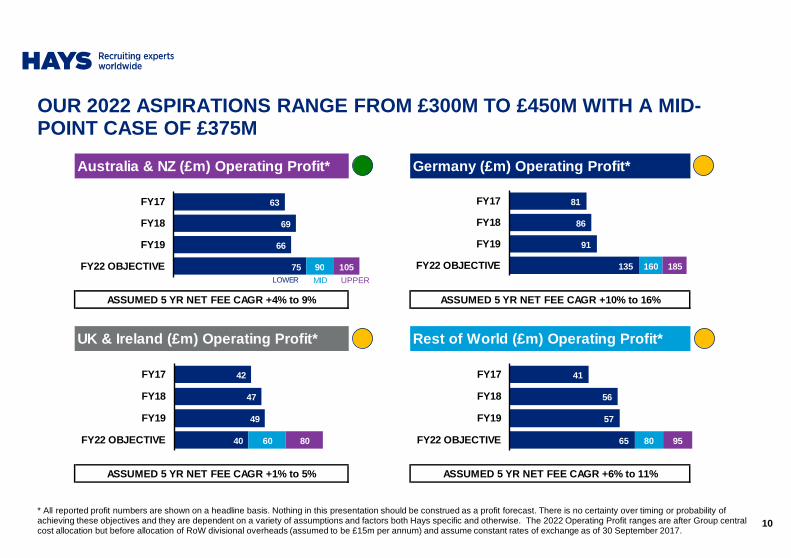
* All reported profit numbers are shown on a headline basis. Nothing in this presentation should be construed as a profit forecast. There is no certainty over timing or probability of achieving these objectives and they are dependent on a variety of assumptions and factors both Hays specific and otherwise. The 2022 Operating Profit ranges are after Group central cost allocation but before allocation of RoW divisional overheads (assumed to be £15m per annum) and assume constant rates of exchange as of 30 September 2017.
OUR 2022 ASPIRATIONS RANGE FROM £300M TO £450M WITH A MID-POINT CASE OF £375M
ASSUMED 5 YR NET FEE CAGR +1% to 5% ASSUMED 5 YR NET FEE CAGR +6% to 11%
Australia & NZ (£m) Operating Profit* Germany (£m) O perating Profit*
ASSUMED 5 YR NET FEE CAGR +4% to 9% ASSUMED 5 YR NET FEE CAGR +10% to 16%
UK & Ireland (£m) Operating Profit* Rest of World (£ m) Operating Profit*
81
86
91
135 160 185
FY17
FY18
FY19
FY22 OBJECTIVE
42
47
49
40 60 80
FY17
FY18
FY19
FY22 OBJECTIVE
41
56
57
65 80 95
FY17
FY18
FY19
FY22 OBJECTIVE
63
69
66
75 90 105
FY17
FY18
FY19
FY22 OBJECTIVELOWER MID UPPER
10

2. FINANCIAL REVIEWPAUL VENABLESFINANCE DIRECTOR

Record FY19 dividends of £137.9 million
SOLID FINANCIAL PERFORMANCE DESPITE FEE GROWTH SLOW ING DURING THE YEAR
12‡ Unless otherwise stated, FY19 operating profit, EPS and dividend cover are presented before exceptional costs of £15.1 million. There were no exceptional items in the prior years.* Unless otherwise stated, all growth rates are LFL (like-for-like) year-on-year net fees and profits, representing organic growth at constant currency.
Net fees Operating Profit Total DPS
6% increase* 4% increase* 7% increase*
Net fees Operating profit ‡ Total DPS£1,129.7m £248.8m 9.40p
FY15
FY16
FY17
FY18
FY19
£764.2m
£810.3m
£954.6m
£1,072.8m
£1,129.7m
£164.1m
£181.0m
£211.5m
£243.4m
£248.8m
FY15
FY16
FY17
FY18
FY19
Core Special
FY15
FY16
FY17
FY18
FY19
3.22p
3.81p
3.97p
4.25p
5.00p
5.43p
2.76p
2.90p
7.47p
8.81p
9.40p

* LFL (‘like-for-like’) growth is organic growth at constant currency.‡ FY19 results are presented before exceptional items. There were no exceptional items in the prior year.
Income Statement
Year ended 30 June 2019£m
2018£m
Actualgrowth
LFL* growth
Turnover 6,070.5 5,753.3 6% 7%
Net Fees 1,129.7 1,072.8 5% 6%
Operating Profit‡ 248.8 243.4 2% 4%
Net finance cost (2.5) (4.9)
Profit before tax‡ 246.3 238.5 3%
Tax‡ (72.7) (72.7)
Profit after tax‡ 173.6 165.8 5%
Exchange rate movements decreased net fees and oper ating profit ‡ by £8.8 millionand £3.4 million respectively
13
SOLID FINANCIAL PERFORMANCE DESPITE SLOWDOWN IN FEE GROWTH DURING THE YEAR

* LFL (‘like-for-like’) growth is year-on-year organic growth at constant currency adjusted for working days.
Action taken in second half to manage cost base as markets became more difficult
WORKING-DAY-ADJUSTED FEE GROWTH SLOWED THROUGH THE YEAR AS MARKET CONDITIONS WEAKENED IN MANY MARKETS
14
ANZ net fee growth* Germany net fee growth*
12%17%
15%
23%14%
10%9%
2%
Q1 Q2 Q3 Q4 Q1 Q2 Q3 Q4
FY18 FY19
RoW net fee growth*
Group net fee growth*� Macroeconomic conditions softened through the year, particularly in Europe, driving sequentially weaker growth in many markets
� Clear signs of reduced business confidence as the year progressed and slower decision-making from clients
� Selective investment to capitalise on growth opportunities in H1, with focus moving to driving consultant productivity and cost control in H2
10%13% 11%
14%9% 8%
5%1%
Q1 Q2 Q3 Q4 Q1 Q2 Q3 Q4
FY18 FY19
13% 14% 13% 13%7% 8%
2%(2%)
Q1 Q2 Q3 Q4 Q1 Q2 Q3 Q4
FY18 FY19
17%23%
18% 14% 13% 12%
5% 4%
Q1 Q2 Q3 Q4 Q1 Q2 Q3 Q4
FY18 FY19

Germany (27% of net fees)
Net Fees £299.8m +9%
Op Profit ‡ £91.3m +7%
� Good growth in net fees and profits, up 9% and 6% respectively on a working day adjusted* basis. Temp up 8%, Perm 16%
� Significant reduction in business confidence
� Continued investment in offices and systems
UK & Ireland (23% of net fees)
Net Fees £263.8m +2%
Op Profit ‡ £48.9m +4%
� Solid performance given increased economic uncertainty. Public sector up 11%, Private sector down 1%. Temp up 4%, Perm flat
� Profit up 4%, driven by good cost control
Rest of World (32% of net fees)
Net Fees £367.6m +8%
Op Profit ‡ £42.2m +2%
� Good net fee growth, conversion rate down 70bp y-o-y, primarily due to a sharp slowdown in growth in EMEA ex-Germany
� 18 of 28 countries delivered record net fee performances
Australia & NZ (18% of net fees)
Net Fees £198.5m +4%
Op Profit ‡ £66.4m +0%
� Australia net fees up 5%, with growth across most states and specialisms
� Market conditions weakened in H2 particularly in Construction & Property
� ANZ Temp up 7%, with a record c.22,000 temps; Perm down 4%. Headcount up 1% Net fees
FY 19£1,129.7m
Unless otherwise stated, all growth rates are LFL (like-for-like), representing organic growth at constant currency.‡ FY19 operating profit excludes exceptional items. There were no exceptional items in the prior year.*The estimated working day impact (c.0.4% positive impact on net fees and a c.1% positive impact on operating profit) is calculated on our Temp & Contractor businesses only. We make no estimate of the impact on our Perm business. It represents an assumption based on recent trends of revenues / working day in our major Temp and Contractor businesses.
GROWTH IN INTERNATIONAL NET FEES SLOWED THROUGH THE YEAR; SOLID PERFORMANCE IN THE UK
15

£649.3m(57% of net fees)
£480.4m(43% of net fees)
6% net fee growth
6% volume increase
3% increase in mix/hours
(50) bps underlying margin decrease**
PERM GROWTH SLIGHTLY OUTPERFORMED TEMP
Permanent placement business Temporary placement business
* Growth rates and margin change are for the Year ended 30 June 2019 versus the Year ended 30 June 2018, on a like-for-like basis which is organic growth at constant currency. ** The underlying Temp gross margin is calculated as Temp net fees divided by Temp gross revenue and relates solely to Temp placements in which Hays generates net fees and specifically excludes transactions in which Hays acts as agent on behalf of workers supplied by third-party agencies and arrangements where the Group provides major payrolling services.
Review of Group Permanent and Temporary Businesses*
� 6% volume increase, driven by Germany, Australia and RoW
� 3% increase in mix/hours, driven by Germany
� Underlying Temp margin** down 50bps, primarily driven by lower margins in ANZ and the UK
� Strong volume increases in Germany with good volumeincreases in RoW business
� Average Perm fee up 3%, driven by wage inflation and mix benefits
� Underlying wage inflation at c.2-3% globally
7% net fee growth
4% volume increase
3% average Perm fee increase
Split of net feesFY17
FY18
FY19
59%
58%
57%
Temp
Temp
Temp
16

THE AUSTRALIAN DOLLAR AND EURO REMAIN SIGNIFICANT F X TRANSLATION SENSITIVITIES FOR THE GROUP
Key FX rates and sensitivities
� FX rates at 27 August 2019: £1 / AUD1.8156; £1 / €1.1062
� Retranslating the Group’s FY19 full-year operating profit‡ at current exchange rates would increase the actual result by c.£5 million to c.£254 million
Year ended 30 June 2019 Average Closing
Australian $ 1.8105 1.8087
Euro € 1.1351 1.1169
Impact of a one cent change per annum Net fees Op profit
Australian $ +/- £1.1m +/- £0.4m
Euro € +/- £4.1m +/- £1.2m
17‡ Excludes exceptional items. There were no exceptional items in the prior year.

Conversion Rate* 2019 2018
Australia & New Zealand 33.5% 34.7%
Germany 30.5% 31.2%
United Kingdom & Ireland 18.5% 18.2%
Rest of World 11.5% 12.2%
Group 22.0% 22.7%
* Represents the conversion of net fees into pre-exceptional operating profit. There were no exceptional items in the prior year.
� Overall Group conversion rate decreased 70bps to 22.0%
� Overall Group property costs up c.£5m
� Reduction in ANZ due to tough New Zealand trading and slowdown in C&P in Australia
� Increase in UK&I due to 3% improvement in consultant productivity
� Decrease in Germany and RoW due to weakening market conditions leading to material slowdown in growth
CONVERSION RATE* IMPACTED BY SLOWER GROWTH IN SECON D HALF
18

Year ended 30 June 2019£m
2018£m
Finance charge
Net interest charge on debt (1.7) (1.6)
Interest unwind of discount on Acquisition Liability - (0.6)
IAS 19 pension charge (non-cash) (0.5) (2.1)
PPF levy (0.2) (0.3)
Other interest payable (0.1) (0.3)
Net finance charge (2.5) (4.9)
� We expect the net finance charge for the year ending 30 June 2020 to be c.£10 million inclusive of a £2.5 million increase in IAS 19 pension charge and c.£5 million of IFRS 16 interest charges
Taxation
Effective tax rate (ETR) 29.5%‡ 30.5%
� Decrease in ETR reflects increased profits in lower tax jurisdictions and certain other items
� ETR for FY20 will be driven by the mix of profits. We currently expect the rate to be 29.5% in FY20
DECREASE IN ‘ETR’ TO 29.5% ‡ DRIVEN BY MIX OF PROFITS
Finance charge and taxation
19‡ Excludes exceptional items. There were no exceptional items in the prior year.

4% INCREASE IN EARNINGS PER SHARE ‡
Basic earnings per share (EPS)
‡ Excludes exceptional items. There were no exceptional items in the prior year.* Number of shares used for basic EPS calculation purposes excludes shares held in Treasury.
Year ended 30 June 2019 2018 Change
Basic earnings‡ £173.6m £165.8m 5%
Weighted average number of shares* 1,456.2m 1,448.6m
Basic earnings per share‡ 11.92p 11.44p 4%
Shares in issue** at 30 June 2019 and 27 August 2019 1,459m
20
Basic EPS (p)FY17
FY18
FY19
9.66
11.44
11.92

EXCEPTIONAL COST OF £15.1 MILLION INCURRED IN FY19
Year ended 30 June 2019(£m) Net fees Operating profit
FY19 Pre-exceptional 1,129.7 248.8
GMP equalisation - (8.3)
Restructuring costs - (6.8)
FY19 Post-exceptional 1,129.7 233.7
21
� During the year, the Group incurred an exceptional charge of £15.1 million in relation to the following items:
‒ £8.3 million recognised in respect of the equalisation of GMP (Guaranteed Minimum Pensions), for men and women in UK defined benefit schemes, which represent 1.17% of the Scheme’s liabilities. This charge follows the landmark legal judgment against Lloyds Banking Group in October 2018 and is a non-cash item
‒ Non-recurring restructuring cost of £6.8 million which principally relates to our European businesses. This is expected to generate a c.£5 million per annum cost saving, of which £2 million was achieved in FY19 with a further c.£3 million benefit expected in FY20

FY20 P&L GUIDANCE, INCLUDING IFRS 16 IMPACT
£m
FY20 guidance
FY20 impact of IFRS 16*
Property expansions
Additional depreciation on
fixed assets*IAS 19 interest
on pension*
Cost-savings related to FY19
restructuringFY20 Total
Impact
Net fees - - - - - -
Other operating costs 45.0 - - - 3.0 48.0
Depreciation (43.0) (5.0) (5.0) - - (53.0)
Operating profit 2.0 (5.0) (5.0) - 3.0 (5.0)
Net finance cost (5.0) - - (2.5) - (7.5)
Profit before tax (3.0) (5.0) (5.0) (2.5) 3.0 (12.5)
22* Non-cash items

Uses of cash flow (£m)Operating profit ‡ to free cash flow conversion (£m)
STRONG UNDERLYING CASH PERFORMANCE
For FY20, capex guidance is c.£30m
Cash from operations £mFY17
FY18
FY19
217.0
243.5
263.0‡
23
Other £0.2m
Increase in net cash £6.8m
Core Divi £56.2m
Special Divi £72.9m
Pensions £15.7m
Capex £33.0m
‡ FY19 operating profit and FY19 cash from operations both exclude exceptional items. Cash from operations excludes £2.9 million of exceptional restructuring costs paid in FY19. There were no exceptional items in prior years.
248.8
184.8
27.4(13.2)
(75.5)(2.7)
Operatingprofit
Non-cash Workingcapital
Tax paid Interestpaid
Free cashflow
Cash from operations‡
£263.0m (FY18: £243.5m)
‡

24
STRONG YEAR END CASH POSITION, DESPITE PAYING £129 MILLION IN DIVIDENDS
Closing net cash (£m)
‡ FY19 free cash flow excludes exceptional items. There were no exceptional items in prior years.* Free cash flow is defined as cash flow before dividends, additional pension contributions, capital expenditure and acquisitions.** Covenant ratios are shown on a pro-forma basis for the year ended 30 June 2019.
NET CASH POSITION� FY19 ended with net cash of £129.7 million,
after paying £129.1 million cash dividends
£210 MILLION BANK FACILITY EXTENDED� Signed in November 2018, expires
November 2023
EBITDA / INTEREST RATIO: 189x**� Bank covenant: >4.0x
NET DEBT / EBITDA RATIO: N/A� Bank covenant: >2.5
36.8
47.9
111.6
34.5
122.9
32.5
129.7
Jun-16 Dec-16 Jun-17 Dec-17 Jun-18 Dec-18 Jun-19
Free cash flow £m*FY17
FY18
FY19
146.9
175.7
184.8‡
24
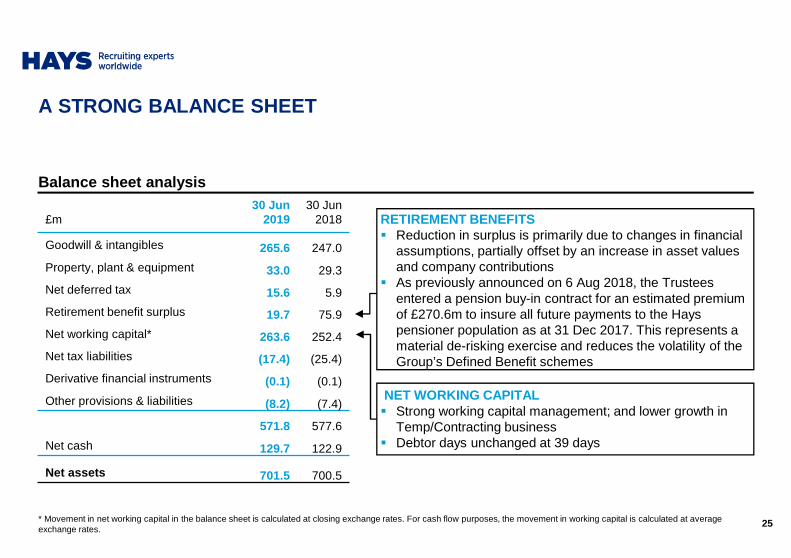
A STRONG BALANCE SHEET
Balance sheet analysis
* Movement in net working capital in the balance sheet is calculated at closing exchange rates. For cash flow purposes, the movement in working capital is calculated at average exchange rates.
£m30 Jun
201930 Jun
2018
Goodwill & intangibles 265.6 247.0
Property, plant & equipment 33.0 29.3
Net deferred tax 15.6 5.9
Retirement benefit surplus 19.7 75.9
Net working capital* 263.6 252.4
Net tax liabilities (17.4) (25.4)
Derivative financial instruments (0.1) (0.1)
Other provisions & liabilities (8.2) (7.4)
571.8 577.6
Net cash 129.7 122.9
Net assets 701.5 700.5
RETIREMENT BENEFITS� Reduction in surplus is primarily due to changes in financial
assumptions, partially offset by an increase in asset values and company contributions
� As previously announced on 6 Aug 2018, the Trustees entered a pension buy-in contract for an estimated premium of £270.6m to insure all future payments to the Hays pensioner population as at 31 Dec 2017. This represents a material de-risking exercise and reduces the volatility of the Group’s Defined Benefit schemes
NET WORKING CAPITAL� Strong working capital management; and lower growth in
Temp/Contracting business� Debtor days unchanged at 39 days
25

TOTAL FY19 DIVIDEND PAYOUT OF £137.9 MILLION (FY18: £128.3 MILLION), INCLUDING PROPOSED SPECIAL DIVIDEND OF £7 9.7 MILLION
EXCESS CASH RETURNS POLICY
� Maintain a net cash position of c.£50 million� Assuming a positive outlook, any free cash flow generated over and
above this position will be distributed to shareholders via special dividends, or other appropriate methods, annually
� Third special dividend of 5.43p per share, in line with policy and recognising our highly cash-generative business model
� Target core dividend cover of 2.0x to 3.0x Group EPS‡
� Full-year dividend increased by 4% to 3.97p per share (2018: 3.81p), cover of 3.0x
� Cash cost of proposed FY19 core dividend is £58.2 million
CORE DIVIDEND POLICY
FREE CASH FLOW PRIORITIES
� Fund Group investments and development� Maintain a strong balance sheet� Deliver a core dividend which is sustainable, progressive and appropriate
The final and special dividend will be paid, subjec t to shareholder approval, on 15 November 2019 to shareholders on the register on 4 October 2 019
26‡ Excludes exceptional items. There were no exceptional items in the prior year.

FINANCIAL SUMMARY
OPERATING PROFIT‡ UP 4% TO £248.8M, RECORD INTERNATIONAL PROFITS
� ANZ profits flat y-o-y, impacted by tough conditions in New Zealand and C&P
� Good Germany profit growth, despite reduction in business confidence � Solid UK profit growth, driven by good cost control
� Solid RoW profit growth, impacted by slower growth in EMEA ex-Germany
� Focus moved to cost control in second half of the year
EXCELLENT CASH PERFORMANCE; INCREASE IN FULL-YEAR D IVIDEND� 106% conversion of operating profit‡ to operating cash flow
� Core dividend increased by 4% to 3.97p per share, plus special dividend of 5.43p per share� Total FY19 dividends of £137.9m (2018: £128.3m)
GOOD NET FEE GROWTH OF 6%, WITH INTERNATIONAL FEES UP 7%
� Good growth in Germany and RoW, although growth slowed through the year
� ANZ and UK delivered solid growth, despite economic uncertainties
Unless otherwise stated, all growth rates are LFL (like-for-like), representing organic growth at constant currency.‡ FY19 operating profit excludes exceptional items. There were no exceptional items in the prior year. 27

TITLESUB-TITLE
3. CURRENT TRADINGPAUL VENABLESFINANCE DIRECTOR

GOOD CONDITIONS IN ASIA; AUSTRALIA STABLE; GERMANY AND THE UK TOUGHER, WITH INCREASING SIGNS OF REDUCED BUSINESS CONFIDENCE
Current trading conditions by region
RoW � Conditions remain good across Asia, but are more mixed in the Americas. EMEA ex-Germany is broadly stable
ANZ � Market activity in Australia continues to be broadly stable sequentially, at high overall levels, albeit slightly below FY19. IT markets remain strong while C&P remains tough
UK&I � Market activity has recently softened, with signs that continued economic uncertainty is impacting business confidence, particularly in the private sector
Germany� Economic conditions and market activity levels are weakening, with reduced
business confidence and slower client investment decisions, particularly in the Engineering and Automotive sectors
Group� Headcount growth in Q1 FY20 expected to be modestly up sequentially, including
the impact of our normal seasonal graduate intake. Our increase will be below Q1 FY19, and lower than our normal rate as we focus on cost control
� FX remains a material sensitivity to reported financial performance
29

4. STRATEGYALISTAIR COXCHIEF EXECUTIVE

GOOD PROGRESS DELIVERED AGAINST KEY PRIORITIES, AND WELL-POSITIONED FOR LONG-TERM GROWTH AND DEVELOPMENT
ASPIRATION TO MATERIALLY INCREASE AND DIVERSIFY GROUP PROFITS
� Solid 4% profit‡ growth despite continued investments
� 19 countries delivered record net fees
� 80% of profit‡ outside the UK&I
� Market leader, with the strongest and most diversified platform
GENERATE, REINVEST & DISTRIBUTE MEANINGFUL CASH RETURNS
� Strong 106% cash conversion‡. Record £129.7m year-end cash
� Total dividends of c.£138m proposed for FY19, including a special dividend of c.£80m
� c.£265m paid or proposed in dividends in the first two years of the FY22 plan
BUILD CRITICAL MASS AND SCALE ACROSS OUR GLOBAL PLATFORM
� Year-end Group consultant headcount up 4%, although decreased by 2% in H2
� Non-perm represented c.60% of net fees; Technical specialisms also c.60%
� Strong progress rolling out new specialisms e.g C&P / A&F in the USA, Legal in Germany, IT Flex globally
� Continued to develop and embed technology collaborations as well as rolling out our internally developed digital tools
� Well positioned for long-term growth and development
INVEST IN PEOPLE & TECHNOLOGY, RESPOND TO CHANGE & BUILD RELATIONSHIPS
31‡ FY19 operating profit excludes exceptional items. There were no exceptional items in the prior year.

THERE ARE NO SHORTCUTS. OVER A DECADE OF INVESTMENT AND I.P. HAS BROUGHT US INTO THE THIRD PHASE OF OUR TECHNOLOGY J OURNEY
Phase 1: 2008-12
Hays Foundations
• Global processes
• Global architecture
• Internet-enabled internal system
• Speed and agility
Phase 2: 2012-17
Hays Connections
• Channel exploitation
• Collaborations with LinkedIn, SEEK, Xing, StackOverflow and Google
• Launch of ‘Find & Engage’ model
Phase 3: 2017+
Hays Deep Insights
• Data science underpins Hays Power Recruitment Platform
• Further builds on our ‘Art & Science’ recruitment model, aligning cutting-edge technology with Hays’ market-leading consultant expertise
32

THE DATA DILEMMA: DRIVING MORE VALUE FROM DATA THAN HR TEAMS AND COMPETITORS
Multichannelengagement
signals at scale
Captured viaHays’ Techecosystem
Hays’ proprietarydata infrastructure &
raw data asset
Insights from analytics based on
Hays’ expertise & data
Integrated intoconsultant tools,
driving fees
CLICK
LIKE
TWEET
REVIEW
DOWNLOAD
VIEW
SHARE
COMMENT
LOG-IN
SEARCH
APPLY
CALL
VISIT
MILLIONSOF NEW DATA POINTSEACH DAY
Access to more and better data Convert data effectively into insights Drive real actions from insight
DATAQUALITY &COMPLIANCE
INSIGHTS
33

A PRIORITISED PIPELINE OF OPPORTUNITIES TO BUILD SC ALE
GERMANYAUSTRALIAUK
CORE PROFIT
DRIVERS
FUTURE MATERIALPROFIT DRIVERS
MEANINGFUL CONTRIBUTORS NETWORK
CRITICAL
FRANCE
AUSTRIAPOLANDNEW ZEALANDMALAYSIANETHERLANDSBRAZIL
16OTHER HAYSCOUNTRIES
ONGOING
0-5 YEARS
0-10 YEARS
£20m+ TARGET
£10m+ TARGET
CHINABELGIUMSWITZERLANDSPAINCANADAJAPANUSA
£5m+ TARGET
34

5.1
8.7 8.9 9.311.9
14.015.7
20.4
27.6
34.0
0.31.2
(0.5)(1.0)
0.01.0 1.0
2.1
6.0
7.9
-2
-1
0
1
2
3
4
5
6
7
8
9
10
11
12
13
14
15
16
17
18
-5
0
5
10
15
20
25
30
35
40
45
FY
10
FY
11
FY
12
FY
13
FY
14
FY
15
FY
16
FY
17
FY
18
FY
19
China net fees (LHS) China operating profit (RHS)F
Y10
� £5m of net fees� 70 consultants based in 3 offices� Modest conversion rate of 5.9%
Com
paris
on
� Net fee CAGR of 23% between FY10 and FY19
� Conversion rate almost quadrupled to 23.2%, as we have built scale and driven leverage
� 247% growth in consultants to 243, with productivity up 92% to £140k per consultant
FY
19
� Record net fees of £34m, up 22% YoY� Record operating profit of £7.9m, up 32%
YoY� 243 consultants based in 6 offices
Broad-based growth and strong profit leverage as we achieve scale
35
CHINA PERFORMANCE SINCE 2010: 23% NET FEE CAGR; NOW OUR 5th
MOST PROFITABLE MARKET

Good progress delivered against key priorities, and well-positioned for long-term growth and development
CONCLUDING REMARKS
36
� We have delivered a solid performance despite weakening macroeconomic conditions
� The Group is more diversified and technologically-enabled than ever before
� Strongest management team throughout the business that we have ever had
� Business model remains highly cash-generative
46.6 55.4 58.2
61.672.9 79.7
108.2128.3 137.9
FY17 FY18 FY19
SpecialCore
£374m paid or proposed since the Group started paying special dividends
Annual dividends (£m)
Headlines

APPENDIX 1FY19 Results supporting materials

POTENTIAL FOR MATERIAL RETURNS TO SHAREHOLDERS BASE D ON ACHIEVING OUR 5-YEAR ASPIRATIONS TO JUNE 2022*
£’m
FY22 OPERATING PROFIT 300 375 450
CU
MU
LAT
IVE
FREE CASH FLOW 861 944 1042
USES OF FREE CASH FLOW
CAPEX 117 124 129
DEFERRED VEREDUS (FY18) 14 14 14
PENSION 79 79 79
CORE DIVIDEND 304 340 381
SPECIAL DIVIDEND 347 387 439
TOTAL DIVIDENDS 651 727 820
KEY ASSUMPTIONS:
1. Average working capital outflow of £50m per annum in mid-point case
2. No M&A spend built into the profitor the cash flow figures
3. Dividend policy unchanged,as per FY17
4. No assumed buyout of pension scheme
5. Share awards continue to be metby issuing new shares
6. Tax rate reduces to 29% over the plan period in mid-point case
* As outlined at our November 2017 Investor day. 38

LIKE-FOR-LIKE SUMMARY
* LFL (‘like-for-like’) growth is organic growth at constant currency.‡ FY19 operating profit excludes exceptional items. There were no exceptional items in the prior year.
Year ended 30 June 2018£m
FX impact£m
Organic£m
2019£m
LFL* growth
Net fees
Australia & New Zealand 199.4 (7.7) 6.8 198.5 4%
Germany 276.0 (1.5) 25.3 299.8 9%
United Kingdom & Ireland 258.2 (0.1) 5.7 263.8 2%
Rest of World 339.2 0.5 27.9 367.6 8%
Group 1,072.8 (8.8) 65.7 1,129.7 6%
Operating profit ‡
Australia & New Zealand 69.1 (2.8) 0.1 66.4 0%
Germany 86.0 (0.5) 5.8 91.3 7%
United Kingdom & Ireland 47.0 0.0 1.9 48.9 4%
Rest of World 41.3 (0.1) 1.0 42.2 2%
Group 243.4 (3.4) 8.8 248.8 4%
39

H2 FY19 vs H1 FY19: ANALYSIS BY DIVISION
Net fee growth (LFL*) versus same period last year
Q1 19 Q2 19 H1 19 Q3 19 Q4 19 H2 19
Australia & New Zealand 7% 8% 7% 3% (3%) 0%
Germany 13% 15% 14% 6% 2% 4%
United Kingdom & Ireland 3% 3% 3% 3% (2%) 1%
Rest of World 14% 10% 11% 9% 2% 5%
Operating profit growth (LFL* ‡)versus same period last year
Australia & New Zealand 6% (5%)
Germany 14% 0%
United Kingdom & Ireland 6% 2%
Rest of World 4% 1%
Conversion rate (%)operating profit as % of net fees
Australia & New Zealand 33.6% 33.3%
Germany 30.4% 30.5%
United Kingdom & Ireland 18.2% 18.8%
Rest of World 10.7% 12.3%
* LFL (‘like-for-like’) growth is organic growth at constant currency.‡ FY19 operating profit excludes exceptional items. There were no exceptional items in the prior year.Note: H1 19 is the period from 1 July 2018 to 31 December 2018. H2 19 is the period from 1 January 2019 to 30 June 2019.
40

Country/Region(ranked by net fees)
FY19 Net fees
£m
Net fee growth
(LFL*)
# of offices
# of consultants
France 67.6 4% 20 403
USA 43.1 7% 12 260
Benelux 39.4 (3)% 12 249
China 34.1 22% 6 243
Canada 23.0 18% 8 156
Switzerland 22.2 3% 4 126
Japan 22.0 4% 3 158
Spain 20.8 14% 5 192
Poland 17.7 4% 6 349
Russia 9.5 16% 2 180
Italy 9.5 20% 4 81
Austria 7.9 19% 2 49
Other** 50.8 12% 20 567
Rest of World 367.6 8% 104 3,013
REST OF WORLD PERFORMANCE BY COUNTRY / MARKET
* Percentages represent LFL (‘like-for-like’) growth which is organic growth at constant currency for the year ended 30 June 2019 versus the year ended 30 June 2018. ** Other represents financial results for remaining RoW markets.Note: Pie charts represent net fees by country / sub region.
Rest of World net fees
France
USA
Benelux
ChinaCanada
Switz.
Japan
Spain
Poland
Other**
41

TECHNICAL SPECIALISMS ADD TO OUR BALANCE AND RELATI VE RESILIENCE
Technical net fee growth CAGR FY11-19: 9% (FY19: 7%)
3.
Professional net fee growth CAGR FY11-19: 5% (FY19: 5%)
4.
More resilience towards technology changes2.
Investment-led hires rather than purely candidate-driven
1.
* Technical specialisms include Engineering, Information Technology, Digital, Fintech, Construction, Life Sciences, Industry and Resources & Mining.** Professional specialisms include Accountancy & Senior Finance, Banking, HR, Legal, Sales & Marketing, Education, Public Sector, Office Support and Financial Services.
Attributes of Technical* vs Professional** net fees
Technical specialisms now represent >60% Group net fees (CAGR FY11-19: c.9% vs c.5% Professional)
51%
48%
46%
45%
42%
40% 40%
40%
39%
38%
38%
38%
49%
52%
54%
55%
58%
60% 60%
60%
61%
62%
62%
62%
0%
10%
20%
30%
40%
50%
60%
70%
80%
90%
100%
FY08 FY09 FY10 FY11 FY12 FY13 FY14 FY15 FY16 FY17 FY18 FY19
Professional net fees Technical net fees
42

66%
25%
CANADA
34%
BELGIUM
50%
NETHERLANDS
USA
50%
FRANCE
65%
75%
JAPAN
21%
SWITZERLAND
Temp/Contractor business as % of net fees
CONTINUED INVESTMENT IN BUILDING FURTHER SCALE AND DIVERSITY ACROSS OUR GLOBAL PLATFORM
19%
POLAND
54%
NEW ZEALAND
RELATIVE RESILIENCE TO THE CYCLE
SIGNIFICANT BARRIERS TO ENTRY
EXISTING HAYS EXPERTISE
3.
4.
2.
CLEAR STRUCTURAL GROWTH OPPORTUNITIES
1.
43
Temp & Contracting
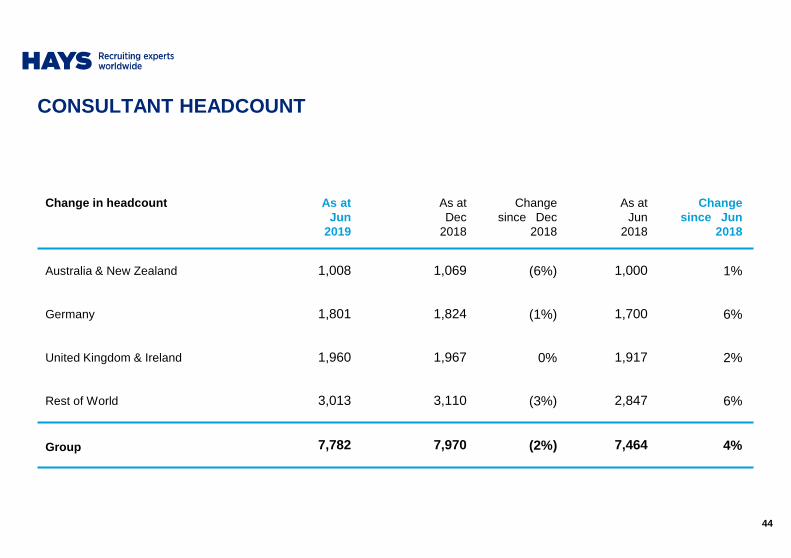
CONSULTANT HEADCOUNT
Change in headcount As at Jun
2019
As at Dec
2018
Changesince Dec
2018
As atJun
2018
Changesince Jun
2018
Australia & New Zealand 1,008 1,069 (6%) 1,000 1%
Germany 1,801 1,824 (1%) 1,700 6%
United Kingdom & Ireland 1,960 1,967 0% 1,917 2%
Rest of World 3,013 3,110 (3%) 2,847 6%
Group 7,782 7,970 (2%) 7,464 4%
44

OFFICE NETWORK
* Offices opened is shown net of closed and merged offices.
Number of offices 30 June 2018
Opened/(Closed)*
30 June2019
Australia & New Zealand 39 2 41
Germany 22 2 24
United Kingdom & Ireland 97 (1) 96
Rest of World 99 5 104
Total 257 8 265
45

TRADING DAYS IN MAJOR MARKETS
Australia Germany UK
Number of trading days H1 H2 Year H1 H2 Year H1 H2 Year
Year ended 30 June 2018 127 124 251 125 123 248 127 125 252
Year ended 30 June 2019 128 123 251 127 122 249 128 124 252
Year ending 30 June 2020 129 124 253 128 122 250 129 125 254
46

APPENDIX 2The Hays business model & strategy for growth

WE HAVE CLEAR, WELL ESTABLISHED STRATEGIC PRIORITIE S TO DELIVER OUR LONG-TERM AIMS
GENERATE, REINVEST & DISTRIBUTE
MEANINGFUL CASH RETURNS
BUILD CRITICAL MASS & DIVERSITY
ACROSS OUR GLOBAL PLATFORM
MATERIALLY INCREASE &
DIVERSIFY GROUP PROFITS
INVEST IN PEOPLE, TECHNOLOGY,
COLLABORATIONS & INNOVATION
48

… and leverages the Group to economic improvement
THE STRENGTH OF OUR MODEL IS KEY TO DELIVERING FOR CLIENTS AND DRIVING FINANCIAL PERFORMANCE THROUGH THE CYCLE
… a resilient financial performance in tougher economic times…
…delivers the best solutions for clients & candidates…
… the best people, sector leading technologyand a world class brand…
Unrivalled scale, balance and diversity…
49

HAYS IS A LEADING GLOBAL EXPERT IN QUALIFIED, PROFE SSIONAL AND SKILLED RECRUITMENT
GENERALISTS (mostly blue collar)
EXECUTIVE SEARCH (head-hunting)
PROFESSIONAL RECRUITMENT (mostly white collar)
� Contingent fee model� Focus on high-skilled roles� Clear structural growth markets
50

A PROVEN TRACK RECORD OF ORGANIC GROWTH
New country & specialism entries33 COUNTRIES / MARKETS 20 SPECIALISMS
Pre 1990
Early 1990s
Late 1990s
2000
2001
2002
2003
2004
2005
2006
2007
2008
2009
2010
2011
2012
2018
Brazil
China
Organic Acquisition
A&F C&P
FranceCzech Rep.
Netherlands
Portugal
Canada
Belgium
Germany Switzerland
Spain
Austria
Sweden Poland
Australia
New Zealand
Singapore
Italy UAELuxembourg
UK
Key:
Legal
Banking Fin Services
EducationContact Ce.
Engineering
HR
Sales & Ma.
Executive
Retail
Healthcare
Procurement
IT
Japan Life Sciences
Energy O&G
Hungary Denmark
Ireland
India Russia
Mining
Mexico USA
Colombia
Chile Malaysia
Office Pros
Telecoms
Romania51

ACTING RESPONSIBLY IS EMBEDDED IN OUR STRATEGIC PRI ORITIES
52
MATERIALLY INCREASE AND
DIVERSIFY PROFITS
INVEST IN PEOPLE &
TECHNOLOGY
BUILD CRITICAL MASS &
DIVERSITY
2019 ACHIEVEMENTS
GENERATE, REINVEST AND
DISTRIBUTE CASH RETURNS
1: Hays plc has been independently assessed according to the FTSE4Good criteria, and has satisfied the requirements to become a constituent of the FTSE4Good Index Series.2: CBI = Confederation of British Industry. 3: Our employee GHG emission intensity per tonne CO2e was 1.58 in 2017 (against 1.66 last year (restated)).
PEOPLEWe take huge pride in Hays’ culture, career paths and reputation for providing the best training in the industry
Group headcount up 4%. 3,475 internal promotions
CANDIDATESIn 2019 we received >70m website hits and c.11m applications. We support candidates with career guidance and industry expertise
We helped over 335k people find a new career
CLIENTSClients are at the heart of what we do. We have a constant focus on delivering the specialisms they need, when they need them
> 30,000 clients and Strategic CBI Partner
COMMUNITIESWe find the right jobs for people. This enables businesses, their people and communities to flourish
Training & community initiative helps people back to work
ENVIRONMENT Initiatives such as ‘Switch It Off’, video-conferencing and recycling reduces carbon intensity. FTSE4Good member
Annual CO2-per-employee down 2%3.
GOVERNANCEOur solid corporate governance framework intrinsically links the board and management to employees and clients
Our new feedback system, Your Voice, was completed by 87% of employees
INT
ER
NA
L S
TAK
EH
OLD
ER
SE
XT
ER
NA
L S
TAK
EH
OLD
ER
S

Top 3 position Top 5 positionMarket Leader Other
OUR WORLDWIDE PLATFORM PROVIDES A PIPELINE OF FUTUR E GROWTH OPPORTUNITIES & LEADERSHIP IN ALL CORE MARKE TS
Australia (#1)BelgiumBrazilFranceGermany (#1)ChinaHungaryIreland (#1)ItalyJapan (#1)
MalaysiaNew Zealand (#1)Poland (#1)Portugal (#1)RussiaSingaporeSpainSwedenSwitzerlandUK (#1)
AustriaCanadaChileColombiaCzech Rep.
DenmarkLuxembourgMexicoNetherlandsUAE
Hays market positioning*
TOP 3
TOP 5
* Market position is based on Hays estimates. List of markets only includes those with top 5 market positions and excludes newly opened countries.
The largest international specialist recruitment bu siness in the world
53

OUR STRATEGIC FOCUS IS ON BUILDING SCALE IN KEY MAR KETS
� Market leaders in eight countries including: UK, Australia, Germany
� Top-3 market position in a further 12 countries
� One country added since 2012
� Leading market positions across professional and technical areas
� Long-established market presence across all key specialist areas
� Balance of specialisms leveraged to different stages of the economic cycle
HAYS MARKETS HAYS SPECIALISMS
33
2002
2019
11
20
2002
2019
10
54

MARKET-LEADING BREADTH AND DEPTH OF PLATFORM
20 SPECIALISMS 33 COUNTRIESA
ustr
alia
New
Zea
land
Ger
man
y
UK
Irel
and
Aus
tria
Den
mar
k
Sw
itzer
land
Sw
eden
Rus
sia
Luxe
mbo
urg
Fra
nce
Net
herla
nds
Bel
gium
Spa
in
Por
tuga
l
Italy
Pol
and
Cze
ch R
ep.
Hun
gary
Rom
ania
UA
E
Can
ada
US
A
Mex
ico
Bra
zil
Chi
le
Col
ombi
a
Japa
n
Chi
na
Sin
gapo
re
Mal
aysi
a
Indi
a
Accountancy & FinanceConstruction & PropertyInformation TechnologyLife SciencesSales & MarketingBanking & Capital MarketsContact CentresEducationEngineering & ManufacturingExecutiveFinancial ServicesHealth & Social CareHuman ResourcesLegalOffice ProfessionalsEnergy, Oil & GasProcurementRetailResources & MiningTelecoms
Specialisms* 19 11 9 17 8 3 5 8 5 8 9 12 6 14 9 8 8 7 7 6 5 9 9 6 8 10 6 6 10 13 12 11 7Offices* 37 4 24 92 4 2 1 4 2 2 1 20 3 8 5 2 4 6 2 1 1 1 8 12 1 3 1 1 3 6 1 2 1 265
* Total as at 30 June 2019.55

� Exposure to structural growth and more mature areas
� Long-established across technical, white-collar spe cialisms
� Unmatched breadth and scale of operations globally
� Global connectedness of operations is key
� 33 countries around the world, up from 11 in 2002
� Rapid start-up phase now largely completed
� 20 specialist areas across professional / technical skills
� Focus on building scale in key specialisms in core markets
� Temporary / Contracting / Permanent
� Rolling out IT Contractor model to selected markets
THERE ARE 5 PILLARS WHICH UNDERPIN THE STRENGTH OF OUR BUSINESS MODEL
1. BALANCE
2. SCALE
3. GEOGRAPHIC DIVERSIFICATION
4. SECTORIAL DIVERSIFICATION
5. CONTRACT FORM DIVERSIFICATION
BALANCE, SCALE AND DIVERSIFICATION ARE WHAT SETS TH E HAYS BUSINESS MODEL APART AND DRIVES OUTPERFORMANCE
56

A BALANCED PORTFOLIO
Net Fees by type*
* Indicative purposes only based on information for the year ended 30 June 2019.** Major specialisms within Other include: Banking-related (5%), Life Sciences (4%) and Sales & Marketing (4%).
Spot~75%
Recruitment contracts
~25%
Public sector15%
Private sector85%
Top 40~15%
30,000 customers
~85%
Other**32%
Accountancy & Finance
15%
Construction & Property
15%
IT21%
Temp58%
Perm42%
Germany26%
Rest of World 31%
Office Sup. 8%
Engineering 9%United Kingdom
& Ireland24%
Spot ~75%
Private sector85%
30,000 customers85%
RoW 32% Other** 33%
Temp 57%
Recruitmentcontracts ~25%
Public sector15%
Top 4015%
UK&I 23% IT 23%
Perm 43%
Germany 27%
A&F 15%
ANZ 18%
C&P 13%
Engineering 9%
Office Support 7%
57

China, Singapore (4%)
Net fees by market maturity* (percentages in table show % of Group net fees in FY19)
ESTABLISHED:>70% penetration27% of Group net fees+3% LFL net fee growth
DEVELOPING:>30-70% penetration
27% of Group net fees+4% LFL net fee growth
EMBRYONIC: <10% penetration4% of Group net fees+8% LFL net fee growth
EMERGING:10-30% penetration42% of Group net fees
+10% LFL net fee growth
UK & Ireland (23%)
Australia & NZ (18%) France,
Netherlands,Canada (9%)
Japan, Malaysia (2%)
Latin America, Russia, India (2%)
Germany (27%)
Other RoW (11%)
BALANCED BUSINESS MODEL: WELL DIVERSIFIED IN STRUCTURAL AND CYCLICAL MARKETS
USA (4%)
* Market penetration represents the percentage of skilled and professional recruitment that is outsourced, based on Hays’ management estimates.58

33%
55%
12%
FY19 £1,129.7m
Net Fees
Information TechnologyLegal
Candidate shortagesClients investing
Continued investmentDrive growth
STRONG: GROWTH >10%*
TOUGH: DECLINE <0%*
BankingRetail
UK Education
Tough conditions
Defend market position Reduce costs
SOLID / GOOD:GROWTH 0-10%*
A&FConstruction & Property
EngineeringHR
Mixed conditions but opportunities
available
Selective investmentMaintain position
* Represents LFL (‘like-for-like’) growth rates in the year ended 30 June 2019. Listed specialisms are examples only and are not exhaustive.
BALANCED BUSINESS MODEL: SECTOR DIVERSITY EXPOSES U S TO GROWTH OPPORTUNITIES AND PROTECTS OUR BUSINESS
59

FY19 Net Fees by geography Temp Perm
BALANCED BUSINESS MODEL: SECTOR-LEADING EXPOSURE TO KEY TEMP/CONTRACTOR MARKETS, PERM-GEARED IN HIGH GROWTH AREAS
PROPORTION OF GROUP NET FEES
32%
68%
84%
16%
43%
57%
70%
30%
ANZ - 18% Germany - 27% UK&I - 23% RoW - 32%
60

TITLESUB-TITLE
APPENDIX 3
Divisional profiles

#1 market position*
Perm : Temp
Private : Public sector
Net fees: £198.5m
Operating profit‡: £66.4m
Conversion rate: 33.5%
Countries: 2
Consultants: 1,008
Offices: 41
‡ FY19 operating profit excludes exceptional items. There were no exceptional items in the prior year.Note: Private:Public sector and Temp:Perm split is based on net fees for the year ended 30 June 2019.* Market position is based on Hays’ estimates.
Diverse sector exposure Geographical diversification
Net fees by specialism Net fees by region
ANZ REPRESENTS 18% OF GROUP NET FEES WITH AUSTRALIA REPRESENTING 95% OF DIVISIONAL NET FEES
32% 68%
66% 34%
Year ended 30 June 19
23%
13%
12%12%8%
4%4%
24%
C&P Office SupportA&F ITBanking Resources & MiningSales & Marketing Other
30%
25%12%
9%
8%
5%11%
NSW VictoriaQueensland ACTWestern Australia New ZealandOther
62

HISTORICAL PROFILE OF HAYS AUSTRALIA & NEW ZEALAND
‡ Excludes exceptional items.Note: Historical net fees and historical operating profit shown on a headline basis. For local currency data, please see slide 70.
63

Net fees: £299.8m
Operating profit‡: £91.3m
Conversion rate: 30.5%
Consultants: 1,801
Offices: 24
Structurally developing market#1 market position* Sectorial diversification
GERMANY REPRESENTS 27% OF GROUP NET FEES AND 36% OF GROUP PROFIT
Private : Public sector
Net fees by specialism Net fees by contract type
90% 10%
Year ended 30 June 19
41%
28%
15%
5%5%4%
2%
IT EngineeringA&F C&PLife Sciences Sales & MarketingOther
56%28%
16%
Contracting Temp Perm
64
‡ FY19 operating profit excludes exceptional items. There were no exceptional items in the prior year.Note: Private:Public sector and Temp:Perm split is based on net fees for the year ended 30 June 2019.* Market position is based on Hays’ estimates.

HISTORICAL PROFILE OF HAYS GERMANY
65‡ Excludes exceptional items.Note: Historical net fees and historical operating profit shown on a headline basis. For local currency data, please see slide 70.

Net fees by specialism Net fees by region
Net fees: £263.8m
Operating profit‡: £48.9m
Conversion rate: 18.5%
Consultants: 1,960
Offices: 96
#1 market position* Diverse sector exposure Nationwide coverage
UK & IRELAND REPRESENTS 23% OF GROUP NET FEES AND 2 0% OF GROUP PROFIT
Temp : Perm
Private : Public sector
57% 43%
73% 27%
Year ended 30 June 19
22%
20%
12%10%
7%
7%
22%
A&F C&POffice Support ITBanking EducationOther
32%
22%18%
12%
8%8%
London North & ScotlandMids & E. Anglia SW & WalesIreland Talent Solutions
66
‡ FY19 operating profit excludes exceptional items. There were no exceptional items in the prior year.Note: Private:Public sector and Temp:Perm split is based on net fees for the year ended 30 June 2019.* Market position is based on Hays’ estimates.

HISTORICAL PROFILE OF HAYS UK & IRELAND
67‡ Excludes exceptional items.Note: Historical net fees and historical operating profit shown on a headline basis.

Structural growth opportunities
Net fees by specialism
Perm : Temp
Private : Public sector
Net fees by countryNet fees: £367.6m
Operating profit‡: £42.2m
Conversion rate: 11.5%
Countries: 28
Consultants: 3,013
Offices: 104
Diverse sector exposure Geographical diversification
Net fees by specialism Divisional Net fees by market
REST OF WORLD REPRESENTS 32% OF GROUP NET FEES, WITH FRANCE OUR LARGEST RoW MARKET
70% 30%
99%
Year ended 30 June 19
22%
13%
10%8%6%
6%6%
29%
IT A&FC&P Life SciencesOffice Support Sales & MarketingEngineering Other
1%
18%
12%
11%
9%6%6%
6%
6%
5%
21%
France USA BeneluxChina Canada SwitzerlandJapan Spain PolandOther
68‡ FY19 operating profit excludes exceptional items. There were no exceptional items in the prior year.Note: Private:Public sector and Temp:Perm split is based on net fees for the year ended 30 June 2019.

HISTORICAL PROFILE OF REST OF WORLD
69‡ Excludes exceptional items.Note: Historical net fees and historical operating profit shown on a headline basis.

LOCAL CURRENCY – NET FEES AND OPERATING PROFIT
70‡ Excludes exceptional items.

FINANCIALS’ ARCHIVE – QUARTERLY LFL NET FEE GROWTH
71
Australia & New Zealand Germany
UK & Ireland Rest of World
10%
14%
5%
23%
12%
7%
23%
16%
15%
19%
16% 16%
13%15%
6%
2%
Q1 Q2 Q3 Q4 Q1 Q2 Q3 Q4 Q1 Q2 Q3 Q4 Q1 Q2 Q3 Q4
FY16 FY17 FY18 FY19
5%
0%3%
6% 7%
11%
15%12% 13% 14%
12%14%
7% 8%
3%
(3%)Q1 Q2 Q3 Q4 Q1 Q2 Q3 Q4 Q1 Q2 Q3 Q4 Q1 Q2 Q3 Q4
FY16 FY17 FY18 FY19
6%1%
(3%)(4%)
(10%) (10%)
(4%)
(5%)
1% 1%
(2%)
5%3% 3% 3%
(2%)
Q1 Q2 Q3 Q4 Q1 Q2 Q3 Q4 Q1 Q2 Q3 Q4 Q1 Q2 Q3 Q4
FY16 FY17 FY18 FY19
13%
16%14% 14%
10%
5%
11%
7%
12%
17%
15%
23%
14%
10%9%
2%
Q1 Q2 Q3 Q4 Q1 Q2 Q3 Q4 Q1 Q2 Q3 Q4 Q1 Q2 Q3 Q4
FY16 FY17 FY18 FY19
%%
% %
Note: Historical net fee growth rates shown on a like-for-like basis.

FINANCIALS’ ARCHIVE – QUARTERLY LFL NET FEE & HEADCO UNT GROWTH
72
Temp Perm
Group Total End-of-quarter Consultant Headcount
8%7%
8%6%
2%
1%
7%
7%
13%
15%
11%
20%
11%9%
7%
0%
Q1 Q2 Q3 Q4 Q1 Q2 Q3 Q4 Q1 Q2 Q3 Q4 Q1 Q2 Q3 Q4
FY16 FY17 FY18 FY19
8%7%
2%
10%
5%
3%
12%
6%
8%
11%9%
11%
8%9%
5%
0%
Q1 Q2 Q3 Q4 Q1 Q2 Q3 Q4 Q1 Q2 Q3 Q4 Q1 Q2 Q3 Q4
FY16 FY17 FY18 FY19
8%7%
4%
8%
3% 2%
10%
7%
10%
13%
10%
15%
9%
9%
6%
0%
Q1 Q2 Q3 Q4 Q1 Q2 Q3 Q4 Q1 Q2 Q3 Q4 Q1 Q2 Q3 Q4
FY16 FY17 FY18 FY19
9% 10%
4%3% 2%
2%
8%
10%11%
13% 11%
8%7% 7%
5%4%
Q1 Q2 Q3 Q4 Q1 Q2 Q3 Q4 Q1 Q2 Q3 Q4 Q1 Q2 Q3 Q4
FY16 FY17 FY18 FY19
% %
% %
Note: Historical net fee growth rates shown on a like-for-like basis.

FURTHER INFORMATION
DAVID PHILLIPSHEAD OF INVESTOR RELATIONS CHARLES CHALKLYINVESTOR RELATIONS MANAGER
[email protected] +44 203 978 3173
For more information about the Group: haysplc.com/investors or @haysplcIR