has.concord.orghas.concord.org/argumentation-rubrics.docx · web viewcertainty rationale scoring:...
TRANSCRIPT

Argumentation Rubrics
Uncertainty-Infused Scientific Argumentation Rubrics
(version 1.0)
© The Concord Consortium, All Rights Reserved.
This document is updated as of 12/9/2016.
Contributors:
Amy Pallant, The Concord Consortium Sarah Pryputniewicz, The Concord Consortium Trudi Lord, The Concord Consortium Hee-Sun Lee, The Concord Consortium
Citation:
Pallant, A., Pryputniewicz, S., Lord, T., & Lee, H. –S. (2016). Uncertainty-infused scientific argumentation rubrics. Concord, MA: The Concord Consortium.
© The Concord Consortium 1

Argumentation Rubrics
Scientific Argumentation Task Index
Climate Module
Arg. No.
Arg. ID Task Intercoder reliability measured in Kappa (n)
Page No.
Explanation Uncertainty attribution
1 Future The three lines (marked A, B, and C) on the graph are possibilities for what could happen in the future (from 2010 to 2100). Which line best shows what you think will happen to the temperature in the future?
.93 (289) .85 (285) 4
2 Carbon What happens if you remove all of the carbon dioxide from the atmosphere? The temperature
.94 (284) .95 (277) 9
3 Vostok Temperature is related to the amount of carbon dioxide in the atmosphere. How does the temperature of 125,000 years ago compare to the temperature of 355,000 years ago? The temperature 125,000 years ago was likely
.90 (144) .82 (139) 13
4 Ocean Of course, in the real world, we can't just magically change the temperature of the Earth with a slider. Which choice best describes the relationship between atmospheric CO2 levels and its absorption by the ocean? When atmospheric CO2 levels become higher,
.92 (238) .90 (230) 17
5 Vapor Water vapor is a greenhouse gas. What do you think will happen to the temperature when the amount of water vapor increases?
.90 (238) .90 (240) 21
6 Combine What happens to the temperature when the atmospheric CO2 level increases in this model?
.94 (238) .94 (235) 25
7 Ice How might the trend shown in the graph affect Earth's temperature in the year 2100?
.94 (233) .86 (231) 29
8 Human How much did you need to change the human emissions to reduce the average global temperature in the model?
.86 (211) .88 (204) 34
Note. Argumentation tasks appear as part of an online curriculum module:
Module Access: What is the future of Earth’s climate? http://authoring.concord.org/sequences/202
http://authoring.concord.org/sequences/286
© The Concord Consortium 2

Argumentation Rubrics
Water Module
Arg. No.
Arg. ID Task Intercoder reliability measured in Kappa with sample size (n)
Page No.
Explanation Uncertainty attribution
1 Trap When water is absorbed by the ground, is it trapped in the ground?
.92 (295) .90 (282) 39
2 Bedrock According to the pictures, what is the likely porosity and permeability of bedrock?
.96 (157) .93 (151) 43
3 Pumice What is the likely porosity and permeability of pumice?
.95 (288) .92 (280) 47
4 Aquifer Which type of aquifer could potentially provide a sustainable source of water (a water source that will not run out and will consistently supply usable amounts of water)?
.95 (228) .91 (224) 51
5 Vernal What likely happened to the level of the water table between spring and summer?
.93 (230) .89 (225) 55
6 Impact Where should pumps be placed around a gaining stream (stream in an area with a high water table) to ensure a good flow of water from the wells and maintain flow in the stream?
.91 (223) .90 (218) 60
7 Runoff Are aquifers that lie beneath urban areas recharged by rainfall?
.93 (213) .96 (202) 66
8 Supply Sustainable water use occurs when the withdrawals of water are equal to or less than the inputs of water. Which of the wells in this model showed sustainable water use?
.90 (105) .89 (105) 71
Note. Argumentation tasks appear as part of an online curriculum module:
Module Access: Will there be enough fresh water? http://authoring.concord.org/sequences/171http://authoring.concord.org/sequences/285
© The Concord Consortium 3

Argumentation Rubrics
ESAAF PROJECT: CLIMATE MODULE RUBRIC
ARG1 (Future)Module: What is the future of Earth’s climate? (HASBOT)http://authoring.concord.org/sequences/202http://authoring.concord.org/sequences/286Activity 2.4: Predicting the future
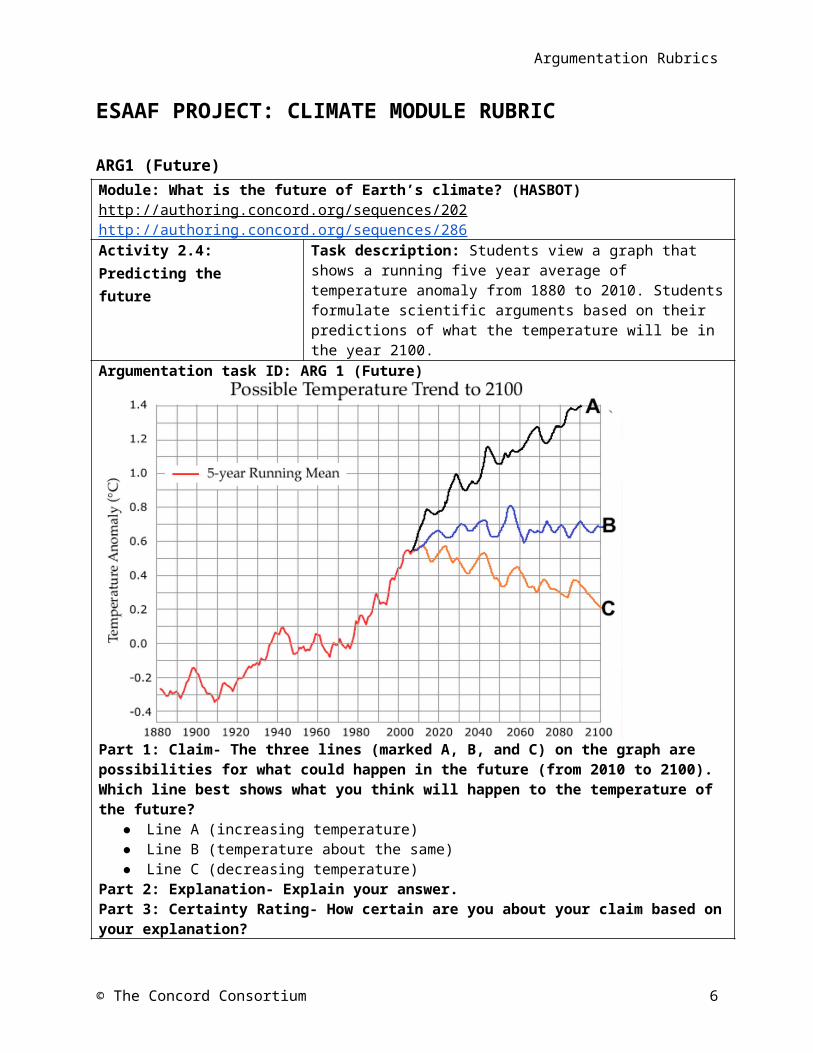
Task description: Students view a graph that shows a running five year average of temperature anomaly from 1880 to 2010. Students formulate scientific arguments based on their predictions of what the temperature will be in the year 2100.
Argumentation task ID: ARG 1 (Future)
Part 1: Claim- The three lines (marked A, B, and C) on the graph are possibilities for what could happen in the future (from 2010 to 2100). Which line best shows what you think will happen to the temperature of the future?
● Line A (increasing temperature)● Line B (temperature about the same) ● Line C (decreasing temperature)
Part 2: Explanation- Explain your answer.Part 3: Certainty Rating- How certain are you about your claim based on your explanation?Part 4: Certainty Rationale- Explain what influenced your certainty rating.Explanation Scoring: ARG 1 –EXPTo receive a high score on the explanation item, students should include their observations about the temperature history in the graph as well as reasoning about why their chosen prediction is likely to happen. Is there a trend in the temperature between 1880 and 2010? If so, what phenomena could be responsible for the trend? Some examples of valid data and valid reasoning are identified in the columns below.
© The Concord Consortium 4
Argumentation Rubrics
Valid Data(graph) Global temperatures have increased over the past 120 years.(graph) There are variations in the temperature (fluctuations in 5 year running mean) over the past 120 years.(graph) The temperature has increased since 1980.
Valid ReasoningWhy does the trend matter? (If all other factors are the same, the history of increasing temperatures would be expected to continue.)
What factors affect Earth's temperature? (Human emissions of carbon dioxide can raise the temperature. Changes in surface color can affect the temperature.)
How do greenhouse gases affect temperature? (Greenhouse gases absorb and re-emit infrared radiation in the atmosphere. This slows the escape of heat from Earth, warming the surface.)
Score Score description Response examplesScore 0 Blank, off-task, “I don’t know” I made an educated guess.Score 1 Incorrect claim, data, and/or
reasoning, OR mentioning “data” or “knowledge” without elaboration
It will eventually gold colder.
Because of how the temp goes up and down.
Because the temp is changing every year.Score 2 Valid claim I predict it will increase.
I predicted we're going to slow down and drop a little bit but in the long run global warming will heat us back up .
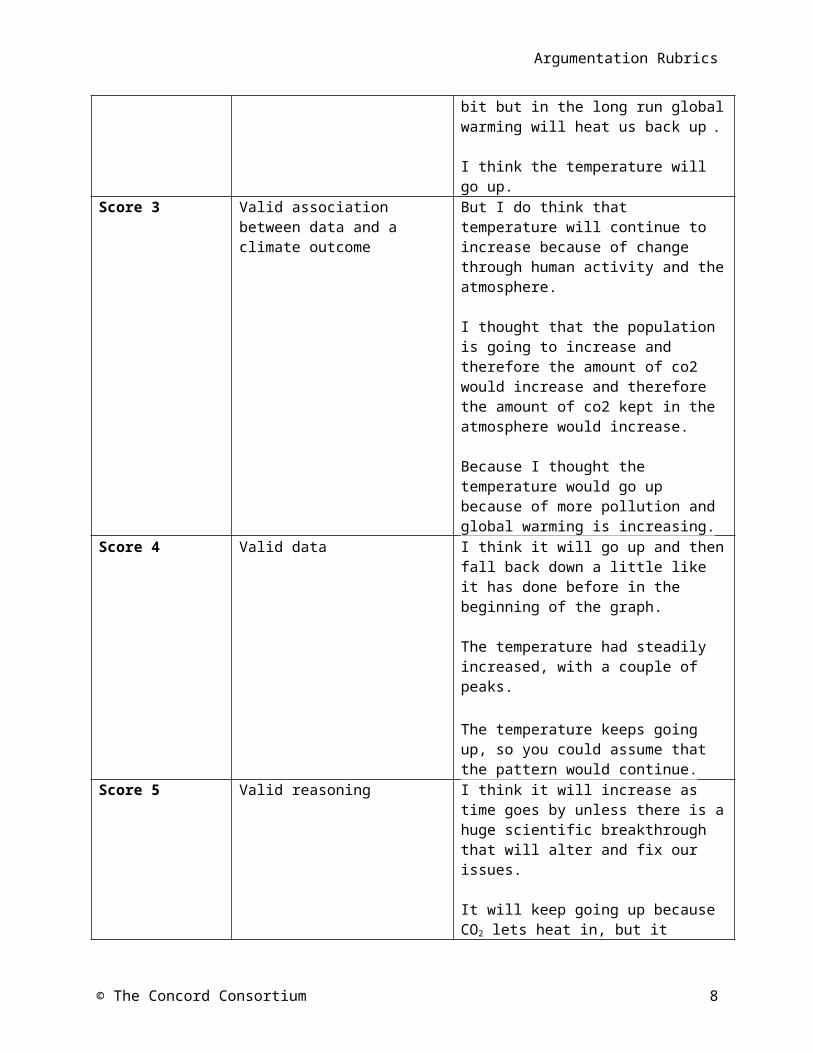
I think the temperature will go up.Score 3 Valid association between data
and a climate outcomeBut I do think that temperature will continue to increase because of change through human activity and the atmosphere.
I thought that the population is going to increase and therefore the amount of co2 would increase and therefore the amount of co2 kept in the atmosphere would increase.
Because I thought the temperature would go up because of more pollution and global warming is increasing.
Score 4 Valid data I think it will go up and then fall back down a little like it has done before in the beginning of the graph.
The temperature had steadily increased, with a couple of peaks.
© The Concord Consortium 5
Argumentation Rubrics
The temperature keeps going up, so you could assume that the pattern would continue.
Score 5 Valid reasoning I think it will increase as time goes by unless there is a huge scientific breakthrough that will alter and fix our issues.
It will keep going up because CO2 lets heat in, but it doesn’t let it out.
The temperature will only increase unless we change something of our destructive ways.
Score 6 Valid data and reasoning I saw that the temperature increased as the years go by so I assumed that the temperature would keep on increasing I also think that there will be more people in the future so there will be more cars which will cause more greenhouse gasses in the atmosphere, causing global warming.
I chose the upward curve because the trends of the past show increasing temperatures and unless there is a drastic change in climate then the temperature will keep on getting warmer.
I predicted that the temperature would increase, unless humans change their ways. While because weather [climate] is weather climate], it will not rise in a straight line. I also followed the past, which has rises and falls in temperature. So I just tried to mimic the past temperatures into the future.
Certainty Rationale Scoring: ARG 1 –UNCTo receive a high score on the certainty rationale item, students should consider the strength of the evidence presented as well as the representativeness of the data. What factors affect Earth's temperature? How could these change in the future? How likely are these predicted changes? Some examples of scientific sources of uncertainty are shown below.Scientific Sources of UncertaintyWhere the temperature data were collected (are all places well-represented?)How the temperature data were collected (data from 1800s vs. modern data sampling)Unpredictable effect of natural factors on global temperatureUnpredictable effect of human factors on global temperatureScore Score description Response examples
© The Concord Consortium 6

Argumentation Rubrics
Score 0 Blank, off-task, “I don’t know” I kinda figured it out
I don’t know.Score 1 Personal sources of
certainty/uncertaintyThat it may have a different way to go. We could possibly have a dramatic decrease in temperature.
I am not sure what the question is asking me to do.
I think I’m right but I don’t know much about predicting.
Score 2 Mentions of “data,” “models,” “graphs,” etc. without elaboration
I just looked at the graph.
Pretty confident that the graph will increase and not decrease.
It is taught in math that if there are points on a graph you should look for a curved line that is in the middle of the plots.
Score 3 Scientific sources of certainty/uncertainty related to knowledge and/or data/evidence presented in the current investigation
The temperatures have only risen in the past few years and many countries still believe that fossil fuels are the only source of energy available.
The fact that global warming is increasing and the greenhouse effect is causing major problems regarding temperature that is sending temp way up.
Over the past 30 or so years, there has been a steady increase in temperature. when graphed out you can see the angle at which the information is at. Then I just thought it would be a reasonable estimate when you look at the information given before.
Score 4 Scientific sources of uncertainty outside the boundaries of the current investigation, such as recognizing limitations in the data collected for the investigation, suggesting a need for more data or a need for collecting data on a new factor, complexity of scientific phenomena under study, and limitations in current conceptualization of methods
I could be wrong but I could be right depending on global warming and pollution and where those are at right now.
The curve will continue to grow if the earth does not adjust or if humans do not do anything to slow the increase.
I know the population will continue to increase, and I feel like it will a lot because of more people entering the reproductive
© The Concord Consortium 7
Argumentation Rubrics
addressing a scientific question featured in the argumentation task.
age
© The Concord Consortium 8

Argumentation Rubrics
ARG2 (Carbon)Module: What is the future of Earth’s climate? (HASBOT)http://authoring.concord.org/sequences/202http://authoring.concord.org/sequences/2 86 Activity 3.2: Carbon dioxide in the atmosphere
Task description: Students adjust the level of CO2 in the atmosphere and explore the effect of CO2 on the average global temperature. Students formulate scientific arguments related to "What happens if you remove all of the carbon dioxide from the atmosphere?"
Argumentation task ID: ARG 2 (Carbon)
Part 1: Claim- What happens if you remove all of the carbon dioxide from the atmosphere?The temperature
● Increases.● Decreases. ● Stays the same.
Part 2: Explanation- Explain your answer.Part 3: Certainty Rating- How certain are you about your claim based on your explanation?Part 4: Certainty Rationale- Explain what influenced your certainty rating.Explanation Scoring: ARG 2 –EXPTo receive a high score on the explanation item, students should include what they observed about the temperature changes (upper graph) as they changed the carbon dioxide concentration. What is the relationship between carbon dioxide concentration and temperature? How does the radiation interact with the carbon dioxide? Some examples of valid data and valid reasoning are identified in the columns below.Valid Data(model) Temperature decreased as CO2 was removed.
Valid Reasoning CO2 is a greenhouse gas.
© The Concord Consortium 9

Argumentation Rubrics
(model) Temperature decreases because infrared radiation does not have greenhouse gas molecules to bounce off of.(model) More infrared radiation goes into space when CO2 is lower.(model) Solar radiation can bounce off Earth's surface without being absorbed and trapped in the atmosphere.
Greenhouse gases “trap” infrared radiation (heat) from leaving Earth's atmosphere.
No CO2 in the atmosphere led to all the infrared radiation escaping the atmosphere.
Score Score description Response examplesScore 0 Blank, off-task, “I don’t know” I made an educated guess.Score 1 Incorrect claim, data, and/or
reasoning, OR mentioning “data” or “knowledge” without elaboration
Because there is more sunlight all over the land and its more spread out and doesn’t move as fast.
That is what the data proves.
We figured it out playing the model. Score 2 Valid claim I used the model and the temperature
dropped.
None of the sunlight can be held in the Earth because it all leaves the atmosphere, so there would be no heat.
The temperature decreased.Score 3 Valid association between data
and a climate outcomeWhen the carbon dioxide decreases in the air the temperature decreases.
If you removed all the carbon dioxide from the atmosphere., the temperature of the atmosphere will decrease.
No changes in the CO2 level still causes temperatures to rise. If there was no carbon dioxide in the atmosphere, then the temperature may drop.
Score 4 Valid data I put a ton of CO2 in the air and once I started to remove it the temperature decreased
When you take out the CO2 in the atmosphere the temperature became cooler and the energy from the sun slowed down.
© The Concord Consortium 10

Argumentation Rubrics
When I went on the diagram and removed all he CO2, the temperature graph went down, but when i left it alone, it slowly rose.
Score 5 Valid reasoning Greenhouse gases are the gases that heat up our planet.
CO2 keeps the stored energy in allowing heat to be stored thus heating the atmosphere.
If the carbon dioxide is gone then there wouldn’t be any greenhouse gases left to warm up the air.
Score 6 Valid data and reasoning When I removed all of the carbon dioxide from the atmosphere, the temperature dropped because the infrared radiation was not colliding with the carbon dioxide. It was able to leave the Earth.
If you remove all of the carbon dioxide from the atmosphere, the temperature will decrease. This will happen because carbon dioxide is a greenhouse gas, and greenhouse gases trap heat. As shown in the graph when the CO2 is removed, the temperature decreases.
When there is no carbon dioxide in the atmosphere, it doesn't trap the heat and keeps the heat from leaving so they temperature would begin decreasing. The graph shows that when carbon dioxide levels decrease so does global temperature.
Certainty Rationale Scoring: ARG 2 –UNCTo receive a high score on the certainty rationale item, students should note both the strengths and weaknesses of the model as a representation of Earth's climate system. Does the model show all of the components of the atmosphere? Some examples of scientific sources of uncertainty are shown below.Scientific Sources of UncertaintyModel shows that adding carbon dioxide increases temperature; removing carbon dioxide decreases temperature. Model may not show all factors that affect Earth's temperature.Score Score description Response examplesScore 0 Blank, off-task, “I don’t know” I am not positive about my answer.
I am pretty sure I got the answer but I am not positive.
© The Concord Consortium 11

Argumentation Rubrics
Score 1 Personal sources of certainty/uncertainty
I said I wasn't that certain because it looked like it was staying close to the same but that didn't really make sense to me so I waited and it looked like it might be decreasing a little bit.
I understand the information I've been given.
I learned this in class.Score 2 Mentions of “data,” “models,”
“graphs,” etc. without elaborationThe graph above.
I used the model to get my answer.
Because I did the experiment and looked at the graph.
Score 3 Scientific sources of certainty/uncertainty related to knowledge and/or data/evidence presented in the current investigation
The graph showed that the temperature was decreasing when there was nothing stopping the heat from escaping.
In the model when you remove the CO2 the temperature on the graphs drop.
All I know is what the graphs did. After a while the CO2 graph stayed the same and the temp continued to go up.
Score 4 Scientific sources of uncertainty outside the boundaries of the current investigation, such as recognizing limitations in the data collected for the investigation, suggesting a need for more data or a need for collecting data on a new factor, complexity of scientific phenomena under study, and limitations in current conceptualization of methods addressing a scientific question featured in the argumentation task.
This is on an estimated graph, it may fluctuate much more or less than shown here.
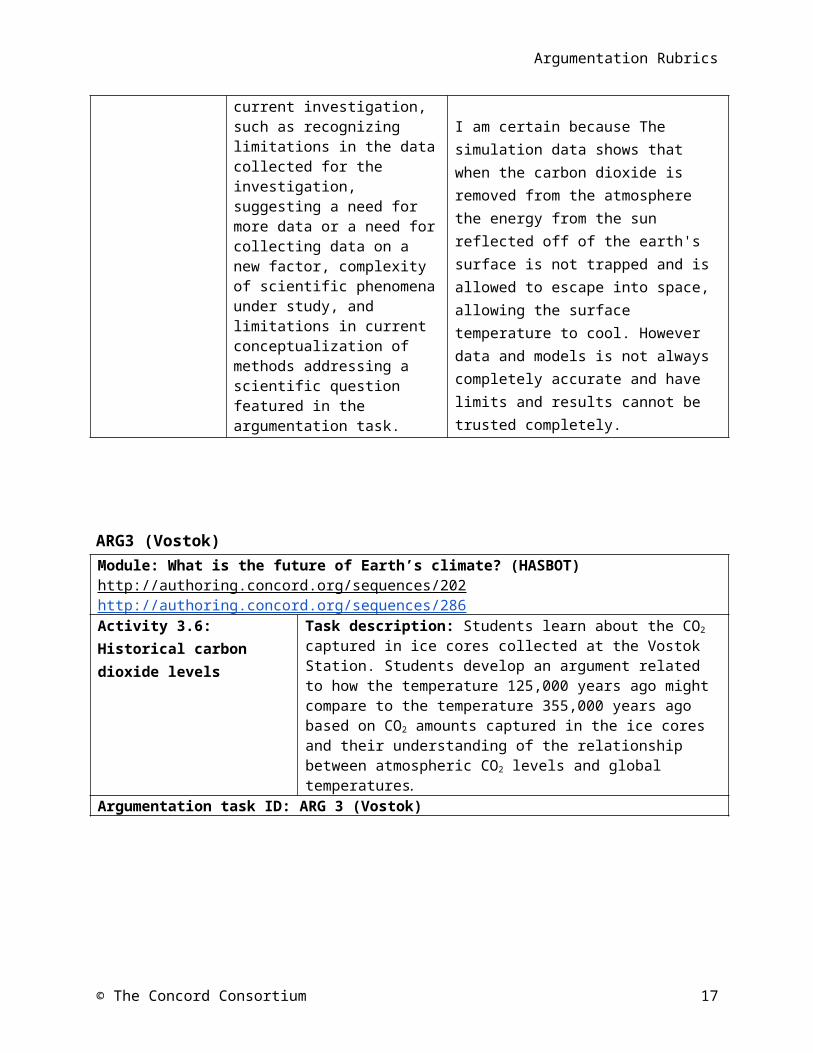
I am certain because The simulation data shows that when the carbon dioxide is removed from the atmosphere the energy from the sun reflected off of the earth's surface is not trapped and is allowed to escape into space, allowing the surface temperature to cool. However data and models is not always completely accurate and have limits and results cannot be trusted completely.
ARG3 (Vostok)
© The Concord Consortium 12

Argumentation Rubrics
Module: What is the future of Earth’s climate? (HASBOT)http://authoring.concord.org/sequences/202http://authoring.concord.org/sequences/286Activity 3.6: Historical carbon dioxide levels
Task description: Students learn about the CO2 captured in ice cores collected at the Vostok Station. Students develop an argument related to how the temperature 125,000 years ago might compare to the temperature 355,000 years ago based on CO2 amounts captured in the ice cores and their understanding of the relationship between atmospheric CO2 levels and global temperatures.
Argumentation task ID: ARG 3 (Vostok)
Part 1: Claim- Temperature is related to the amount of carbon dioxide in the atmosphere. How does the temperature of 125,000 years ago compare to the temperature of 355,000 years ago?The temperature 125,000 years ago was likely
● Lower than 355,000 years ago.● The same as 355,000 years ago. ● Higher than 355,000 years ago.
Part 2: Explanation- Explain your answer.Part 3: Certainty Rating- How certain are you about your claim based on your explanation?Part 4: Certainty Rationale- Explain what influenced your certainty rating.Explanation Scoring: ARG 3 –EXPTo receive a high score on the explanation item, students should include observations about the relative amount of atmospheric carbon dioxide 125,000 and 355,000 years ago, as well as reasoning about the link between carbon dioxide levels and temperature. What was the carbon dioxide level 125,000 years ago? What was the carbon dioxide level 355,000 years ago? What is the relationship between carbon dioxide and temperature? How does carbon dioxide affect the temperature? Some examples of valid data and valid reasoning are identified in the columns below.Valid Data Valid Reasoning
© The Concord Consortium 13

Argumentation Rubrics
(graph) CO2 level 125,000 years ago (290 ppm) is higher than CO2 level 355,000 years ago (110 ppm).(graph) CO2 levels increase and decrease in cycles.(graph) CO2 levels are higher in the most recent cycle.
CO2 is a greenhouse gas.
Greenhouse gases “trap” infrared radiation (heat) from leaving Earth's atmosphere.
Score Score description Response examplesScore 0 Blank, off-task, “I don’t know” I made an educated guess.
It just seems more likely it would be.Score 1 Incorrect claim, data, and/or
reasoning, OR mentioning “data” or “knowledge” without elaboration
The older the hotter it is.
The graph shows these two periods of time were relatively the same.
There was less pollution and industrial wastes and tree destruction.
Score 2 Valid claim 355,000 is very low and 125,000 is very high.
It was at the high point and the other was at a low point.
It is up a little bit higher than 355,000 years ago.
Score 3 Valid association between data and a climate outcome
Because there was a ice age and the temperature will of course be lower
Carbon dioxide has changed the air, and it has also changed the atmospheric temperature as well.
It is higher because the amount of carbon is higher creating more interfered sun light rays.
Score 4 Valid data On the graph, the temperature around 125,000 years ago the CO2 level is slightly higher than 355,000 years ago. Because of the heightened CO2 levels, the temperature will also be higher.
There was more CO2 125,000 years ago than 355,000 years ago, and more CO2 causes the temperature to increase therefore increasing the temperature more 125,000
© The Concord Consortium 14

Argumentation Rubrics
years ago.
Because the CO2 gets higher as it gets closer to our time.
Score 5 Valid reasoning Greenhouse gases are the gases that heat up our planet.
Over time, the natural emissions would build up and trap heat in over time. Therefore it would be higher. Some greenhouse gasses natural emissions are water vapor, methane, and CO2.
Because back then there was less infrared heat then there is now because of human activities.
Score 6 Valid data and reasoning Since there was more carbon dioxide in the atmosphere at that time, more of the sun's energy was kept on Earth, resulting in warmer temperatures.
The temperature line indicates there is more carbon in the atmosphere, thus trapping more heat and raising the temperature.
Certainty Rationale Scoring: ARG 3 –UNCTo receive a high score on the certainty rationale item, students should consider the strength of the evidence presented as well as the representativeness of the data. What does the ice core data say about carbon dioxide levels? What do you know about the relationship between carbon dioxide and temperature? How did scientists measure the amount of atmospheric carbon dioxide of past years vs. measuring the amount of atmospheric carbon dioxide today? Some examples of scientific sources of uncertainty are shown below.Scientific Sources of UncertaintyCO2 levels are correlated with temperature levels.The instruments used to measure CO2 levels have limitations.Natural factors other than CO2 may have affected Earth's temperature in the past.The ice cores in which CO2 levels were measured may not represent the CO2 level of the entire planet.The number of ice core samples may not be large enough to make good estimates.Score Score description Response examplesScore 0 Blank, off-task, “I don’t know” I know I’m right.
I’m certain about my explanation.Score 1 Personal sources of
certainty/uncertaintyIt depends whether you actually find the numbers or if you estimate.
There isn't really a way to know really exactly why.
© The Concord Consortium 15

Argumentation Rubrics
Score 2 Mentions of “data,” “models,” “graphs,” etc. without elaboration
The graph shows that 125,000 years ago was a lot higher than 355,000 years ago.
The graph clearly shows this difference.because I am sure about the data it is on the graph.
I feel really confident in this! the graph says so!
Score 3 Scientific sources of certainty/uncertainty related to knowledge and/or data/evidence presented in the current investigation
These modules have taught me that CO2
levels increase temperature.
I am very certain because there was more CO2 during that time period so the temperature would've been higher.
I am very certain because CO2 keeps the heat in the atmosphere.
Score 4 Scientific sources of uncertainty outside the boundaries of the current investigation, such as recognizing limitations in the data collected for the investigation, suggesting a need for more data or a need for collecting data on a new factor, complexity of scientific phenomena under study, and limitations in current conceptualization of methods addressing a scientific question featured in the argumentation task.
Because it's higher because either an ice age had an effect on plants, or a volcano made all the plants die. Meaning there would be more carbon dioxide levels.
Even if it was so long ago, nature was still there. Therefor, natural disasters and storms could have still occurred.
While the graph provides accurate data, I had to guess where 125,000 years ago was on the graph as well as where 355,000 years ago was, leaving room for error.
© The Concord Consortium 16
Argumentation Rubrics
ARG4 OceanModule: What is the future of Earth’s climate? (HASBOT)http://authoring.concord.org/sequences/202http://authoring.concord.org/sequences/286Activity 4.3: Changing ocean temperature
Task description: Students change the ocean temperature in the model to see how CO2 levels in both the ocean and atmosphere respond. Students formulate arguments related to the relationship between atmospheric CO2 levels and its absorption by the ocean.
Argumentation task ID: ARG 4 (Ocean)
Part 1: Claim- Of course in the real world, we can’t just magically change the temperature of the Earth with a slider. Which choice best describes the relationship between atmospheric CO2 levels and its absorption by the ocean? When atmospheric CO2 levels become higher,
● Less CO2 is absorbed by the ocean.● The same amount of CO2 is absorbed by the ocean. ● More CO2 is absorbed by the ocean.
Part 2: Explanation- Explain your answer.Part 3: Certainty Rating- How certain are you about your claim based on your explanation?Part 4: Certainty Rationale- Explain what influenced your certainty rating.Explanation Scoring: ARG 4 –EXPTo receive a high score on the explanation item, students should include observations about what happens to the amount of carbon dioxide in the ocean and air when the temperature changes, as well as reasoning about how carbon dioxide moves through the environment. How did you make temperature increase in this model? How did you make temperature increase in previous models? What happens to
© The Concord Consortium 17

Argumentation Rubrics
the amount of carbon dioxide in the ocean and air when the temperature is high? What about when the temperature is low? Why does changing the temperature change the amount of carbon dioxide in the ocean and air? Some examples of valid data and valid reasoning are identified in the columns below.Valid Data(graph/model) When temperature is high, less CO2 is dissolved in the ocean. (graph/model) When temperature is high, more CO2 is released from the ocean into the air.(graph/model) Greater fluctuations in graph of atmospheric CO2 than graph of dissolved CO2
Valid Reasoning Less CO2 dissolved in the ocean leads to more CO2 in the air.
CO2 is less soluble in hot water than in cold water.
When there is a lot of CO2 in the ocean, it's more difficult to absorb more.
CO2 is a greenhouse gas.
Greenhouse gases “trap” heat in the atmosphere.
Heat is transferred from the air to the ocean.Score Score description Response examplesScore 0 Blank, off-task, “I don’t know” I have no idea.Score 1 Incorrect claim, data, and/or
reasoning, OR mentioning “data” or “knowledge” without elaboration
The CO2 in the atmosphere and the ocean both gets stuck there for a long time before it is able to get out.
I got this answer by using the slider and seeing it for myself.
The temperature doesn’t seem to affect the amount of CO2 levels in the atmosphere.
Score 2 Valid claim Because there is more carbon dioxide is in the atmosphere than in the ocean.
Less CO2 can get dissolved.
The graph shows that when one level increases the other respectively decrease.
Score 3 Valid association between data and a climate outcome
The amount of heat increases by the amount of CO2 that there is in the air.
Because the ocean is absorbing the CO2 from the atmosphere, the atmosphere will no longer contain as much CO2.
Because it dissolves with a higher temperature, the carbon dioxide is all the same. Cause the ocean to decide if it will absorb or get rid of the CO2.
Score 4 Valid data More gases in the ocean means less gases in
© The Concord Consortium 18

Argumentation Rubrics
the atmosphere.
It shows on the graph when I decrease the temperature the 2 lines come together on the graph so they are at the same level.
The graphs show that when the temperature decreases, so does the atmospheric CO2 levels, but the ocean CO2 levels increases.
Score 5 Valid reasoning Since there is a lot of carbon already in the ocean, it cannot dissolve as much.
The gases were absorbed by the cold water more than the warm water.
When the atmospheric temperature is colder then it allows the carbon dioxide to become less soluble and then it allows for easier absorption by the ocean.
Score 6 Valid data and reasoning If there is more CO2, more heat will be trapped in the atmosphere, making it hotter, and in turn, making less CO2 absorb into the ocean.
When the atmosphere has a lot of CO2 it absorbs infrared heat and infrared heat warms up the earth so the ocean gets hotter and it can’t dissolved CO2 very well
I believe that less CO2 will be absorbed by the ocean, when the atmosphere gets warmer so does the water. And when the water gets hotter, there is less CO2,a greenhouse gas-gas that can trap heat, dissolved.
Certainty Rationale Scoring: ARG 4 –UNCTo receive a high score on the certainty rationale item, students should consider what causes temperature to rise in the real world (unlike how they changed temperature in this model). What can you tell from the model about how carbon dioxide levels in the ocean and air change as temperature changes? Some examples of scientific sources of uncertainty are shown below.Scientific Sources of UncertaintyCO2 levels are correlated with temperature levels.Model shows that when temperature is high, less CO2 was in the ocean. Model shows that when temperature was low, more CO2 was in the ocean.Model may not show all factors that affect Earth's temperature.
© The Concord Consortium 19

Argumentation Rubrics
Score Score description Response examplesScore 0 Blank, off-task, “I don’t know” I’m not certain.
I am pretty sure I am right.Score 1 Personal sources of
certainty/uncertaintyNot sure if wanting to talk about why it is disappearing or what they have in coming.
I didn't know what I was talking about.
Don’t entirely understand the given question.
Score 2 Mentions of “data,” “models,” “graphs,” etc. without elaboration
I looked at the model and actually did the model.
The diagram shows the CO2 increasing when it is at a high temperature.
I'm very certain that my answer was correct, it matched the results on the model.
Score 3 Scientific sources of certainty/uncertainty related to knowledge and/or data/evidence presented in the current investigation
I know that the ocean holds a lot of carbon dioxide and it would have nowhere to go but the atmosphere if the ocean couldn't hold as much.
The gizmo helped me understand that when you rise the ocean temperature the levels of dissolved CO2 decrease.
By looking at the visual model, it shows that as the temperature increases, atmospheric carbon dioxide increases, and as carbon dioxide in the atmosphere increases, the carbon dioxide in the ocean decreases.
Score 4 Scientific sources of uncertainty outside the boundaries of the current investigation, such as recognizing limitations in the data collected for the investigation, suggesting a need for more data or a need for collecting data on a new factor, complexity of scientific phenomena under study, and limitations in current conceptualization of methods addressing a scientific question featured in the argumentation task.
there are probably other factors we don’t know about influencing CO2 levels.
This is a short term experiment there could always be anomalous.
This is a prediction based on the model. The model is computer generated and there could always be a chance of error in the model.
ARG5 Vapor
© The Concord Consortium 20

Argumentation Rubrics
Module: What is the future of Earth’s climate? (HASBOT)http://authoring.concord.org/sequences/202http://authoring.concord.org/sequences/286Activity 4.4: Water vapor: a powerful greenhouse gas
Task description: Students investigate how water vapor, an additional greenhouse gas, contributes to atmospheric temperature change. Students formulate an argument exploring what will happen to the temperature when the amount of water vapor increases.
Argumentation task ID: ARG 5 (Vapor)
Part 1: Claim- Water is a greenhouse gas. What do you think will happen to the temperature when the amount of water vapor increases?
● Temperature will increase.● Temperature will decrease.● There will be no effect on temperature.
Part 2: Explanation- Explain your answer.Part 3: Certainty Rating- How certain are you about your claim based on your explanation?Part 4: Certainty Rationale- Explain what influenced your certainty rating.Explanation Scoring: ARG 5 –EXPTo receive a high score on the explanation item, students should include observations about what happens to the amount of water vapor when the temperature changes, as well as reasoning about how water vapor affects the temperature. How did you make temperature increase in this model? How did you make temperature increase in previous models? What happens to the amount of water vapor when the temperature is high? What about when the temperature is low? Some examples of valid data and valid reasoning are identified in the columns below.Valid Data(graph/model) When temperature is increased, the amount of water vapor increases.
Valid Reasoning Water vapor is a greenhouse gas.
Greenhouse gases “trap” heat (absorb and re-emit infrared radiation) in the atmosphere.
© The Concord Consortium 21

Argumentation Rubrics
Increased water vapor leads to increased numbers of clouds. Clouds can reflect sunlight, making the temperature cooler.
Increased water vapor leads to increased numbers of clouds. Clouds can trap heat in the atmosphere, keeping the temperature warmer.
Score Score description Response examplesScore 0 Blank, off-task, “I don’t know” I do not know
I took an educated guess.
I like that oneScore 1 Incorrect claim, data, and/or
reasoning, OR mentioning “data” or “knowledge” without elaboration
When it is cold outside it seems like there is more moisture in the air.
There's more of a temperature change in the water.
It shall cause an increase in air temperature but ocean temperature plummets.
Score 2 Valid claim It will be hotter and you will sweat a lot.
I think it will increase because of the temperature.
I think that the temperature will go up.Score 3 Valid association between data
and a climate outcomeWhen the water increases and its cold then the water vapor has nowhere to move apart. So if there is more water vapor then it will become warmer.
In order for water vapor to increase the temperature has to increase.
I think more water will absorb heat.The more heat the more water that is evaporated.
Score 4 Valid data On the graph it shows when you increase the temperature there is more water vapor in the air.
It will increase since on the graph the more water vapor in the air the warmer the temperature was.
Because the more water vapor you add to
© The Concord Consortium 22

Argumentation Rubrics
the model the hotter it gets.
I know when I increased the temperature, the water vapor increased, so I'm guessing it would work the same way backward.
Score 5 Valid reasoning Because the water is already cool so when it goes up into the air the clouds can deflect more radiation and cool the earth down.
Because the water vapor is a greenhouse gas it will let solar radiation in but not out.
I think that the temperature will increase because greenhouse gases cause temperature to rise and water is a greenhouse gas.
Score 6 Valid data and reasoning In the model, when infrared molecules hit the water vapor molecules, they were directed back at the ground, much like what carbon dioxide did to infrared molecules. This caused the temperature to increase when the infrared was sent back to the ground.
Again, the graph shows that if there is more water vapor, there is more heat. This is because greenhouse gases can trap heat.
Certainty Rationale Scoring: ARG 5 –UNCTo receive a high score on the certainty rationale item, students should consider how water vapor affects temperature and what causes temperature to rise in the real world (unlike how they changed temperature in this model). What can you reason about how water vapor changes the temperature? Some examples of scientific sources of uncertainty are shown below.Scientific Sources of UncertaintyWater vapor is a greenhouse gas, which increases atmospheric temperatures.Model does not allow user to change water vapor level and see the effect on temperature.Carbon dioxide is also a greenhouse gas, and the concentration of carbon dioxide in the ocean is affected by temperature.Model may not show all factors that affect Earth's temperature.Score Score description Response examplesScore 0 Blank, off-task, “I don’t know” I looked at it.
I’m not sure.Score 1 Personal sources of
certainty/uncertaintyJust think of boiling water
We have learned about greenhouse gases and their effect on the world's temperature
© The Concord Consortium 23

Argumentation Rubrics
before.
I am most likely sure because we have learned about this and i know the heat is still here because of global warming.
Score 2 Mentions of “data,” “models,” “graphs,” etc. without elaboration
Because of how it is represented in the graph, and how water vapor is made with a high temperature level.
The graph and the model says so.
The model which gave me evidence.Score 3 Scientific sources of
certainty/uncertainty related to knowledge and/or data/evidence presented in the current investigation
The model showed me that with high temps. The more vapor there is.
We learned about this in class for a while, and also if there is more stuff in the atmosphere, it will have an effect because the heat will stay trapped. The CO2 will get trapped, as shown in the model, and the CO2
will cause there to be more heat.
That is what happens when there’s a lot of CO2 in the air, and water vapor acts the same as CO2 so the effects are the same.
Score 4 Scientific sources of uncertainty outside the boundaries of the current investigation, such as recognizing limitations in the data collected for the investigation, suggesting a need for more data or a need for collecting data on a new factor, complexity of scientific phenomena under study, and limitations in current conceptualization of methods addressing a scientific question featured in the argumentation task.
We are very certain of this because of our knowledge of how water vapor works, as well as the data we managed to gather from the graphs and model. The strengths of looking at data like this is that we can see a distinct resemblance using the graph and ability to changes factors suddenly. A limitation of this is not only having to look at an abundance of graphing, but we cannot accurately predict the levels.
© The Concord Consortium 24

Argumentation Rubrics
ARG6 CombineModule: What is the future of Earth’s climate? (HASBOT)http://authoring.concord.org/sequences/202http://authoring.concord.org/sequences/286Activity 4.5: Combining the effects of carbon dioxide and water vapor
Task description: In previous models, students used an ocean temperature slider to set the temperature. While this helped students to figure out the relationships between temperature, CO2 uptake by the ocean, and the amount of water vapor in the atmosphere, it is not very realistic. This model shows all of these relationships interacting with each other. However, just as in real life, the only factor that students can control is the amount of human CO2 emissions. Students use the Human Emissions slider to change the amount of CO2 in the atmosphere. Students analyze the output graphs to see how the temperature and level of water vapor change as CO2 levels change. Students formulate an argument related to what happens to the temperature when the CO2 level increases in the model.
Argumentation task ID: ARG 6 (Combine)
Part 1: Claim- What happens to the temperature when the CO2 level increases in the model?● The temperature increases.
© The Concord Consortium 25

Argumentation Rubrics
● The temperature decreases.● The temperature stays the same.
Part 2: Explanation- Explain your answer.Part 3: Certainty Rating- How certain are you about your claim based on your explanation?Part 4: Certainty Rationale- Explain what influenced your certainty rating.Explanation Scoring: ARG 6 –EXPTo receive a high score on the explanation item, students should include observations about what happens to the temperature, amounts of carbon dioxide in the ocean and air, and water vapor level when the temperature changes. How did you make temperature increase in this model? How did the temperature affect the amount of carbon dioxide in the air? Carbon dioxide in the ocean? Water vapor? Why does changing the level of carbon dioxide emissions affect the level of water vapor, amount of carbon dioxide in the ocean, and temperature? Some examples of valid data and valid reasoning are identified in the columns below.Valid Data(graph/model) As CO2 increases, the level of water vapor increases.(graph/model) The level of water vapor increases as temperature increases.(comparison of graphs across models) The temperature increases faster with the combination of CO2 and water vapor than with CO2 alone.
Valid Reasoning Water vapor and CO2 are greenhouse gases.
Greenhouse gases “trap” heat (absorb and re-emit infrared radiation) in the atmosphere.
Temperature increases faster with CO2 and water because there is a positive feedback loop. The increase in one causes an increase in the other.
Score Score description Response examplesScore 0 Blank, off-task, “I don’t know” I took an educated guess.
I don’t knowScore 1 Incorrect claim, data, and/or
reasoning, OR mentioning “data” or “knowledge” without elaboration
Also shown on graph .
If you watch the graph it shows.
I looked at the graph.Score 2 Valid claim It [temperature] increases .
It will get warmer
I saw the temperature get hotter.Score 3 Valid association between data
and a climate outcomeLess carbon dioxide will decrease temperature.
The temp increases the CO2 levelthe temperature increases because the CO2
increased.
When the CO2 levels increase the temperature slowly goes up.
Score 4 Valid data The temperature increased quickly when more CO2 was added in the model.
© The Concord Consortium 26

Argumentation Rubrics
The first graph shows that the more CO2
there is, the more heat is conveyed. When there is less CO2, then the temperature drops.
The model shows that when the temperature rises so does the carbon and water vapor.
Score 5 Valid reasoning The more CO2, the higher the temp because CO2 molecules trap and emit heat.
The radiation gets reflected off the CO2 and cannot escape, and so the heat is trapped and the temperature rises.
CO2is a greenhouse gas and it traps in heat, the more there is, the more heat there is.
Score 6 Valid data and reasoning CO2 heats up the ocean a bit by trapping heat, then a little bit of ocean evaporates, then water vapor traps heat, then heat increases, then we all die. Worst. Domino. Affect. Ever.
The graph showed that when the CO2 went up so did the temperature. It is trapping all the heat.
As the CO2 is released, it traps in heat, creating water vapor, which traps in more heat.
Certainty Rationale Scoring: ARG 6 –UNCTo receive a high score on the certainty rationale item, students should consider the strengths and weaknesses of the model as a representation of Earth's climate system. Does the model show all of the parts of the climate system? Can you decrease the temperature in this model? Some examples of scientific sources of uncertainty are shown below.Scientific Sources of UncertaintyWater vapor and carbon dioxide are greenhouse gases, which increase atmospheric temperatures.Temperatures in the real world do not always increase.Model does not have any method to decrease the temperature.Model may not show all factors that affect Earth's temperature.Score Score description Response examplesScore 0 Blank, off-task, “I don’t know” I kind of understand.
I’m not very sure I’m making a educated guess
© The Concord Consortium 27

Argumentation Rubrics
Score 1 Personal sources of certainty/uncertainty
I sorta understand the concept. Not much.
Prior knowledge.
I said I wasn't very certain because it looked like it slightly increased but it was hard to tell.
Score 2 Mentions of “data,” “models,” “graphs,” etc. without elaboration
I watched the models
I am kinda certain because in the model they do not change.
The graph influenced my answer.Score 3 Scientific sources of
certainty/uncertainty related to knowledge and/or data/evidence presented in the current investigation
I know that greenhouse gases trap heat and add temperature to the atmosphere.
The graph on the top. It shows that the temperature will increase when the CO2 level increases.
The module tells us that it's a greenhouse gas.
Score 4 Scientific sources of uncertainty outside the boundaries of the current investigation, such as recognizing limitations in the data collected for the investigation, suggesting a need for more data or a need for collecting data on a new factor, complexity of scientific phenomena under study, and limitations in current conceptualization of methods addressing a scientific question featured in the argumentation task.
Of course there could be other variables that could be factored in, but with the graph on the computer statistics show it would increase.
I applied previously acquired knowledge to the data and information provided in this exercise to draw fairly strong conclusions. My only concern is the accuracy of the data itself; I had issues with my graphs not updating themselves when necessary.
© The Concord Consortium 28

Argumentation Rubrics
ARG7 IceModule: What is the future of Earth’s climate? (HASBOT)http://authoring.concord.org/sequences/202http://authoring.concord.org/sequences/286Activity 5.4: Arctic sea ice Task description: Students look at the graph showing the coverage of
arctic sea ice from 1979 to 2010. Before this activity step, students used models to learn about how sea ice and clouds affect global temperatures. Bringing all these ideas together, students are asked to formulate an argument about how the trend of shrinking arctic sea ice coverage might impact Earth's global temperatures.
Argumentation task ID: ARG 7 (Ice)
Part 1: Claim- How might the trend shown in the graph affect Earth’s temperature in the year 2100?
● It will increase Earth’s temperature.● It will decrease Earth’s temperature.● There will be no effect on Earth’s temperature.
Part 2: Explanation- Explain your answer.Part 3: Certainty Rating- How certain are you about your claim based on your explanation?Part 4: Certainty Rationale- Explain what influenced your certainty rating.Explanation Scoring: ARG 7 –EXPTo receive a high score on the explanation item, students should include observations about the extent of ice from 1979 to 2010, as well as reasoning about how the change in ice affects the temperature.What happened to the ice extent between 1979 and 2010? How does ice affect temperature?(Note that this is not the same as temperature affecting ice!) Some examples of valid data and valid reasoning are identified in the columns below.Valid Data Valid Reasoning
© The Concord Consortium 29

Argumentation Rubrics
(graph) The amount of sea ice is shrinking over time.(graph) The amount of sea ice varies by year, although the overall trend is for decreased sea ice coverage. The sunlight hitting the surface will be more likely to be absorbed than reflected since the surface will be darker.The albedo of Earth decreases as sea ice melts. (High albedo is most reflective.) Sea ice is lighter-colored than the sea surface. The sea surface is darker-colored than the sea ice
More solar radiation is reflected off a lighter colored surface than a darker-colored surface.
The sunlight hitting the surface will be more likely to be absorbed than reflected since the surface will be darker.
More absorption of sunlight leads to more absorption of heat. More heat leads to increased temperatures.
Score Score description Response examplesScore 0 Blank, off-task, “I don’t
know”I took an educated guess.
I don’t know
It just will.Score 1 Incorrect claim, data, and/or
reasoning, OR mentioning “data” or “knowledge” without elaboration
If the sun is hot enough to melt the ice then the sun is really hot.
The graph shows a steady decrease.
Because it the graph is going at a rate where it will just keep going down
Score 2 Valid claim Temperature will increase.
I think the temperature will increase because the graph shows a constant increase over the period of time presented.
Each year the earth's temperature increases.Score 3 Valid association between
data and a climate outcomeThe amount of ice affects earth's temperature and if there isn't as much ice the temperature will increase.
The more the polar caps melt, the more the sea will rise. The more the sea rises, the more the temperature will decrease. The temperature will decrease because the precipitation from the ocean will create more clouds so the atmosphere will have more cloud coverage therefore, decreasing the temperature.
With the ice falling then the temp. should rise and then by that the time of 2100 all or most all ice
© The Concord Consortium 30
Argumentation Rubrics
will be goneScore 4 Valid data It will increase earth's temperature because it
already shows the seas ice going down, that means it is warmer up and melting
This is because overall decrease in the amount of ice in the arctic, meaning that there is an increase in temperature.
Based on the graph, in the year 2100 there will not be any ice to reflect heat out of the atmosphere.
Score 5 Valid reasoning Well with the ice not covering as much as it used to the energy packets are not being reflected as much and the temperature will then go up.
If there is less glacial coverage then there would be less light reflected by the ice.
When the ice melts there will be no way for the earth to reflect all of the radiation and heat from the sun causing the planet to warm up.
Score 6 Valid data and reasoning If there is less ice coverage, then more energy will be absorbed and re-radiated into Earth’s atmosphere. The graph is showing a drop in ice coverage so there will be more energy absorbed.
Over the years, the temperature has generally gone up because of the decrease in content that will reflect heat/radiation. (ice)
If the trend continues, there will be much less ice, meaning that less sunlight will be reflected. This causes a positive feedback loop causing more ice to melt. Eventually, there will be no ice, and much more sunlight will be absorbed, increasing temperature dramatically.
Certainty Rationale Scoring: ARG 7 –UNC
© The Concord Consortium 31

Argumentation Rubrics
To receive a high score on the certainty rationale item, students should consider the strength of the evidence presented as well as the representativeness of the data. Is there a consistent trend in the ice extent? What could the variations mean? What factors could change the ice extent by 2100? Some examples of scientific sources of uncertainty are shown below.Scientific Sources of UncertaintyThe trend in sea ice coverage has lots of variations.Sea ice extent is affected by many factors, some of which might change before 2100.This graph shows only the extent of Arctic sea ice. Other sea ice may not have the same trend.Human actions, which affected the sea ice level from 1979 to 2010, may change before 2100.The graph only shows the extent of the ice, but not the depth. The depth of the ice is important for knowing how much ice there is overall.The measurements of sea ice were taken in July of each year. It could be important to measure the amount of ice monthly rather than taking only an annual measurement.Score Score description Response examplesScore 0 Blank, off-task, “I don’t know” I am sure.
I’m not that certain.Score 1 Personal sources of
certainty/uncertaintyBecause we saw in a model the more ice there is the hotter the temp is and if the ice keeps falling the temperature will keep flying higher.
I also think that it might not have an effect because global warming is already so bad and people are saying that even if we did find a way to help it wouldn't actually have a real effect on the process.
No one is perfect.Score 2 Mentions of “data,” “models,”
“graphs,” etc. without elaborationThe graph.
The graph made me think that the would keep going down and I thought I was right.
The graph showed a visible decrease.Score 3 Scientific sources of
certainty/uncertainty related to knowledge and/or data/evidence presented in the current investigation
Ice is a good reflective surface. Without it the heat will be absorbed and the temp will go up
We learned about it in a science video. I guessed about the "ice is cold" part but I know that ice reflects the sun's rays that would dramatically increase the earth's I am very certain because in the graph the ice coverage goes down and if that trend keeps on going like I said then there will be absolutely no ice in the year 2100.
© The Concord Consortium 32

Argumentation Rubrics
The ice definitely reflects heat and cools the earth down.
Score 4 Scientific sources of uncertainty outside the boundaries of the current investigation, such as recognizing limitations in the data collected for the investigation, suggesting a need for more data or a need for collecting data on a new factor, complexity of scientific phenomena under study, and limitations in current conceptualization of methods addressing a scientific question featured in the argumentation task.
What influenced me is that the ocean will warm up and cause warmer temperatures around the tropics. What made me doubt it is how the warm water will warm up and go up into the atmosphere and cause clouds.
I chose a four because the graph may not include small natural disasters that may have occurred.
Some natural force could affect the climate.
© The Concord Consortium 33

Argumentation Rubrics
ARG8 (Human)
Module: What is the future of Earth’s climate? (HASBOT)http://authoring.concord.org/sequences/202http://authoring.concord.org/sequences/286Activity 6.6: How much reduction?
Task description: As a final activity, students are asked to manipulate the model to formulate an argument related to the question, "How much did you need to change the human emissions to reduce the average global temperature in the model?”
Argumentation task ID: ARG 8 (Human)
Part 1: Claim- How much did you need to change the human emissions to reduce the average global temperature in the model?
● 0-25% of 2010 emissions● 25-50% of 2010 emissions● 50-75% of 2010 emissions● 100% of 2010 emissions (to zero human emissions)
Part 2: Explanation- Explain your answer.Part 3: Certainty Rating- How certain are you about your claim based on your explanation?Part 4: Certainty Rationale- Explain what influenced your certainty rating.Explanation Scoring: ARG 8 –EXPTo receive a high score on the explanation item, students should include observations about what they did to reduce the temperature in the model, as well as reasoning about why those changes changed the temperature. What happened to the amount of carbon dioxide in the air? Carbon dioxide in the ocean? Water vapor? What happened to the ice extent in the model? How do each of these factors affect the temperature? Some examples of valid data and valid reasoning are identified in the columns below.Valid Data Valid Reasoning
© The Concord Consortium 34

Argumentation Rubrics
(model) Descriptions of how students manipulated the model to decrease temperature(graph) Decreases in CO2 led to decreases in temperature (temperature graph).(graph) Decreases in temperature led to less water vapor (Greenhouse Gas Concentration graph).(graph) Decreased temperatures led to more CO2 dissolved in the ocean (Greenhouse Gas Concentration graph).(model) Small changes in human emissions do not change the temperature very much.(model/graph) Decreasing human emissions leads to less CO2 in the atmosphere.(model) As temperature decreases, the ice extent increases.(model) As temperature decreases, the number of clouds decreases.
CO2 is a greenhouse gas.
Greenhouse gases “trap” heat (absorb and re-emit infrared radiation) in Earth's atmosphere.
When there are fewer human emissions, the level of CO2
in the ocean can increase because the temperature is lower.
When there are fewer human emissions, the level of water vapor decreases because the temperature is lower.
More ice leads to more reflection of solar radiation, making the temperature lower.
Clouds can either warm or cool the atmospheric temperature. Solar radiation can reflect off of the clouds, preventing absorption of heat. Or infrared radiation can be “trapped” by the clouds, keeping heat in the atmosphere.
Score Score description Response examplesScore 0 Blank, off-task, “I don’t know” I took an educated guess.
I did not get to do an explanation because I did not understand the word emissions.
Score 1 Incorrect claim, data, and/or reasoning, OR mentioning “data” or “knowledge” without elaboration
The human-emission.
I think that if half of the humans were not here then there would not be anymore global warming.
They can cause a temperature decline because of body heat?
Score 2 Valid claim That the earth is used to having a warmer climate so it declines
Because the earth warms and cooled on its own.
If you have 25% human emissions the temperature will reduce.
Score 3 Valid association between data and a climate outcome
Having more CO2 in the air will cause it to be warmer, having less CO2in the air will cause it to be cooler.
All of the CO2 emissions are causing a rise in
© The Concord Consortium 35

Argumentation Rubrics
temperature.
If humans stop emitting so much gases, and heat into the air the temperature declines. Car pooling and burning less fossil fuels would emit much less and help the climate stop increasing.
Score 4 Valid data I experimented with starting temperatures of 11 and 26 degrees Celsius. I noticed that the lower the starting temperature, the harder and slower it is to affect the temperature with human emission. Most significant change didn't come up until I had human emission at 100% higher than 2010.
Humans can reduce car, factory, and other emissions then is will cause less carbon to be in the atmosphere and a cooler worldwide temperature.
As you increase the human emissions more greenhouse gases form and make the temperature increase all the way.
Score 5 Valid reasoning Less greenhouse gases trapping heat and energy in the atmosphere
It makes the atmosphere colder which causes ice to form which has a high albedo
The cloud cover or ice cover in different regions would affect the temperature. It would take a lot more reduction in these regions to even further cool the temperature. Also, the type and altitude of the clouds would affect how much reflection or infrared radiation it would trap.
Score 6 Valid data and reasoning When we raised human emission the CO2 level went up, then the heat in the earth went up. And once those greenhouse gasses are emitted into the air, the bounce off of the atmosphere cause the earth to get hotter and hotter. The solar rays also come down from the atmosphere and when they hit the ocean water turn into more heat.
Less water vapor is evaporated into the atmosphere as the water temperature
© The Concord Consortium 36

Argumentation Rubrics
doesn't rise. More carbon dioxide can be dissolved into the ocean, leading to still lower greenhouse gas concentrations. As the temperature drops, more ice forms, which reflects solar radiation, leading to less heating of the atmosphere.
The reduction would result in less greenhouse gases so the temperature won't be warming, but it would be cooling. Also, there will be less evaporation, so there will be less clouds to hold in the heat.
Certainty Rationale Scoring: ARG 8 –UNCTo receive a high score on the certainty rationale item, students should consider the strengths and weaknesses of the model as a representation of Earth's climate system. Does the model show all of the factors that affect the temperature? What additional factors do you think would help to improve the model's predictive ability? Some examples of scientific sources of uncertainty are shown below.Scientific Sources of UncertaintyModel may not show all natural factors that affect Earth's temperature. Climate models are complex.Model may not accurately show what level of human emissions needs to be to reduce temperature.There are human emissions other than CO2 that affect temperature.Score Score description Response examplesScore 0 Blank, off-task, “I don’t know” I had no idea.
I’m not that certain.
I am not very sure about my answer.Score 1 Personal sources of
certainty/uncertaintyI’ve learned that all these factors make the planet's climate hotter.
The whole program has told us this.
Just hearing about all that stuff and the news and my parents talking had me thinking that we are ruining the earth and that it's our fault that this is happening, so i'm pretty positive.
Score 2 Mentions of “data,” “models,” “graphs,” etc. without elaboration
I am not sure about the multiple choice answer, but i am certain, about being able so see a noticeable change in the chart when emission is reduced greatly.
The graph and model show that is what should happen.
© The Concord Consortium 37

Argumentation Rubrics
I’m fairly certain because in the model the less human population in the area caused it to cool down.
Score 3 Scientific sources of certainty/uncertainty related to knowledge and/or data/evidence presented in the current investigation
Because the CO2 reflects infrared radiation and sends it back to the ground.
I am very certain because I thought that when you have a lower temperature then you don't have as much water to vapor.
Because the graph showed a decrease in the temperature when the human emissions were reduced to 100%.
Score 4 Scientific sources of uncertainty outside the boundaries of the current investigation, such as recognizing limitations in the data collected for the investigation, suggesting a need for more data or a need for collecting data on a new factor, complexity of scientific phenomena under study, and limitations in current conceptualization of methods addressing a scientific question featured in the argumentation task.
Because there are a great number of variables that need to be accounted for and I don't know if I got all of them.
I think that it is common sense that if you take away what’s making the temp higher than it should go down. Unless some other variable changes the temperature.
There are too many unpredictable factors to consider, such as human and worldwide cooperation.
© The Concord Consortium 38

Argumentation Rubrics
ARG1 (Trap)Module: Will there be enough fresh water? (HASBOT) http://authoring.concord.org/sequences/171http://authoring.concord.org/sequences/285Activity 2.3: Where does water go?
Task description: Students follow individual water droplets as precipitation falls to the ground and water droplets move through the layers of rocks/sediments. If the students run the model long enough, they will see that a water droplet can be evaporated from the surface.
Argumentation task ID: ARG 1 (Trap)
Part 1: Claim- When water is absorbed by the ground, is it trapped in the ground?● Yes● No
Part 2: Explanation- Explain your answer.Part 3: Certainty Rating- How certain are you about your claim based on your explanation?Part 4: Certainty Rationale- Explain what influenced your certainty rating.Explanation Scoring: ARG 1 –EXPTo receive a high score on the explanation item, students should include what they observed about the water droplets in the model. How do the water droplets move into (and out of) the ground layers? Some examples of valid data and valid reasoning are identified in the columns below.Valid Data(model) Water droplets fall and soak into the ground.(model) Water droplets move through the ground.(model) Water droplets cannot penetrate the black layer.(model) Water droplets collect above the black layer.(model) Water droplets on the surface (in
Valid ReasoningWater cycles through the Earth system, sometimes slowly.
Water table can move up, bringing water to the surface.
Water moves in the ground due to porosity/permeability of sediments.
Water can go back to the atmosphere through
© The Concord Consortium 39

Argumentation Rubrics
pools) evaporate into the air. evaporation.
Humans can get water out of the ground through wells.
Plants pull water out of the ground as they grow.Score Score description Response examplesScore 0 Blank, off-task, “I don’t know” I made an educated guess.Score 1 Incorrect claim, data, and/or
reasoning, OR mentioning “data” or “knowledge” without elaboration
It is shown in the diagram.
Because that is what the model shows.
Yes, when the water is absorbed into the ground it becomes stuck there.
Score 2 Valid claim Water moves on after a while, it is not trapped there forever.
The animation says it is trapped.
Because water can move.Score 3 Valid association between data
and water movementWater can be evaporated from the ground.
Evaporation takes place so its not trapped.
It can still evaporate out of the ground.Score 4 Valid data The water droplets stay in the ground, which
is clearly shown by the diagram, in that all of the droplets are trapped.
It seems like it is because all the water is just traveling down not even looking like it is going to evaporate, it just stays there trapped.
It soaks down deeper into the groundScore 5 Valid reasoning Water can be soaked up by plants and then
transpiration will soak water back up into the sky to make clouds.
It is subject to evaporation depending on how far down it goes, and it can also travel through ground flow into rivers, lakes, and streams.
It cant evaporate because it is trapped beneath layers of rock
Score 6 Valid data and reasoning Yes they all go into the ground, but eventually they all turn into water vapor. (It
© The Concord Consortium 40

Argumentation Rubrics
could take a long time though.)
The ground can only absorb so much water. Once it takes all it can, the rain will stay on the surface where it lands and eventually evaporates.. The water absorbed goes to plants, which is also cycled back into the cycle.
The water can be absorbed into the ground, but it can also be released back into the atmosphere, as shown by the green dots by transpiration. Transpiration occurs from plants and trees releasing the water back into the atmosphere.
Certainty Rationale Scoring: ARG 1 –UNCTo receive a high score on the certainty rationale item, students should note both the strengths and weaknesses of the model as a representation of groundwater flow. How many ways can water leave the ground? Are they all represented in the model? Some examples of scientific sources of uncertainty are shown below.Scientific Sources of UncertaintyModel does not show rivers and oceans that can carry water to surface.Model does not show plants which can extract water from underground.Humans can get water out of the ground by drilling wells.Score Score description Response examplesScore 0 Blank, off-task, “I don’t know” I kinda figured it out
I don’t know.Score 1 Personal sources of
certainty/uncertaintyI read about this yesterday.
I am familiar with the water cycle, but don't feel certain enough to mark 'very certain'.
We read it in the book.Score 2 Mentions of “data,” “models,”
“graphs,” etc. without elaborationThe graph clearly, obviously, and very blankly shows this idea.
There’s a model.
Previous knowledge and the animation. Score 3 Scientific sources of
certainty/uncertainty related to knowledge and/or data/evidence presented in the current investigation
Well after it rains there’s always water on the ground, but after a while everything gets dry again. so, it is either still in the ground where we cant see or it has turned into vapor
Well since in the picture it has the water
© The Concord Consortium 41

Argumentation Rubrics
looking like it's stuck in the ground I'm sort of certain that the water does stay stuck in the ground.
Water can be evaporated from the groundScore 4 Scientific sources of uncertainty
outside the boundaries of the current investigation, such as recognizing limitations in the data collected for the investigation, suggesting a need for more data or a need for collecting data on a new factor, complexity of scientific phenomena under study, and limitations in current conceptualization of methods addressing a scientific question featured in the argumentation task.
From what I can see in the video above, the water is steadily rising, and it looks to me like it will eventually overflow and resurface. This would mean it wouldn't be trapped in the ground.
It may depend on the type of ground
We are somewhat certain about our answer because, we are not positive if the water can be evaporated after being absorbed into the ground.
© The Concord Consortium 42

Argumentation Rubrics
ARG2 (Bedrock)
Module: Will there be enough fresh water? (HASBOT) http://authoring.concord.org/sequences/171http://authoring.concord.org/sequences/285Activity 4.4: Bedrock Task description: Students look at two representations of bedrock.
The first picture shows a close-up view of bedrock. It shows no space between grains. The second picture shows water pooling above the bedrock layer. Students are asked to analyze the pictures to predict the likely porosity and permeability of bedrock.
Argumentation task ID: ARG 2 (Bedrock)
Part 1: Claim- According to the pictures, what is the likely porosity and permeability of bedrock?● High porosity and high permeability● High porosity and low permeability● Low porosity and high permeability● Low porosity and low permeability
Part 2: Explanation- Explain your answer.Part 3: Certainty Rating- How certain are you about your claim based on your explanation?Part 4: Certainty Rationale- Explain what influenced your certainty rating.Explanation Scoring: ARG 2 –EXPTo receive a high score on the explanation item, students should include observations about the properties of bedrock and apparent behavior of water at the bedrock layer, as well as reasoning about why the water behaves that way. What does porosity have to do with how water moves through a layer? What does permeability have to do with how water moves through a layer? Some examples of valid data and valid reasoning are identified in the columns below.Valid Data(picture A) There appears to be no space
Valid Reasoning Water cannot go through a substance when there are no
© The Concord Consortium 43

Argumentation Rubrics
between particles in bedrock.(picture B) The bedrock doesn't appear to let any water pass through it.
spaces between its particles.
There is low permeability when there is low porosity.Score Score description Response examplesScore 0 Blank, off-task, “I don’t know” I made an educated guess.
I don't really know.Score 1 Incorrect claim, data, and/or
reasoning, OR mentioning “data” or “knowledge” without elaboration
Because the pictures above show that the higher the porosity the lower the permeability.
The picture compared to the diagram above gave me the correct answer.
Based on the picture.Score 2 Valid claim It seems very low in porosity and
permeability just based on the looks of the picture.
Score 3 Valid association between data and water movement
Bedrock looks solid and I don’t think anything can flow through it.
because the sediments are closed in.
Bed rock is solidScore 4 Valid data According to the picture, Bedrock looks like
there is no space for water.
It is very close and small particles making it more difficult to move through,
There’s no spaces in between the sediments.
Score 5 Valid reasoning Bedrock most likely is a sediment that doesn't allow any water through. Therefore, it must be neither permeable nor porous.
It is solid and doesn’t let water run through it
It will let little to no water through over a long time!
Score 6 Valid data and reasoning The particles are closer together so the water is unable to pass through quickly.
It's a lot like clay. The particles are so close together that it will take a while to get through the bedrock so the flow is slow. This
© The Concord Consortium 44
Argumentation Rubrics
means there is a low permeability.
It looks solid as if no water can get through.
Not much space for water and water can't get through.
Certainty Rationale Scoring: ARG 2 –UNCTo receive a high score on the certainty rationale item, students should consider the strength of the evidence presented as well as the representativeness of the data. Is the picture a good representation of all bedrock? What could happen to bedrock that would allow water to flow through it? Some examples of scientific sources of uncertainty are shown below.Scientific Sources of UncertaintyThe sample in Picture A might not be representative of all bedrock.Rocks can have cracks that let water flow through them.The picture of the model (Picture B) might not have run long enough to let water through thebedrock level.Score Score description Response examplesScore 0 Blank, off-task, “I don’t know” I am not positive about my answer.
I am pretty sure I got the answer but I am not positive.
Score 1 Personal sources of certainty/uncertainty
Based information I've learned
The information given wasn’t enough to prove a certain answer.
Score 2 Mentions of “data,” “models,” “graphs,” etc. without elaboration
My certainty is influenced by interpretation of the image.
Based on the picture, I could tell that bedrock has a low porosity, but since it only showed one rock, not multiple sediments, it was hard to tell the permeability.
The solidity of bedrockScore 3 Scientific sources of
certainty/uncertainty related to knowledge and/or data/evidence presented in the current investigation
I feel very confident that bedrock does not allow water to pass through.
It doesn't look like there's any space in between the minerals. I'm certain since the picture portrayed is the level of sediment and rock layers as the lowest point. The picture shows the water sit on top of the bedrock not sinking through so I'm sure that water cant go further down.
© The Concord Consortium 45

Argumentation Rubrics
Score 4 Scientific sources of uncertainty outside the boundaries of the current investigation, such as recognizing limitations in the data collected for the investigation, suggesting a need for more data or a need for collecting data on a new factor, complexity of scientific phenomena under study, and limitations in current conceptualization of methods addressing a scientific question featured in the argumentation task.
There might be a crack in the rock. Where water can flow slowly but it is still flowing.
it does look solid but the picture could be inaccurate.
I know the answer for sure that when a sediment/rock is not porous, that water will not go through them. There are limitations to these pictures of this bedrock because it is not physically seen or under a microscope to see the holes.
© The Concord Consortium 46

Argumentation Rubrics
ARG3 (Pumice)
Module: Will there be enough fresh water? (HASBOT) http://authoring.concord.org/sequences/171http://authoring.concord.org/sequences/285Activity 4.5: Floating rocks Task description: Students look at two photographs of pumice. The
first photo shows that pumice has many holes. The second shows pumice floating in water. Students are asked to use these pictures to predict the likely porosity and permeability of pumice.
Argumentation task ID: ARG 3 (Pumice)
Part 1: Claim- What is the likely porosity and permeability of pumice?● High porosity and high permeability● High porosity and low permeability● Low porosity and high permeability● Low porosity and low permeability
Part 2: Explanation- Explain your answer.Part 3: Certainty Rating- How certain are you about your claim based on your explanation?Part 4: Certainty Rationale- Explain what influenced your certainty rating.Explanation Scoring: ARG 3 –EXPTo receive a high score on the explanation item, students should include observations about the structure of pumice and how water interacts with it, as well as reasoning about why the water behavesthat way. What do students observe about the pumice? What properties might pumice havethat causes it to float? Some examples of valid data and valid reasoning are identified in the columns below.Valid Data(photograph 1) There are a lot of holes in the pumice.
(photograph 2) The pumice is floating in the water in the glass.
(text) The rock will continue to float for hours.
Valid ReasoningThe pumice has high porosity because there are a lot of holes.
The rock must be less dense than water since it is floating. This must mean that air is trapped in the holes
The holes must not be connected to each other because
© The Concord Consortium 47

Argumentation Rubrics
water isn't flowing through to sink the rock. That means it has low permeability.
Score Score description Response examplesScore 0 Blank, off-task, “I don’t know” I made an educated guess.
It just seems more likely it would be.Score 1 Incorrect claim, data, and/or
reasoning, OR mentioning “data” or “knowledge” without elaboration
The rocks has no pore space meaning there is no permeability.
I was very confused by the image and how to tell the qualities of it.
The stone is allowing water to flow through it and very quickly.
Score 2 Valid claim Pumice is porous
pumice is very porous but has a low permeability
Score 3 Valid association between data and water movement
Because it is a light thing
Because of the depth of the water to the thing in the water.
Score 4 Valid data The rock and float so it must have a low permeability and high porosity.
If this type of rocks had high porosity then it would not be floating, its would have sunk. If you don’t have a lot porosity then you don’t have a lot of permeability either.
It was floating so water can get into the rock.
Score 5 Valid reasoning If there’s low porosity the water will slowly go through the rock and if there’s low permeability the water will not go through the rock as fast.
Water cant penetrate through it.
Water isn’t going to go through.Score 6 Valid data and reasoning Well the pumice is floating on the water so
the water probably did not have a lot of access inside the pumice to weigh it down and (it must have high permeability so the water can pass through it easily and not stay in the pumice to weigh it down).
© The Concord Consortium 48

Argumentation Rubrics
Because the rock id floating, that means it is light and most likely has air inside of it. But because of the low permeability, the water does not go into the rock easily causing it not to sink.
If the pumice had high porosity it would sink. If it had high permeability it would allow water to pass through making it sink.
Certainty Rationale Scoring: ARG 3 –UNCTo receive a high score on the certainty rationale item, students should consider the strength of the evidence presented as well as the representativeness of the data. Is the picture a good representation of all pumice? What experiment could you do with the pumice that would allow you to definitively determine its permeability and porosity? Some examples of scientific sources of uncertainty are shown below.Scientific Sources of UncertaintyThis may not be a representative sample of pumice.There may be some connection of the holes in the pumice, but not enough to sink the rock immediately.The statement that the rock will continue floating for hours is not supported by the photographic evidence.Score Score description Response examplesScore 0 Blank, off-task, “I don’t know” I know I’m right.
I’m certain about my explanation.Score 1 Personal sources of
certainty/uncertaintySince porosity is the determination of how well water can go through a substance and permeability is how long water can go through it I use that to my advantage to have a certainty of 4.
I used what was learned from the last couple pages and applied it to pumice's appearance.
Previous knowledge.Score 2 Mentions of “data,” “models,”
“graphs,” etc. without elaborationI have some background knowledge and the previous models have helped.
we saw the picture.
Looking at the amount of holes in the pumice.
Score 3 Scientific sources of certainty/uncertainty related to knowledge and/or data/evidence presented in the current
I'm certain that porosity is directly correlated with the buoyancy of an object, while permeability is whether it absorbs water or not.
© The Concord Consortium 49

Argumentation Rubrics
investigationThe reason is because there is no water in the rock and it is not at the bottom
If it were more permeable then the rock would be at the bottom and not floating.
Score 4 Scientific sources of uncertainty outside the boundaries of the current investigation, such as recognizing limitations in the data collected for the investigation, suggesting a need for more data or a need for collecting data on a new factor, complexity of scientific phenomena under study, and limitations in current conceptualization of methods addressing a scientific question featured in the argumentation task.
We do not know how long the rock has been in the water so it could be like a sponge.
I am not sure if just because pumice has pores, it is permeable. The pores may only be on the exterior, which would not allow water to flow all the way through.
There is a possibility that many of the dark craters in the rock are not actually holes, and we do not know how many holes a rock has to have to be considered porous.
© The Concord Consortium 50

Argumentation Rubrics
ARG4 Aquifer
Module: Will there be enough fresh water? (HASBOT) http://authoring.concord.org/sequences/171http://authoring.concord.org/sequences/285Activity 4.9: Confined and unconfined aquifers
Task description: Students use a model to investigate the recharge in unconfined and confined aquifers. Students add wells and change the rate of precipitation. Students formulate an argument about which type of aquifer is a sustainable source of water.
Argumentation task ID: ARG 4 (Aquifer)
Part 1: Claim- Which type of aquifer could potentially provide a sustainable source of water (a water source that will not run out and will consistently supply usable amounts of water)?
● Confined aquifer● Unconfined aquifer
Part 2: Explanation- Explain your answer.Part 3: Certainty Rating- How certain are you about your claim based on your explanation?Part 4: Certainty Rationale- Explain what influenced your certainty rating.Explanation Scoring: ARG 4 –EXPTo receive a high score on the explanation item, students should include observations about the water remaining in each aquifer after adding wells to each, as well as the characteristics that define confined and unconfined aquifers. What happens to the water level in each aquifer as wells pump the water out? Which aquifer is getting recharged by precipitation? Some examples of valid data and valid reasoning are identified in the columns below.Valid Data(model) The top (unconfined) aquifer recharges through precipitation when a well is present.(model) The lower (confined) aquifer water level drops when a well is present. It does
Valid Reasoning: Confined aquifers are not recharged because they have impermeable sediments above them. The impermeable sediments don't let precipitation through to refill the aquifers.
© The Concord Consortium 51

Argumentation Rubrics
not get refilled by precipitation.
Confined aquifers are not recharged by precipitation. Unconfined aquifers are recharged by precipitation.
Unconfined aquifers are recharged because they have permeable sediments above them. The permeable sediments let precipitation through to refill the aquifers.
Score Score description Response examplesScore 0 Blank, off-task, “I don’t know” I have no idea.Score 1 Incorrect claim, data, and/or
reasoning, OR mentioning “data” or “knowledge” without elaboration
It gave us the definition.
if its got water its sustainable for people to drink
It is confined by it being under ground.Score 2 Valid claim we willl always have water
Because there tends to be more supplied water.
I think more water can somehow end up there
Score 3 Valid association between data and water movement
they can flow freely an gain rain fall
The rain water can keep refilling it.
The aquifer can always get more waterScore 4 Valid data If you drill into a confined aquifer,
eventually, the water will run out. This is because no other water can get into the aquifer.
Unconfined constantly is supplied by rainfall so it will never run out.
The confined aquifers may not get as much water as quickly, but it will keep water if there is not much rain.
Score 5 Valid reasoning Because there is a layer with high permeability and the water can flow through quickly.
Unconfined can be refilled with rain but confined can not.
The layer containing the water has no impermeable top layer, so surface water can refill (or recharge) the aquifer.
© The Concord Consortium 52

Argumentation Rubrics
Score 6 Valid data and reasoning Unconfined aquifers can be filled up quickly with rain water, and can be constantly replenished because the layer of water on top of them is permeable and the layer below them in impermeable so the water sits there.
An unconfined aquifer can be replenished with water, because its soil is more permeable.
As the water is pumped up by the well, it is replenished by rainfall. Unconfined aquifers don't have an impermeable layer of material covering them; therefore, the precipitation affects the water amount.
Certainty Rationale Scoring: ARG 4 –UNCTo receive a high score on the certainty rationale item, students should consider the definition of confined and unconfined aquifers, as well as the model's representation of the aquifers. Is the model a perfect representation of confined and unconfined aquifers? What could happen to a confined aquifer that would make it more easily recharged? Some examples of scientific sources of uncertainty are shown below.Scientific Sources of UncertaintyThere could be cracks in the impermeable confining layer allowing the confined aquifers to be recharged. The unconfined aquifer could flow into a stream which would take away a large amount of water. The withdrawals of water might be greater than what can be supplied through precipitation, making both types of aquifers unsustainable in the long run. The unconfined aquifer might still take a long time to recharge if it is very deep and the water has to travel a great distance from the surface to the aquifer. The model does not cover all of the possibilities of aquifers and geological formations around them. This includes cracks, faults, and other mechanisms for changing the overall permeability of the overlying layers.Score Score description Response examplesScore 0 Blank, off-task, “I don’t know” I’m not certain.
I am pretty sure I am right.Score 1 Personal sources of
certainty/uncertaintyBecause we talked about this in class the other day.
Because the water would be refilling its self.
There is nothing to stop the rainfall.Score 2 Mentions of “data,” “models,”
“graphs,” etc. without elaborationThe graph.
The diagram above
© The Concord Consortium 53

Argumentation Rubrics
The model influenced my certaintyScore 3 Scientific sources of
certainty/uncertainty related to knowledge and/or data/evidence presented in the current investigation
If the permeability is low it will take longer time for the water to get through.
The confined aquifer is isolated so if we were to drill into it the water would eventually run out.
after doing the model it shows the confined layer does not give efficient water from its aquifer
Score 4 Scientific sources of uncertainty outside the boundaries of the current investigation, such as recognizing limitations in the data collected for the investigation, suggesting a need for more data or a need for collecting data on a new factor, complexity of scientific phenomena under study, and limitations in current conceptualization of methods addressing a scientific question featured in the argumentation task.
The unconfined aquifers might not be a good idea to use because they might be in dry and hot areas and would not be usable in the summer.
If humans take water at a rate at which unconfined aquifers are not able to recharge, then it will not supply consistent amounts of usable water.
Chose this rating because I believe that rainfall can hit these kinds of aquifers. But, if rainfall is able to reach a confined aquifer then it might have enough water too.
© The Concord Consortium 54

Argumentation Rubrics
ARG5 Vernal
Module: Will there be enough fresh water? (HASBOT) http://authoring.concord.org/sequences/171http://authoring.concord.org/sequences/285Activity 5.3: Vernal pools Task description: Students look at pictures of a low-lying area in a
New England forest. The pictures show water present in the winter (as ice) and in the spring (as a pool), but no water is visible in the summer picture. Students are asked to determine what happened to the water table in this area between spring and summer.
Argumentation task ID: ARG 5 (Vernal)
Part 1: Claim- What likely happened to the level of the water table between spring and summer?● The water table fell between spring and summer.● The water table rose between spring and summer.
Part 2: Explanation- Explain your answer.Part 3: Certainty Rating- How certain are you about your claim based on your explanation?Part 4: Certainty Rationale- Explain what influenced your certainty rating.Explanation Scoring: ARG 5 –EXPTo receive a high score on the explanation item, students should include observations about the level of water in each season. How do seasonal changes (precipitation, temperature, plant growth) affect the amount of water present on the surface in each season? Some examples of valid data and valid reasoning are identified in the columns below.Valid Data(photographs) There is more water in the winter, a little less in the spring, and practically none in the summer.(photographs) There are plants growing in the summer.
Valid Reasoning: There is more water in the winter and spring because: • precipitation and snowmelt combine to put water on the surface • less water is used by plants • frozen water stays on the surface• the ground is frozen which doesn't allow water to penetrate
There is less water in the summer because: • more water is used by growing plants • water moves underground away from the pool
© The Concord Consortium 55

Argumentation Rubrics
As the water table falls, less water is on the surface.Score Score description Response examplesScore 0 Blank, off-task, “I don’t know” I do not know
I took an educated guess.
I like that oneScore 1 Incorrect claim, data, and/or
reasoning, OR mentioning “data” or “knowledge” without elaboration
In the two graphs it explains how the arrows turn differently by the seasons changing,
Less water in spring
The ground sunkScore 2 Valid claim It looks like in the pictures the water fell
tremendously between the two.
The waters gone
The water table goes down between spring and summer.
Score 3 Valid association between data and water movement
The pond water recharges the ground water
The summer picture is more greener so it got more water
there is less surface water seen, and probably more ground water beneath the surface.
Score 4 Valid data Because in the spring, there was water all over the ground. Then in the summer it is dry. So therefore the water went down.
Their is less water during summer, so the water table must have fallen
The amount of water dried up in the summer.
Score 5 Valid reasoning Since the groundwater moved out of the surface water body between spring and summer, the water table started to become low.
The water table fell because there is not as much rain in the summer.
Because the ground absorbed the water in the second picture (biota)
© The Concord Consortium 56
Argumentation Rubrics
Score 6 Valid data and reasoning To have that much water up (on the left), you need a higher water table, so the groundwater can feed that area. So, since it's lower on the right, it only makes sense that the water table decreased. It also may be that the water evaporated... they are by lots of trees and it's summer.
The picture from the summer looks like the water has dried up, which means the water table fell between spring and summer and the water began to move out from the surface.
The water table fell between spring and summer because of the hot temperatures and evaporation. The high evaporations and temperatures cause the water to go into the air so there is not a lot of water on the surface.
Certainty Rationale Scoring: ARG 5 –UNCTo receive a high score on the certainty rationale item, students should consider the strength of the evidence presented as well as the representativeness of the data. What factors affect the level of water on the surface on any given day? Some examples of scientific sources of uncertainty are shown below.Scientific Sources of UncertaintyThe pictures may not be representative of all winter/spring/summer conditions. The temperature of the seasons may affect the amount of water on the surface. The summer picture may have been taken after an extended dry period. If it had been taken after a rainstorm, there might not be any difference in water level between the seasons.Score Score description Response examplesScore 0 Blank, off-task, “I don’t know” I looked at it.
I’m not sure.Score 1 Personal sources of
certainty/uncertaintyWe are not very certain because we don't understand what is being asked. We tried to use the resources we were given, but are not sure if we have fully
There's probably some evidence that I didn't catch when I solved this.
I very positive b/c I comprehend the concept.
Score 2 Mentions of “data,” “models,” “graphs,” etc. without elaboration
Look at the pictures
The pictures in question 6 and prior
© The Concord Consortium 57

Argumentation Rubrics
information helped me come to my answer.
The picture shown was helpful to show me the water levels, but the water table is not shown as clearly. I am not as certain as I wish I had of been because of the unexplained information left out.
Score 3 Scientific sources of certainty/uncertainty related to knowledge and/or data/evidence presented in the current investigation
What influenced my rating is that I know that during spring precipitation increases, and the center picture shows the most amount of water, and the right picture during summer shows the least amount of water.
The pictures give us an idea on how the water flows. With the knowledge of water levels and how the picture can shows the rocky layers higher shows that the water seeps through and clings down to the earth
We are not positive our answer is write because this activity was really confusing and we didn't really know anything about this topic prior. We think that some answers are right but some are also wrong. In the pictures we saw that as the weather changed the water either evaporated or sucked into the ground which confused us.
Score 4 Scientific sources of uncertainty outside the boundaries of the current investigation, such as recognizing limitations in the data collected for the investigation, suggesting a need for more data or a need for collecting data on a new factor, complexity of scientific phenomena under study, and limitations in current conceptualization of methods addressing a scientific question featured in the argumentation task.
We choose to say that the water started to evaporate because in the pictures they show that between spring and summer the water seems to look as if there is no more water left. The pictures of the forest don't show the amount of sunlight that can be able to absorb the water.
What influenced my certainty rating is that the photograph in the middle showing the spring season showed the water table with the most amount of water, but the photograph on the right showing summer showed the water table completely dry. What we do not know from the photograph is that is it just like that on the photograph showing spring, because it just finished raining.
We are very certain about this answer
© The Concord Consortium 58

Argumentation Rubrics
because in the images shown above, it shows that during the spring and summer the vernal pool dries up. This happens because during these seasons the temperature rises causing the ground to heat up and dry up the pool, because it is in a low-lying area. Although there are limitations because the weather changes from day to day, meaning the winter could be very warm causing the pool to dry up anyways.
© The Concord Consortium 59

Argumentation Rubrics
ARG6 Combine
Module: Will there be enough fresh water? (HASBOT) http://authoring.concord.org/sequences/171http://authoring.concord.org/sequences/285Activity 5.4: Human impact on groundwater
Task description: Students experiment with well placement around a gaining stream to determine the best location to place a well that maintains the stream’s water flow while still producing water from the well.
Argumentation task ID: ARG 6 (Combine)
Part 1: Claim- Where should pumps be placed around a gaining stream (stream in an area with a high water table) to ensure a good flow of water from the wells and maintain flow in the stream?
● Close to the stream● Far from the stream
Part 2: Explanation- Explain your answer.Part 3: Certainty Rating- How certain are you about your claim based on your explanation?Part 4: Certainty Rationale- Explain what influenced your certainty rating.Explanation Scoring: ARG 6 –EXPTo receive a high score on the explanation item, students should include observations about the level of water in the stream as well as the well output with wells close to the stream AND wells far from the stream. Which well placement maintains the flow of water into the stream? Which well placement maintains the flow of water from the wells? Some examples of valid data and valid reasoning are identified in the columns below.
© The Concord Consortium 60

Argumentation Rubrics
Valid Data(model/graph) The wells far from the stream kept good flow in the stream.(model/graph) The wells close to the stream decreased the amount of water flowing into the stream.(model) Water flowed out of the stream when the wells were placed close to the stream.(model/graph) Wells close to the stream output more water than wells farther from the stream.
Valid Reasoning: The gaining stream takes water away from groundwater. Removing water right by the stream makes the stream dry up faster than removing water from farther from the stream.
Wells closer to the stream lower the water table near the stream, which makes water flow out of the stream.
Wells far from the stream don't affect the water table around the stream, so they don't affect stream flow.
Groundwater recharges the stream.
Water flows toward the stream in a gaining stream.Score Score description Response examplesScore 0 Blank, off-task, “I don’t know” I took an educated guess.
I don’t knowScore 1 Incorrect claim, data, and/or
reasoning, OR mentioning “data” or “knowledge” without elaboration
Close to the stream gives it a better supply of water.
Because you have to make sure you have to get some of the water to get regular water.
The closer the faster the water will come.Score 2 Valid claim Because you getter a better flow of water
farther from the stream.
It should be placed far from the stream so that it does not affect the flow of the stream and the water source would not be affected.
Pumps should be places farther away to maintain the natural flow of the stream
Score 3 Valid association between data and water movement
Pumps should be placed around gaining a gaining stream far away from it because it will be able to have a steady flow and the water won’t pile up so much at one spot.
Since these wells are close to the stream, they collect more water than a well would that is far from the stream.
Because the closer the stream the more water there will be because the ground water is below the stream and the well. The
© The Concord Consortium 61

Argumentation Rubrics
well that is closer has more water being pumped out back into the stream. The one farther away is pumping water out of the groundwater making the stream have less water to be filled by.
Score 4 Valid data The wells should be placed close to the stream because there is enough water in that area to maintain water flow while also allowing the river to flow freely. This is shown in the module when we placed the well near the stream the water output was much higher for a long period of time while when we placed the well away from the stream the water output was lower for a short period of time. The graph showed us the water output was much greater with a greater constant rate when the well was placed near the stream rather than away from the stream.
The pumps should be placed far away from a gaining stream because it will be able to have a steady flow and the water won't pile up so much at one spot. For example, the wells close to the stream was water gushing out furiously and was not steady. In the picture it shows the water piling up and with the pumps it would pump the water away from piling.
Score 5 Valid reasoning If the wells are placed far from a stream than the wells will not disturb the water flowing to the stream and if you put a well far away then the flow will not have these problems.
A pump should be placed close to the stream because there is abundance of water in that area. Also if there is a high water table it would mean that water is flowing in to the stream and would create a steady flow of water. The flow in he stream would maintain the same because the well would bring water to the surface just like it would in a natural situation because the water flow is still going to the surface.
You should put the well close to the stream because in the activity above the stream
© The Concord Consortium 62

Argumentation Rubrics
gains water from the well you can tell this by looking at the activity that the water from the well that is ground water goes into the stream thus meaning that we should but wells closer to the streams
Score 6 Valid data and reasoning If the wells are farther away from the stream the ground water will maintain the water level for the stream and have water for the wells.
They should be placed far from the stream because if they're placed close they disrupt the natural flow and water level of the stream. For example, when the wells are placed farther the stream level rose at its natural rate, not faster or slower. Also, when the wells were placed close the stream flooded because the output of the wells flows towards the stream. However, the stream will always raise its water level over time because the groundwater flows into the stream.
Certainty Rationale Scoring: ARG 6 –UNCTo receive a high score on the certainty rationale item, students should consider the strengths and weaknesses of the model as a representation of gaining streams. How does the groundwater move around a gaining stream? Are all gaining streams alike? In your experiments, did both wells in each condition behave the same, or did one run dry while the other pumped a steady supply of water? Some examples of scientific sources of uncertainty are shown below.Scientific Sources of UncertaintyModel may not be representative of all gaining streams.The permeability of sediments may be different close to and far from stream.The depth of the wells may have an effect on the stream flow.Score Score description Response examplesScore 0 Blank, off-task, “I don’t know” I kind of understand.
I’m not very sure I’m making a educated guess
Score 1 Personal sources of certainty/uncertainty
We are not so certain of our answer because our examples and explaining were not as thorough. We also think that
I am sure of this answer because a well that is closer to the running water source brings more water
Groundwater water level stream close far
© The Concord Consortium 63

Argumentation Rubrics
gaining into out of stream experiment well placement water level
Score 2 Mentions of “data,” “models,” “graphs,” etc. without elaboration
We are not so certain of our answer because our examples and explaining were not as thorough. We also think that our answer is not complete or right. We saw tin the model that the water kept pilling up.
Based on the results from the diagrams above, when placing the wells closer to the stream and farther away from the stream, it makes sense
The experiment at the top of the page helped me
Score 3 Scientific sources of certainty/uncertainty related to knowledge and/or data/evidence presented in the current investigation
The fat that when I placed wells close to the stream, the water level of the stream rose faster than normal affected my certainty rating.
What influenced our certainty rating is that the module shows that the pump near the stream had a much greater output of water compared to the pump far from the stream. One limitation of this is that
Based on the model, if I put a well near the stream it will ensure a good flow of water since the water movement is outward from the ground and filling the water table and it will still maintain flow in the stream. If I put a well far from the stream, it will not ensure a good flow of water since the stream is a "gaining stream" not a "losing stream", water is not is absorbed in the ground. The groundwater will not able to provide water to wells that are far away.
Score 4 Scientific sources of uncertainty outside the boundaries of the current investigation, such as recognizing limitations in the data collected for the investigation, suggesting a need for more data or a need for collecting data on a new factor, complexity of scientific phenomena under study, and limitations in current
What influenced our certainty rating is that the module shows that the pump near the stream had a much greater output of water compared to the pump far from the stream. One limitation of this is that we cannot see what would happen if precipitation came into play would that have affected the results.
During each simulation, a snapshot was
© The Concord Consortium 64

Argumentation Rubrics
conceptualization of methods addressing a scientific question featured in the argumentation task.
taken at about two years. Comparing the graphs, closer to the stream is better for both long term. Some weaknesses to the model are how strong and fast the stream is flowing. Streams do not flow the same pace every day.
We are very certain because if the water is going to be gained, than we think that the best place to add a pump would be close to the stream. The water is flowing towards the stream .so there would be a greater amount of water so that would be the best place to put the pump. Although, we do think that our choice would change in the future because it depends if there is enough water when it rains.
© The Concord Consortium 65

Argumentation Rubrics
ARG7 Runoff
Module: Will there be enough fresh water? (HASBOT) http://authoring.concord.org/sequences/171http://authoring.concord.org/sequences/285Activity 6.2: Runoff or infiltration?
Task description: Students look at a diagram of the urban water cycle. Students analyze the picture and develop an argument about how the flow of water in an urban environment affects the recharge of urban-area aquifers.
Argumentation task ID: ARG 7 (Runoff)
Part 1: Claim- Are aquifers that lie beneath urban areas recharged by rainfall?
● Yes● No
Part 2: Explanation- Explain your answer.Part 3: Certainty Rating- How certain are you about your claim based on your explanation?Part 4: Certainty Rationale- Explain what influenced your certainty rating.Explanation Scoring: ARG 7 –EXPTo receive a high score on the explanation item, students should explain the flow of water in urban areas. What do the arrows in the diagram suggest about water flow in urban areas? Why does the water behave that way instead of another way? Can water enter urban aquifers if it behaves like that? Some examples of valid data and valid reasoning are identified in the columns below.Valid Data(picture) There is a lot of runoff in urban areas.(picture) There is much less infiltration.
Valid Reasoning: Low permeability surfaces don't let water flowthrough.
© The Concord Consortium 66

Argumentation Rubrics
(picture) Roofs, roads, and paths stop infiltrationUrban surfaces are impermeable.
If water doesn't get to the aquifer, the aquifer won't be recharged.
Low permeability surfaces don't let water flowthrough.
Score Score description Response examplesScore 0 Blank, off-task, “I don’t know” I took an educated guess.
I don’t know
It just will.Score 1 Incorrect claim, data, and/or
reasoning, OR mentioning “data” or “knowledge” without elaboration
they are because the rain that comes down goes into the aquifer
because the rainfall goes to the aquifer
cities are using the waterScore 2 Valid claim The rain doesn't recharge it.
Aquifers under urban areas are not refilled by rain fall it is refilled by human waste that is why us the humans should not go on a huge urban sprawl and just walk every where and so we do not pollute the water by letting a car fluids runoff into the sewers and have a clean environment and us humans should be more conservative about how much water we use, and for every gallon of water wasted you are basically killing people in a third world country so that is why you should have a place where for every gallon of fresh water a gallon of water should be put back into are lakes and streams around the world and that 8s why you should not make an urban area next to a huge supply of water
Score 3 Valid association between data and water movement
Yes but in order for them to be recharged they have to be very permeable.
Yes because during rainfall season the aquifer will recharge automatically because there is so much rain and the water will fall through the sediments.
Score 4 Valid data The aquifers that lie in urban areas are not recharged because there are many roads and sidewalks that don't allow water to sink into the ground.
© The Concord Consortium 67

Argumentation Rubrics
Pavement and housing stop water from entering ground water system so rainfall is unable to enter into the groundwater system through the surface.
Score 5 Valid reasoning The aquifers are not recharged by rainfall because there would not be enough land for the water to be absorbed into. In an urban area, the water is not as easily absorbed or have a place to go.
Yes but in order for them to be recharged they have to be very permeable. Rocks that are very permeable allow water to flow through so when water flows through it will be able to recharge the aquifers.
Score 6 Valid data and reasoning Aquifers that lie beneath urban areas are not recharged by rainfall because, urban areas have a greater number of impermeable surfaces than non-urban areas. Impermeable surfaces don't allow water to infiltrate the ground.
As answered in the question before the urban areas have more impermeable soil because of the streets and other concrete based things. For a aquifer to recharge there would have to be permeable soils for the water to go through and reach the aquifer. The diagram shows that instead of the water reaching the aquifer the water runs off into the lake. Water will also reach sewages that are built in the urban areas and would not end in an aquifer. This is because most urban areas have impermeable surfaces causing the water not to sink underground and have a low water table.
Certainty Rationale Scoring: ARG 7 –UNCTo receive a high score on the certainty rationale item, students should consider the strengthof the evidence presented as well as the representativeness of the data. What factors affectthe recharge rate of an aquifer? Does the picture accurately represent all urban areas? Some examples
© The Concord Consortium 68

Argumentation Rubrics
of scientific sources of uncertainty are shown below.Scientific Sources of UncertaintyThere could be some permeable surfaces in urban areas that allow for aquifer recharge. The water in urban areas could be collected in a central place to recharge the aquifer. Some pavement is pervious, allowing water to infiltrate. The picture assumes that the aquifer beneath cities is unconfined, except for the urban surfaces. It may be that the aquifer in this urban area is confined, making it impossible for it to be recharged by precipitation.Score Score description Response examplesScore 0 Blank, off-task, “I don’t know” I am sure.
I’m not that certain.Score 1 Personal sources of
certainty/uncertaintyMy knowledge about permeable
The question before helped a lot. The certainty is very because it makes sense that rain water could get through a heavy urban area surface and get to a aquifer in the ground below.
Urban areas are big and the water that falls begin to go into different things rather than into the ground or into the soil due to the amount of population aquifers would not begin to recharge.
Score 2 Mentions of “data,” “models,” “graphs,” etc. without elaboration
The picture above shows things underneath the urban areas such as bedrocks, soil, and roads.
Aquifers have to be recharged by aquifers, if the rain falls the rain is going to run to the aquifers and help recharge them. The diagram above
I feel that I am pretty certain sue to the information i have obtained over the information provided above
Score 3 Scientific sources of certainty/uncertainty related to knowledge and/or data/evidence presented in the current investigation
My certainty was influenced by the diagram because it said that the river flooded. If the river is flooding, it would mean that the aquifer is full of water. If it is dry then there is no water which would mean that it is
I am very confident because of the fact that the above lesson says that urban areas are made of a large percentage of impermeable rock, like concrete.
© The Concord Consortium 69

Argumentation Rubrics
The fact that most of the rainfall washed away as runoff makes me believe the aquifer has trouble refilling.
Score 4 Scientific sources of uncertainty outside the boundaries of the current investigation, such as recognizing limitations in the data collected for the investigation, suggesting a need for more data or a need for collecting data on a new factor, complexity of scientific phenomena under study, and limitations in current conceptualization of methods addressing a scientific question featured in the argumentation task.
Although I know that urban areas block rainwater's access to aquifers severely, I know that it doesn't block it completely. So although aquifers wouldn't recharge as much as they would in a rural area, I know they would still recharge. Also, the diagram provided doesn't
What influenced my certainty rating was that the picture showed the urban area with bedrock beneath it had a low infiltration rate representing that, that area of rocks/sediments has low permiability. Some limitations in the picture are that no aquifers are shown to see weather or not they would be able to produce a constant rate of water flow and also it only shows bedrock it does not show any other rocks/sediments.
We are very certain in our answer because we known that in the city there are no other place to recharge the aquifer and in the diagram it clearly shows that the there is more runoff and much less inclination and causing the aquifer to not recharge. I understand that this is just a picture and does not always show the correct representation of what is really happening.
© The Concord Consortium 70

Argumentation Rubrics
ARG8 (Supply)
Module: Will there be enough fresh water? (HASBOT) http://authoring.concord.org/sequences/171http://authoring.concord.org/sequences/285Activity 6.4: Transferring water supplies
Task description: Students use the model to place wells in rural and urban areas. Students compare the well outputs and look at the model to see how the aquifers underlying each area are affected. Students formulate an argument about the sustainability of removing water from rural and urban aquifers, as well as the sustainability of moving water from one aquifer system to another.
Argumentation task ID: ARG 8 (Supply)
Part 1: Claim- Sustainable water use occurs when the withdrawals of water are equal to or less than the inputs of water. Which of the wells in the model showed sustainable water use?
● Rural flowback well● Rural well pumped to city ● Urban well treated at wastewater plant● Rural flowback well and urban well treated at wastewater plant● Rural flowback well and rural well pumped to city● Rural well pumped to city and urban well treated at wastewater plant
Part 2: Explanation- Explain your answer.Part 3: Certainty Rating- How certain are you about your claim based on your explanation?Part 4: Certainty Rationale- Explain what influenced your certainty rating.Explanation Scoring: ARG 8 –EXPTo receive a high score on the explanation item, students should include detailed explanations of the results of their experiments. What happened to the water level in the aquifer below each well? Which well(s) came close to running dry? Which well(s) had consistent water flow? Why did that happen?How does the surface type affect whether or not the aquifer can be recharged? How do thedifferent types of wells affect whether or not the aquifer can be recharged? Some examples of valid data and valid reasoning are identified in the columns below.
© The Concord Consortium 71

Argumentation Rubrics
Valid Data(model) Water from the flowback well in the rural area flows back onto the rural surface.(model) Water from the non-flowback well in the rural area does not return to the rural area.(model) Water from the flowback well in the urban area flows back onto the urban surface.(model) Water goes into the ground in the rural area.(model) In the urban area, the water stays on the surface.(model/graph) The urban area well runs dry before the rural area wells.
Valid Reasoning: The rural area has permeable surfaces.
The urban area has impermeable surfaces.
Low permeability means that water cannot flow through.
If water cannot flow through the ground, it cannot recharge aquifers underneath.
Score Score description Response examplesScore 0 Blank, off-task, “I don’t know” I took an educated guess.
I did not get to do an explanation because I did not understand the word emissions.
Score 1 Incorrect claim, data, and/or reasoning, OR mentioning “data” or “knowledge” without elaboration
The water pumped in the rural goes to the city and becomes evaporated.
That is what I saw in the simulation.
These two worked the best, and the urban did nothing so the rural wells did the stuff the best.
Score 2 Valid claim As said on the instructions the water use for urban wells is good because it is not wasted which makes the last part of my choice good. Also since the Urban water is not enough to sustain the high population which means that the rural well is needed to provide the water for the city.
The rural flowback well and well pumped back to the city is well 2 because it has the most sustainable water use.
The wells in the model showed that rural flow back well and rural well pumped to the city.
Score 3 Valid association between data and water movement
This is because these two wells both discharge water back up to the surface, and when they both get back to the soil and sink through the permeable surface, there is an
© The Concord Consortium 72

Argumentation Rubrics
equal amount of water sinking back to the groundwater system
Sustainable water use occurs when the water is being pumped back into the city, their is a less supply of water then their was before due to the cities flow-back well. The rural areas flow back well allows water beneath/near the rural area to distribute itself evenly.
The rural flowback well showed sustainable water use with how the water flowed in then out with the well.
Score 4 Valid data The rural flowback well in the model showed a sustainable water use. This happened because in the model it showed that there was less or equal to of amounts water being withdrawal than having inputs of water. This occurs because there was too much water to flow back causing it to withdrawal a little amount of water. In the graph above, there is a higher output than input meaning that flowback well in the model showed a sustainable water use because the withdrawal was less or equal to the inputs of water. Some factors of the wells and surfaces affect the recharge of the aquifers below. Such as it being and unconfined or confined well and the type of sediments and rocks it is being installed in, causing the wells to recharge quicker, slower. Or to even recharger with more or less water.
The rural flow back well inputs the same as it out pouts while other wells only input like the well that is pumped into the city which makes the water unable to be discharged back into the aquifer.
The rural flowback well in the model showed sustainable water use because, based on the data collected not only is the water being taken but it is also being put back into the aquifer. Also, the data shows us that the flowback well produced more water than the two non-flowback wells combined.
Score 5 Valid reasoning The rural flowback well and urban well
© The Concord Consortium 73

Argumentation Rubrics
treated at waste water plant shows a sustainable water use. The flowback well takes water and sends it back and the urban plant takes the water. If it was two plants the aquifer would have been emptied out, and two flowback wells would of just overfilled the aquifer. The rock/sediment has to be permeable for the aquifer to be filled by the rain or flowback well.
We take the water that we need and the rest is sucked back into the aquifer where it can be reused and can replenish. The water level decreases permanently because of the massive use of water needed for cities. This would not work in a city because the the urban grounds are impermeable and do not allow water past.
Score 6 Valid data and reasoning This is because the water that is taken from the aquifer can be absorbed back into the ground in a continuous cycle. The permeability of the ground in rural areas allows the water to recharge the aquifer quickly. The water level at the bottom of the rural well was substantially higher that the water level under the urban area.
This system shows sustainable water use because it allows water to flow constantly because the water from the rural area and the bit of water that goes from the top of the urban aquifer and back under it cause a constant flow of water. Also, the withdrawals are about equal or less than the inputs of water as seen in the diagram. We can see that the water out put of each well level out in the graph meaning that both the rural and the urban area are receiving sufficient water. The permeable and impearmeable surfaces also affect the water use because most of the water is coming from the rural part which is permeable while some is coming from the impermeable urban area which makes up a good amount of water to recharge the aquifer. Also, as we have seen, the pumped wells are not very sustainable because the water runs out over
© The Concord Consortium 74

Argumentation Rubrics
time.
Certainty Rationale Scoring: ARG 8 –UNCTo receive a high score on the certainty rationale item, students should consider the strengths and weaknesses of the model representing rural and urban areas. How does water move in rural and urban areas? Is the model a good representation of rural and urban areas? Some examples of scientific sources of uncertainty are shown below.Scientific Sources of UncertaintyModel may not be representative of all rural and urban areas; the model scale allows water from the rural area to flow into the urban area. In the real world, urban and rural areas may be farther apart and water might not flow from rural areas to urban areas.If amount of water removed from wells is more than precipitation can recharge, no wells are sustainable.The wastewater treatment plant could discharge to an area that would recharge the urban area's aquifer.Sediments under the rural area may not always be as permeable as what is shown in the model.Score Score description Response examplesScore 0 Blank, off-task, “I don’t know” I had no idea.
I’m not that certain.
I am not very sure about my answer.Score 1 Personal sources of
certainty/uncertaintyI am most certain about this because the water can definitely flow back if it is not used, but some other ways can be more efficient for city places.
My certainty rating is uncertain because it does not clearly say in the graph which well is which to determine rural and urban areas.
I am 50-50 on this one cause I feel that I might of missed something in the model.
I'm not completely certain about this because I don’t believe there is enough
Score 2 Mentions of “data,” “models,” “graphs,” etc. without elaboration
The certainty rating is a 3 because of the information provided with the interactive module above. from water information i have has seemed to help influence my rating The activity above helped me with this because it showed me how the water is to be running through the
© The Concord Consortium 75

Argumentation Rubrics
There are many factors that influence the sustainability of a well. Based on the simulation, the information given
Score 3 Scientific sources of certainty/uncertainty related to knowledge and/or data/evidence presented in the current investigation
Rural flowback well recharges the aquifers. While the non flowback well is placed in the urban area so the water doesn't come back and flood the city.
What influenced me to put very certain as my rating is because the graph is helpful, because the water flow is not reaching the urban aquifer since there is a layer of bedrock between the aquifer and the surface. There are limitations to the graph because you can not manipulate the different sediments and water flow.
The model showed how multiple wells influenced the aquifer when it could be replenished, and that made me feel certain because the diagram showed that the aquifer could sustain itself with a few of the rural flowback pumps but the other pumps were not sustainable and were hard to
Score 4 Scientific sources of uncertainty outside the boundaries of the current investigation, such as recognizing limitations in the data collected for the investigation, suggesting a need for more data or a need for collecting data on a new factor, complexity of scientific phenomena under study, and limitations in current conceptualization of methods addressing a scientific question featured in the argumentation task.
I chose this answer because the model shows how the flowback well sends the water it takes back and the water the plant takes and keeps. If it was two plants the aquifer would have been emptied out, and two flowback wells would of just overfilled the aquifer. The model doesn't show the where some of the water from the rural areas go and how much water the urban plant can take.
We are certain because the water is moving from the ground into the air and back into the ground. Therefore the water is able to be absorbed into the ground since the flowback well is in a rural area. Although there are limitations because if the rain produces water, than the water could be recharged but if there is not any rain than the rain would not be charged as easily.
© The Concord Consortium 76