has protest increased since the 1970s? how a survey
TRANSCRIPT

Has protest increased since the 1970s? How asurvey question can construct a spurious trend1
Michael Biggs
Abstract
The literature on political participation asserts that protest has increased over thelast four decades, all over the world. This trend is derived from surveys askingquestions about participation in various forms of protest, including demonstra-tions, boycotts, and unofficial strikes.The latter question made sense in the contextin which it was formulated, Britain in the early 1970s, and with regard to theoriginal methodological aim, measuring ‘protest potential’. The absence of ageneric question on strikes, however, distorts our understanding of protest. Twosources of data on Britain in the 1980s and 1990s – a population survey and anevent catalogue – comprehensively measure strikes. They show that strikes greatlyoutnumbered demonstrations and other forms of protest. Another claim in theliterature, that protesters are highly educated, no longer holds once strikes areproperly counted. Strikes in Britain, as in many countries, have dramaticallydeclined since the 1980s. This decline more than offsets any increase in demon-strations and boycotts, meaning that the total volume of protest has decreased.Theepisode illustrates how survey questions, when replicated without scrutiny, canmisconstrue social trends.
Keywords: Protest; social movements; strikes; political participation; sociology ofknowledge
Protest is on the rise. There is ‘an international trend towards rising rates ofunconventional or elite-challenging behavior’ (Inglehart 1997: 312); ‘the pro-portion of citizens engaged in protest politics has risen, and risen dramatically,during the late twentieth century’ (Norris 2002: 197); ‘more challenging protestactivities display a marked increase from 1975 to the present’ (Dalton 2008b:90); ‘the citizenry exhibits a growing readiness for, and actual participation in,various forms of protest’ (Rucht 2007: 713); ‘protest levels are increasing, evenas nations develop economically and politically’ (Dalton, Van Sickle and
Biggs (Department of Sociology, University of Oxford) (Corresponding author email: [email protected])© London School of Economics and Political Science 2014 ISSN 0007-1315 print/1468-4446 online.Published by John Wiley & Sons Ltd, 9600 Garsington Road, Oxford OX4 2DQ, UK and 350 Main Street, Malden,MA 02148, USA on behalf of the LSE. DOI: 10.1111/1468-4446.12099
The British Journal of Sociology 2015 Volume 66 Issue 1

Weldon 2010: 71); ‘citizens in advanced democracies have become more likelyto participate in social movement activities’ (Dodson 2011: 490); ‘since the1970s there has been a dramatic rise in the number of people claiming to haveengaged in protest’ (Saunders et al. 2012: 263). In short, we live now in a ‘socialmovement society’ (Neidhardt and Rucht 1993; Meyer and Tarrow 1998). Therise in protest is welcomed for counterbalancing the fall in voting and partymembership (e.g. Power Inquiry 2006: 48–9; Dalton 2008a: 71). This trend inprotest, widely accepted in sociology and political science, derives from popu-lation surveys carried out since the early 1970s.A standard battery of questionsasks whether the respondent has taken part in particular forms of protest, suchas lawful demonstrations or unofficial strikes. Only a minority of adults haveundertaken any of these actions (aside from signing a petition), but this pro-portion has increased over time in most countries.
This apparent trend, I will argue, is spurious, at least for Britain. The stand-ard battery of questions – canonized by the World Values Survey – does notproperly capture participation in strikes, and so misses the bulk of protestactions. Strikes are the one form of protest on which governments collectstatistics (Franzosi 1989). These statistics show that strikes have declined dra-matically since the 1980s in Britain, as in many countries.The decline in strikesmore than offsets the increase in some forms of protest captured by surveyquestions. The notion of a ‘social movement society’ is sustainable only if weignore the collapse of the labour movement. My argument rests on two sourcesof evidence from the 1980s and 1990s. The British Social Attitudes survey isexceptional for including questions on strikes tout court.The European Protestand Coercion Dataset comprehensively catalogues events. Both sources dem-onstrate that strikes dominated other forms of protest actions. Analysis ofevents also reveals how surveys smooth away the temporal volatility ofprotest. Besides distorting our view of change over time, the survey questionsalso paint a misleading portrait of the typical protester. The assertion thateducation is positively associated with protest (e.g. Dalton 2008a: 69; Norris2002: 201; Rucht 2007: 715) is no longer tenable when strikers – who tend to beless educated – are properly counted.
The definition of ‘protest’ requires some preliminary remarks. The term issometimes used narrowly – with an indefinite article – to denote a particulartype of gathering, synonymous with a march or demonstration (e.g. Caren,Ghoshal and Ribas 2011). The term is also used broadly to denote collectiveaction which combines the expression of grievance and the demand forchange, directed against a powerful adversary. In this sense it is differentiatedfrom more institutionalized means of exercising political voice, classicallyvoting; it is also commonly differentiated from lethal violence.This article usesthe broader concept, as specified or implied in the literature quoted above,focusing on ‘confrontational tactics such as marches, strikes, and demonstra-tions that disrupt the day-to-day life of a community’ (Taylor and Van Dyke
142 Michael Biggs
© London School of Economics and Political Science 2014 British Journal of Sociology 66(1)

2004: 263; see also Piven and Cloward 1977: 3–4). Such actions are costly for theparticipants: strikers lose wages, demonstrators give up time (and usually payfor travel); participants sometimes risk steeper costs, such as arrest or injury.Even a boycott is costly because the purchaser foregoes a superior product.Theelement of significant cost differentiates these actions from signing a petition,which takes a moment.2 Most British adults have signed a petition, and thegovernment has instituted a website to encourage petitions, whereas the otherprotest actions are genuinely unconventional. It should be emphasized, though,that my intention is not to impose a particular definition of protest,but rather toshow how a battery of survey questions came to define the phenomenon, whichhad the unintended consequence of undercounting strikes.
This article focuses on Britain, where the survey questions were originallyformulated, and which experienced significant protest from the 1970s to the1990s (Rootes and Saunders 2005). In the early 1970s, mass strikes challengedthe government’s attempts to curb the power of the labour movement; thegeneral election of 1974 was precipitated by a coalminers’ strike. In the late1970s, widespread strikes stoked wage inflation and disrupted ordinary life,symbolized by power cuts and uncollected rubbish. The coalminers’ strike in1984 concentrated resistance to the Conservative government. Foreign policywas challenged by the anti-war movement, famously in the women’s campoutside the Greenham Common airforce base, started in 1981. The environ-mental movement used novel forms of direct action to resist motorwayconstruction. Finally, the government’s poll tax provoked in 1990 ‘the mostwidespread campaign of civil disobedience seen in Britain in the twentiethcentury’ (Rootes 2003: 142). Northern Ireland is excluded for theoretical andempirical reasons. Its politics operated according to a different logic, domi-nated in the 1970s and 1980s by violence. It is also covered less comprehen-sively by the surveys used here.
1. Surveying protest
After the Second World War, population surveys transformed the study ofelectoral politics; public opinion could be measured, or perhaps constructed,scientifically (Osborne and Rose 1999; Savage 2010: ch. 8). The same toolscould be applied to protest. Surveys were initially undertaken of protesters ormembers of movement organizations (e.g. Parkin 1968), and such surveys havecontinued (e.g. Saunders et al. 2012). In order to compare the characteristics ofparticipants with those of non-participants, however, it is necessary to samplefrom a population or sub-population. One of the earliest examples was asurvey of black university students in the American South in 1962, askingwhether they had taken part in sit-ins against segregation (Biggs 2006). Thesesit-ins were the harbinger of a wave of protest that transformed politics in the
Has protest increased since the 1970s? 143
© London School of Economics and Political Science 2014British Journal of Sociology 66(1)

1960s. In Britain there was nothing comparable to the Civil Rights movementin the USA or to 1968 in France, but the Campaign for Nuclear Disarmament(Parkin 1968) and the Vietnam Solidarity Campaign (Thomas 2002) had amajor political impact. This phenomenon demanded investigation using popu-lation surveys. The most ambitious project was the Political Action Survey(PAS), launched in 1971, eventually involving eight countries (Barnes andKaase 1979). Alan Marsh – a doctoral student at the London School of Eco-nomics and Political Science – played a leading role, pioneering the surveyquestions which now dominate the field.
Compared to voting, protest – or ‘unorthodox political behaviour’, as PASpreferred – poses problems for survey methods. Such actions ‘occur irregularly,infrequently, and in specific, often local, contexts of mobilization’ (Barnes andKaase 1979: 42). Most obvious is the numerical problem. Because unorthodoxpolitical action is (by definition) confined to a small minority, this increasessampling variability. In a sample of a thousand adults, for example, if only eighthave undertaken an occupation, then the comparison between occupiers andthe rest lacks statistical power. Marsh (1974) therefore developed a scale of‘protest potential’: respondents were asked not just whether they had takenpart but also whether they would or might do so.3 (A similar scale was con-structed around the same time by Muller; e.g. Muller 1979.) This neatly over-came the problem of small numbers: only 6 per cent had taken part in a lawfuldemonstration in the preceding ten years, but a further 51 per cent said thatthey would or might do so (Marsh 1977: 45).
Aside from numbers, there is the problem of definition. Formally, PASdefined unorthodox or unconventional political behaviour as that which ‘doesnot correspond to the norms and customs that regulate political participation’(Barnes and Kaase 1979: 41). No rules or laws ‘encourage the regular occur-rence of street protests, demonstrations, boycotts, rent strikes, political strikes,the occupation of administrative premises and so on’ (Marsh 1977: 39). Anobvious objection is that many types of protest are defined and protected bylaw (as the category ‘lawful demonstration’ proves); certainly almost allinstances of protest are shaped by norms and customs. What proved extraor-dinarily influential was not the theoretical definition but a measurement tool:the list of specific actions given to respondents (Marsh 1977: 45; cf. 1974: 110).These actions were selected to be arrayed on a unidimensional and cumulativescale of protest potential; respondents physically sorted cards representingforms of action.
At one end of this continuum are mild forms of protest like signing petitionsand peaceful marches, at the other end are extreme forms of deliberatedamage to property and the use of personal violence. Between theseextremes are ordered: demonstrations, boycotts, strikes, occupations, andsimilar activities. (Marsh 1976: 18)
144 Michael Biggs
© London School of Economics and Political Science 2014 British Journal of Sociology 66(1)

As evidence of the influence of this scale, Marsh’s (1977: 42) diagram isreproduced in four editions of a leading textbook (Dalton 2006: 65).
The question on strikes has an intriguing history. Marsh’s preliminary explo-ration in 1972 included strikes as one of the ‘stimulus examples’. This wassubsequently changed to refer to a particular subtype: unofficial strikes (Marsh1974: 109–10). As Marsh recollects,
pilot respondents themselves queried whether we meant official or unof-ficial (or ‘wildcat’) strikes and it seemed to me that unofficial strikes hadbecome a touchstone of unorthodox political action in contrast tothe more orthodox official actions. (personal communication, 31 January2013)
An unofficial strike is formally one that ‘takes place contrary to union rulesand contrary to agreed procedures’ (Eldridge and Cameron 1964: 35; alsoMarsh and Evans 1973: 330). There is no implication that it breaks the law.An unofficial strike may be legal; an official strike may be illegal. The dis-tinction between official and unofficial is inherently ambiguous: what beginsas an unofficial strike can be retrospectively endorsed by the union leaders,and thus deemed official; aficionados differentiate ‘official unofficial’ from‘unofficial unofficial’ strikes (Crouch 1978: 226).4 Clearly the unofficial strikeis a slippery category. Its significance can be understood only in the particu-lar context of Britain in the early 1970s.
Unofficial strikes emerged – and were construed – as a social problem in the1960s. Indeed, criticism of this particular tactic provoked rebuttal in the BritishJournal of Sociology (Eldridge and Cameron 1964). The Donovan Commis-sion, established to investigate conflict between labour and capital, claimedthat ‘95 per cent of stoppages are unofficial, and unofficial strikes are becomingmore common’; it warned that ‘the economic consequences are obvious andserious’ (Royal Commission 1968: 266–67).The legislative solution pursued bythe Conservative government was the Industrial Relations Act of 1971, fiercelyopposed by trade unions (Moran 1977). Amongst other provisions, the Actremoved legal protection from unofficial strikes: trade unions would be liablefor the ensuing financial loss. In the spring and summer of 1972, the newNational Industrial Relations Court was tested by a case involving unofficial‘blacking’ – refusal to handle goods – and picketing by dock workers.A farcicalsaga ended with five shop stewards in prison, provoking massive strikes andproving the new system to be unworkable (Darlington and Lyddon 2001: ch. 5).In this context, we can understand why Marsh isolated unofficial strikes toconstruct the cumulative scale of protest potential: they ‘mark a third thresh-old position, wherein the question of conscious illegality arises’ (Marsh 1977:41–3) – in his thesis (but not the book) the sentence continues, ‘especially sincethe Conservative Government was still pursuing its anti-strike legislation atthe time of the survey’ (Marsh 1976: 53). The Act was fatally weakened by the
Has protest increased since the 1970s? 145
© London School of Economics and Political Science 2014British Journal of Sociology 66(1)
end of 1972, and was finally repealed in 1974. By then, as will be seen below, theprofile of strikes had been transformed.
Marsh’s question on unofficial strikes transcended its original historicalcontext and specific methodological purpose, to enter the pantheon of surveyquestions. The PAS questions were adopted by the European Values Survey,with slight modification.The standard battery asks whether the respondent hasever done, might do, or would never do five ‘forms of political action’: signinga petition, joining in boycotts, attending lawful demonstrations, joining unof-ficial strikes, and occupying buildings or factories.5 The most important altera-tion was asking whether the respondent has ‘actually done any of these things’– over their entire lifetime – rather than ‘during the past ten years’. Thismitigates the methodological problem of small numbers but loses temporalprecision; respondents may be recalling actions performed several decadesearlier. As part of the World Values Survey (WVS), these questions have nowbeen asked consistently in over seventy countries, from Albania to Zimbabwe.6
They therefore constitute the most important source of data on protest at thepopulation level.
Some studies continue to examine ‘protest potential’, combining whatrespondents have done with what they say they would or might do. Most recentstudies, though, focus exclusively on what respondents have done. No longerare the five forms of action justified as thresholds along a unidimensional andcumulative scale. It is assumed that ‘these five examples tap the most commonforms of collective action’ (Dalton, Van Sickle and Weldon 2010: 61). Whereassocial scientists in the 1970s spent pages conceptualizing their object andjustifying their measurement, now the standard battery of questions are takento define protest. ‘Blackboxing’ has occurred, to purloin Latour’s (1999: 304)term denoting ‘the way scientific and technical work is made invisible by itsown success’. This is most pronounced when the five forms of action aresummed to make an index (e.g. Dalton, Van Sickle and Weldon 2010) ordichotomized into any actions versus none (e.g. Corcoran, Pettinicchio andYoung 2011). Even without such aggregation, blackboxing remains an aptmetaphor: these questions have not been scrutinized or calibrated againstother surveys and other kinds of data. This article is a first step.
Let us begin with the survey evidence for Britain. Figure I plots the propor-tion of WVS respondents who have ever participated in the forms of action(petitions excluded).7 This series is typically extended back to 1974 using PAS(e.g. Dalton 2006: 68; Norris 2002: 197). The conjunction is invalid, because thequestions differed in time horizon: the past ten years in PAS, ever in WVS. Theaverage British respondent in WVS was in their mid-forties, and so was refer-ring to almost three decades of adult life. Conjoining these surveys wouldcreate an erroneous increase in participation from the early 1970s to the early1980s. The graph’s vertical bars indicate 95 per cent confidence intervals. Overa quarter of a century, the proportions of adults having boycotted and having
146 Michael Biggs
© London School of Economics and Political Science 2014 British Journal of Sociology 66(1)
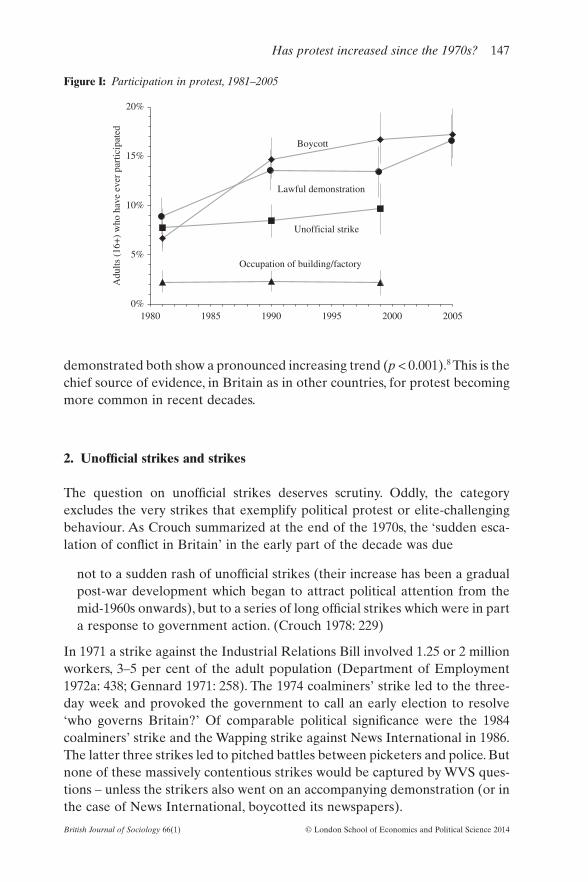
demonstrated both show a pronounced increasing trend (p < 0.001).8 This is thechief source of evidence, in Britain as in other countries, for protest becomingmore common in recent decades.
2. Unofficial strikes and strikes
The question on unofficial strikes deserves scrutiny. Oddly, the categoryexcludes the very strikes that exemplify political protest or elite-challengingbehaviour. As Crouch summarized at the end of the 1970s, the ‘sudden esca-lation of conflict in Britain’ in the early part of the decade was due
not to a sudden rash of unofficial strikes (their increase has been a gradualpost-war development which began to attract political attention from themid-1960s onwards), but to a series of long official strikes which were in parta response to government action. (Crouch 1978: 229)
In 1971 a strike against the Industrial Relations Bill involved 1.25 or 2 millionworkers, 3–5 per cent of the adult population (Department of Employment1972a: 438; Gennard 1971: 258). The 1974 coalminers’ strike led to the three-day week and provoked the government to call an early election to resolve‘who governs Britain?’ Of comparable political significance were the 1984coalminers’ strike and the Wapping strike against News International in 1986.The latter three strikes led to pitched battles between picketers and police. Butnone of these massively contentious strikes would be captured by WVS ques-tions – unless the strikers also went on an accompanying demonstration (or inthe case of News International, boycotted its newspapers).
Figure I: Participation in protest, 1981–2005
0%
5%
10%
15%
20%
1980 1985 1990 1995 2000 2005
Adu
lts (1
6+) w
ho h
ave
ever
par
ticip
ated
Occupation of building/factory
Unofficial strike
Lawful demonstration
Boycott
Has protest increased since the 1970s? 147
© London School of Economics and Political Science 2014British Journal of Sociology 66(1)

The demarcation between unofficial and official strikes is blurred, as wehave noted above. This ambiguity makes it a poor empirical measure. Govern-ment statistics on ‘work stoppages’ (explored in more detail below) attemptedsuch a demarcation in 1972. Note how the date, indicating heightened concernabout unofficial strikes, coincided with Marsh’s work. Admitting ‘serious prac-tical difficulties in defining stoppages as unofficial’, the government could onlyidentify strikes ‘known to be official’ (Department of Employment 1972b: 810;Silver 1973: 101). The distinction was dropped altogether in 1981.9 If statisticalexperts could not identify unofficial strikes, it is not clear how respondentsinterpreted the question – especially when recalling events that took placedecades earlier.
Government statistics do allow us to estimate the proportion of strikers inofficial strikes for the period from 1960 to 1980, two decades before the firstwave of WVS. (When the series on strikes known to be official was firstpublished in 1972 it was retrospectively extended to 1960, using figures origi-nally compiled for the Donovan Commission.) Strikes known to be officialcontributed 52 per cent of the total number of workers involved (see AppendixS1 in the online supplement). Given that the remainder included strikes ofindeterminate status (as well as strikes by unorganized workers and lockouts),it is clear that unofficial strikes contributed well under half. From 1990, unof-ficial strikes have been estimated from newspaper reports (Gall and Cohen2013: 96). They accounted for a quarter of the total number of workersinvolved in the nine years ending in 1999, when WVS last posed the questionon unofficial strikes. In both periods, then, official strikes predominated.
This finding cannot be directly extrapolated from acts to lifetime experience.Hypothetically, the same workers who joined official strikes could also – onother occasions – have joined unofficial ones: in that case, the question onunofficial strikes would fortuitously capture the people who had ever joinedstrikes of any kind. To test this hypothesis, we require a survey asking whetherrespondents had ever gone on strike, tout court.10 The British Social AttitudesSurvey (BSA) asked this question from 1983 to 1990 (excepting 1988).11 Onlyrespondents who had belonged to a union at some point in their lives (56–7 percent) were asked. The remainder must be treated as never having gone onstrike, which means underestimating the proportion, though the discrepancy issurely small. Pooling all years (there is no statistically discernible differenceamong them), 19–20 per cent of adults had participated in strikes. This is morethan double the WVS proportion for unofficial strikes, 7–9 per cent (pooling1981 and 1990). The average striker in these surveys (WVS 1981–1990 andBSA 1983–1990) started work around 1960, and so experienced the heyday ofunofficial strikes in the 1960s and 1970s. What could explain the great differ-ence – exceeding one in ten adults – between proportions in WVS and BSA?Either many workers who had gone on official strikes had never gone onunofficial strikes, or many respondents who had actually gone on unofficial
148 Michael Biggs
© London School of Economics and Political Science 2014 British Journal of Sociology 66(1)

strikes did not identify them as such (and so incorrectly answered the questionin the negative), or some combination of the two. Whatever the explanation,the WVS question elicits only the tip of the iceberg of strikes. With a properestimate of strikes from BSA, we see that more adults had gone on strike(19–20 per cent) than had demonstrated (12–16 per cent) even by 1990 (seeFigure I). Thus strikes were actually the most commonly experienced form ofprotest (excepting petitions, of course) for people in the 1980s.
In sum, the WVS question on unofficial strikes is severely misleading. Itrelies on a distinction that is often impossible to draw and it omits the majorityof strikes – including the most politically important ones. Once the magnitudeof participation in strikes is properly appreciated, how does this alter the trendin protest?
3. Strikes and other protest events
The trajectory of strikes over the long term can be traced using governmentreports on ‘work stoppages’.12 Figure II shows the total number of workerswho went on strike in each year. (Appendix S1 in the online supplementspecifies sources and calculations.) The denominator is the adult population –rather than the number of employees, as is usual with strikes – to matchsurveys.The ratio of strikers to adults fell by over four fifths from the 1960s and1970s to the 1990s and 2000s. Direct comparison with Figure I is not possible,as already emphasized. Although survey questions are often described as ameasure of ‘protest activity’ or ‘protest levels’ (Dalton 2006: 67; Dalton, VanSickle and Weldon 2010: 71), the number of individuals in a given year who
Figure II: Participants in strikes, 1946–2012
0%
3%
6%
9%
12%
1946
1951
1956
1961
1966
1971
1976
1981
1986
1991
1996
2001
2006
2011
Wor
kers
dir
ectly
invo
lved
eac
h ye
ar /
adul
ts (1
5+)
Has protest increased since the 1970s? 149
© London School of Economics and Political Science 2014British Journal of Sociology 66(1)

have ever protested differs fundamentally from the number of protest acts ineach year. Recall that the average survey respondent is in their mid-forties,which means that the answer encapsulates almost three decades of adult life.Aside from the long time lag, the survey questions fail to distinguish betweenprotesting once and protesting a hundred times. They similarly ignore theduration of protest events, which varies greatly for strikes (and occupations).The importance of this duration is revealed in Figure III, which shows the totalnumber of working days lost by strikers in each year. The series does notsimply repeat Figure II (r = 0.65). The 1970s and 1980s loom larger, eclipsingthe 1960s, because strikes lasted longer.The decline after the 1980s is still morepronounced.
To truly measure protest activity, then, we need comparable data on othersorts of protest events. Sociologists in many countries, like Germany (Rucht1998) and the USA (McAdam et al. n.d.), have compiled catalogues of protestevents over several decades, but there is nothing comparable in Britain.13 Thesole comprehensive source is the European Protest and Coercion Dataset(EPCD), collected by Ronald Francisco (2009). Spanning the period 1980–1995, this dataset was compiled from Nexis; the most common sources forBritain were Reuters, Glasgow Herald, Guardian, Press Association, Independ-ent, and Daily Telegraph. Crucially for my purpose, the number of participantsin each event is recorded. Where precise information was lacking, this figure isapproximate: ‘hundreds’ is estimated as 300, ‘thousands’ as 3000, and so on.Ongoing events are entered for every day; to clarify this point, we should referto the unit of observation as the daily event. There were over 27,000 dailyevents in Britain, divided into about ninety types, from press conferences tobombings.14
Figure III: Participant-days in strikes, 1946–2012
.0
.1
.2
.3
.4
.5
.6
1946
1951
1956
1961
1966
1971
1976
1981
1986
1991
1996
2001
2006
2011W
orki
ng d
ays
lost
eac
h ye
ar /
adul
ts (1
5+)
150 Michael Biggs
© London School of Economics and Political Science 2014 British Journal of Sociology 66(1)

EPCD has not been validated, which perhaps accounts for its neglect bysocial scientists. The figures for strikes can be compared to governmentstatistics. Two major anomalies are due to ‘Days of Action’ – general strikes –staged by the Trades Union Congress: one supporting a pay rise for healthcareworkers in 1982, another protesting against the banning of unions at GCHQ in1984. EPCD counts over a million strikers in each event. These numbers areimplausibly high and so I substitute figures derived from governmentstatistics.15 One further downward adjustment is necessary. Governmentfigures on days lost are calculated for the normal working week, whereasEPCD usually counts strikes as continuing on Saturday. I therefore discard allstrike days on weekends (though if a strike began on the weekend this initialday is retained).Thus pruned, EPCD records a total of 66 million working dayslost, compared to 70 million days from government statistics (Figure III). Theannual correlation between the two series is remarkably high (r = 0.99).
Having vindicated EPCD figures on strikes (with a few downward adjust-ments), we can compare participation across types of events. Table I summa-rizes all events in EPCD. Strikes accounted for two thirds of the total numberof participants in each daily event, or participant-days for short. This totalaggregates very disparate events. To create a category that approximates thedemonstration specified in survey questions, demonstration can be combinedwith march, rally, and vigil. Together these accounted for 4.2 millionparticipant-days. An additional category can be created for more confronta-tional events: occupation, obstruction, civil disobedience, riot (including prisonriots), break in, and disruption. These accounted for a further 1.5 millionparticipant-days. Of the remainder, the largest category by far comprises slow-downs by workers (pruned by omitting weekends, as with strikes). EPCDincludes boycotts and petitions, but these numbers are not meaningful as thoseactions are far less newsworthy. The ‘symbolic’ category is dominated by asingle event, when households momentarily switched off their lights in solidar-ity with coalminers.16 Overall, demonstrations account for a tiny fraction of the
Table I: Protest and repression events, 1980–1995 (EPCD)
Action Participant-days (millions) Participants (millions)
Strike 66.3* 67% 11.7 49%Demonstration etc 4.2 4% 4.0 17%Occupation etc 1.5 2% 0.4 2%Slowdown 20.0* 20% 2.5 10%Symbolic 2.1 2% 2.1 9%Boycott 2.0 2% 1.4 6%Petition 1.1 1% 1.1 5%Other 1.0 1% 1.0 4%Total 98.2 100% 24.1 100%
Note: * Excluding weekends.
Has protest increased since the 1970s? 151
© London School of Economics and Political Science 2014British Journal of Sociology 66(1)

volume of protest, while strikes represent the great bulk. Figure IV comparesstrikes, demonstrations, and occupations over the period.The decline of strikesclearly dominates the series.
These figures count ongoing events separately each day. It might beobjected, perhaps, that counting days tips the scale in favour of strikes. Theo-retically, I would argue that going on strike – and losing wages – for a weekrepresents a greater protest than attending a demonstration for an afternoon.Nevertheless, we can eliminate duration by counting an event spanning severaldays only once, taking the maximum number of participants in any single day.17
The longest ongoing event, lasting over eight years, was the occupation outsideFaslane Naval Base to oppose Trident nuclear missiles. (Note that this wouldnot be covered by the WVS question on occupation, which refers specifically tobuildings and factories.) As Table I shows, the number of strikers was 11.7million (government statistics, in Figure II, count 10.2 million). Demonstratorsnumbered 4 million, and occupiers fewer than half a million.18 Although dem-onstrations feature more prominently if we count participants rather thanparticipant-days, they are still greatly outnumbered by strikes.
In sum, then, strikes dominated other forms of protest in the 1980s and thefirst half of the 1990s. Strikes contributed sixteen times more participant-daysthan demonstrations, and at least two and a half times the number ofparticipants. This disparity is greater than the difference revealed by surveys:recall that 19–20 per cent of adults in the 1980s had gone on strike, while 12–16per cent by 1990 had demonstrated. The divergence between survey and eventpresumably reveals that people who had ever gone on a strike tended to havestruck more times than people who had ever gone on a demonstration haddemonstrated. However protest is measured, it is clear that the decline ofstrikes in the 1990s and 2000s (Figures II and III) more than offsets any
Figure IV: Participant-days in protest events, 1980–1995 (EPCD)
0
5
10
15
20
25
30
35
1980
1981
1982
1983
1984
1985
1986
1987
1988
1989
1990
1991
1992
1993
1994
1995
Part
icip
ant-
days
(mill
ions
)
StrikesDemonstrations etcOccupations etc
152 Michael Biggs
© London School of Economics and Political Science 2014 British Journal of Sociology 66(1)

increase in demonstrations (Figure I). The apparent upward trend in protest isdue to the mismeasurement of strikes (asking only about unofficial strikes),compounded by a question (asking have you ever?) which condenses a lifetimeinto a binary response.
4. Strikers and other protesters
Now that we appreciate the true magnitude of participation in strikes beforethe 1990s, we can see whether the portrait of the typical protester needsretouching. Many characteristics – such as belonging to a trade union oradhering to the Left (e.g. Dalton 2008a: 69) – will be associated with strikes aswith other forms of protest, and so it does not matter if strikes areunderestimated. Education, however, is a different matter. The literaturederived from surveys unequivocally asserts a positive association. There is a‘strong tendency for the better educated to engage in protest’ (Dalton 2008a:69); ‘education proved by far the best predictor of experience of protestpolitics, followed by social class’ (Norris 2002: 201);‘it is those who are formallythe most advantaged who are the primary base of protest whereas those whohave no educational qualifications are the most quiescent’ (Parry, Moyser andDay 1992: 75; see also Kaase 1990: 37; Meyer and Tarrow 1998: 13). Thisassociation has even been dubbed an ‘iron law’ (Rucht 2007: 715).
The association is worth probing using WVS in 1990 (n = 1356). That year ischosen as intermediate of the three waves which asked the battery of fivequestions, and as the nearest to the years (1983–1990) in which BSA askedabout participation in strikes. WVS asked one question on education, the ageat which the respondent completed (or expected to complete) full-time school-ing or higher education. There are two important control variables. One is sex,as men protest more than women. The other is age, which commingles life-cycle and cohort effects. Logically, the probability of ever having done some-thing can only increase over the lifetime. Substantively, the hypothesis of anupward trend in protest implies that more recent birth cohorts should havebeen more likely to have protested. The effect of these variables on each formof protest is estimated using logistic regression, entering quadratic terms forage and education. (Results are presented in Appendix S2 in the onlinesupplement.) Figure V shows the predicted probability that the respondenthad ever participated in each form of protest, setting sex to male (the mode)and age to 44 (the median). Note that the probabilities exceed the proportionsin Figure I simply because men protest more than women. For boycott andlawful demonstration, there is a strong positive association with education(both terms tested jointly, p < 0.001), just as the literature claims. There is noassociation, however, for occupation of buildings or factories. The associationfor unofficial strike is negative, though it is not quite statistically significant at
Has protest increased since the 1970s? 153
© London School of Economics and Political Science 2014British Journal of Sociology 66(1)

the conventional level (p = 0.06). Thus the iron law is vindicated for only twoout of four forms of protest. If we combine participation in any of the fourforms, the law holds: someone with a university degree is twice as likely to haveprotested as someone who left school at 14.
This combined result, however, depends on the preponderance of boycottersand lawful demonstrators over unofficial strikers. It will change when strikersare properly counted: recall that 19–20 per cent of adults had gone on strike bythe late 1980s. BSA confirms the negative association between strikes andeducation, controlling again for age and sex (pooling 1983–1990, n = 13,471).Most likely to have gone on strike were people without qualifications andthose who held only the Certificate of Secondary Education (a qualification forless academic pupils, instituted in 1965). Unfortunately BSA did not includethe WVS questions on protest.19 We can, however, illustrate how the measure-ment of strikes would make a difference using WVS in 1990. Choose 19.5 percent of respondents who had gone on strike by taking the 9.5 per cent ofrespondents who had gone on unofficial strike, and then add 10.0 per cent fromindividuals with the highest predicted probability of going on unofficial strike– from logistic regression using age, sex, education, and participation in theother three forms of protest. Then recalculate participation in any of the fourforms of protest – with strikes tout court in place of unofficial strikes – andagain estimate the effect of education, controlling for age and sex. Figure Vdepicts the result as a grey curve. Overall, education has no positive effect.Even if we include signing petitions to create a portmanteau measure ofparticipation, education still has no positive effect.
Although this exercise is approximate, certainly only some forms of protest– demonstrations especially – increase with education. Strikes show the
Figure V: The effect of education on protest (WVS 1990)
.0
.2
.4
.6
14 15 16 17 18 19 20 21
Age of completion of full-time education
Pred
icte
d pr
obab
ility
of e
ver h
avin
gpa
rtic
ipat
ed
Occupation of building/factory
Any of four with all strikes
Any of four
Boycott
Unofficial strike
Lawful demonstration
154 Michael Biggs
© London School of Economics and Political Science 2014 British Journal of Sociology 66(1)

opposite gradient. The characteristics of the average protester will thereforedepend on the numerical significance of each form of protest. In Britain in thelate 1980s, many more adults had been on strike than had been on a lawfuldemonstration or undertaken a boycott. The iron law linking higher educationand protest is sundered – or at least can be preserved only if one redefinesprotest to exclude strikes.
Conclusion
A significant literature claims that protest has increased since the 1970s, usingthe evidence of population surveys. This trend, I have argued, is spurious, atleast for Britain. It is spurious because the surveys do not ask about partici-pation in strikes tout court, and so fail to capture an important form of protest.The question on unofficial strikes is an inadequate substitute, because thedistinction between unofficial and official is ambiguous, because the mostpolitically oriented strikes have been official, and because unofficial strikes –even in their heyday – accounted for a minority of strikers. Surveys that rely onthis question, like WVS, have greatly underestimated participation in strikes.In the 1980s, as BSA reveals, about one in five respondents had gone on strike,which is twice the number who reported (in WVS) having gone on an unofficialstrike, and significantly more than had demonstrated or boycotted. Govern-ment statistics show a severe decline in striking. Adjusting for population, thenumber of strikers fell by 83 per cent from the 1970s to the 2000s (Figure II),while the number of strike-days fell by a whopping 95 per cent (Figure III).This tremendous decline will have overwhelmed the modest increase in par-ticipation in demonstrations (Figure I). Far from increasing, protest in totalmust have declined. Besides inverting the actual trend, the underestimation ofstrikes in surveys also distorts the portrait of the typical protester. At least forBritain in the period before the late 1980s, the inclusion of strikes eliminatesthe positive association between education and protest.
Whether the apparent increase in protest is spurious in other countriesremains to be seen. It will depend on two factors: the trend of strikes and theirimportance compared to other protest events.The importance of strikes variesgreatly across countries. For the period 1975–1989, strikes contributed abouthalf the total participants in ‘unconventional events’ in France, but only 1 percent in Switzerland (Kriesi et al. 1995: 22–3). The trend in strikes, though, isconsistent in developed democracies – downward (e.g. Franzosi 1995). In theUSA, Canada, Australia, New Zealand, France, and Sweden, for example,strikes (especially measured by working days lost) have declined steeply sincethe 1970s and 1980s, almost to extinction (van der Velden et al. 2007: 23; seealso Wallace and O’Sullivan 2006).
To the extent that the pattern found in Britain is a general one, thishas important implications for contemporary democracy. According to the
Has protest increased since the 1970s? 155
© London School of Economics and Political Science 2014British Journal of Sociology 66(1)

literature on political participation, the highly educated exert a disproportion-ate political influence because they are overrepresented among voters (as wellas donors, of course) and also among protesters (e.g. Dalton 2006: 71). Oncestrikes are adequately measured, we see that overrepresentation in protest is arecent development rather than an enduring pattern. Before the 1990s, Britonswith a degree were far more likely to have demonstrated, but less likely tohave gone on strike. Given the prevalence of strikes, the differences cancelledout. Only with the dramatic fall in strikes has protest become the preserve ofthe middle class.This shift has coincided with escalating economic inequality inAnglophone societies. Uncovering the causal relationships between these twotrends is an urgent question for further research (e.g. Kristal 2010; Western andRosenfeld 2011).
One response to my argument is to claim that strikes do not belong to thedomain of political participation, that they do not challenge elites and do notbelong to social movements (to echo the phrases quoted in the introduction).That such a claim could be entertained reflects the marginalization of thelabour movement in academic research, in parallel with its waning politicalpower (Barker et al. 2011; Hetland and Goodwin 2011). Of course scholarsmay define concepts to suit their purpose, so long as the definition is clear;conceivably the trend of ‘protest-minus-strikes’ is worth examining. Neverthe-less, the political significance of strikes deserves recapitulation. Firstly, strikescontest one crucial relationship of power in capitalist societies, betweenemployers and workers, and challenge the reigning ideology that insists on theinevitability and legitimacy of ‘market’ outcomes. Secondly, many strikestarget the state directly as employer. Thirdly, some strikes inconvenience thepublic as consumers or disrupt the economy, which invites intervention by thegovernment. Fourthly, some strikes lead to physical confrontation betweenpicketers and strike-breakers, thereby directly implicating the state as guaran-tor of public order. All four points are exemplified by the coalminers’ strike in1984, which ‘challenged the very core of Thatcherism’s strategy towards thenationalized industries in particular and the trade union movement in general’(Richards 1996: 1). The climactic clash between picketers and police atOrgreave colliery involved at least ten thousand combatants. Over the courseof the strike, eleven hundred workers were arrested. The Prime Ministerfamously denounced the strikers as ‘the enemy within’ – ‘more difficult to fight,and more dangerous to liberty’ than the foreign state with which her govern-ment had just been at war. Defining a category of political participation whichexcludes this strike would seem eccentric if not perverse.
This article has highlighted the limitations of population surveys for tracingprotest – compared, for example, to voting. One limitation is the problem ofsmall numbers. Most people vote; few protest. Surveys therefore questionrespondents about their actions over a long (and often indeterminate, as inWVS) time horizon – smoothing away the jagged temporality of protest,
156 Michael Biggs
© London School of Economics and Political Science 2014 British Journal of Sociology 66(1)

eliminating its volatility (compare Figure I with Figures II and III). Yet theessential character of protest is that it occurs in waves (Biggs 2003, 2005;Koopmans 2004). Another limitation is the condensation of past action into abinary response. While an individual can vote only once at determined inter-vals, an individual can join multiple protest events, and events can extend fora long time. Protest clusters socio-spatially as well as temporally. The point ismost readily made by example. In the late 1980s, coalminers represented only3–5 per cent of adults who had ever gone on strike, according to BSA.And yetin the period 1980–95 they accounted for half of all participant-days in strikes– and only slightly under half of all participant-days in strikes, demonstrations,and occupations.20 In short, the volume of protest bears little relation to thenumber of people who have ever protested. Surveys can partially overcomethis problem by asking respondents not just whether but also how many timesthey had undertaken a particular form of protest (Saunders et al. 2012). Mostimportantly, event catalogues deserve greater investment.21
Finally, this creation of a spurious trend is an interesting case in the sociol-ogy of knowledge. Social scientists in the early 1970s innovated measurementtools for a particular theoretical purpose and in a particular historical context.Given the importance of unofficial strikes on the British political agenda, andgiven the goal of measuring gradations of willingness to protest, it was reason-able to focus exclusively on this specific type of strike. But labour-capitalconflict was rapidly transformed. In the same year that Marsh conducted hissurvey, a scholar of industrial relations observed that ‘the niggly unofficialstrikes which seemed to be bringing Britain to the verge of economic destruc-tion only five years ago are lessening in significance because of the massive andlengthy confrontations’ – official strikes – ‘that have become part of the indus-trial scene’ (Silver 1973: 98). Once PAS had asked the battery of questionsacross several countries, the methodological imperative was to replicate it insubsequent surveys – despite the transformation of the social phenomenon tobe measured. Thus WVS adopted the same questions (albeit extending thetime horizon, a difference curiously ignored), in effect fossilizing andglobalizing the peculiarities of Britain in the early 1970s.22 As a standardbattery of questions is deployed in multiple surveys, it comes to define thephenomenon itself. Rather than conceptualizing the phenomenon of theoreti-cal interest and interrogating various sources of evidence on it, social scientistssimply download a convenient dataset. The conclusion is not, of course, toavoid systematic data collection. The point is to understand how our measure-ment tools can blinker as well as illuminate.
(Date accepted: June 2014)
Has protest increased since the 1970s? 157
© London School of Economics and Political Science 2014British Journal of Sociology 66(1)

Notes
1. This research was supported by the JohnFell OUP Research Fund (072/616) andscrutinized by audiences at the University ofEssex, the London School of Economics andPolitical Science, the Social Science HistoryAssociation, and the American SociologicalAssociation.Thanks to Colin Barker,AlexeyBessudnov, Toby Boraman, Paolo Campana,Neal Caren,Tak Wing Chan, Neli Demireva,Matt Dennes, Ruth Dixon, Barry Eidlin,John Ermisch, Geoff Evans, Stephen Fisher,Neil Ketchley, Alan Marsh, Carlos Lagorio,Olga Onuch, David Pettinicchio, ChrisRootes, Clare Saunders, Tianjiao Shang,Abigail Slenski, and Katherine Stovel.2. In non-democratic states, by contrast,petitioning is costly because public dissentwill draw retaliation (e.g. Glaeser 2011: 480).3. ‘Potential’ was also theoretically moti-vated, as Marsh was arguing against the ste-reotype that the British were deferential(Almond and Verba 1963); willingness toprotest counted as contrary evidence.Rootes (1981) elaborates an important cri-tique of protest potential.4. Legislation passed in 1990 sharpened thedistinction by forcing trade unions to repu-diate unofficial strikes in writing (Lyddon2007: 345).5. The first wave of WVS usually includedtwo other questions from PAS, on vandalismand violence. In the fifth wave, the two ques-tions on occupation and unofficial strikeswere often dropped.6. Questionnaires in many other languagesuse the equivalent of ‘wildcat’ rather than‘unofficial’ strike (French sauvage, Germanwilder, Italian selvaggio). In the Britishcontext, at least, the terms are not synony-mous; wildcat implies a strike against theunion rather than merely unauthorized byit (Marsh and Evans 1973: 330, 347).Cross-national analysis cannot ignore theseterminological variations and associatedinstitutional differences; in Germany, forexample, a wilder Streik is illegal (Muller1979: 39, 41). A question about participationin strikes tout court would surely be less sen-
sitive to cross-national differences. I owe thepoint about translation to Paolo Campana.7. European Values Study Group andWorld Values Survey Association 2006;World Values Survey Association 2009. Thefile process_wvs.do (part of the online Sup-porting Information) contains Stata com-mands to replicate the analysis. Thedenominator excludes ‘don’t know’; thisresponse accounted for less than 6% of anyquestion.8. Trends are estimated by logistic regres-sion with year as independent variable. Allp-values reported are two-tailed.9. To justify further restrictive legislation,the government published rough estimatesfor 1987–1988 (Secretary of State forEmployment 1989: 1). Unofficial strikesaccounted for over 2 million out of 7.2million working days lost; no figures wereprovided for workers involved.10. Major surveys of British political par-ticipation in 1984 and 2000 are unsuitablebecause the strike question was circum-scribed – ‘about an issue which you feel ispolitical’ and ‘to influence rules, laws, orpolicies’, respectively – and because theyspecified shorter time horizons (Parry,Moyser and Day 1992; Pattie, Seyd andWhiteley 2004).11. British Social Attitudes Survey n.d. Thefile process_bsa.do (part of the online Sup-porting Information) contains Stata com-mands to replicate the analysis. Thedenominator excludes ‘don’t know’ and ‘notanswered’, which together accounted for1%. Note that BSA includes respondentsaged 18 and over, while WVS starts at 15.12. Work stoppages include lockoutsas well as strikes, a distinction blurred inprinciple and in practice. By any reckoning,lockouts represent a tiny fraction of thetotal.13. Rootes (2003) compiles environmentalprotests from 1988 to 1997. Appearing afterthe completion of this article, Bailey (2014)catalogues all types of protest but only fromselected intervals between 1978 and 2012.
158 Michael Biggs
© London School of Economics and Political Science 2014 British Journal of Sociology 66(1)

14. Francisco n.d. The file process_kansas.do (part of the online SupportingInformation) contains Stata commands toreplicate the analysis.15. My judgment comes from newspapers(Guardian, Financial Times, The Times) andnewswires (Associated Press, Reuters).16. EPCD records two million participantsin this event, but the source referred to a dipin electricity equivalent to this number oflightbulbs, suggesting at most hundreds ofthousands of people (The Times, 19 October1992).17. Ongoing events are identified as havingthe same characteristics (type of action,identity of protesters, target, issue, descrip-tion of event, location, and nation) on suc-cessive days.18. This method underestimates participa-tion in longstanding occupations, of course,because it does not account forcirculation of people staying for a brieftime. As with strikes, participant-days is asuperior measure.19. BSA asks whether the respondent hadever gone ‘on a protest or demonstration’about ‘a government action which you
thought was unjust or harmful’ but this for-mulation elicits a significantly lower propor-tion than the WVS question on lawfuldemonstrations.20. In BSA, coalminers are identified byindustry classification (coal extraction); thiscalculation is restricted to years followingthe great strike (thus omitting 1983–1984).The calculation from EPCD countscoalminers only, and not protest by theirwives or supporters.21. Note that analyses of protest events mayalso exclude strikes (e.g. Soule and Earl2005: 362; Walker, Martin and McCarthy2008: 46).22. The question on lawful demonstrationsalso bears the imprint of the democraticsystems in the ambit of PAS, where demon-strations are only exceptionally unlawful.When extended to newly democratic or evenauthoritarian countries by WVS, this ques-tion has the same disability as that on unof-ficial strikes: many demonstrations areunlawful and so the number of respondentsparticipating in strictly lawful ones repre-sents the tip of an iceberg. I owe this obser-vation to Neal Caren and Olga Onuch.
Bibliography
Almond, G.A. and Verba, S. 1963 The CivicCulture: Political Attitudes and Democracyin Five Nations, Princeton UniversityPress.Bailey, D. 2014 ‘Contending the Crisis:WhatRole for Extra-Parliamentary British Poli-tics?’, British Politics 9(1): 68–92.Barker, C., Cox, L., Krinsky, J. and Nilsen,A.G. 2011 ‘Marxism and Social Movements:An Introduction’ in Barker, Cox, Krinskyand Nilsen (eds) Marxism and Social Move-ments, Leiden: Brill.Barnes, S.H. and Kaase, M. (eds) 1979Political Action: Mass Participation in FiveWestern Democracies, Beverly Hills andLondon: Sage.Biggs, M. 2003 ‘Positive Feedback in Collec-tive Mobilization: The American Strike
Wave of 1886’, Theory and Society 32(2):217–54.Biggs, M. 2005 ‘Strikes as Forest Fires:Chicago and Paris in the Late 19th Century’,American Journal of Sociology 110(6): 1684–714.Biggs, M. 2006 ‘Who Joined the Sit-insand Why: Southern Black Students inthe Early 1960s’, Mobilization 11(3): 241–56.British Social Attitudes Survey n.d. Cumu-lative File 1983–1991 (SN 2955), UK DataService.Caren, N., Ghoshal, R.A. and Ribas, V. 2011‘A Social Movement Generation: Cohortand Period Trends in Protest Attendanceand Petition Signing’, American SociologicalReview 76(1): 125–51.
Has protest increased since the 1970s? 159
© London School of Economics and Political Science 2014British Journal of Sociology 66(1)

Corcoran, K.E., Pettinicchio, D. and Young,J.T.N. 2011 ‘The Context of Control: ACross-National Investigation of the LinkBetween Political Institutions, Efficacy, andCollective Action’, British Journal of SocialPsychology 50(4): 575–605.Crouch, C. 1978 ‘The Intensification ofIndustrial Conflict in the United Kingdom’in C. Crouch and A. Pizzorno (eds) TheResurGence of Class Conflict in WesternEurope Since 1968, vol. 1, London:Macmillan.Dalton, R.J. 2006 Citizen Politics: PublicOpinion and Political Parties in AdvancedIndustrial Democracies, 4th ed., Washington,DC: CQ Press.Dalton, R.J. 2008a Citizen Politics: PublicOpinion and Political Parties in AdvancedIndustrial Democracies, 5th ed., Washington,DC: CQ Press.Dalton, R.J. 2008b ‘Citizenship Norms andthe Expansion of Political Participation’,Political Studies 56(1): 76–98.Dalton, R.J., Van Sickle, A. and Weldon, S.2010 ‘The Individual-Institutional Nexus ofProtest Behaviour’, British Journal of Politi-cal Science 40(1): 51–73.Darlington, R. and Lyddon, D. 2001 Glori-ous Summer: Class Struggle in Britain, 1972,London: Bookmarks.Department of Employment 1972a ‘Stop-pages of Work Due to Industrial Disputes in1971’, Department of Employment GazetteMay: 438–46.Department of Employment 1972b ‘Newsand Notes’, Department of EmploymentGazette September: 810–12.Dodson, K. 2011 ‘The Movement Society inComparative Perspective’, Mobilization16(4): 475–94.Eldridge, J.E.T. and Cameron, G.C. 1964‘Unofficial Strikes: Some Objections Con-sidered’, British Journal of Sociology 15(1):19–37.European Values Study Group and WorldValues Survey Association 2006 Four-WaveIntegrated Data File, 1981–2004, version20060423, file produced by ASEP/JDS,Madrid, and Tilburg University, file distrib-uted by ASEP/JDS and GESIS, Cologne.
Francisco, R.A. 2009 Dynamics of Conflict,New York: Springer.Francisco, R.A. n.d. European Protest andCoercion Data, 1980–1995, http://web.ku.edu/~ronfrand/data/index.html (accessed 18December 2012).Franzosi, R. 1989 ‘One Hundred Years ofStrike Statistics: Methodological and Theo-retical Issues in Quantitative StrikeResearch’, Industrial and Labor RelationsReview 42(3): 348–62.Franzosi, R. 1995 The Puzzle of Strikes:Class and State Strategies in Postwar Italy,Cambridge University Press.Gall, G. and Cohen, S. 2013 ‘The CollectiveExpression of Workplace Grievances inBritain’ in G. Gall (ed.) New Forms andExpressions of Conflict at Work, Basing-stoke: Palgrave Macmillan.Gennard, J. 1971 ‘Chronicle: IndustrialRelations in the United Kingdom’, BritishJournal of Industrial Relations 9(1): 92–102.Glaeser, A. 2011 Political Epistemics: TheSecret Police, the Opposition, and the End ofEast German Socialism, University ofChicago Press.Hetland, G. and Goodwin, J. 2011 ‘TheStrange Disappearance of Capitalism fromSocial Movement Studies’ in C. Barker, L.Cox, J. Krinsky and A.G. Nilsen (eds)Marxism and Social Movements, Leiden:Brill.Inglehart, R. 1997 Modernization andPostmodernization: Cultural, Economic, andPolitical Change in 43 Societies, PrincetonUniversity Press.Kaase, M. 1990 ‘Mass Participation’ in M.K.Jennings and J.W. van Deth (eds) Continu-ities in Political Action:A Longitudinal Studyof Political Participation in Three WesternDemocracies, Berlin: De Gruyter.Koopmans, R. 2004 ‘Protest in Time andSpace: The Evolution of Waves of Conten-tion’ in D.A. Snow, S.A. Soule and H. Kriesi(eds) The Blackwell Companion to SocialMovements, Oxford: Blackwell.Kriesi, H., Koopmans, R., Dyvendak, J.W.and Giugni, M.G. 1995 New Social Move-ments in Western Europe: A ComparativeAnalysis, University of Minnesota Press.
160 Michael Biggs
© London School of Economics and Political Science 2014 British Journal of Sociology 66(1)

Kristal, T. 2010 ‘Good Times, Bad Times:Postwar Labor’s Share of National Incomein Capitalist Democracies’, American Socio-logical Review 75(5): 729–63.Latour, B. 1999 Pandora’s Hope: Essays onThe Reality of Science Studies, Harvard Uni-versity Press.Lyddon, D. 2007 ‘From Strike Wave to StrikeDrought: The United Kingdom, 1968–2005’in S. van der Velden, H. Dribbusch, D.Lyddon and K. Vandaele (eds) StrikesAround the World, 1968–2005: CaseStudies of 15 Countries, Amsterdam:Aksant.Marsh, A. 1974 ‘Explorations in Unortho-dox Political Behaviour: A Scale to Measure“Protest Potential” ’, European Journal ofPolitical Research 2(2): 107–22.Marsh, A. 1976 ‘The Social Psychology ofPolitical Protest: A U.K. National Survey ofPolitical Attitudes and Behaviour’, PhDthesis, London School of Economics andPolitical Science.Marsh, A. 1977 Protest and Political Con-sciousness, Beverly Hills: Sage.Marsh, A.I. and Evans, E.O. 1973 The Dic-tionary of Industrial Relations, London:Hutchinson Educational.McAdam, D., McCarthy, J, Olzak, S. andSoule, S. n.d. Dynamics of CollectiveAction, http://www.stanford.edu/group/collectiveaction/ (accessed 3 July 2012).Meyer, D.S. and Tarrow, S. 1998 ‘A SocialMovement Society: Contentious Politics fora New Century’ in Meyer and Tarrow (eds)The Social Movement Society: ContentiousPolitics for a New Century, Lanham, Mary-land: Rowman & Littlefield.Moran, M. 1977 The Politics of IndustrialRelations:The Origins, Life, and Death of the1971 Industrial Relations Act, London:Macmillan Press.Muller, E.N. 1979 Aggressive Political Par-ticipation, Princeton University Press.Neidhardt, F. and Rucht, D. 1993 ‘Auf demWeg in die “Bewegungsgesellschaft”?’,Soziale Welt, 44(3): 305–26.Norris, P. 2002 Democratic Phoenix: Rein-venting Political Activism, Cambridge Uni-versity Press.
Osborne, T. and Rose, N. 1999 ‘Do theSocial Sciences Create Phenomena? TheExample of Public Opinion Research’,British Journal of Sociology 50(3): 367–96.Parkin, F. 1968 Middle-Class Radicalism:The Social Basis of the British Campaign forNuclear Disarmament, Manchester Univer-sity Press.Parry, G., Moyser, G. and Day, N. 1992Political Participation and Democracy inBritain, Cambridge University Press.Pattie, C., Seyd, P. and Whiteley, P. 2004Citizenship in Britain: Values, Participation,and Democracy, Cambridge UniversityPress.Piven, F.F. and Cloward, R.A. 1977 PoorPeople’s Movements: Why They Succeed,How They Fail, New York: Pantheon Books.Power Inquiry 2006 Power to the People:TheReport of Power: An Independent Inquiryinto Britain’s Democracy, York: PowerInquiry.Richards, A.J. 1996 Miners on Strike: ClassSolidarity and Division in Britain, Oxford:Berg.Rootes, C.A. 1981 ‘On the Future of ProtestPolitics: A Critique of Barnes, Kaase et al.,Political Action’, European Journal of Politi-cal Research 9(4): 421–32.Rootes, C. 2003 ‘The Resurgence of Protestand the Revitalisation of British Democ-racy’ in P. Ibarra (ed.) Social Movements andDemocracy, New York: Palgrave Macmillan.Rootes, C. and Saunders, C. 2005 ‘SocialMovements in Britain Since the 1960s’,DEMOS Working Paper 1/2005.Royal Commission on Trade Unions andEmployers’ Associations 1968 Report, Par-liamentary Papers, Cmnd 2623.Rucht, D. 1998 ‘The Structure and Cultureof Collective Protest in Germany Since1950’ in D. Meyer and S. Tarrow (eds) TheSocial Movement Society: Contentious Poli-tics for a New Century, Lanham, Marylandand Oxford: Rowman & Littlefield.Rucht, D. 2007 ‘The Spread of Protest Poli-tics’ in R.J. Dalton and H.-D. Klingemann(eds) The Oxford Handbook of PoliticalBehavior, Oxford University Press.
Has protest increased since the 1970s? 161
© London School of Economics and Political Science 2014British Journal of Sociology 66(1)

Saunders, C., Grasso, M., Olcese, C.,Rainsford, E. and Rootes, C. 2012 ‘Explain-ing Differential Protest Participation:Novices, Returners, Repeaters, and Stal-warts’, Mobilization 17(3): 263–80.Savage, M. 2010. Identities and SocialChange in Britain since 1940: The Politics ofMethod, Oxford University Press.Secretary of State for Employment 1989Unofficial Action and the Law: Proposals toReform the Law Affecting Unofficial Indus-trial Action, Parliamentary Papers, Cm 821.Silver, M. 1973 ‘Recent British StrikeTrends: A Factual Analysis’, British Journalof Industrial Relations 11(1): 66–98.Soule, S.A. and Earl, J. 2005 ‘A MovementSociety Evaluated: Collective Protest in theUnited States’, Mobilization, 10(3): 345–64.Taylor, V. and Van Dyke, N. 2004 ‘ “Get Up,Stand Up”: Tactical Repertoires of SocialMovements’ in D.A. Snow, S.A. Soule andH. Kriesi (eds) The Blackwell Companion toSocial Movements, Oxford: Blackwell.Thomas, N. 2002 ‘Challenging Myths of the1960s: The Case of Student Protest inBritain’, Twentieth Century British History13(3): 277–97.van der Velden, S., Dribbusch, H., Lyddon,D. and Vandaele, K. (eds) 2007 StrikesAround the World, 1968–2005: Case Studiesof 15 Countries, Amsterdam: Aksant.Walker, E.T., Martin A.W. and McCarthy,J.D. 2008 ‘Confronting the State, the Corpo-ration, and the Academy: The Influence ofTargets on Social Movement Repertoires’,American Journal of Sociology 114(1):35–76.
Wallace, J. and O’Sullivan, M. 2006 ‘Con-temporary Strike Trends since 1980: PeeringThrough the Wrong End of the Telescope’ inM. Morley, P. Gunnigle and D.G. Collings(eds) Global Industrial Relations, London:Routledge.Western, B. and Rosenfeld, J. 2011 ‘Unions,Norms, and the Rise in U.S. Wage Inequal-ity’, American Sociological Review 76(4):513–37.World Values Survey Association 2009Official Aggregate, 1981–2008, version20090901, file produced by ASEP/JDS,Madrid.
Supporting Information
Additional Supporting Information may befound in the online version of this article atthe publisher’s website:
Appendix S1: Statistics on strikesAppendix S2: Determinants of participa-tionTable S1: Determinants of participation inprotest (WVS 1990)Table S2: Determinants of participation instrikes (BSA 1983–87, 1989–90)Table S3: Statistics on strikesprocess_bsa.do: Stata do-file for the BritishSocial Attitudes Surveyprocess_kansas.do: Stata do-file for theEuropean Protest and Coercion Datasetprocess_wvs.do: Stata do-file for the WorldValues Surveystrikes.txt: tab-delimited data file with statis-tics on strikes
162 Michael Biggs
© London School of Economics and Political Science 2014 British Journal of Sociology 66(1)