harvesting multiple sources for user profile learning: a...
TRANSCRIPT

Harvesting Multiple Sources for User Profile Learning: a Big Data Study
Aleksandr Farseev, Liqiang Nie, Mohammad Akbari, and Tat-Seng Chua

What is user profile?
2

What is human mobility?• Mobility - contemporary paradigm, which
explores various types of people movement.
3

What is human mobility?• Mobility - contemporary paradigm, which
explores various types of people movement.
• The movement of people
• The quality or state of being mobile
• (Physiology) the ability to move physically
• (Sociology) movement within or between socialclasses and occupations
• (Chess) the ability of a chess piece to move around the board
4

Why human mobility?
• Urban planning: understand the city and optimize services
• Mobile applications and recommendations: study the user and offer services
5

6
If we want to know more?Mobility can describe people

7
MarketingTrade are analysisDemography and interest - based
marketingWellness
Health group predictionLifestyle
recommendation
AdvertisementDemography and interest - based
personalized advertisement
AssistanceActivity
recommendation,Venue
recommendation,Etc.
Tent to stay at home,visit local pubs and shopping mall daily.
Medium overweight,potential hypertonia
and diabetes.
Advertise new Beer brand and new car
models.
Morning excursivewith medium
intensity.
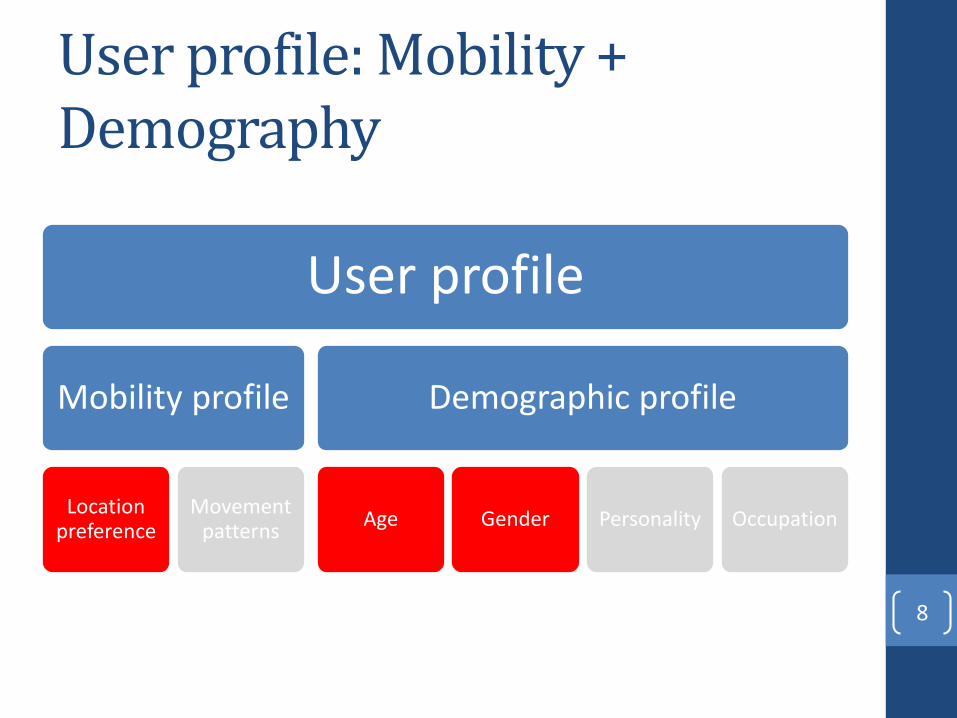
User profile: Mobility + Demography
8
User profile
Mobility profile
Location preference
Movement patterns
Demographic profile
Age Gender Personality Occupation
9
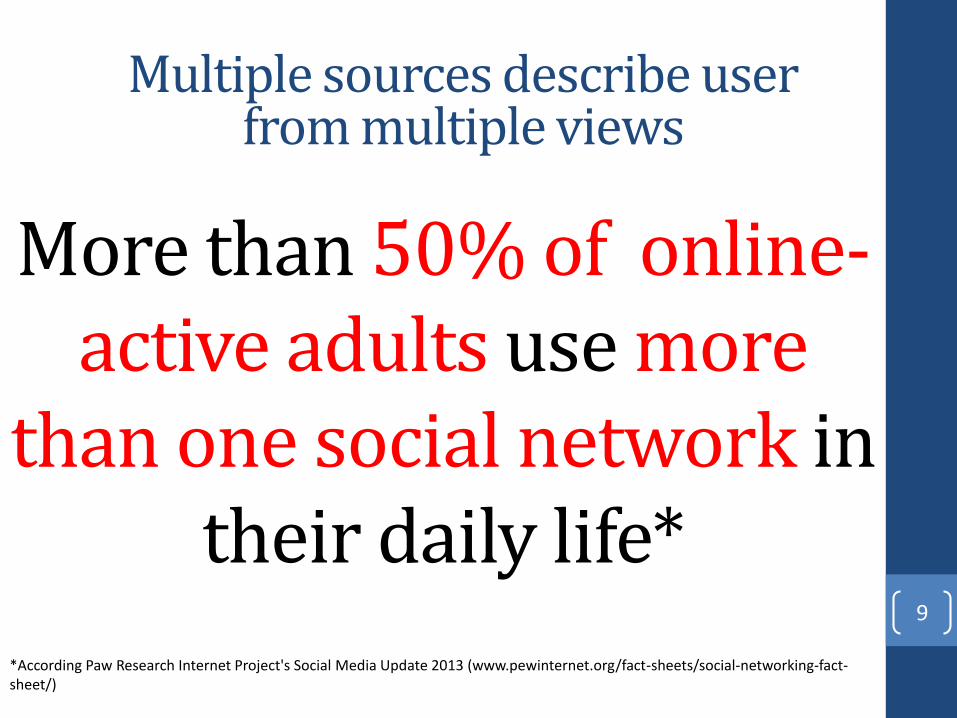
More than 50% of online-active adults use more
than one social network in their daily life*
*According Paw Research Internet Project's Social Media Update 2013 (www.pewinternet.org/fact-sheets/social-networking-fact-sheet/)
Multiple sources describe user from multiple views

10
Multiple sources describe user from multiple views

Research Problems
11
Multi-source user profiling:• Geographical user mobility profiling• User demographic profiling• Data incompleteness• Multi–source multi–modal data
integration

Multi-source dataset:NUS-MSS*
12
*http://lms.comp.nus.edu.sg/research/NUS-MULTISOURCE.htm

NUS-MSS: Data sources
13
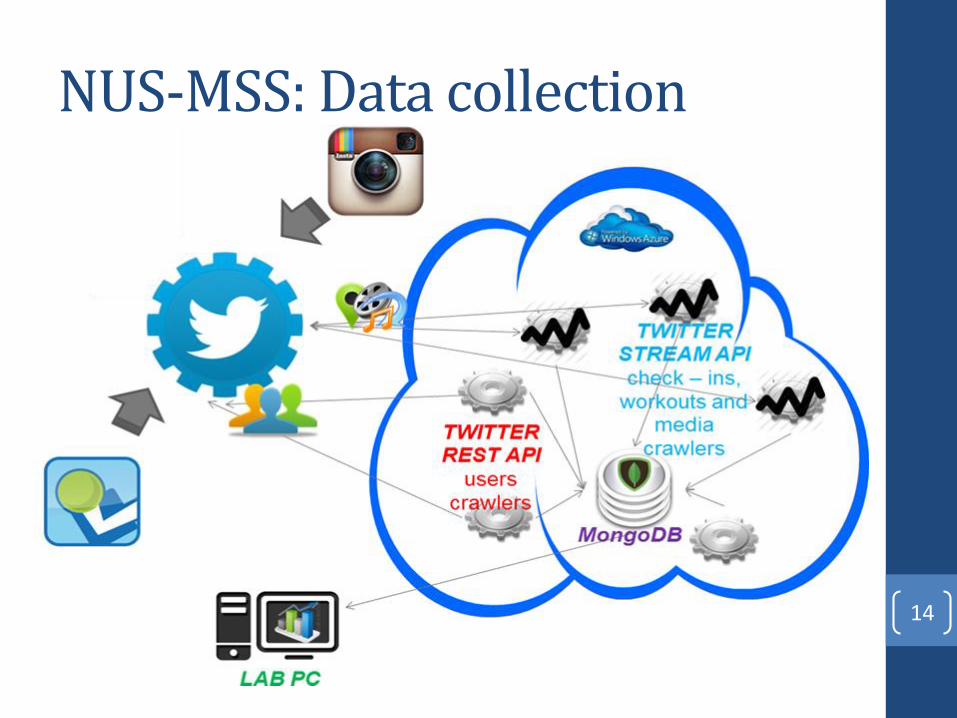
NUS-MSS: Data collection
14
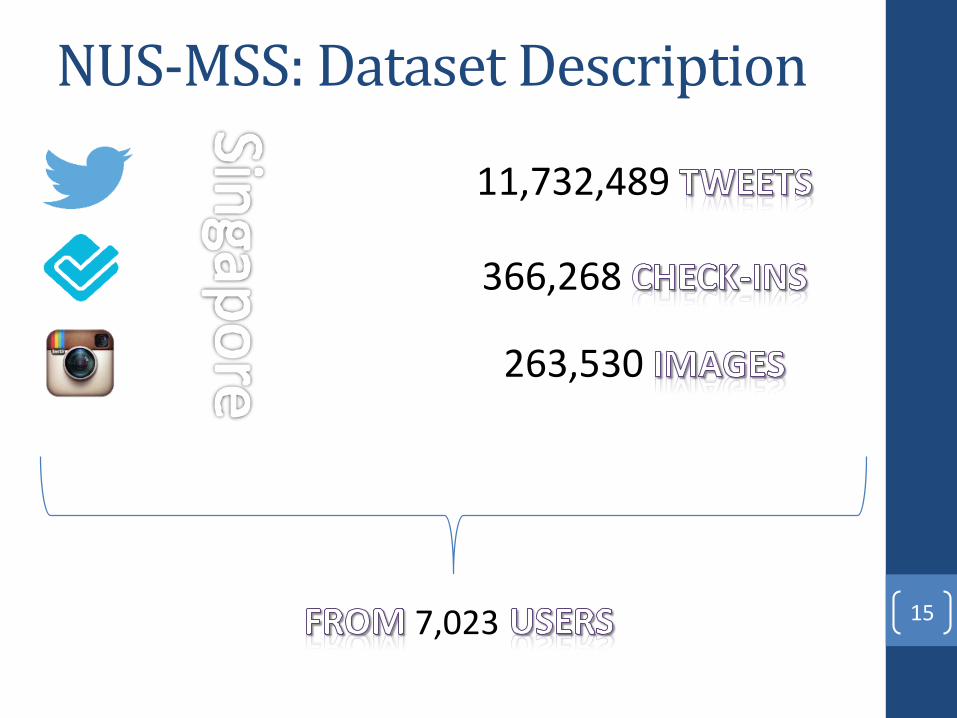
NUS-MSS: Dataset Description
15
11,732,489
366,268
263,530
7,023

16
2,973,162
127,276
65,088
5,503
NUS-MSS: Dataset Description

17
5,263,630
304,493
230,752
7,957
NUS-MSS: Dataset Description

NUS-MSS: Dataset Statistics in Singapore
18

Demographic profiling
19

User profile: Mobility + Demography
20
User profile
Mobility profile
Location preference
Movement patterns
Demographic profile
Age Gender Personality Occupation

Data representation
• Linguistic features• LIWC
• User Topics
• Heuristic features• Writing behavior
21
A text analysis software.
Dictionary Word category
Pe
rcen
tage (%
)
Qm
ark
sU
niq
ue
Dic
Six
ltr
fun
ct
pro
no
un
pp
ron i
we
yo
us
he
he
the
yip
ron
art
icle
ve
rba
ux
ve
rbp
as
tp
res
en
tfu
ture
ad
ve
rbp
rep
sc
on
jn
eg
ate
qu
an
tn
um
ber
sw
ear
so
cia
lfa
mil
y
0
20
40
60
80An efficient and
effective method for studying the various emotional, cognitive,
structural, and process components present in individuals' verbal and
written speech samples. Can be highly related to
one’s demography.

Data representation
• Linguistic features• LIWC
• User Topics
• Behavioral features• Writing behavior
22
Users of similar gender and age may talk about
similar topics e.g. female users – about
shopping, male – about cars; youth – about
school while elderly –about health.
LDA word distributionover 50 topics for collected
Twitter timeline.

Data representation
• Linguistic features• LIWC
• User Topics
• Heuristic features• Writing behavior
23
As we mention from our research – user’s writing behavioral patterns are highly correlated with e.g. age (individuals
from 10 – 20 years old are making two times
less grammatical errorsthan 20 -30 years old
individuals)
Feature name Description
Number of hash tags Number of hash tags mentioned in message
Number of slang words Number of slang words one use in his tweets. We calculate
number of slang words / tweet and compute average slang
usage
Number of URLs Number of URL’s one usually use in his/her tweets
Number of user mentions Number of user mentions – may represent one’s social activity
Number of repeated chars Number of repeated characters in one tweets (e.g. noooooooo,
wahhhhhhh)
Number of emotion words Number of words that are marked with not – neutral emotion
score in Sentiment WordNet
Number of emoticons Number of common emoticons from Wikipedia article
Average sentiment level Module of average sentiment level of tweet obtained from
Sentiment WordNet
Average sentiment score Average sentiment level of tweet obtained from Sentiment
WordNet
Number of misspellings Number of misspellings fixed by Microsoft Word spell checker
Number Of Mistakes Number of words that contains mistake but cannot be fixed by
Microsoft Word spell checker
Number of rejected tweets Number of tweets where 70% of words either not in English or
cannot be fixed by Microsoft Word spell checker
Number of terms average Average number of terms per / tweet
Number of Foursquare check-
ins
Number of Foursquare check-ins performed by user
Number of Instagram medias Number of Instagram medias posted by user
Number of Foursquare tips Number of Foursquare Tips that user post in a venue
Average time between check-
ins min
Average time between two sequential check-ins - represents
Foursquare user activity frequency

Data representation
• Location features
• Location semantics
• Location topics
24
Venue semantics such as venue categories can be
related to users demography. E.g.
individuals who tent to visit night clubs are
usually belong to 10 – 20 or 20 – 30 years old age
groups.
𝑪𝒂𝒕𝒆𝒈𝒐𝒓𝒚𝟏 … 𝑪𝒂𝒕𝒆𝒈𝒐𝒓𝒚𝒓𝒆𝒔𝒕𝒂𝒖𝒓𝒂𝒏𝒕 … 𝑪𝒂𝒕𝒆𝒈𝒐𝒓𝒚𝒂𝒊𝒓𝒑𝒐𝒓𝒕 … 𝑪𝒂𝒕𝒆𝒈𝒐𝒓𝒚𝒏
𝑼𝟏 0 0 2 0 1 0 0
… * * * * * * *
𝑼𝒏 * * * * * * *
For case when user performed check-ins in two restaurantsand airport but did not perform check-ins in other venues:
We map all Foursquare check – ins to Foursquare categoriesfrom category hierarchy.

Data representation
• Image features
• Image concept learning
25
Extracted image concepts may represents
user interests and be related to one’s
demography. For example female user may take pictures of flowers, food, while
male – of cars or buildings.
*The concept learning Tool was provided by Lab of Media Search LMS.It was evaluated based on ILSVRC2012 competition dataset and performed with average accuracy @10 - 0.637

Ensemble learning
26

Ensemble learning
27
𝑆𝑐𝑜𝑟𝑒 𝑙 =
𝑖=0
𝑘𝑃(𝑙)𝑖 × 𝑑𝑖 × 𝑤𝑖 × 𝑙𝑖
𝑘
𝑃(𝑙)𝑖 - model prediction confidence𝑑𝑖 - normalized data records number𝑤𝑖 - model trust weight𝑙𝑖 - model “strength” – learned by “Hill Climbing” optimization with step 0.05
𝑑𝑖 × 𝑤𝑖 × 𝑙𝑖
𝑆𝑐𝑜𝑟𝑒𝑟(𝑙)

Ensemble learning details
28*N. V. Chawla, K. W. Bowyer, L. O. Hall, and W. P. Kegelmeyer. Smote: synthetic minority over-sampling technique. Journal of artificialintelligence research, 2002.
**An iterative algorithm that starts with an arbitrary solution to a problem, then attempts to find a better solutionby incrementally changing a single element of the solution. If the change produces a better solution, an incremental change is madeto the new solution, repeating until no further improvements can be found.
According to our evaluation, the bias of estimated ages does not exceed ±2.28 years. It is thus reasonable to use the estimated age for age group prediction task.
We have adopted SMOTE* oversampling to obtain balanced age-group labeling
By performing 10-fold cross validation, we determine the optimal number of constructed random trees for each classifier with iteration step equal to 5 as 45, 25, 35, 40, 105 random trees for Random Forest Classifiers learned based on location, LIWC, heuristic, LDA 50, and image concept features respectively.
We jointly learn the limodel “strength” coefficient by performing “Hill Climbing” optimization* * with step 0.05. The randomized “Hill Climbing” approach is able to obtain local optimum for non-convex problems and, thus, can produce resolvable ensemble weighting.

Experimental results (Singapore)
29

Demographic mobility
30

User profile: Mobility + Demography
31
User profile
Mobility profile
Location preference
Movement patterns
Demographic profile
Age Gender Personality Occupation

Geographical user mobility: users movement (city level)
32

Geographical user mobility: users movement (city level)
• Singapore population is concentrated in several regions, which represent peoples' housing (Regions 2 and 3) and working (Region 3) areas.
• There are some regions where male (Blue markers) user check-in density is much higher than female (Pink markers).
33
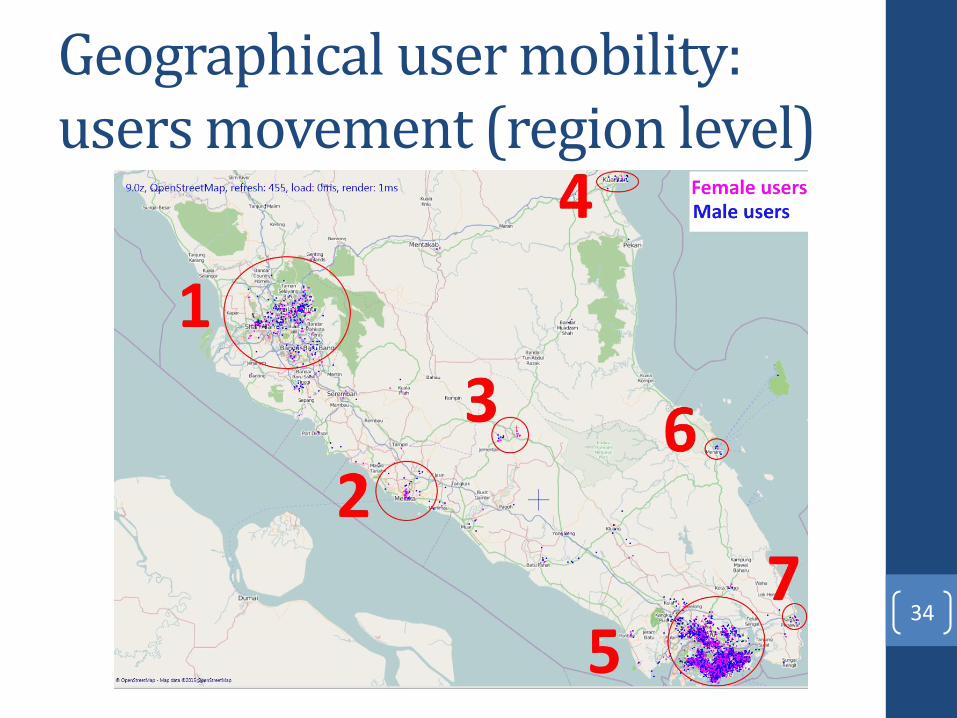
Geographical user mobility: users movement (region level)
34

Geographical user mobility: users movement (region level)
• Both female and male users often perform trips to nearby cities for shopping and leisure purposes (Regions 1, 2, 4, 5).
• Regions 2 and 3 are popular among female users, since 2 is “Malacca resorts”, while 3 – National park. Both regions are famous by it’s family time spending facilities.
35

36
Geographical user mobility: users movement (city level)

Geographical user mobility: users movement (city level)
37
• Teenagers and children (Brown markers) mostly perform check-ins in housing city areas and around schools (Regions 1,2,3,5).
• Students (Green markers) and working professionals (Blue and Red markers) are concentrated in city center (Region 4).
37

Geographical user mobility: users movement (region level)
38

Geographical user mobility: users movement (region level)
• Young users (brown circles) are rarely travel to nearby cities due to their age (Region 3)
• Adults (green circles) often make such trips (Regions 1 and 2). These users may be students or young professionals who visit their families during weekends.
39

Dataset Statistics: Content
40

Geographical user mobility: venue semantics profiling• We extract location
topics based on venue categories to model user mobility semantics
41
Location topics may serve as an user interest
clusters for distinguishing user
demography attributes such as age or gender.
LDA word distributionover 6 topics for
collected Foursquare check-ins.
Every venue category is considered as a
word, each Foursquare user - as
a document

42
Geographical user mobility: venue semantics profiling

43
Geographical user mobility: venue semantics profiling
• Male users more often do shopping than male, while female users often show-up in job-related venues.
• > 30 years old users often show-up in dining-related places, while < 20 – often visit education-related venues.
Future work
44

Future work: Extended User ProfilingExtended Demographic Profiling: • Occupation detection;
• Personality detection;
• Social status detection.
Extended Mobility Profiling : • User communities detection and profiling (In
terms of demographics, movement patterns, multi-source interests);
• Cross-region mobility profiling (comparison of users’ mobility across different regions and cultures). 45

Future work: Sensor Data Incorporation & Wellness ResearchWellness lifestyle recommendation via:
• Chronic diseases tendency prediction
• Cross-source causality relationships analysis (just like Ramesh Jain proposed*)
46
*Ramesh Jain, Laleh Jalali: Objective Self. IEEE MultiMedia 21(4): 100-110 (2014)

Future work: How the framework may look like
47

Other task based on NUS-MSS
1. Demographic profile learning
2. Multi-source data fusion
3. Individual and group mobility analysis
4. Cross-source user identification
5. Cross-region user community detection
6. Cross-source causality relationships extraction
7. Users’ privacy-related and cross-disciplinaryresearch
48

Conclusions1. We constructed and released a large multi-
source multi-modal cross-region “NUS-MSS”dataset;
2. We conducted first-order and higher-orderlearning for user mobility and demographicprofiling;
3. New multi-modal features were proposed for ademographic profile learning.
4. Based on our experimental results, we canconclude that multi-source data mutuallycomplements each other and their appropriatefusion boosts the user profiling performance.
49
Thank you!
50

You could download NUS-MSSdataset from:
http://lms.comp.nus.edu.sg/research/NUS-MULTISOURCE.htm
ORhttp://nusmultisource.azurewebsites.net
Aleksandr FarseevNational University of Singapore
e-mail: [email protected]

52

53
* Ground truth construction

54
* Multi-source user Id mapping

Retweet filter – filters out all retweeted tweets since it does not bring any information about users demography i.e. posted by other user;
Hash tags filter – filters out all hash tags from user tweets;
Slang transformation filter – transforms all slang words to synonyms from dictionary;
User mentions and place mentions filter – filters out all user and place mentions;
Repeated chars transformation filter - filters out all repeated characters from tweets.
55
* Text preprocessing