harvard university department of economics · superior national forest 8901 grand avenue place...
TRANSCRIPT

HARVARD UNIVERSITY DEPARTMENT OF ECONOMICS
James H. Stock Littauer Center M-27
Harold Hitchings Burbank Professor Telephone: 617-496-0502
of Political Economy Fax: 617-384-8362
http://scholar.harvard.edu/stock/home [email protected]
Cambridge, MA 02138
1
Ms. Connie Cummins
Forest Supervisor
Superior National Forest
8901 Grand Avenue Place
Duluth, MN 55808
August 6, 2018
SUBJECT: U.S. Forest Service (USFS) Environmental Assessment (EA) on Proposed 20-year
Mineral Leasing Withdrawal in Superior National Forest
Dear Supervisor Cummins,
I write with regard to the proposed withdrawal of approximately 234,328 acres of federal lands
within the Superior National Forest from disposition under laws relating to mineral and
geothermal leasing for a period of 20 years (“proposed withdrawal”).
I understand that the official comment period for the proposed withdrawal has closed and that the
Forest Service might not provide a public comment period on its forthcoming environmental
assessment. I hope, however, that the Forest Service is willing to consider this letter and the
included analysis in its review of the economic impacts of the proposed withdrawal. Please
include this letter in the official project record.
I am an economist with expertise in macroeconomics, the economics of the environment, and the
analysis of economic data (econometrics). Jacob Bradt, a PhD student at the Harvard Kennedy
School, has assisted me in the preparation of this letter, which he co-signs. We write as private
citizens. We have received no compensation for this analysis, and neither of us have any
financial interest in this matter.
We have reviewed the facts of the proposed withdrawal, economic studies of the withdrawal1,
and related economics literature. The existing economic studies largely focus on the short-run
effects of the withdrawal or their effects at some unspecified point over a medium-run horizon.
This short- or medium-run focus misses what is in our view a key aspect of the economics of this
proposal, the dynamic and longer-term economic effects of the proposed withdrawal.
In this letter, we provide an estimated range of the effects of the proposed withdrawal over its
20-year period. We compare two cases. The first case is that the proposed withdrawal is put in
place. The second case is that the proposed withdrawal is not put in place and mining
commences in the Superior National Forest. In light of the Bureau of Land Management’s
1 University of Minnesota-Duluth (2012), Hjerpe and Phillips (2013), Sungur et al. (2014), Barber et al. (2014),
Phillips and Alkire (2017), Helmberger (2017), Hjerpe (2018), and Ward (2018)..

Economic Impact of Superior National Forest Withdrawal Stock and Bradt
2
(BLM) recent decision to formally reinstate two federal mineral leases held by Twin Metals
Minnesota (TMM) within the portion of the Superior National Forest proposed for withdrawal,
we focus on the development of the TMM project as the most immediate, direct impact of a
negative withdrawal decision. Therefore, we study the impact of the TMM project over a 20-year
period, as the counterfactual to the withdrawal. Because the focus is on the TMM project, the
economic analysis focuses on the greater Ely, MN region including usage of the Boundary
Waters Canoe Area Wilderness (BWCAW) and recreational use in the region in addition to the
BWCAW.
We have three main findings.
• If mining is commenced at TMM, there would likely be an initial but temporary net
growth in employment and income associated with the mining activity. Over time, the
economic benefits of mining would be outweighed by the negative impact of mining on
the recreational industry and on in-migration. This leads to a boom-bust cycle in all the
scenarios we examine, in which the region is in the end left worse off economically than
it would be under the withdrawal.
• There is considerable uncertainty about the timing and magnitude of the costs and
benefits because of the limited data specifically applicable to this withdrawal and the
greater Ely region. For that reason, we examined 72 different income scenarios that
represent a range of growth parameters consistent with historical data, previous studies of
the region, and the academic literature. All the scenarios show the boom-bust cycle of
employment and income. In 69 of the 72 income scenarios we consider, the net present
value of income under withdrawal exceeds that under no-withdrawal, in many cases by a
large margin.
• Our findings are consistent with the academic literature on boom-bust cycles in extractive
resource use and the literature on the value of outdoor recreational amenities to regional
economies.
Our analysis focuses on three effects: employment and income generated by mining;
employment and income generated in the recreation industry; and income associated with in-
migration into the area because of its amenity value. In this regard, we have omitted many
additional factors which are likely important, but more difficult to quantify, than those we
consider. These omitted factors include: effects on real estate values in the region; the value of
the BWCAW and Superior National Forest as a regional attractor of talent in the Duluth area and
elsewhere; the employment and income driven by the BWCAW and Superior National Forest
elsewhere in the state; and negative long-term effects of an economy based on extraction after
the resource has been exhausted. Because such factors are omitted from our analysis, we
consider our estimates of the economic benefits of withdrawal to be conservative.
We first develop our scenarios and present the net present value calculations. We then discuss
factors omitted from this analysis and discuss our results in the context of the relevant academic
literature.

Economic Impact of Superior National Forest Withdrawal Stock and Bradt
3
Computing Costs and Benefits over a 20-Year Horizon
Our approach is to compute the net present value of the costs and benefits of the proposed
withdrawal compared to the counterfactual of mining at the TMM site (“the TMM
counterfactual”). The starting point for net present value analysis is a stream of annual costs and
benefits of the TMM counterfactual, relative to the withdrawal case, over the 20 years of the
withdrawal. The net present value uses a discount factor to discount this stream of benefits to the
present.
Our calculations consider direct and indirect employment and income effects of the TMM
counterfactual, relative to the withdrawal case. Direct employment is in the industries under
study (mining and recreation). Indirect employment is in industries that serve the industry or
project under study, for example in the case of mining, the change in employment in industries
that provide mining services such as equipment repair. The direct and indirect income effects of
the TMM counterfactual in a given year is the net effect on incomes from direct and indirect
employment in mining and recreation of the TMM project, relative to the withdrawal case, plus
the net direct effect on income from those attracted to the region by amenity values. This latter
term captures the income spent in the region by those who choose to live in the region because of
its amenity effects, and whose decision to live in the region might be affected by the
withdrawal/no withdrawal decision.2
The construction of our scenarios entailed developing benchmark assumptions for employment
and income under the case of the withdrawal, then considering alternative assumptions under the
TMM counterfactual. The counterfactual assumptions all have uncertainty, so we vary those to
generate a total of 36 employment scenarios and 72 income scenarios.
For our employment calculations, we make the following assumptions. For the case of the
withdrawal, absent extant third-party growth forecasts of recreational employment in the greater
Ely area, we rely on two sources of growth in employment related to recreation. In the
Arrowhead region (St. Louis, Lake, and Cook counties), employment in the tourism and
hospitality industries from 2012 to 2016 grew by 1.4% per year (MNDEED). USDA (2016)
provides projections of increased recreational usage by category for 2008-2030; for the category
“Backcountry/challenge” the annualized growth rate of user-days is, 1.2%. We use this lower,
more conservative, value as the baseline in the withdrawal scenario. Although Arrowhead region
tri-county employment in recreational industries is available, we are unaware of data on the
2 The literature on regional economic development characterizes three employment effects: direct, indirect, and
induced. The indirect effect depend on the direct effect but in a way that varies by industry. To maintain internal
consistency, we assume that indirect effects are proportional to direct effects using proportionality factors from the
IMPLAN model reported for mining by UMD-Duluth (2012) and for recreation/hospitality by Hjerpe (2018).
Induced employment is the employment resulting from the spending of direct and indirect income on other local
goods and services. We omit induced employment effects for two reasons. First, there is considerable uncertainty
associated with estimating induced effects in a region because those estimates depend on the availability of
unemployed or underemployed resources locally and on the amount of income that is retained locally rather than
spent elsewhere in the state or out of state; this uncertainty calls into question the value of computing induced
effects. Second, there is in any event no reason to think induced effects would differ depending on the income
source so they would be proportional to direct plus indirect income changes for both the mining and hospitality
industry.

Economic Impact of Superior National Forest Withdrawal Stock and Bradt
4
recreational employment base potentially specifically affected by the TMM project. Full tri-
county recreational employment (tourism and hospitality) in 2016 was 12,642, however that
includes activity not likely to be directly impacted by the mining, such as hotels and restaurants
serving University of Minnesota-Duluth and Duluth hospitals. Using the IMPLAN model and a
survey of actual user expenditures, Hjerpe (2018) estimates that BWCAW visits from out-of-
region visitors alone supports 1100 direct and indirect jobs. Use of the BWCAW is just one way
that recreational users take advantage of the outdoors in the region, so jobs potentially affected
include more than just those supported by BWCAW out-of-region users. We therefore
approximate the narrow direct and indirect employment definition from Hjerpe (2018) as
accounting for one-fourth of potentially affected jobs. The broader Superior National Forest area
extends well to the east of Ely beyond the Gunflint trail. For this reason, the assumption of 4400
affected jobs could be an underestimate. We therefore consider an alternative case in which the
number of affected jobs in tourism and recreational is 50% greater, 6600, which is roughly one-
half the number of recreational and tourism jobs in the tri-county area.
Under the TMM counterfactual, in our high-mining scenario, we assume that TMM direct
employment starts at 650 jobs, a figure taken from TMM materials (Barber et al. 2014). We
consider this assumption conservative for two reasons. First, the UMD-Duluth (2012) study
projected 427 direct employment jobs in non-ferrous mining. Second, in May 2018 TMM
announced that it would scale back the planned mining from 50,000 tons per day to 20,000 tons
per day. A proportional employment reduction of the TMM 650 jobs at 50,000 tons/day yields
260 direct employment jobs. We therefore consider two additional mining scenarios,
intermediate, at 427 direct jobs, and low, at 260 direct jobs.
As shown in Figure 1, non-ferrous mining generally, and copper mining specifically in the US,
has exhibited substantial gains in productivity. Using the data in Figure 1, we consider three
mining productivity growth scenarios.3 In all, this generates nine paths for annual mining
employment (three initial levels, three productivity growth rates).
3 Figure 1 shows an overall positive trend in labor productivity (tons per hour) in the Arizona copper industry from
1970 to 2016; across all hard rock metal mining from 1987 to 2017; and in underground coal mining across the three
major U.S. coal producing regions from 2001 to 2016. The declines in output per employee in the mid- to late-
2000’s are associated with temporary changes in global commodity prices. We assume a baseline of 2.1%
productivity growth per year which is the average growth rate in the Arizona copper industry. We incorporate
uncertainty using low and high productivity growth scenarios of 1.4%, and 2.7%, which are the end points of a 95%
confidence interval for productivity growth estimated from the Arizona data. We assume a constant annual
extraction rate, so that employment falls by the rate of growth of productivity for the three productivity scenarios.

Economic Impact of Superior National Forest Withdrawal Stock and Bradt
5
Figure 1. Output per employee in non-ferrous mining (copper, metal ore, and underground coal),
index.
Sources: US Energy Information Administration, Arizona Department of Mines and Mineral Resources, US
Geological Survey, US Bureau of Economic Analysis, US Bureau of Labor Statistics.
Under the TMM counterfactual, we consider two paths for recreational employment, a low-
impact path and a high-impact path. Because we are not aware of a directly comparable project
(large-scale sulfide ore mining proximate to a water-based wilderness area) for which there are
historical data, we consider a scenario in which recreational employment contracts at the rate of
1.2% per year and one in which it contracts at the rate of 2.4% per year. The first of these rates
reverses the growth projected under the USDA baseline (USDA 2016). The second of these
rates is a reversal of twice the growth projected under the USDA baseline (USDA 2016).4 These
counterfactuals are in line with previous studies of growth of other US amenity-based regional
economies.5 We consider the high-impact scenario conservative in the sense that the impact on
4 Rasker and Hackman (1996) examine employment and income trends in northwestern Montana and find that from
1969 to 1992, employment in counties characterized by pristine wilderness grew by 93%, an annualized rate of
2.9%. In contrast, resource-extractive counties observed employment growth of 15% over the same period, an
annualized rate of 0.6%, a difference of roughly 2.3%. The scenario in which recreational employment contracts at
the rate of 1.2% represents a difference of roughly 2.4% with respect to the withdrawal scenario. Thus, our rate of a
1.2% contraction in hospitality employment is reasonable assuming a reversal of Rasker and Hackman’s (1996)
estimate and is perhaps conservative given the degree to which hospitality and tourism employment is amenity-
dependent. 5 Rasker and Hansen (2000) examine rural counties in Idaho, Montana, and Wyoming and found that ecological and
natural amenity variables are correlated with growth in these areas. Deller et al. (2001) find similar results,
confirming that individuals appear to place greater value on natural-resource-based amenities and related attributes
that contribute to regional quality of life. Winkler et al. (2007), find that “New West” communities, areas typically
characterized by amenity migration, see anywhere from 38% to 195% higher employment in the tourism industry
when compared to “Old West” communities. According to Winkler et al. (2007), this transition from “Old” to “New
West” economic models has occurred over a 30-year period, which would imply an annual growth rate of between
1.2% and 6.5%. Empirical evidence supports the assertion that amenity-driven growth has supplanted extractive
industries as the foundation of many amenity-rich, rural western counties (Lorah and Southwick 2003).

Economic Impact of Superior National Forest Withdrawal Stock and Bradt
6
tourism over the long run of a major spill or acid mine drainage event are plausibly substantially
more consequential.6
For the income scenarios, the incomes associated with direct mining and recreational
employment are computed using average local wage rates in those industries (US Bureau of
Labor Statistics and MNDEEP). These closely align with the figures used in recent studies of the
area using the IMPLAN model (UM-Duluth 2012, Hjerpe 2018).
The remaining component of income is the direct effect from those who move away from the
region because of the mining and the related direct effect of those deterred from moving to, or
retiring in, the region because of the mining (the “in-migration direct income”). To estimate this
component, we used as a baseline the 2016 Census Bureau (American Community Survey) total
income of the five-township Ely region (Ely, Eagles Nest, Fall Lake, Morse, and Stony River).
We projected withdrawal baseline income growth as the sum of per-capita income growth and
population growth. Our per-capita income growth projection is the historical per-capita income
growth from 2000-2016 for the Arrowhead counties (Headwaters Economics, Economic Profile
System 2018). There is a large literature that documents increased population growth in
amenities-rich areas, see Rickman and Rickman (2011) and Holmes (2016) for surveys. We
adopt the population growth rate from Rickman and Rickman (2011) for counties with USDA
amenity rank equal to the average Arrowhead amenities rank. For the TMM counterfactual, we
considered two scenarios for in-migration direct income. The first is that population growth
slows to zero; the second is that in-migration population for amenity values declines by 10%
over the 20-year period. This latter estimate is less than one-half of the fraction of residents
(23%) surveyed bv Sungur et al. (2014) who indicated they would consider moving from the
region in the event that the TMM project were undertaken.
In all, these assumptions generated 36 employment and 72 income paths under the various
scenarios. The employment paths are plotted in Figure 2, and the income paths are plotted in
Figure 3.
6 The environmental risks associated with sulfide-ore copper mining within the watershed of the BWCAW are
potentially economically consequential. Mining and beneficiation processes for underground copper ore generate
large volumes of tailings. In a watershed hydrology model of possible mining locations in northeastern Minnesota,
Myers (2016) finds that even relatively short-term leaks of tailing materials on the surface at mining locations in the
region could cause substantial loads of sulfate, a major product of acid mine drainage, in the rivers and valuable
downstream resources of the BWCAW. When considering the economic costs associated with these adverse
environmental impacts, the economics literature proves helpful. In a study of acid mine drainage-impaired lakes in
rural Ohio, Mishra et al. (2012) find a negative relationship between sulfate levels in impaired lakes and recreational
use. Moreover, the literature documenting the structural transition of amenity-rich communities from reliance on
extractive industries to tourism-based growth suggests a link between the two: were sulfide-ore copper mining to
proceed at the TMM project, it is reasonable to assume that a contraction in tourism and recreation-based economic
activity will likely occur, and would increase with the severity of spills, breaches, and/or drainage.
Economic Impact of Superior National Forest Withdrawal Stock and Bradt
7
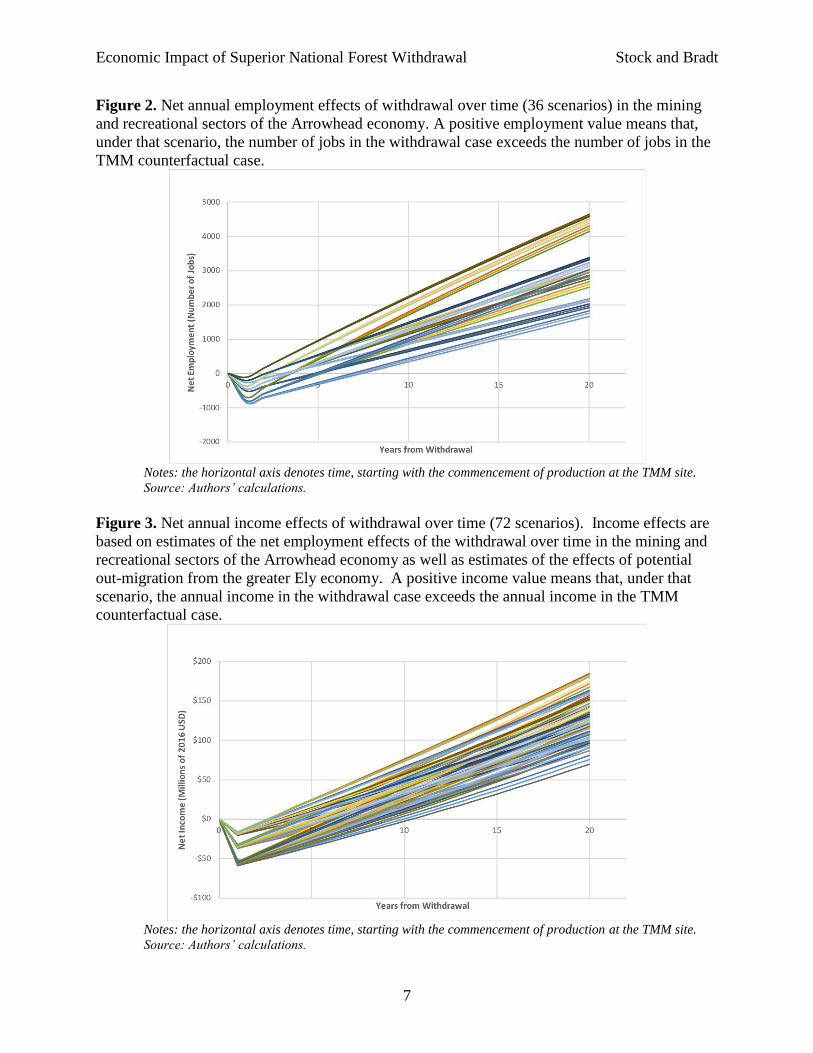
Figure 2. Net annual employment effects of withdrawal over time (36 scenarios) in the mining
and recreational sectors of the Arrowhead economy. A positive employment value means that,
under that scenario, the number of jobs in the withdrawal case exceeds the number of jobs in the
TMM counterfactual case.
Notes: the horizontal axis denotes time, starting with the commencement of production at the TMM site.
Source: Authors’ calculations.
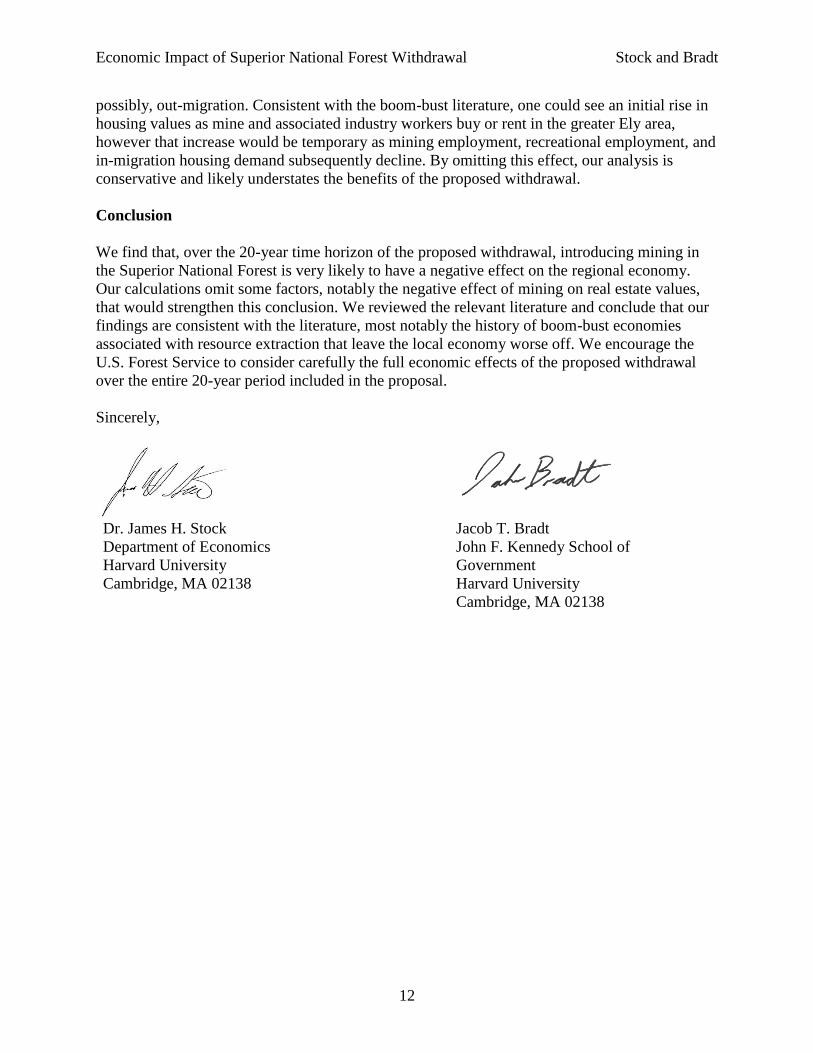
Figure 3. Net annual income effects of withdrawal over time (72 scenarios). Income effects are
based on estimates of the net employment effects of the withdrawal over time in the mining and
recreational sectors of the Arrowhead economy as well as estimates of the effects of potential
out-migration from the greater Ely economy. A positive income value means that, under that
scenario, the annual income in the withdrawal case exceeds the annual income in the TMM
counterfactual case.
Notes: the horizontal axis denotes time, starting with the commencement of production at the TMM site.
Source: Authors’ calculations.

Economic Impact of Superior National Forest Withdrawal Stock and Bradt
8
We computed the net present value for each of the income paths, using a 5% nominal (3% real)
discount factor. A histogram of the net present values is presented in Figure 4. In 69 of the 72
cases, the net present value of the withdrawal is positive, that is, the benefits of the withdrawal
outweigh the cost. The cases for which the net present value of the withdrawal is negative are
those in which we assume mining employment starts at the highest level (650 jobs, despite the
2018 announcement that the project would be scaled back), mining productivity growth is low,
and impacts to tourism and amenity-based in-migration are also low. We consider each of these
assumptions to be questionable and collectively they seem improbably optimistic.
Figure 4. Histogram of the 72 estimated net present value (NPV) scenarios. In 69 of the 72
cases, the net present value of the withdrawal is positive.
Source: Authors’ calculations.
Our estimates in the context of other studies
Other studies of rural economic growth and amenities. Multiple studies conclude that outdoor
recreation and recreational amenities, especially wilderness amenities, have been the basis for
strong and sustainable economic growth in rural communities with those attributes over the past
two decades. This literature looks at a variety of measures including income, job growth,
population growth in wilderness-abutting regions, willingness-to-pay, and property values. In
early influential research, Deller et. al. (2001) studied rural U.S. counties and concluded that “the
empirical results provide strong evidence that rural areas which can be characterized as endowed
with high levels of key natural resource amenity endowments and overall quality of life
experience higher overall levels of growth” (p. 363). Rickman and Rickman (2011) examine
nonmetropolitan counties across the U.S. and construct measures of outdoor and recreational
amenity; they establish a positive relationship between amenity values and population growth.

Economic Impact of Superior National Forest Withdrawal Stock and Bradt
9
Lorah and Southwick (2003) look at the role of protected federal lands, which hold an intrinsic
natural amenity value, on rural population growth in western counties and find that counties with
protected federal lands within 50 miles of their center grew approximately 11.7 times faster than
nonmetropolitan western counties without protected federal lands within 50 miles of their center.
Poudayal et al. (2008) analyze nationwide county-level data on the role of natural resource
amenities in attracting retiree in-migration; they find that the percentage of a county under forest,
the quantity of high quality water resources, and the presence of federally protected national
parks are all statistically significant drivers of retiree in-migration. Winkler (2007) finds similar
demographic trends. McGranahan et. al. (2011) study the underlying mechanism whereby
sustainable growth is linked to amenity values and find that this growth has an endogenous
element through the channel of entrepreneurs being attracted to rural locations with high outdoor
amenity value.
Holmes et. al. (2016) provide a recent survey of the literature on valuation of proximity to
wilderness areas. In addition to reviewing estimates of local economic effects as discussed here,
they include two concepts which we have not relied on, willingness-to-pay, option value, and
bequest value (so-called passive use values). They argue that these latter values can be large, a
point that is relevant to the withdrawal proposal because they attempt to estimate directly the
value of pristine wilderness.
These studies validate the inclusion of in-migration effects that are supported by the withdrawal
and are potentially at risk if the withdrawal does not occur. In addition, these studies support a
broader interpretation of the value of the BWCAW and Superior National Forest as an attractor
of non-tourism, non-retirement jobs to the area because of the proximate wilderness. This latter
category of job is not included in our study, and by excluding such jobs our study is conservative
and understates the economic benefits of the withdrawal.
Resource extraction and sustainable growth. The question of resource extraction and economic
growth has long been of interest in the economics literature at the country level (e.g., oil export
economies), regional level, and local level. Although we are not aware of any recent hard-rock
mining studies on the sustainable growth cycle, the boom in nonconventional oil and gas
development has stimulated recent research on extractive resource growth cycles.
Jacobsen and Parker (2014) study county-level data for the American West and examine the
consequences of oil and gas well drilling arising from the oil price increases of the 1970s and
early 1980s. They summarize their findings as follows:
…We find that the boom created substantial short-term economic benefits, but also
longer term hardships that persisted in the form of joblessness and depressed local
incomes. In particular, we find positive short-term effects of the boom on local income
per capita, which increased by more than 10% above pre-boom levels during the height
of the boom. Local employment also increased considerably during the boom,
particularly in the extraction and nontradable (e.g. construction, services, retail) sectors,
which is consistent with the findings of previous research... In the longer run, after the
full boom-and-bust cycle had concluded, we find that local per capita income was about
6% lower than it would have been if the boom had never occurred. Local unemployment

Economic Impact of Superior National Forest Withdrawal Stock and Bradt
10
compensation payments – which proxy for job loss – increased immediately following
the peak of the boom and did not contract back to pre-boom levels during the entire post-
bust period. (p. 2)
This finding is summarized in Figure 5, which is Figures 5(f) and 5(h) in Jacobsen and Parker
(2014). Their methodology is to compare two otherwise similar rural counties that differ in
whether they had oil and gas that could be exploited using 1970s technology. Those with
exploitable oil or gas (the “treatment” group) saw a surge in drilling and pumping associated
with the price spikes of the 1970s ,while those without oil and gas resources (the control group)
did not. The figure compares the outcomes for the treatment and control groups (the light lines
are uncertainty bands). As the figure shows, during the boom income per capita rose in the
treatment counties, but by the 1990s income per capita (5a) for the treatment group counties was
below that for the control group. One legacy in the oil and gas counties was a higher rate of
unemployment compensation per capita (5b) that also persisted into the 1990s. By inference, the
oil and gas boom left the counties worse off by these per-capita measures than those that avoided
the boom-bust cycle. From an economic development perspective, what is striking about these
estimates is that the investment and employment booms associated with this oil and gas
development did not simulate, on net, lasting new incomes from manufacturing that left the
county better off, rather they find that earning gains left after the oil and gas played out.
Figure 5. Income and unemployment compensation per capita in counties that had an oil and gas
boom in the 1970s and 1980s, compared to comparable rural counties that did not (Jacobsen and
Parker (2014)).
(a) Income per capita (logarithm) (b) unemployment compensation per capita (logarithm)
Source: Jacobsen and Parker (2014, Figure 5(f) and 5(h)).
Allcott and Keniston (2017) study US county-level manufacturing data in connection with oil
and gas booms and conclude that “while county-level population, employment, wages, and
revenue productivity are all procyclical [i.e. all go up in the initial extractive stage], the booms
are cancelled out by the busts. By the end of the 1990s, we see no significant remaining long-
term effects of the boom and bust cycle of the 1970s and 1980s (p. 5)”
There is also some work on the economic impacts of nonconventional oil and gas extraction,
however the scope for dynamic analysis is limited because that development is new and

Economic Impact of Superior National Forest Withdrawal Stock and Bradt
11
insufficient time has elapsed to observe a full cycle. One set of limited dynamic estimates is
provided, however, by Feyrer, Mansur, and Sacerdote (2017). They use local geographic data to
provide some estimates of the dynamic effect of nonconventional oil and gas extraction in the
2000s; they find that it has large employment effects, but that those employment effects are
transitory at the local level. They only estimate dynamics over the first two years following the
initial local extraction shock and find that wage income gains, including direct, indirect, and
induced, dissipate by 1/3 within two years (the dissipation is faster if only direct and indirect
wages are considered, see their Figure 4). The technology for nonconventional oil and gas
extraction has a shorter life cycle than hard rock mining or conventional oil and gas extraction,
but the findings of these studies are all qualitatively consistent with an extractive boom-bust
cycle.
These studies are designed to estimate the effects of these booms on counties with average
amenity values. Thus these estimates capture the boom-bust effect on mining and related jobs but
do not include any special effects that mining disamenities or environmental damage would have
on employment and in-migration related to high-amenity regions like the area surrounding the
BWCAW. Such effects would exacerbate the boom-bust nature because of the deterioration in
environmental conditions and amenity values that would reduce non-mining amenity-related
incomes.
Property values and mining disamenities. There is substantial evidence that mining disamenities
reduce housing values. In their study of acid mine drainage from coal mining in the Cheat River
Watershed of West Virginia, Williamson et al. (2008) find that location near an AMD-impaired
stream has an implicit marginal cost of $4,783 on housing, or nearly 12.2% of a home’s value.
Kim and Harris (1996) examine the broader suite of possible mining disamenities and their effect
on property values near a copper mine in Green Valley, AZ and find that parcels closest to the
mining site lost 5.74% of their value with homes further away losing 0.66% of their value as
well. In their study of sulfide-ore copper mining in the Arrowhead region, Phillips and Alkire
(2017) use Kim and Harris’ (1996) findings to estimate that the total loss in property value for a
single year due to sulfide ore copper mining would be over $508 million (2016 USD), or roughly
1.9% of the total property value of the three Arrowhead region counties.
Phillips and Alkire’s (2017) estimate of a decline of 1.9% is in the range of those in related
studies. Boxall et al. (2005) examine the impact of oil and gas facilities on rural residential
property values in Central Alberta, Canada using hedonic regression methods for property
valuation. They find that location within four km. of industry facilities leads to a four to eight
percent decrease in property value. Leggett and Bockstael (2000) use a hedonic property model
to show that water quality has a significant effect on property values along the Chesapeake Bay,
an amenity-rich, non-metropolitan setting with high recreational value. Poor et al. (2007) find a
similar result in the Chesapeake Bay watershed examining non-point source pollutants, including
suspended solids and nitrogen. In a study of the impact of lake water clarity on New Hampshire
lakefront properties, Gibbs et al. (2002) find that water clarity—a measure of the degree of
eutrophication—has a significant effect on prices paid for residential properties.
In the case of the proposed withdrawal, these negative effects on housing values would be
compounded by the downward pressure on housing values from reduced in-migration or,
Economic Impact of Superior National Forest Withdrawal Stock and Bradt
12
possibly, out-migration. Consistent with the boom-bust literature, one could see an initial rise in
housing values as mine and associated industry workers buy or rent in the greater Ely area,
however that increase would be temporary as mining employment, recreational employment, and
in-migration housing demand subsequently decline. By omitting this effect, our analysis is
conservative and likely understates the benefits of the proposed withdrawal.
Conclusion
We find that, over the 20-year time horizon of the proposed withdrawal, introducing mining in
the Superior National Forest is very likely to have a negative effect on the regional economy.
Our calculations omit some factors, notably the negative effect of mining on real estate values,
that would strengthen this conclusion. We reviewed the relevant literature and conclude that our
findings are consistent with the literature, most notably the history of boom-bust economies
associated with resource extraction that leave the local economy worse off. We encourage the
U.S. Forest Service to consider carefully the full economic effects of the proposed withdrawal
over the entire 20-year period included in the proposal.
Sincerely,
Dr. James H. Stock
Department of Economics
Harvard University
Cambridge, MA 02138
Jacob T. Bradt
John F. Kennedy School of
Government
Harvard University
Cambridge, MA 02138

Economic Impact of Superior National Forest Withdrawal Stock and Bradt
13
Works Cited
Alcott, H. and D. Keniston. “Dutch Disease or Agglomeration? The Local Economic Effects of
Natural Resource Booms in Modern America.” The Review of Economic Studies 85, 695-
731.
Barber, John, Harry Parker, David Frost, Janine Hartley, Trey White, Chris Martin, Robert
Sterrett, Joanna Poeck, Ted Eggleston, Lynton Gormely, Simon Allard, Srikant
Annavarapu, Tom Radue, Matthew Malgesini, Matthew Pierce. 2014. Twin Metals
Minnesota Project: Technical Report on Pre-fesasibility Study. Prepared for Duluth
Metals Corp. 6 October 2014.
Boxall, P.C., W.H. Chan, and M.L. McMillan. 2005. “The impact of oil and natural gas facilities
on rural residential property values: a spatial hedonic analysis.” Resource and Energy
Economics 27, no. 3: 248-269.
Bureau of Economic Analysis. 1970-2017. “Regional Data.” https://www.bea.gov/index.htm
(retrieved 14 July 2018).
Bureau of Labor Statistics. 1987-2016. “Labor and Multifactor Productivity Data by Industry:
Four Digit Industry Data.” U.S. Department of Labor.
https://www.bls.gov/lpc/tables_by_sector_and_industry.htm (retrieved 14 July 2018).
Bureau of Labor Statistics. 2017. “Occupational Employment Statistics: May 2017 State
Occupational Employment and Wage Estimates.” U.S. Department of Labor.
https://www.bls.gov/oes/current/oessrcst.htm (retrieved on 14 July 2018).
Council on Environmental Quality. 1978. Regulations for Implementing the Procedural
Provisions of the National Environmental Policy Act. Washington, DC: Executive Office
of the President.
Deller, Steven C., Tsung Hsiu (Sue) Tsai, David W. Marcouiller, and Donald B.L. English. 2001.
“The Role of Amenities and Quality of Life in Rural Economic Growth.” American
Journal of Agricultural Economics 83, no. 2: 352-365.
Dudka, Stanislaw and Domy C. Adriano. 1997. “Environmental impacts of metal ore mining and
processing: a review.” Journal of Environmental Quality 26, no. 3: 590-602.
Energy Information Administration. 2016. “Coal Data Browser.” U.S. Department of Energy.
https://www.eia.gov/coal/data/browser/#/topic/36?agg=2,0,1&geo=nvg1qag9vvlpg&mnt
p=4&freq=A&start=2001&end=2016&ctype=linechart<ype=pin&rtype=s&pin=&rse=
0&maptype=0 (retrieved 14 July 2018).
Feyrer, J., E.T. Mansur, and B. Sacerdote. 2017. “Geographic Dispersion of Economic Shocks:
Evidence from the Fracking Revolution.” American Economic Review 107, 1313-1224.

Economic Impact of Superior National Forest Withdrawal Stock and Bradt
14
Gibbs, Julie P., John M. Halstead, Kevin J. Boyle, and Ju-Chin Huang. 2002. “An hedonic
analysis of the effects of lake water clarity on New Hampshire lakefront properties.”
Agricultural and Resource Economics Review 31, no. 1: 39-46.
Gopalakrishnan, Sathya and H. Allen Klaiber. 2013. “Is the shale energy boom a bust for nearby
residents? Evidence from housing values in Pennsylvania.” American Journal of
Agricultural Economics 96, no. 1: 43-66.
Headwaters Economics. 2018. “A Profile of Socioeconomic Measures: St. Louis County, MN;
Cook County, MN; and Lake County, MN.” Headwaters Economics and U.S. Census
Bureau. https://headwaterseconomics.org/tools/economic-profile-system/about/ (accessed
19 July 2018).
Helmberger, Marshall. 2009. “Ely’s golden goose.” The Timberjay, 3 August 2017.
http://timberjay.com/stories/elys-golden-goose,13540.
Hjerpe, Evan 2018. “Outdoor Recreation as a Sustainable Export Industry: A Case Study of the
Boundary Waters Wilderness.” Ecological Economics 146, 60-68.
Hjerpe, Evan and Spencer Phillips. 2013. “A review of ‘The economic impact of ferrous and
non-ferrous mining on the State of Minnesota and the Arrowhead Region.’” Report
prepared by Conservation Economics Institute and Key-Log Economics. 30 December
2013.
Holmes, Thomas P., J.M. Bowker, J. Englin, E. Hjerpe, John B. Loomis, Spencer Phillips, and
Robert Richardson. 2016. “A synthesis of the economic values of wilderness.” Journal of
Forestry 114, no. 3: 320-328.
Jacobsen, Grant D. and Dominic P. Parker. 2014. “The economic aftermath of resource booms:
evidence from boomtowns in the American West.” The Economic Journal 126, no. 593.
Kim, H.S. and D. Harris. 1996. “Air quality and view degradations due to copper mining and
milling: Preliminary analysis and cost estimates for Green Valley, Arizona.”
Nonrenewable Resources 5, no. 2: 91-102.
Leggett, Christopher G. and Nancy E. Bockstael. 2000. “Evidence of the effects of water quality
on residential land prices.” Journal of Environmental Economics and Management 39,
no. 2: 121-144.
Lorah, Paul and Rob Southwick. 2003. “Environmental protection, population change, and
economic development in the rural western United States.” Population and Environment
24, no. 3: 255-272.
McGranahan, David A., Timothy R. Wojan, and Dayton M. Labert. 2011. “The rural growth
trifecta: outdoor amenities, creative class and entrepreneurial context.” Journal of
Economic Geography 11: 529-557.

Economic Impact of Superior National Forest Withdrawal Stock and Bradt
15
Minnesota Department of Employment and Economic Development. 2017. “Current
Employment Statistics Data Tool.” https://mn.gov/deed/data/data-tools/current-
employment-statistics/ (retrieved on 14 July 2018).
Mishra, Shruti K., Frederick J. Hitzhusen, Brent L. Sohngen, Jean-Michel Guldmann. 2012.
“Costs of abandoned coal mine reclamation and associated recreation benefits in Ohio.”
Journal of Environmental Management 100: 52-58.
Myers, Tom. 2016. “Acid mine drainage – a modeling approach to siting mine facilities in
Northern Minnesota USA.” Journal of Hydrology 533: 277-290.
Office of Management and Budget. 2003. OMB Circular A-4: Regulatory Analysis. Executive
Office of the President.
https://www.whitehouse.gov/sites/whitehouse.gov/files/omb/circulars/A4/a-4.pdf.
Phillips, Spencer and Carolyn Alkire. 2017. “Sulfide-ore copper mining and/or a sustainable
boundary waters economy: The need to consider real tradeoffs.” Key-Log economics
LLC. Report prepared for Northeastern Minnesotans for Wilderness.
Poor, P. Joan, Keri L. Psagno, and Robert W. Paul. 2007. “Exploring the hedonic value of
ambient water quality: A local watershed-based study.” Ecological Economics 60, no. 4:
797-806.
Poudayal, Neelam C., Donald G. Hodges, and H. Ken Cordell. 2008. “The role of natural
resource amenities in attracting retirees: Implications for economic growth policy.”
Ecological Economics 68, no. 1-2: 240-248.
Power, Thomas M. 2010. Analysis of Economic Costs of the Proposed Rosemont Copper
Project. Scoping comment document prepared for and with assistance from: The
Mountain Empire Action Alliance.
Rasker, Ray and Andrew Hansen. 2000. “Natural Amenities and Population Growth in the
Greater Yellowstone Region.” Human Ecology Review 7, no. 2 (winter 2000): 30-40.
Rasker, Raymong and Arlin Hackman. 1996. “Economic development and the conservation of
large carnivores.” Conservation Biology 10, no. 4: 991-1002.
Rickman, Dan S. and Shane D. Rickman. 2011. “Population growth in high amenity
nonmetropolitan areas: What’s the prognosis?” Journal of Regional Science 51, 863-879.
Sungur, Engin, Kelly Asche, David Fluegel, Reid Ronnader, and Jacob Bibeau. 2014. The Four
Townships Area Economic, Housing Development Survey. Center for Small Towns and
Data Services Center, University of Minnesota at Morris.

Economic Impact of Superior National Forest Withdrawal Stock and Bradt
16
Twin Metals Minnesota. 2018. About Twin Metals Minnesota. http://www.twin-metals.com/wp-
content/uploads/2018/05/TM_FactSheet_May_2018_Web_FINAL.pdf
U.S. Census Bureau. 2016. “American Community Survey.” U.S. Department of Commerce.
https://www.census.gov/programs-surveys/acs/ (retrieved 18 July 2018).
U.S. Department of Agriculture. 2016. Federal Outdoor Recreation Trends: Effects on Economic
Opportunities. U.S. Forest Service, Pacific Northwest Research Station, General
Technical Report (PNW-GTR-945).
U.S. Geological Survey. 2015. Copper statistics through 2015, in Kelly, T.D., and Matos, G.R.,
comps., Historical statistics for mineral and material commodities in the United States
(2016 version): U.S. Geological Survey Data Series 140.
https://minerals.usgs.gov/minerals/pubs/historical-statistics/.
University of Minnesota-Duluth. 2012. The Economic Impact of Ferrous and Non-Ferrous
Mining on the State of Minnesota and the Arrowhead Region, Including Douglas County,
Wisconsin. Duluth, MN: University of Minnesota, Duluth, Labovitz School of Business
and Economics.
Ward, Fabrizio. 2018. “Save the Boundary Waters Survey: Minnesota Registered Voter
Telephone Survey.” Report for Save the Boundary Waters. 13 April 2018.
Williamson, J.M., H.W. Thurston, and M.T. Heberling. 2008. “Valuing acid mine drainage
remediation in West Virginia: a hedonic modeling approach.” Annals of Regional Science
42, no. 4: 987-999.
Winkler, Richelle, Donald R. Field, A. E. Luloff, Richard S. Krannich, and Tracy Williams.
2007. “Social landscapes of the Inter-Mountain West: A comparison of ‘Old West’ and
‘New West’ communities.” Rural Sociology 72, no. 3: 478-501.