harrop and narrows creeks: 2009 water quality update
TRANSCRIPT

Water Quality Update for Harrop (Mill) and Narrows creeks for 2009
View of East Harrop Creek photo provided by E. Leslie
Prepared for Harrop-Procter Community Forest, Harrop-Procter, BC
Funded by Government of British Columbia Forest Investment Account Project #9112001
Prepared by Darcie Quamme, MSc., R.P. Bio., Integrated Ecological Research, Nelson, BC
March 2010

Water Quality Update for Harrop and Narrows creeks 1
Integrated Ecological Research March 2010
TABLE OF CONTENTS
TABLE OF CONTENTS ............................................................................................................ 1
1 INTRODUCTION .................................................................................................................. 3
2 BACKGROUND INFORMATION ......................................................................................... 4 2.1 WATERSHED CHARACTERISTICS ..................................................................................... 4
3 METHODS ............................................................................................................................ 7 3.1 HYDROMETRIC MEASUREMENTS ..................................................................................... 7 3.2 WATER QUALITY ............................................................................................................ 7 3.3 MACROINVERTEBRATES.................................................................................................. 8
4 RESULTS AND DISCUSSION ............................................................................................. 9 4.1 SUMMARY OF HYDROMETRIC AND SUSPENDED-SEDIMENT MONITORING ........................... 9 4.2 SPECIFIC CONDUCTANCE.............................................................................................. 10 4.3 TEMPERATURE ............................................................................................................. 10 4.4 FECAL AND TOTAL COLIFORMS ...................................................................................... 14 4.5 QUALITY ASSURANCE/QUALITY CONTROL OF WATER SAMPLING ..................................... 15 4.6 MACROINVERTEBRATES................................................................................................ 16
5 CONCLUSIONS AND RECOMMENDATIONS .................................................................. 19
6 LITERATURE CITED.......................................................................................................... 20
5 APPENDICES..................................................................................................................... 22 5.1 TABLE OF CONTACTS.................................................................................................... 22 5.2 MAP OF HARROP (MILL) AND NARROWS CREEKS ........................................................... 23 5.3 HYDROGEOMORPHIC CHARACTERISTICS OF HARROP CREEK WATERSHED FOR 2006....... 24 5.4 ELEVATIONS OF BIOGEOCLIMATIC SUB-ZONES................................................................ 24 5.5 STREAM METERING AND DISCHARGE RATING ACCURACY FOR 2009 ................................. 24 5.6 STAGE-DISCHARGE TABLES FOR 2009........................................................................... 25 5.7 RAW WATER QUALITY DATA ......................................................................................... 27 5.8 CAUSES OF PEAKS IN DISCHARGE AND SUSPENDED SEDIMENT........................................ 29 5.9 MACROINVERTEBRATE RAW DATA ................................................................................. 30 5.10 OKANAGAN BIOLOGICAL INDEX OF BIOTIC INTEGRITY METRICS AND SCORES .................. 31
TABLES Table 1. Watershed characteristics and location of water collection sites ......................................5 Table 2. Water sampling regime in 2009 ........................................................................................8 Table 3. Biometrics used in analysis of Rapid bioassessment II. ...................................................9 Table 4. Summary of fecal and total coliform values from 2009. ..................................................15 Table 5. Duplicate sample results from Passmore Laboratory Ltd ...............................................15 Table 6. Trip blank results from Passmore Laboratory Ltd. ..........................................................16 Table 7. Selected habitat characteristics of macroinvertebrate sampling sites ............................17 Table 8. Impairment rating score for Harrop Creek ......................................................................18

Water Quality Update for Harrop and Narrows creeks 2
Integrated Ecological Research March 2010
FIGURES Figure 1. Map of Kootenay Lake with HPCC water monitoring sites on Harrop Creek and
Narrows creeks and Environment Canada macroinvertebrate reference sites at Tam O’Shanter and Lockhart creeks....................................................................................6
Figure 2. Discharge, TSS, turbidity and specific conductance from Harrop and Narrows creeks....................................................................................................................................11
Figure 3. Comparison of discharge from monitored creeks to WSC stations. ..........................12 Figure 4. Turbidity, TSS and Specific conductance vs. Discharge. ...........................................13 Figure 5. Continuous temperature recording from Harrop and Narrows creeks........................14
PHOTOS Photo 1. Harrop Creek view of burn that occurred in 2003. ............................................................6 Photo 2. Narrows Creek watershed draining to Kootenay Lake, 2009.. ..........................................6
ACKNOWLEDGEMENTS
Leeza Trione, a local resident, conducted the recent water quality sampling and water level measurements. Jennifer and Tony Yeow of Passmore Laboratory Ltd. designed the sampling program, conducted laboratory analyses of turbidity, total suspended-sediment, conductivity, fecal coliforms and sampled macroinvertebrates. Tony Yeow of Passmore Laboratory Ltd. installed and maintained the stream gauge. He also carried out the stream metering, and completed stage-discharge curve calculations and corrections.
Darcie Quamme of Integrated Ecological Research conducted project management, data analysis and reporting. Special thanks are extended to Erik Leslie for contract monitoring and his support of the program. Contact information is provided in Appendice 5.1.

Water Quality Update for Harrop and Narrows creeks 3
Integrated Ecological Research March 2010
1 INTRODUCTION
The Harrop-Procter Community Co-operative (HPCC) manages a Community Forest License in the Kootenay Lake Forest District of the Southern Interior Forest Region. A community-based water-monitoring program was initiated in 1999 in order to assess drinking water quality within the Harrop and Narrows watersheds. These creeks are important because they supply domestic and irrigation water to numerous local water licensees. Narrows Creek was established as a control for water quality monitoring because originally timber harvest had not occurred within this watershed. Monitoring of Harrop Creek (also known as Mill Creek) was added to the program in 2002 because half of the planned forest development was to occur within the Harrop watershed (Carver 2006).
The goal of the program was to monitor the baseline watershed condition, and assess trends in water quality parameters and hydrometrics related to forest development. The project evaluated trends in water quality variables with respect to the frequency at which BC Ministry of Environment (MoE 2010a) Water Quality guidelines (WQG) were exceeded. Hydrometric data was gathered mainly to aid the interpretation of the water quality data and to document the timing of seasonal flows.
The monitoring program included parameters influenced by forest harvesting practices and road building such as turbidity, total suspended solids (TSS), water temperature, and conductivity (Cavanagh et al. 1998, MacDonald et al. 1991, Jordan and Fanjoy 1999). Stratified collection of bacteriological samples (total and fecal coliforms) at low flow conditions was also carried out to further assess drinking water quality.
The water-monitoring program is part of a more comprehensive evaluation of trends within the Harrop-Procter community forest watersheds and operating areas. The water quality-monitoring project alone does not attempt to deduce effects of logging or road building. High natural variations in suspended-sediment (over time and location) and the complex interactions between development and peak flows (Toews and Gluns 2003) make it difficult to determine the effects of forest management on water quality. However, observations from this project may lead to further inspections of fish habitat and stream channel in years of exceptional peak flow. The program also serves as a community-based educational tool and most importantly provides evidence as to the state of drinking water quality following logging operations and high water events.
This report is an update of water quality monitoring that took place in 2009 at Harrop and Narrows creeks. In addition, a preliminary assessment of the macroinvertebrate community collected in 2008 at Harrop Creek was made relative to Environment Canada reference sites at Tam O’Shanter and Lockhart creeks.
Water Quality Update for Harrop and Narrows creeks 4
Integrated Ecological Research March 2010
The objectives of the 2009 program were to: 1. Collect baseline water quality and flow data using a systematic sampling
strategy. 2. Determine the number of days per year that parameters exceeded
provincial drinking water quality guidelines. 3. Examine trends in drinking water quality in Harrop and Narrows creeks
as forest and road development increases within the watershed. 4. Evaluate macroinvertebrate data collected from Harrop Creek relative to
reference sites at Tam O’Shanter and Lockhart creeks.
2 BACKGROUND INFORMATION
2.1 Watershed Characteristics Harrop and Narrows creeks are located on the south side of the West Arm of Kootenay Lake east of the city of Nelson, B.C in the community of Harrop-Procter (Table 1, Figure 1, Appendix 5.2). The headwaters of the creeks are situated in the Nelson Range of the Selkirk Mountains and drain high gradient north-facing slopes reaching elevations of just over 2,300 m down to Kootenay Lake at 530 m.
Possible human influences on water quality include developments from private land, road building, agriculture, and forestry. Historical impacts include a sawmill located near the mouth of Harrop Creek in the 1920’s (Carver 2005). Water from these creeks is presently used for domestic use, drinking, irrigation, aquatic and wildlife conservation and recreational purposes. Diversions along the lower 2 km of Harrop Creek provide 149 dam3/day of water to 48 water licensees. As well, there are 46 licensees on Narrows Creek that divert 415.6 dam3/day of water on the lower 1 km segment of the creek (MoE 2010b).
The lower reaches of Harrop and Narrows creeks, comprised of riffle-pool sequences, provide spawning habitat for West Arm kokanee populations (Onchorhynchus nerka) (FISS 2010). The spawning population for Harrop Creek has been estimated at 1,000-1,500 (Masse 2002). In addition, bull trout (blue listed) (Salvelinus confluentus) and rainbow trout (Onchorhynchus mykiss) utilize these lower reaches (Masse 2002) with up stream migration limited by steep gradients and step-pool morphology. Mill Lake provides recreational fishing of rainbow trout and eastern brook trout (Salvelinus fontinalis) (FISS 2010). Downstream migration of rainbow trout from Mill Lake (elevation 1,926) occurs in the upper reaches of Harrop Creek (Masse 2002).
A summary of the hydrogeomorphic conditions for Harrop watershed (from Carver 2006) is given in Appendix 5.3. This study found extensive unstable terrain and natural historic landslides that could contribute to suspended sediment in high water years. The study also found that levels of forest
Water Quality Update for Harrop and Narrows creeks 5
Integrated Ecological Research March 2010
development (at that time 7.8% weighted ECA) were unlikely to result in higher in peak flows in the Harrop watershed.
The water collection sites on Harrop and Narrows creeks were located upstream of residential/agricultural developments (2 km and 1 km upstream of the fan, respectively) to determine possible effects from logging. This report focuses on the water quality at these two sites with coordinates given in Table 1.
The Harrop-Procter Community Co-operative oversees 10,900 ha of Crown land with an Allowable Annual Cut (AAC) of 2,603 m3 timber/year (Silva 1999). At present HPCC is operating under a temporary AAC uplift of up to 12,000 m3/year as part of the 2008-2012 cut control period to address mountain pine beetle and road development requirements in Harrop Creek.
Work in 2007-08 included 9 km of road on the face between Harrop and Slater creeks (East Harrop Creek) and four cutblocks. The 9-km of road was designed with narrow machine clearance to minimize visual and ecological impacts. In addition, no logging occurred within 100 meters of any streams. Retention in the cut blocks was; (1) 60% in all north aspects, (2) 40% in transitional areas with significant proportions of pine, (3) less than 15% in western ridge-top aspects that are primarily pine, and (4) close to zero retention in small patches of pure beetle-infested pine. Stands with small riparian areas, sensitive soils, old growth and wildlife habitats were also preserved in small within-stand reserves (Silva 1999).
Trail deactivation and clean up in East Harrop was carried out in the fall of 2009. A 40-hectare cutblock on the West Narrows face is currently being developed. Partial cutting in 4 ha of the Narrows Creek watershed may increase the Narrows Creek ECA by 0.1%. The Narrows Creek ECA remains <3%. Development of lower gradient slopes on the east side of Narrows Creek will be considered in the future. However, most of the watershed will remain undeveloped because of steep, sensitive slopes (Carver 2006) and the presence of mapped caribou habitat at higher elevations.
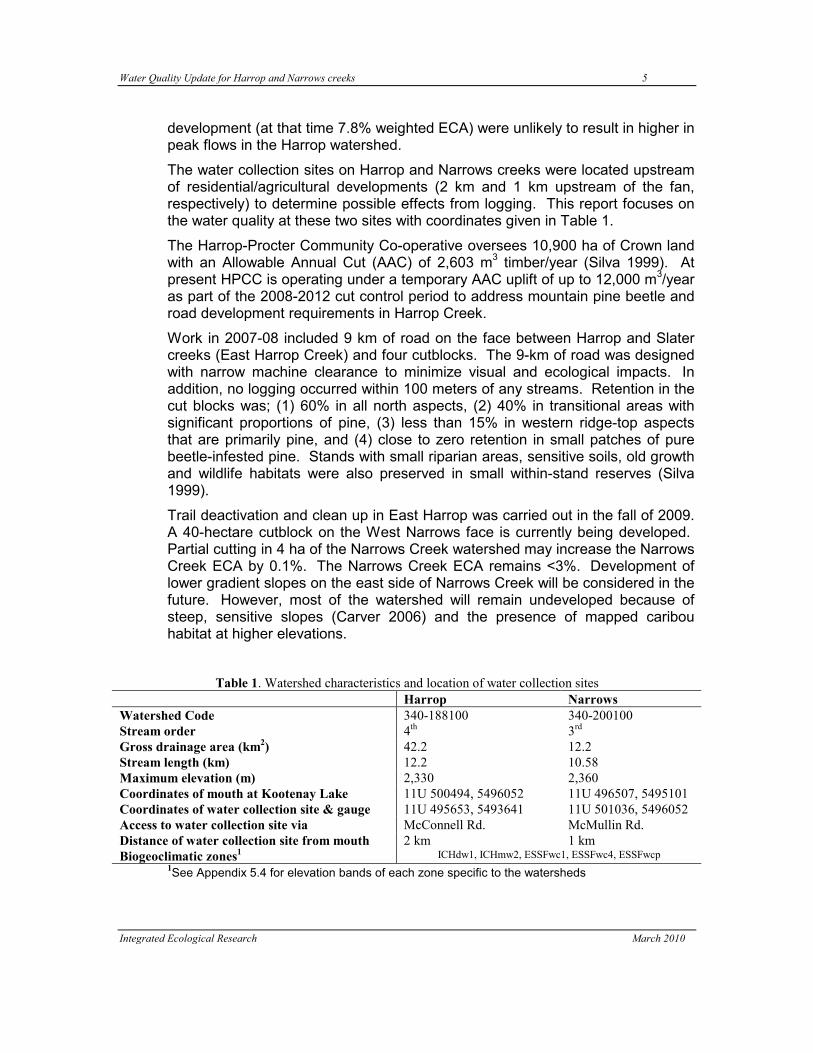
Table 1. Watershed characteristics and location of water collection sites
Harrop Narrows Watershed Code 340-188100 340-200100 Stream order 4th 3rd Gross drainage area (km2) 42.2 12.2 Stream length (km) 12.2 10.58 Maximum elevation (m) 2,330 2,360 Coordinates of mouth at Kootenay Lake 11U 500494, 5496052 11U 496507, 5495101 Coordinates of water collection site & gauge 11U 495653, 5493641 11U 501036, 5496052 Access to water collection site via McConnell Rd. McMullin Rd. Distance of water collection site from mouth 2 km 1 km Biogeoclimatic zones1 ICHdw1, ICHmw2, ESSFwc1, ESSFwc4, ESSFwcp
1See Appendix 5.4 for elevation bands of each zone specific to the watersheds

Water Quality Update for Harrop and Narrows creeks 6
Integrated Ecological Research March 2010
Photo 1. Harrop Creek view of burn that occurred in 2003. View from Redfish Creek, submitted by E. Leslie, 2009.
Figure 1. Map of Kootenay Lake with HPCC water monitoring sites on Harrop Creek and Narrows creeks and Environment Canada macroinvertebrate reference sites at Tam O’Shanter and Lockhart creeks.
Photo 2. Narrows Creek watershed draining to Kootenay Lake, 2009. Photo by E. Leslie.
Water Quality Update for Harrop and Narrows creeks 7
Integrated Ecological Research March 2010
3 METHODS
3.1 Hydrometric Measurements Water level measurements were recorded for Harrop and Narrows creeks by manual readings of a staff gauge at the water monitoring stations. A Price Type AA Current Meter was used to measure stream velocity. Stream discharge measurements followed Resource Inventory Committee (RIC) (1998) standard procedures, and involved stretching an Eslon tape across the channel and metering the water velocity at intervals of no more than 0.15 m. Starting at the water’s edge, the recorder stood at the gauge site and measured the distance from the bank, water depth and water velocity at each interval. For each reading, the rod of the current meter was held in a vertical position with the meter completely submerged and pointing directly into the flow. Readings were taken at 0.6 of the total water depth at each interval. Each velocity measurement was taken over at least a 40 second period. Readings were recorded across the entire wetted width of the creek and the stage level was recorded.
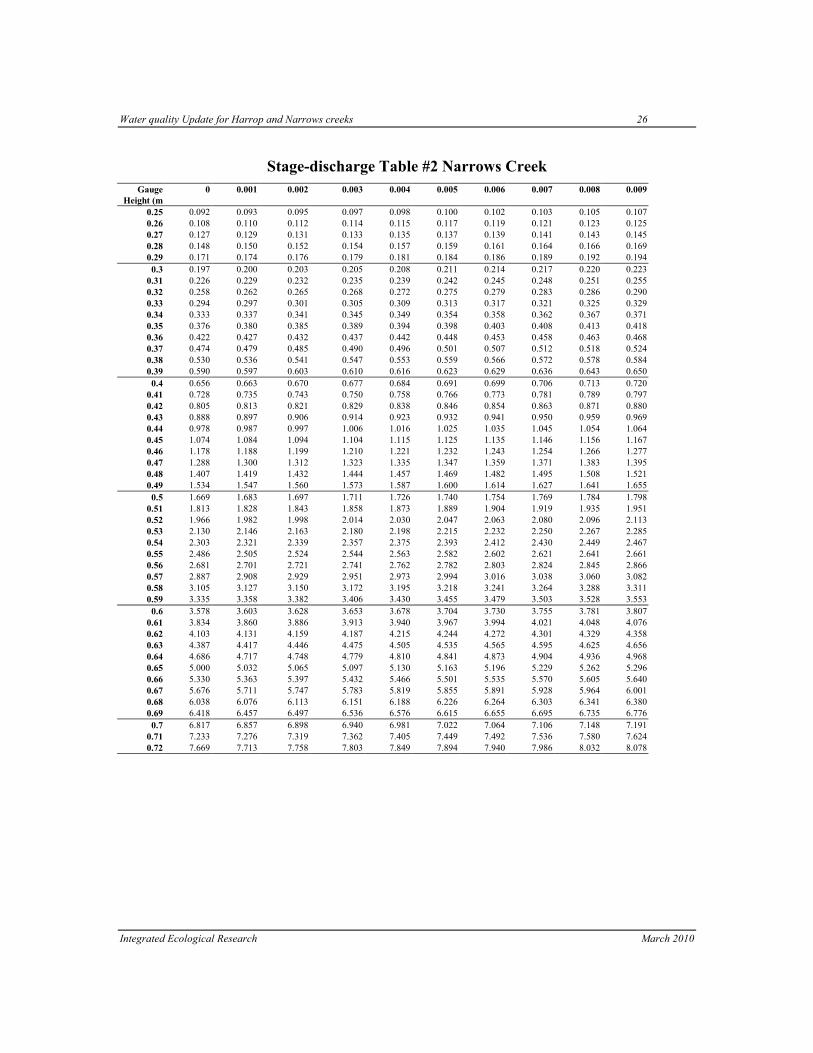
Width-velocity data, coupled with manual stage readings, were used to create two stage-discharge rating tables (Appendices 5.5-5.6). The 2009 hydrograph was then calculated from these tables. The stage-discharge relationship was based on five flow measurements at Harrop Creek and seven at Narrows. The stage-discharge curves for the creeks were first developed manually. Regression formulas (discharge= a*stageb) that were consistent with the manual method were then used to calculate the stage-discharge tables to three decimal places. Deviations for each calculated discharge ranged from 1.7-26.9% on both creeks (see Appendices Section 5.5).
3.2 Water Quality A grab sampling program (Table 2) was implemented to collect seasonal conductivity, turbidity, and total suspended solids data. Leeza Trione collected samples at the beginning, during, and after rain events especially during spring freshet.
Samples were collected using a standard 1 L bottle supplied by the analytical laboratory. Prior to being filled, all sample bottles were labelled with the date and time of sampling. For each sample, a bottle was tilted upright and moved through the water column until filled, taking care to avoid human/environmental contamination and air pockets (Cavanagh et al. 1997). Air and water temperature measurements and staff gauge readings were taken at the same time as water samples. Weather reports and any other pertinent information were also recorded at that time. After collection, water samples were placed in a refrigerator and shipped immediately to Silverking Soya Foods where they were stored in a refrigerator until picked up by Passmore Laboratory Ltd. staff.
Leeza Trione, a local resident, collected samples for fecal and total coliforms at baseline flows following protocols for asceptic water sampling by Cavanagh et al. (1997). A sterile plastic bag was filled with stream water. The samples were
Water Quality Update for Harrop and Narrows creeks 8
Integrated Ecological Research March 2010
placed on ice and brought to Nelson where Passmore Laboratory picked them up within 24 hours of collection.
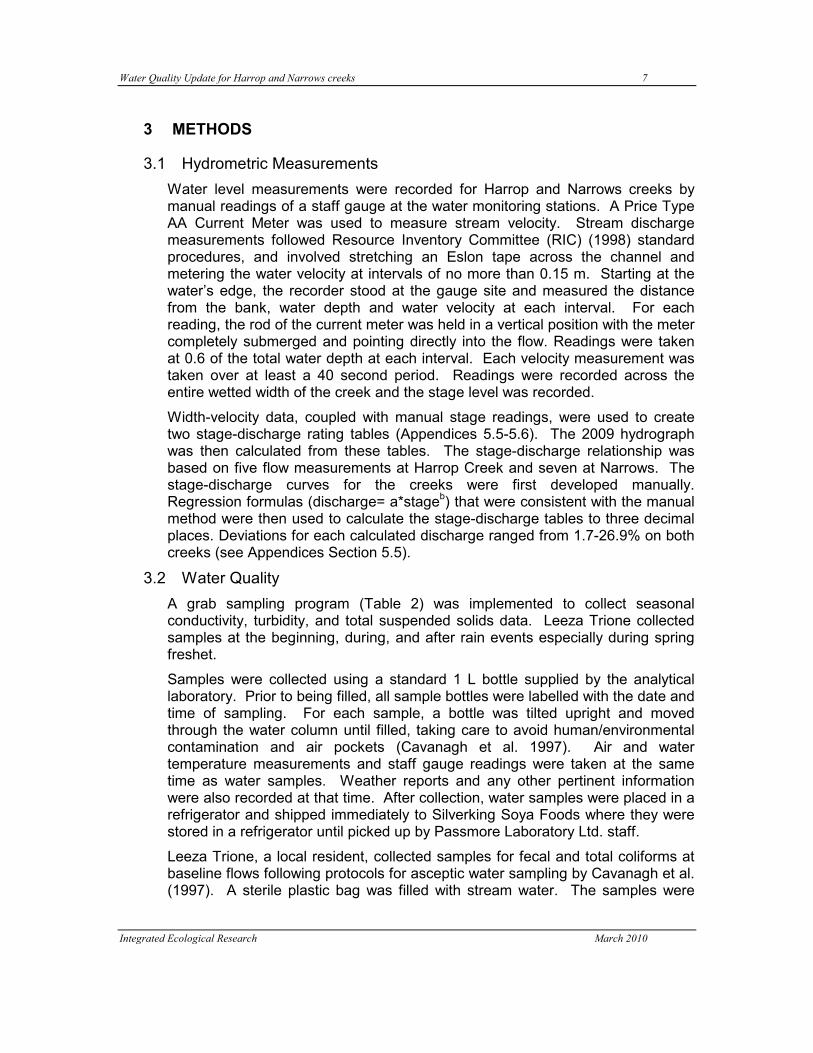
Table 2. Water sampling regime in 2009 Sampling Method Parameters Tested Sampling Schedule Manual water level Measurements and climate
Stage level, manual air, water temperatures, weather
Harrop Creek n=24 Narrows Creek n=23
Flow Measurements Discharge metering Over a range of stream flowsHarrop Creek n=5 Narrows Creek n=7
Grab Sampling Specific conductance, turbidity, TSS Harrop Creek n=21 Narrows Creek n=19
Bacterial samples Total and fecal coliforms 5 samples/ month August 12-September
Temperature Peak summer temperatures, continuous meter May 27 to December 31
3.3 Macroinvertebrates
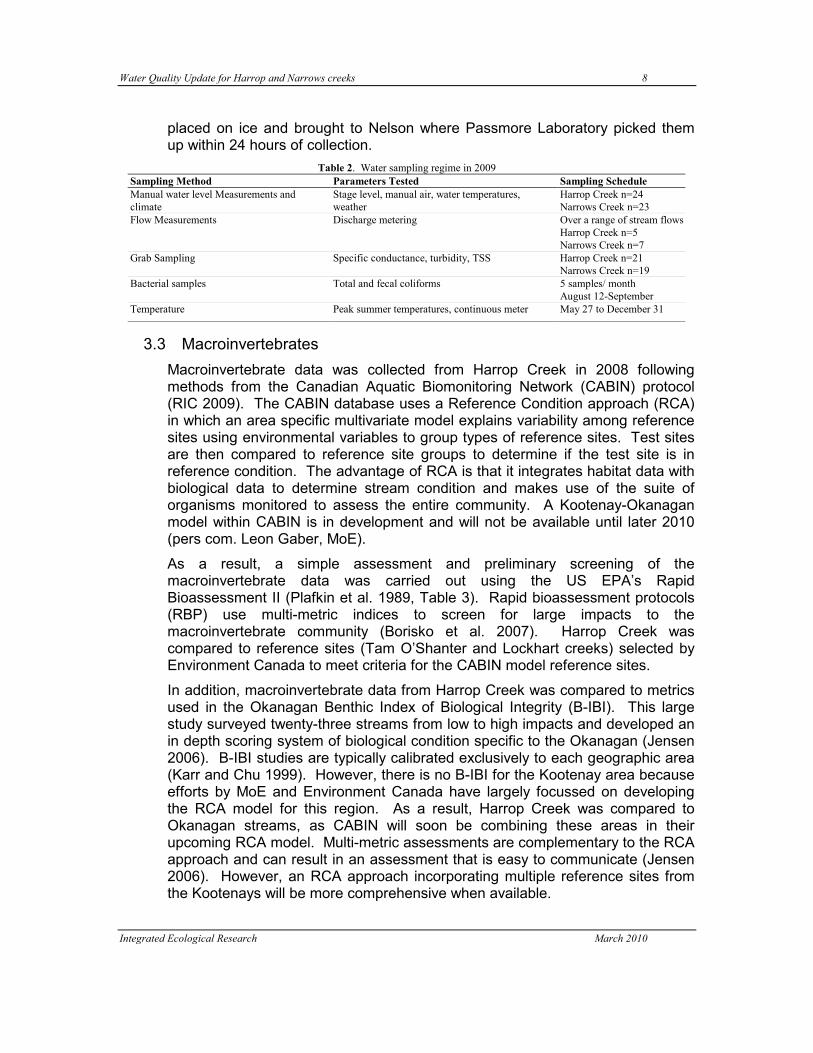
Macroinvertebrate data was collected from Harrop Creek in 2008 following methods from the Canadian Aquatic Biomonitoring Network (CABIN) protocol (RIC 2009). The CABIN database uses a Reference Condition approach (RCA) in which an area specific multivariate model explains variability among reference sites using environmental variables to group types of reference sites. Test sites are then compared to reference site groups to determine if the test site is in reference condition. The advantage of RCA is that it integrates habitat data with biological data to determine stream condition and makes use of the suite of organisms monitored to assess the entire community. A Kootenay-Okanagan model within CABIN is in development and will not be available until later 2010 (pers com. Leon Gaber, MoE).
As a result, a simple assessment and preliminary screening of the macroinvertebrate data was carried out using the US EPA’s Rapid Bioassessment II (Plafkin et al. 1989, Table 3). Rapid bioassessment protocols (RBP) use multi-metric indices to screen for large impacts to the macroinvertebrate community (Borisko et al. 2007). Harrop Creek was compared to reference sites (Tam O’Shanter and Lockhart creeks) selected by Environment Canada to meet criteria for the CABIN model reference sites.
In addition, macroinvertebrate data from Harrop Creek was compared to metrics used in the Okanagan Benthic Index of Biological Integrity (B-IBI). This large study surveyed twenty-three streams from low to high impacts and developed an in depth scoring system of biological condition specific to the Okanagan (Jensen 2006). B-IBI studies are typically calibrated exclusively to each geographic area (Karr and Chu 1999). However, there is no B-IBI for the Kootenay area because efforts by MoE and Environment Canada have largely focussed on developing the RCA model for this region. As a result, Harrop Creek was compared to Okanagan streams, as CABIN will soon be combining these areas in their upcoming RCA model. Multi-metric assessments are complementary to the RCA approach and can result in an assessment that is easy to communicate (Jensen 2006). However, an RCA approach incorporating multiple reference sites from the Kootenays will be more comprehensive when available.

Water Quality Update for Harrop and Narrows creeks 9
Integrated Ecological Research March 2010
Table 3. Biometrics used in analysis of Rapid bioassessment II. Metric1 Measure Indicator Biological Scoring Criteria
Comparability to reference site
Score
Taxa richness Total number of taxa Indicates health of the community, reflects increasing water quality, habitat diversity and suitability
>80% 60-80% 40-60% <40%
6 4 2 0
Family Biotic Index (FBI) Tolerance Specifies tolerance to organic pollution. FBI=Σxiti/n, xi = number of individuals within a species, ti = tolerance value of a species, n= total number of organisms in the sample
>85% 70-85% 50-70% <40%
6 4 2 0
Scrapers/collectorfilterers Functional feeding group measure (FFG)
Examines prevalence of the periphyton community versus the availability of Fine Particulate Organic Material (FPOM). It may indicate organic enrichment or toxicants bound to FPOM.
>50% 35-50% 20-35% <20%
6 4 2 0
EPT/(EPT+ chironomid) Tolerance Measure of community balance, should have even distribution of all four groups, mayflies (E), stoneflies (P) and caddisflies (T) to chironmid or midge numbers
>75% 50-75% 24-50% <25%
6 4 2 0
% Dominant taxon Composition Indicates community balance, a community with only a few taxa indicates community stress
<20% 20-30% 30-40% >40%
6 4 2 0
EPT/total taxa Taxonomic richness Ratio of sensitive taxa (including mayflies (E), stoneflies (P) and caddisflies (T)) to total number of taxa
>90% 80-90% 70-80% <70%
6 4 2 0
Community Loss Index Index of dissimilarity Community loss = (total #species in sample A - # species common to both samples) /total # species in sample B –Measures the loss of benthic species between a reference and test sites
<0.5 0.5-1.5 1.5-4.0 >4.0
6 4 2 0
Shredders/Total Functional feeding group measure
Allows potential impairment as indicated by the Coarse particulate organic matter-based Shredder community and toxicants of a terrestrial source such as pesticides and herbicides
>50% 35-50% 20-35% <20%
6 4 2 0
from Plafkin et al. 1989, EPT=Ephemeroptera, Plecoptera and Tricophtera
4 RESULTS AND DISCUSSION
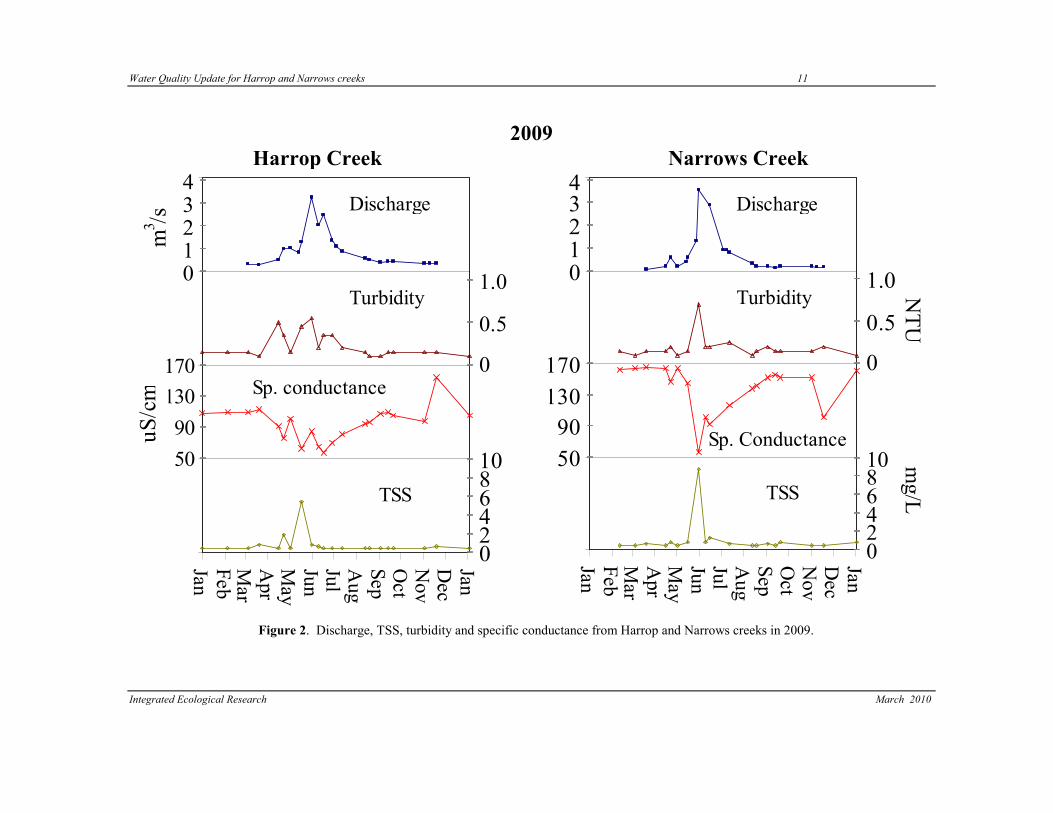
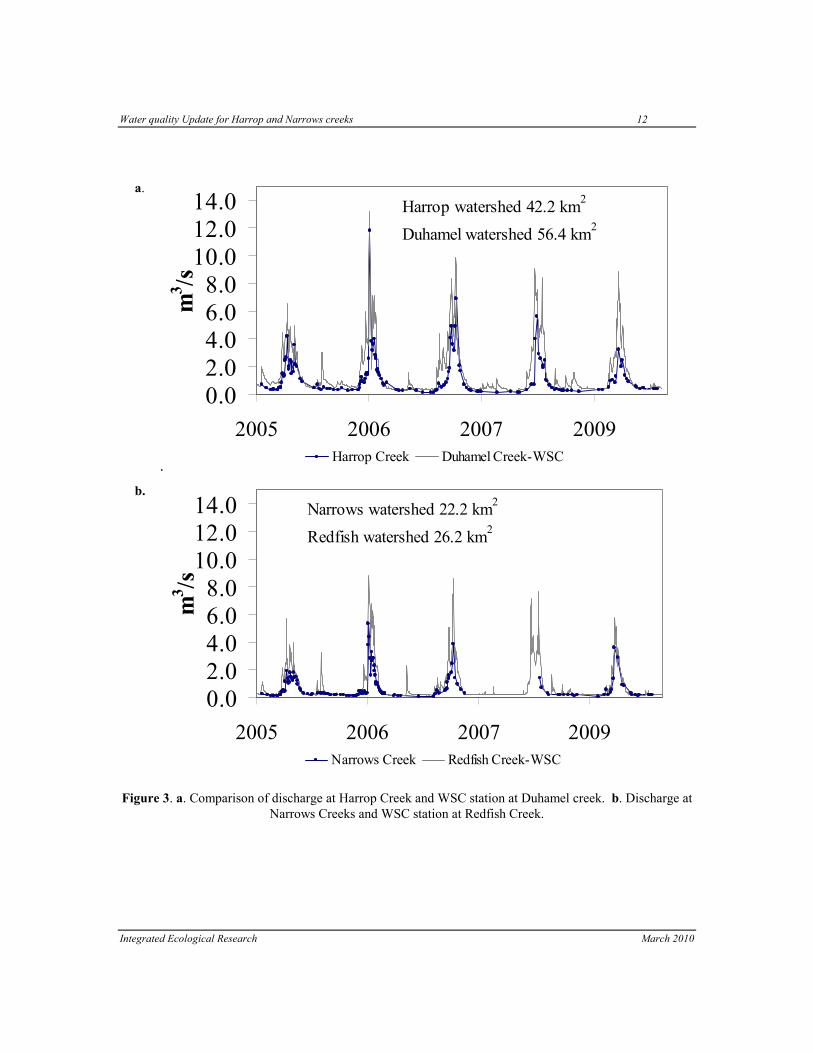
4.1 Summary of Hydrometric and Suspended-Sediment Monitoring In 2009, the peak flow occurred on May 31 at both Harrop (3.24 m3/s) and Narrows (3.58 m3/s) creeks (Figure 2). These flows were associated with warm temperatures and were well below the highest peak flows on record for Harrop Creek (11.807 m3/s, May 18, 2006) and Narrows Creek (5.333 m3/s, May 20, 2006, Figure 3, Appendix 5.7-5.8). The timing of these high water events was similar to nearby Water Survey of Canada sites (WSC 2010) at Duhamel (station 08NJ026) and Redfish Creeks (station 08NJ061, Figure 3). However, peak discharge at Harrop Creek when prorated by drainage area (0.08 m3/s/km2) was slightly lower than at Duhamel Creek (0.17 m3/s/km2 on May 30, 52.9 km2). In addition, the peak discharge (0.16 m3/s/km2) for Narrows Creek was also lower than nearby Redfish Creek (0.22 m3/s/km2 on May 31, 26.2 km2) when compared on a per drainage area basis.
The annual maximum TSS levels (5.5 mg/L, May 17) occurred on the rising limb of the hydrograph at Harrop Creek and coincided with peak flow on Narrows Creek (8.8 mg/L, May 31). Turbidity levels remained low on these dates, below provincial MoE guidelines of 5 NTU and 1 NTU. These suspended sediment

Water Quality Update for Harrop and Narrows creeks 10
Integrated Ecological Research March 2010
levels were much lower than the peak levels of suspended-sediment on record (149 mg/L, turbidity 13 NTU for Harrop Creek and 76 mg/L, turbidity 7 NTU for Narrows Creek in 2006) (Figure 4).
Previous monitoring (Figure 4) on Harrop Creek has shown that MoE guidelines of 1 NTU and 5 NTU were exceeded at discharges of greater than 1 m3/s on Harrop Creek and 0.57 m3/s on Narrows Creek. However, two samples on record (Harrop Creek) had elevated suspended sediment at low discharges (December 14, 2006, 0.29 m3/s, 1.1 NTU and October 31, 2003, 0.28 m3/s, 32 mg/L).
4.2 Specific Conductance Peak specific conductance levels in both creeks were well below the maximum BC MoE guideline of 700 µS/cm for drinking water in 2009. The specific conductance in Harrop Creek varied from 58.2-110 µS/cm (n=21) and ranged from 55.5-166 µS/cm (n=19) for Narrows Creek (Figures 2 and 4). Specific conductance levels declined with increasing dilution of groundwater during freshet. The annual minimum for Narrows Creek (55.5 µS/cm) coincided with the peak flow (May 31). While the lowest specific conductance levels on Harrop Creek occurred on the declining limb of the hydrograph (June 16, 58.2 µS/cm) (Appendice 5.7). The specific conductance levels of these streams at low flow conditions (82.2-154 µS/cm for Harrop Creek, n=8 and 101-156 µS/cm for Narrows Creek, n=8) were mid-range of other streams in the Kootenay Region (26-495 µS/cm, n=14 streams, from Ptolemy et al. 1991).
4.3 Temperature Continuous temperature meters were secured in place from May 27 to December 31, 2009 in Harrop and Narrows creeks (Figure 5). Peak water temperatures in both creeks occurred from July 28 to September 3 with temperatures ranging from close to 9°C to just over 13°C. The maximum temperature of the year reached 12.8°C in Harrop Creek and 13.2°C in Narrows Creek on August 1, 2009. Summer temperatures did not exceed the BC water quality aesthetic guideline for drinking water of 15°C. Nor were guidelines for the maximum temperatures for rearing of bull trout (15°C), rainbow trout (18°C), and streams with unknown fish distributions (18°C) and spawning sockeye (13.8°C) exceeded. There are no guidelines specific for spawning kokanee. Minimum water temperatures dropped below 1°C at the beginning of December and remained low most of the month.
Water Quality Update for Harrop and Narrows creeks 11
Integrated Ecological Research March 2010
2009 Harrop Creek
1086420
5090
130170 0
0.5
1.0
43210
JanFebM
arA
prM
ayJunJulA
ugSepO
ctN
ovD
ecJan
uS/c
mm
3 /s Discharge
Turbidity
Sp. conductance
TSS
Narrows Creek
1086420
5090
130170 0
0.5
1.0
43210
JanFebM
arA
prM
ayJunJulA
ugSepO
ctN
ovD
ecJan
mg/L
NTU
Discharge
Turbidity
Sp. Conductance
TSS
Figure 2. Discharge, TSS, turbidity and specific conductance from Harrop and Narrows creeks in 2009.
Water quality Update for Harrop and Narrows creeks 12
Integrated Ecological Research March 2010
a.
.
0.02.04.06.08.0
10.012.014.0
2005 2006 2007 2009
m3 /s
Harrop Creek Duhamel Creek-WSC
Harrop watershed 42.2 km2
Duhamel watershed 56.4 km2
b.
0.02.04.06.08.0
10.012.014.0
2005 2006 2007 2009
m3 /s
Narrows Creek Redfish Creek-WSC
Narrows watershed 22.2 km2
Redfish watershed 26.2 km2
Figure 3. a. Comparison of discharge at Harrop Creek and WSC station at Duhamel creek. b. Discharge at Narrows Creeks and WSC station at Redfish Creek.

Water quality Update for Harrop and Narrows creeks 13
Integrated Ecological Research March 2010
0.1
1
10
100
1000
0.01 0.1 1 10 100Discharge (m3/s)
TSS
mg/
L 20 mg/L
Harrop Creek
0.1
1
10
100
1000
0.01 0.1 1 10 100Discharge (m3/s)
TSS
mg/
L
20 mg/L
Narrows Creek
0.1
1
10
100
0.01 0.1 1 10 100Discharge (m3/s)
Turb
idity
NTU
1 NTU
5 NTU
Harrop Creek
0.1
1
10
100
0.01 0.1 1 10 100
Discharge (m3/s)
Turb
idity
NTU
1 NTU
5 NTU
Narrows Creek
0
50
100
150
200
0.01 0.1 1 10 100
Discharge (m3/s)
Sp. C
ondu
ctan
ce u
S/s
Harrop Creek
0
50
100
150
200
0.01 0.1 1 10 100
Discharge (m3/s)
Sp C
ondu
ctan
ce u
S/s
Narrows Creek
Figure 4. Log turbidity, Log TSS and specific conductance vs.log discharge. Black points indicate 2009 data. Open
points designate previous data for Harrop (2002-08) and for Narrows (1999-08) creeks. Black lines specify MoE guidelines for turbidity with 20 mg/L as an approximation of the 5 NTU guideline for TSS.

Water quality Update for Harrop and Narrows creeks 14
Integrated Ecological Research March 2010
-202468
101214
May Jun Jul Aug Sep Oct Nov Dec
Deg
rees
cel
cius
Harrop Creek
-202468
101214
May Jun Jul Aug Sep Oct Nov Dec
Deg
rees
cel
cius
Narrows Creek
Figure 5. Continuous temperature recordings from Harrop and Narrows creeks.
4.4 Fecal and total coliforms In 2009, fecal and total coliform levels (n=5) were monitored in late summer when stream temperatures typically increase and coliform levels are expected to peak. Some residents drawing water from the creeks do not disinfect their drinking water. For these residences, the provincial MoE guidelines for drinking water (undergoing no treatment) recommend no fecal coliforms for any date in the raw water. The drinking water guideline for residents disinfecting fecal coliforms is a 90th percentile of not more than 10 CFU/100 mL (based on a minimum of five samples collected within a 30-day period).
During the summer of 2009, fecal coliform levels were below (<1 CFU/100 mL) the acceptable level for drinking water undergoing no treatment on August 18, 24

Water quality Update for Harrop and Narrows creeks 15
Integrated Ecological Research March 2010
in Harrop Creek and August 18 in Narrows Creek. The 90th percentile for Harrop Creek (8 CFU/100 mL) met the drinking water guideline for water undergoing disinfection (10 CFU/100 mL) but the 90th percentile for Narrows Creek was slightly over this guideline (11 CFU/100 mL) (Table 4). Total coliforms counts in Harrop Creek ranged from 7 – 41 CFU/100 mL and from 14-34 CFU/100 mL at Narrows Creek. The calculated 90th percentile was similar for both Harrop Creek (35 CFU/100 mL) and Narrows Creek (34 CFU/100 mL). No BC MoE guidelines exist for total coliforms in drinking water. The sources of contamination are largely due to natural wildlife populations with possible effects from upstream recreational activities or forest operations, particularly on Harrop Creek because the water monitoring sites are upstream of residential development.
Table 4. Summary of fecal and total coliform values (CFU/100 mL) from 2009. Harrop Creek Narrows Creek Date CFU/100 mL Date CFU/100 mL
Fecal coliforms August 12 12 August 12 8 August 18 1 August 18 1 August 24 1 August 24 13 August 27 <1 August 27 4 September 2 <1 September 2 <1
Total coliforms August 12 27 August 12 34 August 18 7 August 18 34 August 24 9 August 24 29 August 27 8 August 27 14 September 2 41 September 2 26
4.5 Quality Assurance/Quality Control of water sampling
Duplicate water samples collected on February 26, 2010 for total suspended solids, specific conductivity, and turbidity demonstrated that field and laboratory sampling were accurate and repeatable. The percent difference between duplicates was 0% for TSS and turbidity for both streams and 1% for specific conductance (Table 5). This was below the recommended <25% difference for duplicates (Cavanagh et al. 1998). All values for all parameters were less than five times the detection level. When values are close to detection, a higher percent difference is acceptable but despite this duplicate samples were very close or identical.
Table 5. Duplicate sample results from Passmore Laboratory Ltd. collected February 26, 2010 TSS
(mg/L) Sp. conductance (µµµµS/sec)
Turbidity (NTU)
Precision Criteria
Harrop Creek Below detection1 112 0.201 Below detection1 111 0.201 % Difference 0%2 1% 0%2 25% Narrows Creek Below detection1 168 0.201 Below detection1 170 0.201 % Difference 0%2 1% 0%2 25% Detection limits (DL) 0.2 10 0.1 5 x DL 1.0 50 0.5
1Less than five times detection limit, 2Comparisons to % difference only valid if greater than five times detection limit

Water quality Update for Harrop and Narrows creeks 16
Integrated Ecological Research March 2010
Trip blanks collected on the same date verified that there was no contamination of sample jars prior to or during transport (Table 6). TSS levels were below analytical detection limits, specific conductance levels were 1.2 µS/cm and turbidity was 0.20 NTU for both blanks (distilled water) carried to each of the streams in typical sampling containers. Measurements of distilled water before transport to site are below detection for TSS (0.2 mg/L), 1-6 µS/cm for specific conductance, and 0.10-0.25 NTU for turbidity (Tony Yeow, pers. com.). The trip blanks were within these ranges and well below natural environmental levels.
Table 6. Trip blank results from Passmore Laboratory Ltd. February 26, 2010 Creek TSS
(mg/L) Specific Conductance
(µµµµS/sec) Turbidity
(NTU) Harrop Below detection 1.2 0.20 Narrows Below detection 1.2 0.20
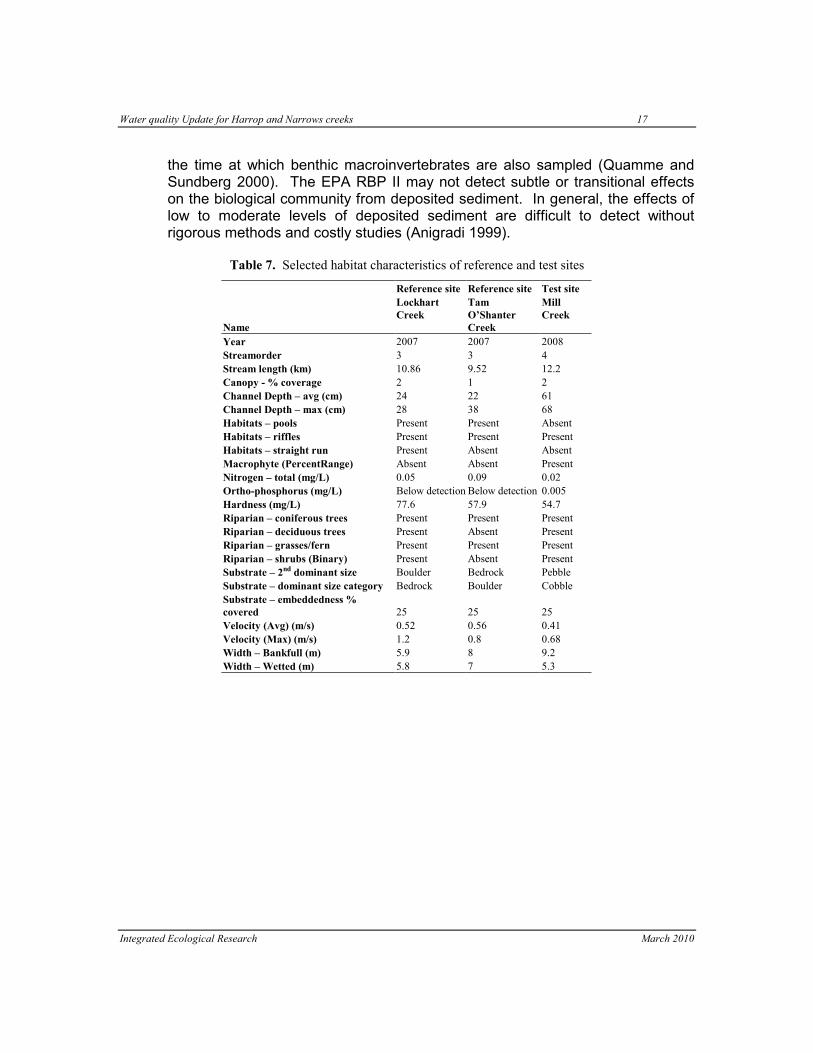
4.6 Macroinvertebrates Macroinvertebrate data from Harrop Creek (Appendix 5.9) was compared to data from Environment Canada reference sites at Lockhart and Tam O’Shanter creeks using the EPA Rapid Bioassessment Protocol II. Lockhart Creek is located within Lockhart Provincial Park and flows west to the south arm of Kootenay Lake 40 km north of Creston (Figure 1). Tam O’Shanter is located north of Riondell and also flows west to north arm of Kootenay Lake. A comparison of habitat characteristics of each macroinvertebrate site is given in Table 7.
Impairment rating scores for Harrop Creek from the RBP II indicated a slight impairment at the water quality-monitoring site relative to reference sites. Harrop Creek rated the highest scores possible (6 out of 6) for taxa richness, scrapers/collector-filterers, EPT/(EPT+chironomids), EPT index and the community loss index (Table 8). However the % Dominant taxa (0/6) and the FBI (3/6) and the ratio of shredders/total (3/6) rated lower bioassessment scores accounting for the overall rating of slight impairment.
Rapid Bioassessments are best used to detect large impacts to the macroinvertebrate community (Borisko et al. 2007). For instance, high levels of deposited sediment (from natural or forest-related sources) that result in a loss in sensitive EPT organisms and an increase in Chironomidae, Oligochaeta and Spaeridae (Waters 1995) may be picked up using this protocol. Harrop Creek showed a high EPT index, EPT/(EPT+chironomids) ratio and %EPT (93%) indicating good biological condition (Table 8). The dominant taxa in the sample were baetid and heptagenid mayflies and taeniopterygid stoneflies. In addition, the sample contained few sediment tolerant organisms including; Oligochaeta, (0.3%), and chironomids (1.9%) and an absence of Spaeridae.
High gradient streams and flushing flows typical of the Kootenays often result in low to moderate levels of deposited sediment at baseline flow corresponding to
Water quality Update for Harrop and Narrows creeks 17
Integrated Ecological Research March 2010
the time at which benthic macroinvertebrates are also sampled (Quamme and Sundberg 2000). The EPA RBP II may not detect subtle or transitional effects on the biological community from deposited sediment. In general, the effects of low to moderate levels of deposited sediment are difficult to detect without rigorous methods and costly studies (Anigradi 1999).
Table 7. Selected habitat characteristics of reference and test sites
Reference site Reference site Test site
Name
Lockhart Creek
Tam O’Shanter Creek
Mill Creek
Year 2007 2007 2008 Streamorder 3 3 4 Stream length (km) 10.86 9.52 12.2 Canopy - % coverage 2 1 2 Channel Depth – avg (cm) 24 22 61 Channel Depth – max (cm) 28 38 68 Habitats – pools Present Present Absent Habitats – riffles Present Present Present Habitats – straight run Present Absent Absent Macrophyte (PercentRange) Absent Absent Present Nitrogen – total (mg/L) 0.05 0.09 0.02 Ortho-phosphorus (mg/L) Below detection Below detection 0.005 Hardness (mg/L) 77.6 57.9 54.7 Riparian – coniferous trees Present Present Present Riparian – deciduous trees Present Absent Present Riparian – grasses/fern Present Present Present Riparian – shrubs (Binary) Present Absent Present Substrate – 2nd dominant size Boulder Bedrock Pebble Substrate – dominant size category Bedrock Boulder Cobble Substrate – embeddedness % covered 25 25 25 Velocity (Avg) (m/s) 0.52 0.56 0.41 Velocity (Max) (m/s) 1.2 0.8 0.68 Width – Bankfull (m) 5.9 8 9.2 Width – Wetted (m) 5.8 7 5.3

Water quality Update for Harrop and Narrows creeks 18
Integrated Ecological Research March 2010
Table 8. Impairment rating score for Harrop Creek1 Expected response to increasing human influence2
Metrics % Comparison to reference
Bioassessment Score
Metric Harrop Lockhart Tam O’Shanter
Harrop Reference Harrop Ref comp
Test Reference Reference Test ReferenceTaxa richness Decrease 23 19 25 105 100 6 6Family Biotic Index Increase 3.5 3.2 2.7 84 100 3 6Scrapers/ collector-filterers Decrease 98 98 96 101 100 6 6EPT/(EPT+chironomid #) Decrease 0.83 0.61 0.59 138 100 6 6% Contrib. Dom. Taxon Increase 52 38 56 111 47 0 6EPT index Decrease 15 13 16 103 100 6 6Community Loss Index Decrease 0.38 0 0 0.38 0 6 6Ratio of Shredders/Total Decrease 10 23 46 29 100 3 6Sum of Bioassessment scores
36 48
Percent of ref. Site 75% Impairment rating Slightly impaired 1Calculated at a Family level of identification, 2From Karr and Chu (1999), EPT=mayflies, stoneflies and caddisflies
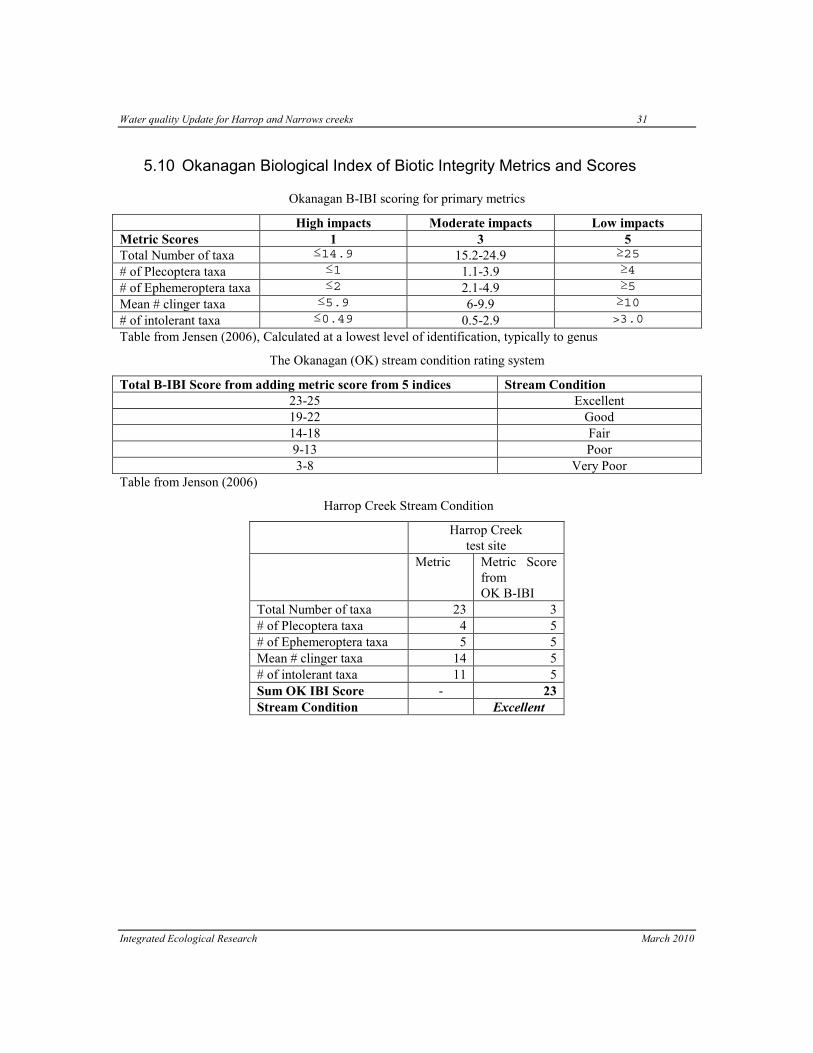
Harrop Creek was also compared to an Okanagan calibrated B-IBI (Jensen 2006), in which five metrics were used to rate stream condition into low, medium and high impact categories. Harrop Creek had better ratings for four of these metrics than the median of the low impact Okanagan streams including; the number Plecoptera taxa (4), Ephemeroptera taxa (4), intolerant taxa (11) and clinger taxa (14). The fifth metric used in the assessment, the total number of taxa, was better (higher) for Harrop Creek (9) than most moderately impacted streams in the Okanagan. The total Harrop Creek score based on these metrics was 23/25 resulting in a rating of “excellent” for Harrop Creek (see Appendix 5.10 for calculations).
Secondary metrics that were not used in the rating system because of higher variation over the range of impacted streams were also calculated for Harrop Creek and compared to Okanagan streams. These included percent % Dominance (56.2), number of trichoptera taxa (7), HBI index (3.6), percent tolerant taxa (8.7), which rated similarly or better than the median of low impact Okanagan streams. While the % predators (2.96) in Harrop Creek was better than the median of moderately impacted streams in the Okanagan.
Harrop Creek performed well against most Okanagan streams included in the Okanagan B-IBI. High levels of urbanization and pollutants such as polycyclic aromatic hydrocarbons, nickel, manganese in sediment and water alkalinity were associated with impacted streams in the Okanagan study (Jensen 2006). The Harrop Creek macroinvertebrate site was located upstream of most residential developments and sources of pollution likely accounting for the creek’s similarity to Okanagan reference streams.

Water quality Update for Harrop and Narrows creeks 19
Integrated Ecological Research March 2010
5 CONCLUSIONS AND RECOMMENDATIONS MoE drinking water guidelines for conductivity (700 µS/cm), turbidity (1NTU, 5 NTU turbidity) and TSS (20 mg/L approximation of 5 NTU) were not exceeded in 2009. Suspended-sediment levels (TSS and turbidity) in Harrop Creek were also within the range of natural variability observed on Harrop Creek and at the control site on Narrows Creek. Both Harrop and Narrows Creeks met MoE guidelines for maximum summer temperatures for drinking water (15°C) and spawning (13.3°C) and rearing fish (18 ۫°C).
In 2009, spot checks of fecal coliform counts were below guidelines for drinking water undergoing no treatment (<1 CFU/100 mL) on three out of five days on Harrop Creek and four out of five days on Narrows Creek. Fecal coliforms counts were below guidelines for disinfection of < 10 CFU on Harrop Creek and just above guideline on Narrows Creek (11 CFU/100 mL) when monitored five times over 30 days.
The Harrop Creek macroinvertebrate community rated well compared to reference streams in the Kootenays and the Okanagan and indicated good biological condition. However, use of area specific CABIN tools when available will provide more comprehensive information on the ecosystem health of Harrop Creek.
Recommendations include:
1. Continue to monitor water quality in Harrop and Narrows Creeks to ensure clean drinking water within the watershed.
2. Use field observations to initiate ground inspection of the watershed if required.
3. Continue to collect duplicate samples and trip blanks in order to ensure that are no contamination problems associated with sampling procedures.
4. Consider increasing the number of water level readings particularly during peak flows.
5. Review macroinvertebrate data using the Canadian Aquatic Biomonitoring Network (CABIN) model for the Kootenays when available in 2010.

Water quality Update for Harrop and Narrows creeks 20
Integrated Ecological Research March 2010
6 LITERATURE CITED Anigradi, T.R. 1999. Fine sediment and macroinvertebrate assemblages in
Appalachian streams: a field experiment with biomonitoring application. J. N. Amer. Benthic. Soc. Vol. 18 No. 1.
Borisko, J.P., B. W. Kilgour, L. W. Stanfield, and F.C. Jones. 2007. An evaluation of rapid bioassessment protocols for stream benthic invertebrates in Southern Ontario, Canada. Wat. Qual. Res. J. Canada. Vol. 42, No. 3, p. 184-193.
Canadian Aquatic Biomonitoring Network (CABIN). 2010. http//cabin.cciw.ca
Carver, M. 2005. Backgrounder for a water-monitoring program in the Harrop-Procter Community Forest. Prep. for :Harrop-Procter Community Forest by Aqua Associates.
Carver, M. 2006. Watershed Assessment: Harrop Creek. Prep. for Harrop-Procter Community Forest by Aqua Associates.
Cavanagh, N., R.N. Nordin, L.G. Swain and L.W. Pommen 1997. Ambient Fresh Water and Effluent Sampling Manual. Water Quality Branch, Environmental Protection, Environment, Victoria, .
Cavanagh, N., L.W. Pommen, L.G. Swain & R.N. Nordin.1998. Guidelines for Interpreting Water Quality Data. Water Quality Branch, Environment, Victoria.
FISS. 2010. www.pices.env.gov.bc.ca/FishWizardFrames.asp
HPCF 1999. http://www.hpcommunityforest.org /pdf /preliminary_inventory.pdf
Karr, J.R. and E.W. Chu. 1999. Restoring life in running waters, better biological monitoring. Island Press. Washington, DC.
Jensen. 2006. Cumulative Effects Monitoring of Okanagan Streams Using Benthic Invertebrates. Penticton, B.C. www.env.gov.bc.ca/epd/regions/okanagan/waterqual/reports.htm
Jordan, P. and E. Fanjoy. 1999. Sediment yields and sediment budgets of community water supply watersheds in southeastern British Columbia. Paper presented at Canadian Geophysical Union Annual Meeting, May 9-13, 1999.
MacDonald, L.H., A.W. Smart, R.C. Wissmar. 1991. Monitoring guidelines to evaluate effects of forestry activities on streams in the Pacific Northwest and Alaska. U.S. Environmental Protection Agency, Region 10, NPS Section, Seattle WA. EPA 910/9-91-001.
Masse, S. 2002. Reconnaissance (1:20,000) Fish and Fish Habitat Inventory (Phases 4-6) of Harrop Creek to Irvine Creek Study Area. Prep. for

Water quality Update for Harrop and Narrows creeks 21
Integrated Ecological Research March 2010
Harrop-Procter Community Cooperative, Nelson BC 18p plus two appendices and map.
MoE. 2010a. http://www.env.gov.bc.ca/wat/wq/index.html#criteria.
MoE. 2010b. http://www.a100.gov.bc.ca/pub/wtrwhse/water_licences.input
Ptolemy, R.A., D.C. Sebastian, and C.D. Tredger 1991. Maximum Salmonid Densities in Fluvial Habitats: in “Fisheries Management Report (Draft).”
Plaftkin, J.L., M.T. Barbour, K.D. Porter, S.K. Gross and R.M. Hughes 1989. Rapid bioassessment protocols for use in streams and rivers: benthic macro-invertebrates and fish. Assessment and Water Protection Division, U.S. Environmental Protection Agency. Report EPA/440/4-89-001. Washington, D.C.
Quamme, D.L., and K. Sundberg. 2000. 1999 Slocan River Watershed benthic macroinvertebrate assessment. Prep. for Winlaw Watershed Committee, Winlaw, B.C. and BC MELP, Nelson, B.C. by Aquatic Resources Ltd., Report 341-1, Nelson, B.C.
Resource Inventory Committee (RIC). 2009. Canadian Aquatic Biomonitoring Network (CABIN):Field Manual. Science and Information Branch, Ministry of Environment, Victoria, BC. http://archive.ilmb.gov.bc.ca/risc/pubs/aquatic/cabin/CABIN_field_manual.pdf
Resource Inventory Committee (RIC) 1998. Manual of Standard Operating Procedures for Hydrometric Surveys in British Columbia. Resource Inventory Branch, Environment, Victoria.
Silva, 1999. Ecosystem based Forest Use Plan for the Harrop-Procter watersheds. Prep. by Silva Forest Foundation. Prep. for the Harrop-Procter Community Forest.
Toews, D and D. Gluns. 2003. Water quality sampling: An effective way to monitor watershed condition? Streamline Watershed Management BulletinVol.7 No.2,Spring 2003. http://www.forrex.org/streamline/ISS25/streamline_vol7_no2_art6.pdf.
WSC. 2010. http://www.wsc.ec.gc.ca/hydat/H2O/index_e.cfm
Waters, T.F. 1995. Sediment in stream sources, biological effects and control. Maryland, USA. American Fisheries Society.

Water quality Update for Harrop and Narrows creeks 22
Integrated Ecological Research March 2010
5 APPENDICES
5.1 Table of Contacts Name Organization Contact
Number/Address Gaber, Leon Ministry of Environment, Victoria 250-387-6481 Leslie, Erik Harrop-Procter Community Forest 250-229-2271 Quamme, Darcie Integrated Ecological Research, Nelson 250-352-2603 Trione, Leeza Local resident, Harrop-Procter 250-229-4424 Yeow, Jennifer and Tony Passmore Laboratory Ltd., Slocan Valley 250-226-7339

Water quality Update for Harrop and Narrows creeks 23
Integrated Ecological Research March 2010
5.2 Map of Harrop (Mill) and Narrows creeks

Water quality Update for Harrop and Narrows creeks 24
Integrated Ecological Research March 2010
5.3 Hydrogeomorphic characteristics of Harrop Creek watershed for 2006 Measure Harrop Creek 1
Stream discharge Low hydrological hazard rating. Present level of forest development (7.8% weighted ECA) unlikely to result in increases in peak flows.
Sediment delivery Low to moderate hazard index for sediment sources. Extensive naturally unstable terrain with historic landslides and potential delivery to main channel. Sediment resulting from roads and trails is limited due to almost no development at present.
Riparian function Riparian areas are intact everywhere except the lower 2 km on private land where riparian function has been highly impacted.
Channel instability Low to moderate instability with a high hazard index on the naturally unstable alluvial fan exacerbated by rural development.
1 Text and data taken from Carver (2006).
5.4 Elevations of biogeoclimatic sub-zones Biogeoclimatic sub-zone Elevation Bands (m) 1
Northern slopes Southern slopes dry, warm, Interior Cedar-Hemlock ICHdw1 530 m to 1000-1100 m 1000-1100 m to 1200-1250 m moist, warm, Interior Cedar-Hemlock ICHmw2 1000-1100 m to 1450-1550 m 1200-1250 m to 1550-1650 m wet, cold, Engelmann Spruce – Subalpine Fir, ESSFwc1 1450-1550 m to 1675-1725 m 1550-1650 m to 1725-1775 m wet, cold, Engelmann Spruce – Subalpine Fir, ESSFwc4 1675-1725 m to 2050-2150 m 1725-1775 m to 2250-2275 m wet,cold, Engelmann Spruce Sub-alpine Fir parkland,
ESSFwcp 2050-2150 m to ridge tops 2250-2275 m to ridge tops
1HPCF 1999
5.5 Stream metering and discharge rating accuracy for 2009
Harrop/Mill Creek Date Measurement Temp / °C Width Area Velocity Gauge
Ht. Metered
Discharge Discharge from stage-
discharge table Discharge rating
accuracy
Stage-discharge Table
By: Type Air Water M m² m/s m m³/s m³/s % Deviation # 12/3/08 TY JY Wade 3.0 0.0 6.584 0.676 0.265 0.215 0.233 0.2187 -6.3 1 5/13/09 TY&JY Wade 14.0 3.5 7.254 1.286 0.508 0.348 0.800 0.8580 -6.8% 1 7/3/09 TY&JY Wade 27.0 7.0 7.468 1.959 0.540 0.392 1.188 1.1110 6.9% 1
8/12/09 TY&JY Wade 14.0 9.0 7.376 1.250 0.364 0.290 0.568 0.5870 -3.2% 1 11/9/09 TY&AY Wade 9.0 2.5 7.315 0.976 0.324 0.235 0.386 0.3730 3.6% 1
Narrows Creek Date Measurement Temp / °C Width Area Velocity Gauge
Ht. Metered
Discharge Discharge from stage-
discharge table Discharge rating
accuracy
Stage-discharge
Table By Type Air Water M m² m/s m m³/s m³/s % Deviation #
12/3/08 TY/JY Wade -2.0 0.0 3.200 0.346 0.250 0.265 0.1009 0.1140 13.0 2 05/13/09 TY&JY Wade 12.0 3.5 4.267 0.690 0.581 0.350 0.3490 0.3760 -7.1% 2 05/27/09 TY&JY Wade 16.0 4.0 4.237 1.392 0.819 0.475 1.3700 1.3470 1.7% 2 07/03/09 TY&JY Wade 25.0 8.0 Meter broken 2 07/08/09 TY&AY Wade 17.0 6.5 4.176 1.010 0.747 0.435 0.7360 0.9320 -21.0% 2 07/08/09 TY&AY Wade 17.0 6.5 4.234 1.179 0.764 0.435 0.8660 0.9320 -7.1% 2 08/12/09 TY&JY Wade 16.0 10.0 4.115 0.677 0.589 0.335 0.3970 0.3130 26.9% 2

Water quality Update for Harrop and Narrows creeks 25
Integrated Ecological Research March 2010
5.6 Stage-discharge tables for 2009
Stage-discharge Table #1 Harrop Creek Gauge Height (m)
0 0.001 0.002 0.003 0.004 0.005 0.006 0.007 0.008 0.009
0.25 0.429 0.432 0.436 0.439 0.443 0.447 0.451 0.454 0.458 0.462 0.26 0.466 0.469 0.473 0.477 0.481 0.485 0.489 0.493 0.496 0.500 0.27 0.504 0.508 0.512 0.516 0.520 0.524 0.528 0.532 0.537 0.541 0.28 0.545 0.549 0.553 0.557 0.561 0.566 0.570 0.574 0.578 0.583 0.29 0.587 0.591 0.595 0.600 0.604 0.608 0.613 0.617 0.622 0.626 0.3 0.630 0.635 0.639 0.644 0.648 0.653 0.657 0.662 0.667 0.671
0.31 0.676 0.680 0.685 0.690 0.694 0.699 0.704 0.709 0.713 0.718 0.32 0.723 0.728 0.732 0.737 0.742 0.747 0.752 0.757 0.762 0.767 0.33 0.771 0.776 0.781 0.786 0.791 0.796 0.801 0.807 0.812 0.817 0.34 0.822 0.827 0.832 0.837 0.842 0.848 0.853 0.858 0.863 0.869 0.35 0.874 0.879 0.884 0.890 0.895 0.901 0.906 0.911 0.917 0.922 0.36 0.928 0.933 0.939 0.944 0.950 0.955 0.961 0.966 0.972 0.977 0.37 0.983 0.989 0.994 1.000 1.006 1.011 1.017 1.023 1.029 1.034 0.38 1.040 1.046 1.052 1.058 1.063 1.069 1.075 1.081 1.087 1.093 0.39 1.099 1.105 1.111 1.117 1.123 1.129 1.135 1.141 1.147 1.153 0.4 1.159 1.166 1.172 1.178 1.184 1.190 1.197 1.203 1.209 1.215
0.41 1.222 1.228 1.234 1.241 1.247 1.254 1.260 1.266 1.273 1.279 0.42 1.286 1.292 1.299 1.305 1.312 1.318 1.325 1.332 1.338 1.345 0.43 1.351 1.358 1.365 1.371 1.378 1.385 1.392 1.398 1.405 1.412 0.44 1.419 1.426 1.433 1.439 1.446 1.453 1.460 1.467 1.474 1.481 0.45 1.488 1.495 1.502 1.509 1.516 1.523 1.530 1.537 1.545 1.552 0.46 1.559 1.566 1.573 1.581 1.588 1.595 1.602 1.610 1.617 1.624 0.47 1.632 1.639 1.646 1.654 1.661 1.669 1.676 1.683 1.691 1.698 0.48 1.706 1.713 1.721 1.729 1.736 1.744 1.751 1.759 1.767 1.774 0.49 1.782 1.790 1.798 1.805 1.813 1.821 1.829 1.836 1.844 1.852 0.5 1.860 1.868 1.876 1.884 1.892 1.900 1.908 1.916 1.924 1.932
0.51 1.940 1.948 1.956 1.964 1.972 1.980 1.988 1.996 2.005 2.013 0.52 2.021 2.029 2.038 2.046 2.054 2.062 2.071 2.079 2.088 2.096 0.53 2.104 2.113 2.121 2.130 2.138 2.147 2.155 2.164 2.172 2.181 0.54 2.189 2.198 2.206 2.215 2.224 2.232 2.241 2.250 2.259 2.267 0.55 2.276 2.285 2.294 2.302 2.311 2.320 2.329 2.338 2.347 2.356 0.56 2.365 2.374 2.382 2.391 2.400 2.409 2.419 2.428 2.437 2.446 0.57 2.455 2.464 2.473 2.482 2.492 2.501 2.510 2.519 2.528 2.538 0.58 2.547 2.556 2.566 2.575 2.584 2.594 2.603 2.613 2.622 2.631 0.59 2.641 2.650 2.660 2.669 2.679 2.689 2.698 2.708 2.717 2.727 0.6 2.737 2.746 2.756 2.766 2.775 2.785 2.795 2.805 2.814 2.824
0.61 2.834 2.844 2.854 2.864 2.874 2.884 2.893 2.903 2.913 2.923 0.62 2.933 2.943 2.953 2.964 2.974 2.984 2.994 3.004 3.014 3.024 0.63 3.034 3.045 3.055 3.065 3.075 3.086 3.096 3.106 3.117 3.127 0.64 3.137 3.148 3.158 3.169 3.179 3.190 3.200 3.211 3.221 3.232 0.65 3.242 3.253 3.263 3.274 3.285 3.295 3.306 3.317 3.327 3.338 0.66 3.349 3.359 3.370 3.381 3.392 3.403 3.413 3.424 3.435 3.446 0.67 3.457 3.468 3.479 3.490 3.501 3.512 3.523 3.534 3.545 3.556 0.68 3.567 3.578 3.589 3.601 3.612 3.623 3.634 3.645 3.657 3.668 0.69 3.679 3.691 3.702 3.713 3.725 3.736 3.747 3.759 3.770 3.782 0.7 3.793 3.805 3.816 3.828 3.839 3.851 3.862 3.874 3.886 3.897
0.71 3.909 3.920 3.932 3.944 3.956 3.967 3.979 3.991 4.003 4.014 0.72 4.026 4.038 4.050 4.062 4.074 4.086 4.098 4.110 4.122 4.134
Water quality Update for Harrop and Narrows creeks 26
Integrated Ecological Research March 2010
Stage-discharge Table #2 Narrows Creek Gauge
Height (m 0 0.001 0.002 0.003 0.004 0.005 0.006 0.007 0.008 0.009
0.25 0.092 0.093 0.095 0.097 0.098 0.100 0.102 0.103 0.105 0.107 0.26 0.108 0.110 0.112 0.114 0.115 0.117 0.119 0.121 0.123 0.125 0.27 0.127 0.129 0.131 0.133 0.135 0.137 0.139 0.141 0.143 0.145 0.28 0.148 0.150 0.152 0.154 0.157 0.159 0.161 0.164 0.166 0.169 0.29 0.171 0.174 0.176 0.179 0.181 0.184 0.186 0.189 0.192 0.194 0.3 0.197 0.200 0.203 0.205 0.208 0.211 0.214 0.217 0.220 0.223
0.31 0.226 0.229 0.232 0.235 0.239 0.242 0.245 0.248 0.251 0.255 0.32 0.258 0.262 0.265 0.268 0.272 0.275 0.279 0.283 0.286 0.290 0.33 0.294 0.297 0.301 0.305 0.309 0.313 0.317 0.321 0.325 0.329 0.34 0.333 0.337 0.341 0.345 0.349 0.354 0.358 0.362 0.367 0.371 0.35 0.376 0.380 0.385 0.389 0.394 0.398 0.403 0.408 0.413 0.418 0.36 0.422 0.427 0.432 0.437 0.442 0.448 0.453 0.458 0.463 0.468 0.37 0.474 0.479 0.485 0.490 0.496 0.501 0.507 0.512 0.518 0.524 0.38 0.530 0.536 0.541 0.547 0.553 0.559 0.566 0.572 0.578 0.584 0.39 0.590 0.597 0.603 0.610 0.616 0.623 0.629 0.636 0.643 0.650 0.4 0.656 0.663 0.670 0.677 0.684 0.691 0.699 0.706 0.713 0.720
0.41 0.728 0.735 0.743 0.750 0.758 0.766 0.773 0.781 0.789 0.797 0.42 0.805 0.813 0.821 0.829 0.838 0.846 0.854 0.863 0.871 0.880 0.43 0.888 0.897 0.906 0.914 0.923 0.932 0.941 0.950 0.959 0.969 0.44 0.978 0.987 0.997 1.006 1.016 1.025 1.035 1.045 1.054 1.064 0.45 1.074 1.084 1.094 1.104 1.115 1.125 1.135 1.146 1.156 1.167 0.46 1.178 1.188 1.199 1.210 1.221 1.232 1.243 1.254 1.266 1.277 0.47 1.288 1.300 1.312 1.323 1.335 1.347 1.359 1.371 1.383 1.395 0.48 1.407 1.419 1.432 1.444 1.457 1.469 1.482 1.495 1.508 1.521 0.49 1.534 1.547 1.560 1.573 1.587 1.600 1.614 1.627 1.641 1.655 0.5 1.669 1.683 1.697 1.711 1.726 1.740 1.754 1.769 1.784 1.798
0.51 1.813 1.828 1.843 1.858 1.873 1.889 1.904 1.919 1.935 1.951 0.52 1.966 1.982 1.998 2.014 2.030 2.047 2.063 2.080 2.096 2.113 0.53 2.130 2.146 2.163 2.180 2.198 2.215 2.232 2.250 2.267 2.285 0.54 2.303 2.321 2.339 2.357 2.375 2.393 2.412 2.430 2.449 2.467 0.55 2.486 2.505 2.524 2.544 2.563 2.582 2.602 2.621 2.641 2.661 0.56 2.681 2.701 2.721 2.741 2.762 2.782 2.803 2.824 2.845 2.866 0.57 2.887 2.908 2.929 2.951 2.973 2.994 3.016 3.038 3.060 3.082 0.58 3.105 3.127 3.150 3.172 3.195 3.218 3.241 3.264 3.288 3.311 0.59 3.335 3.358 3.382 3.406 3.430 3.455 3.479 3.503 3.528 3.553 0.6 3.578 3.603 3.628 3.653 3.678 3.704 3.730 3.755 3.781 3.807
0.61 3.834 3.860 3.886 3.913 3.940 3.967 3.994 4.021 4.048 4.076 0.62 4.103 4.131 4.159 4.187 4.215 4.244 4.272 4.301 4.329 4.358 0.63 4.387 4.417 4.446 4.475 4.505 4.535 4.565 4.595 4.625 4.656 0.64 4.686 4.717 4.748 4.779 4.810 4.841 4.873 4.904 4.936 4.968 0.65 5.000 5.032 5.065 5.097 5.130 5.163 5.196 5.229 5.262 5.296 0.66 5.330 5.363 5.397 5.432 5.466 5.501 5.535 5.570 5.605 5.640 0.67 5.676 5.711 5.747 5.783 5.819 5.855 5.891 5.928 5.964 6.001 0.68 6.038 6.076 6.113 6.151 6.188 6.226 6.264 6.303 6.341 6.380 0.69 6.418 6.457 6.497 6.536 6.576 6.615 6.655 6.695 6.735 6.776 0.7 6.817 6.857 6.898 6.940 6.981 7.022 7.064 7.106 7.148 7.191
0.71 7.233 7.276 7.319 7.362 7.405 7.449 7.492 7.536 7.580 7.624 0.72 7.669 7.713 7.758 7.803 7.849 7.894 7.940 7.986 8.032 8.078

Water quality Update for Harrop and Narrows creeks 27
Integrated Ecological Research March 2010
5.7 Raw Water quality Data Harrop Creek
Date Time Weather Air Water TSS SpCond Turb Total Coli
Fecal Coli
Gauge Flow
M/D/Y °C °C mg/L uS/cm NTU CFU CFU m m3/s 01/01/2009 2:00PM <0.5 109 0.15 snow 02/04/2009 3:30PM Overcast <0.5 110 0.15 snow 03/04/2009 9:30AM Overcast <0.5 110.0 0.15 0.220 0.327 03/20/2009 11:50AM Overcast 0.8 113.0 0.10 0.210 0.296 04/15/2009 3:30PM Sunny <0.5 91.3 0.50 0.270 0.504 04/22/2009 2:45PM Overcast/rain 1.9 76.2 0.35 0.370 0.983 05/02/2009 1:50PM Sunny <0.5 101.0 0.15 0.380 1.040 05/13/2009 0.347 0.858 05/17/2009 4:30PM Sunny 5.5 63.5 0.45 0.420 1.286 05/31/2009 1:50PM Sunny/hot 0.8 85.2 0.55 0.650 3.242 06/09/2009 3:20PM overcast 0.6 65.1 0.20 0.520 2.021 06/16/2009 8:40PM Overcast <0.5 58.2 0.35 0.570 2.455 06/28/2009 11:00AM Sunny <0.5 71.1 0.35 0.430 1.351 07/03/2009 0.392 1.111 07/12/2009 4:45PM Overcast <0.5 82.2 0.20 0.350 0.874 08/12/2009 Rain <0.5 95.1 0.15 27 12 0.290 0.587 08/18/2009 5:48PM Sunny/overcast <0.5 97.1 0.10 7 1 0.270 0.504 08/24/2009 9 1 08/27/2009 8 <1 09/02/2009 11:43AM Sunny <0.5 108.0 0.10 41 <1 0.240 0.393 09/13/2009 11:30AM Overcast <0.5 110.0 0.15 0.250 0.429 09/20/2009 5:40PM Sunny <0.5 106.0 0.15 0.250 0.429 11/02/2009 11:30AM <0.5 97.9 0.15 0.230 0.359 11/09/2009 0.234 0.372 11/18/2009 12:10PM Overcast 0.6 154.0 0.15 0.230 0.359 01/02/2010 2:00PM Overcast <0.5 106.0 0.10 snow

Water quality Update for Harrop and Narrows creeks 28
Integrated Ecological Research March 2010
Narrows Creek Date Time Weather Air Water TSS SpCond Turb Total
Coli Fecal Coli
Gauge Flow
M/D/Y °C °C mg/L uS/cm NTU CFU CFU m m3/s 12/02/2009 11:40AM Overcast < 0.5 162 0.15 iced 04/03/2009 8:50AM Overcast <0.5 165 0.1 iced 20/03/2009 10:45AM Overcast 0.6 166 0.15 0.210 0.044 15/04/2009 2:25PM Sunny <0.5 164 0.15 0.300 0.197 22/04/2009 2:10PM Overcast/rain 0.8 147 0.2 0.390 0.590 02/05/2009 4:15PM Sunny <0.5 165 0.1 0.300 0.197 13/05/2009 12.0 3.5 0.350 0.376 16/05/2009 1:30PM Sunny 0.8 145 0.15 0.390 0.590 27/05/2009 16.0 4.0 0.475 1.347 31/05/2009 7:10PM Sunny/hot 8.8 55.5 0.7 0.600 3.578 09/06/2009 3:20PM Overcast 0.8 101 0.2 15/06/2009 5:00PM Overcast 1.3 92.3 0.2 0.570 2.887 03/07/2009 25.0 8.0 0.435 0.932 08/07/2009 17.0 6.5 0.435 0.932 12/07/2009 3:50PM Overcast 0.6 116 0.25 0.420 0.805 12/08/2009 16.0 10.0 <0.5 138 0.1 34 8 0.335 0.313 18/08/2009 5:07PM Sunny/overcast <0.5 141 0.15 34 0 0.300 0.197 24/08/2009 29 13 27/08/2009 14 4 02/09/2009 3:40PM Sunny 0.6 152 0.2 26 0 0.300 0.197 13/09/2009 2:30PM Overcast <0.5 156 0.15 0.280 0.148 20/09/2009 4:30PM Sunny 0.8 152 0.15 0.300 0.197 02/11/2009 1:45PM <0.5 153 0.15 0.300 0.197 09/11/2009 6.0 2.0 0.288 0.166 18/11/2009 11:30AM Overcast <0.5 101 0.2 0.290 0.171 02/01/2010 1:55PM Overcast 0.8 161 0.1 snow
Water quality Update for Harrop and Narrows creeks 29
Integrated Ecological Research March 2010
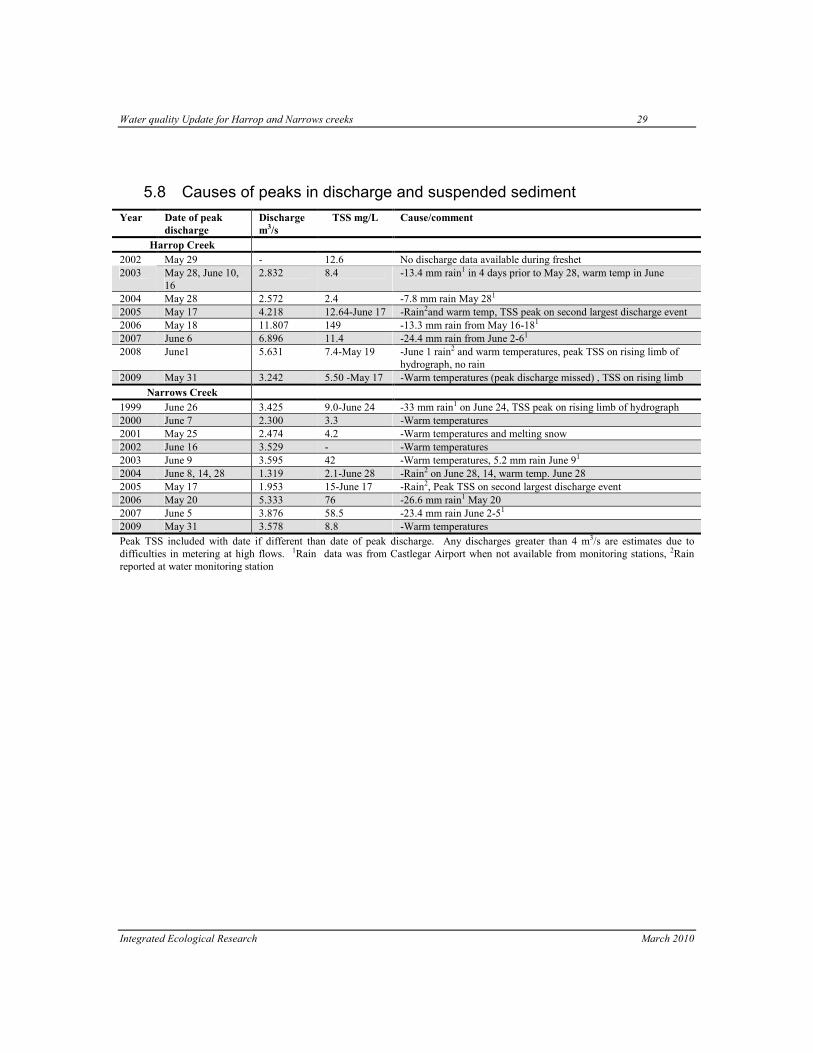
5.8 Causes of peaks in discharge and suspended sediment
Year Date of peak discharge
Discharge m3/s
TSS mg/L Cause/comment
Harrop Creek 2002 May 29 - 12.6 No discharge data available during freshet 2003 May 28, June 10,
16 2.832 8.4 -13.4 mm rain1 in 4 days prior to May 28, warm temp in June
2004 May 28 2.572 2.4 -7.8 mm rain May 281 2005 May 17 4.218 12.64-June 17 -Rain2and warm temp, TSS peak on second largest discharge event 2006 May 18 11.807 149 -13.3 mm rain from May 16-181 2007 June 6 6.896 11.4 -24.4 mm rain from June 2-61 2008 June1 5.631 7.4-May 19 -June 1 rain2 and warm temperatures, peak TSS on rising limb of
hydrograph, no rain 2009 May 31 3.242 5.50 -May 17 -Warm temperatures (peak discharge missed) , TSS on rising limb
Narrows Creek 1999 June 26 3.425 9.0-June 24 -33 mm rain1 on June 24, TSS peak on rising limb of hydrograph 2000 June 7 2.300 3.3 -Warm temperatures 2001 May 25 2.474 4.2 -Warm temperatures and melting snow 2002 June 16 3.529 - -Warm temperatures 2003 June 9 3.595 42 -Warm temperatures, 5.2 mm rain June 91 2004 June 8, 14, 28 1.319 2.1-June 28 -Rain2 on June 28, 14, warm temp. June 28 2005 May 17 1.953 15-June 17 -Rain2, Peak TSS on second largest discharge event 2006 May 20 5.333 76 -26.6 mm rain1 May 20 2007 June 5 3.876 58.5 -23.4 mm rain June 2-51 2009 May 31 3.578 8.8 -Warm temperatures Peak TSS included with date if different than date of peak discharge. Any discharges greater than 4 m3/s are estimates due to difficulties in metering at high flows. 1Rain data was from Castlegar Airport when not available from monitoring stations, 2Rain reported at water monitoring station

Water quality Update for Harrop and Narrows creeks 30
Integrated Ecological Research March 2010
5.9 Macroinvertebrate raw data Study name EC-Columbia Basin EC-Columbia Basin CBWN-Slocan River Site (Date) LOC01 (Sep 26, 2007) TAM01 (Sep 26, 2007) NJMIL01 (Sep 29, 2008) Latitude 49.50749969 49.79249954Longitude -116.7822189 -116.8477783Name Lockhart Creek Tam O'Shanter Creek Harrop (Mill) Creek Basin Kootenay Lake Kootenay Lake Columbia Basin JulianDay 269 269 273Year 2007 2007 2008Device Kick Net Kick Net Kick Net Samplenumber 1 1 1Site_Status Pot. Ref. Pot. Ref. Test Subsample 45 41 100Totalsample 100 100 100Ameletidae 2 2 1Baetidae 398 219 209Brachycentridae 2Capniidae 2 12Ceratopogonidae 4 2Chironomidae 18 29 7Chloroperlidae 24 2 1Elmidae 29 34 9Empididae 7Enchytraeidae 1Ephemerellidae 18 10 14Glossosomatidae 10 1Heptageniidae 64 51 67Hydropsychidae 9 5 1Lebertiidae 2 1Leptophlebiidae 1Leuctridae 4 10Limnephilidae 2 2 1Lumbriculidae 2Nemouridae 67 34 2Perlidae 2 10Perlodidae 5 3Perlodidae 5 3Psychodidae 3Rhyacophilidae 13 17 5Simuliidae 2Sperchonidae 5 1Stygothrombidiidae 2Taeniopterygidae 98 305 29Tipulidae 4 7 4Torrenticolidae 5Uenoidae 15 8
Water quality Update for Harrop and Narrows creeks 31
Integrated Ecological Research March 2010
5.10 Okanagan Biological Index of Biotic Integrity Metrics and Scores
Okanagan B-IBI scoring for primary metrics
High impacts Moderate impacts Low impacts Metric Scores 1 3 5 Total Number of taxa ≤14.9 15.2-24.9 ≥25 # of Plecoptera taxa ≤1 1.1-3.9 ≥4 # of Ephemeroptera taxa ≤2 2.1-4.9 ≥5 Mean # clinger taxa ≤5.9 6-9.9 ≥10 # of intolerant taxa ≤0.49 0.5-2.9 >3.0
Table from Jensen (2006), Calculated at a lowest level of identification, typically to genus
The Okanagan (OK) stream condition rating system
Total B-IBI Score from adding metric score from 5 indices Stream Condition 23-25 Excellent 19-22 Good 14-18 Fair 9-13 Poor 3-8 Very Poor
Table from Jenson (2006) Harrop Creek Stream Condition
Harrop Creek test site
Metric Metric Score from OK B-IBI
Total Number of taxa 23 3 # of Plecoptera taxa 4 5 # of Ephemeroptera taxa 5 5 Mean # clinger taxa 14 5 # of intolerant taxa 11 5 Sum OK IBI Score - 23 Stream Condition Excellent