harris interactive src risk, churn, win back workshop
TRANSCRIPT
Customer Risk, Churn, and Successful WinBackMichael Lowenstein, PhD CMC
Senior Vice President and Senior Consultant
Stakeholder Relationship Consulting CoE
© Harris Interactive
© Harris Interactive
The Business Issue
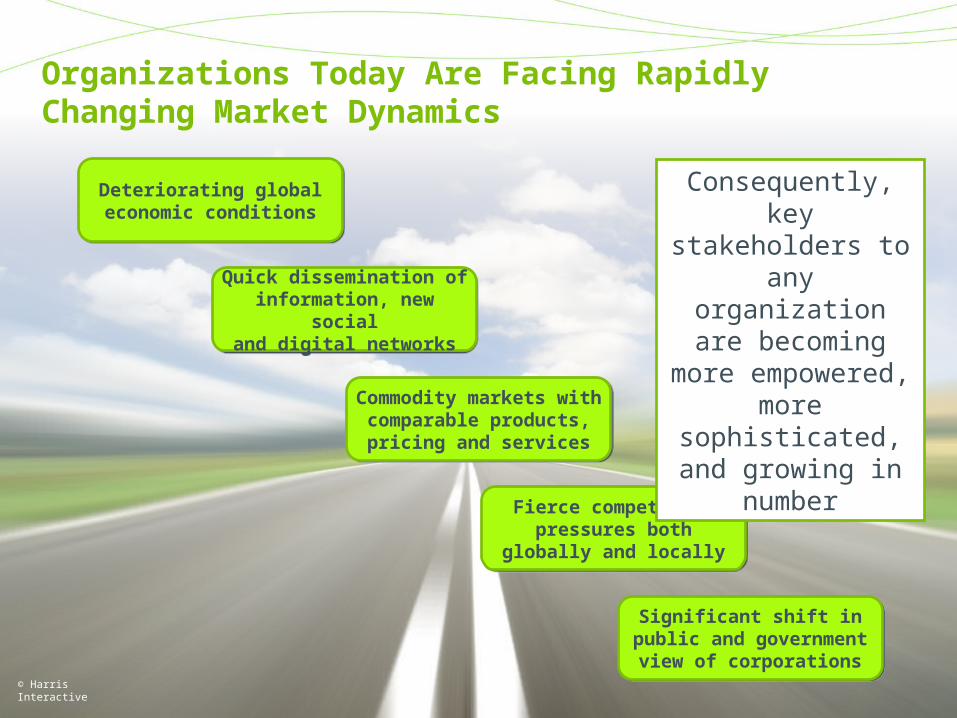
Deteriorating global economic conditionsDeteriorating global economic conditions
Commodity markets with comparable products, pricing and services
Commodity markets with comparable products, pricing and services
Fierce competition pressures both
globally and locally
Fierce competition pressures both
globally and locally
Organizations Today Are Facing Rapidly Changing Market Dynamics
© Harris Interactive
Quick dissemination of information, new social
and digital networks
Quick dissemination of information, new social
and digital networks
Significant shift in public and government view of
corporations
Significant shift in public and government view of
corporations
Consequently, key stakeholders to any
organization are becoming more
empowered, more sophisticated, and growing in number
“Successful companies are those where the brand promise is
matched by the stakeholders’ experience”
Line of Sight Between…..
• Transactional customer touch points; both KPMs and relationship components
• Longitudinal customer experience and overall perceived value• Creators of risk• Drivers of churn; final factors• Opportunities for customer recovery/winback
© Harris Interactive
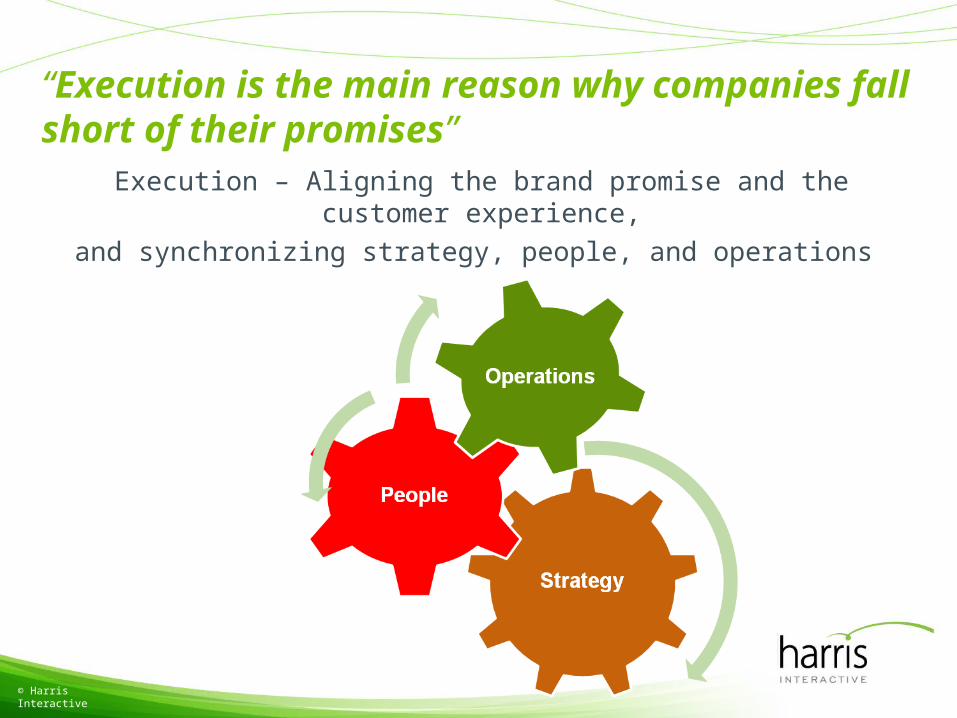
“Execution is the main reason why companies fall short of their promises”
Execution – Aligning the brand promise and the customer experience,
and synchronizing strategy, people, and operations
© Harris Interactive
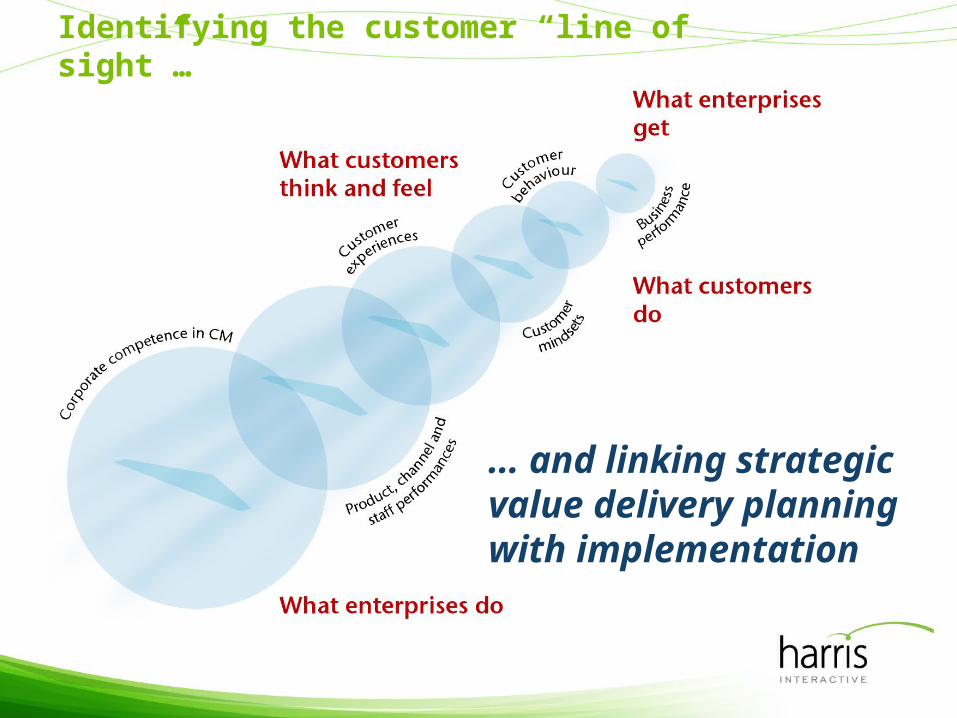
… and linking strategic value delivery planning with implementation
Identifying the customer “line of sight”…Identifying the customer “line of sight”…
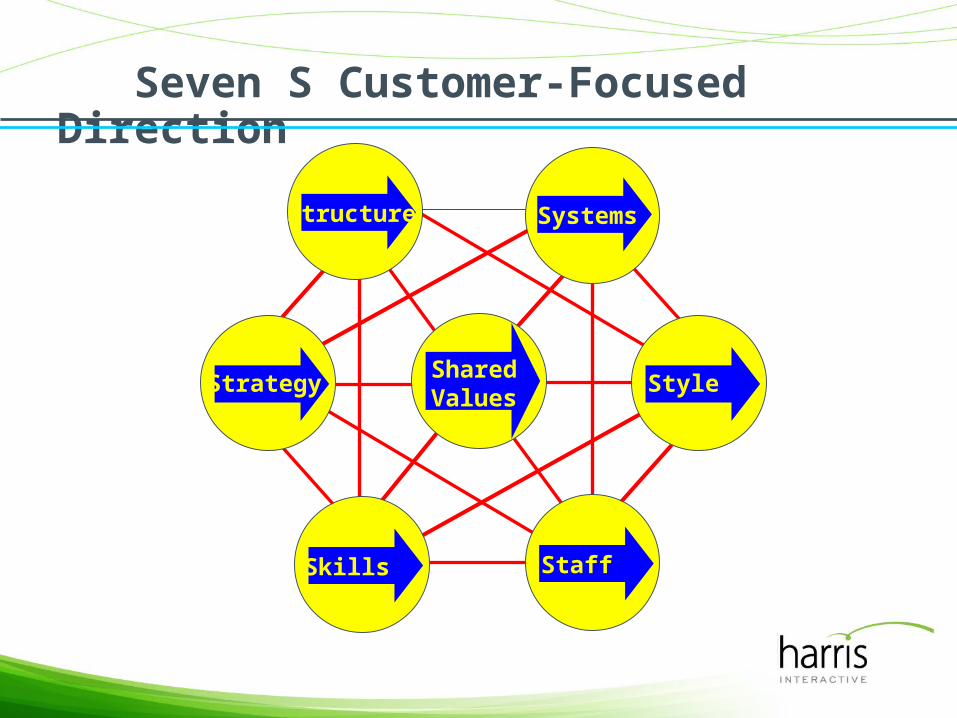
Seven S Customer-Focused Direction
Structure Systems
Strategy StyleSharedValues
Skills Staff
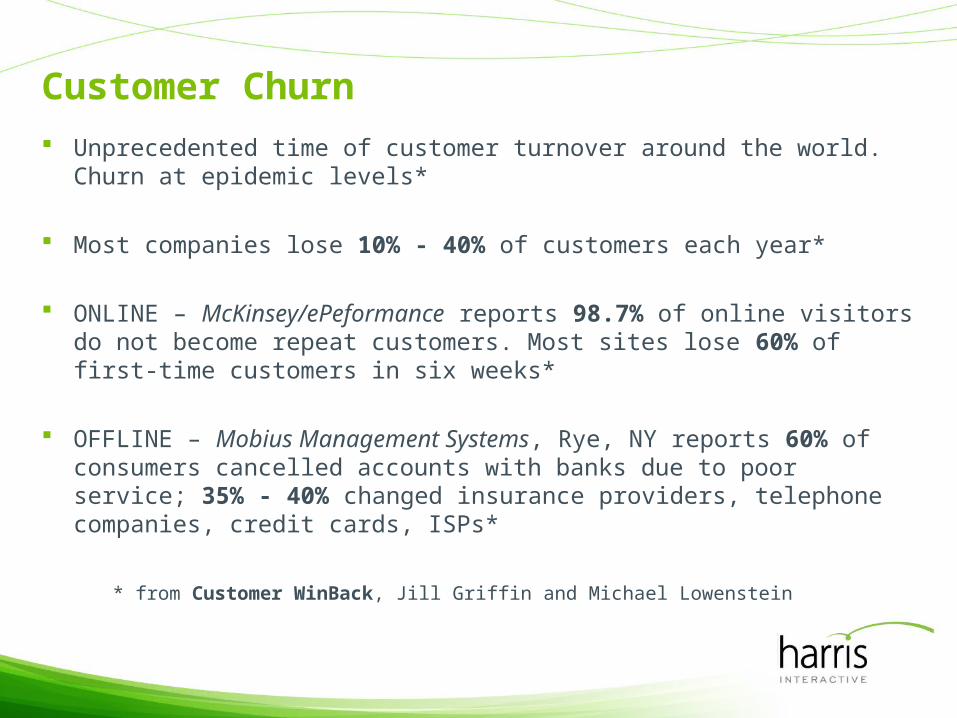
Customer Churn
Unprecedented time of customer turnover around the world. Churn at epidemic levels*
Most companies lose 10% - 40% of customers each year*
ONLINE – McKinsey/ePeformance reports 98.7% of online visitors do not become repeat customers. Most sites lose 60% of first-time customers in six weeks*
OFFLINE – Mobius Management Systems, Rye, NY reports 60% of consumers cancelled accounts with banks due to poor service; 35% - 40% changed insurance providers, telephone companies, credit cards, ISPs*
* from Customer WinBack, Jill Griffin and Michael Lowenstein
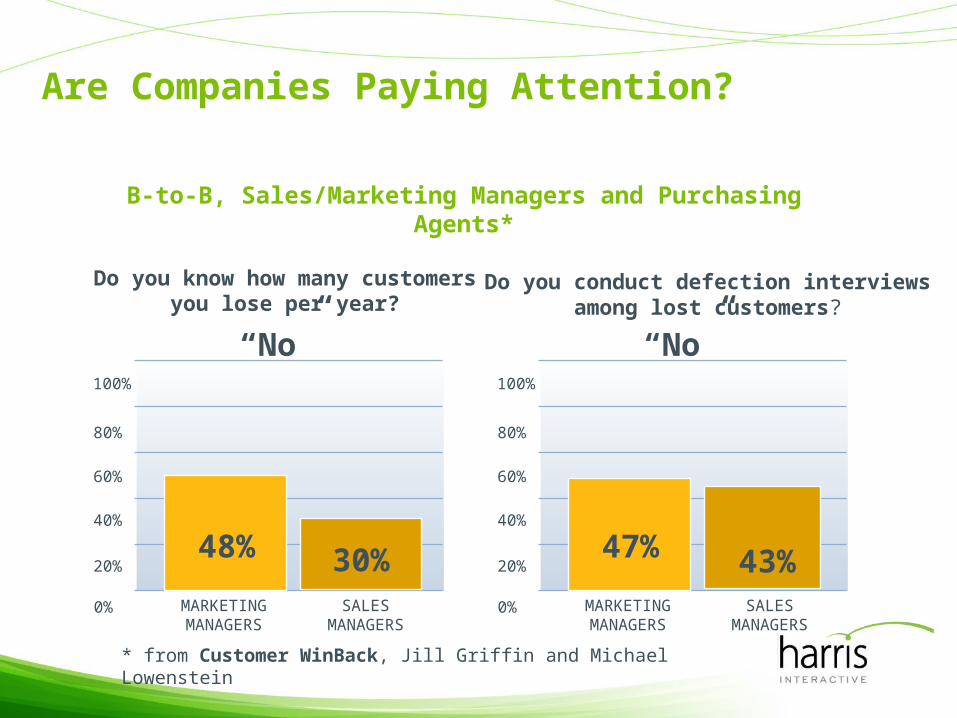
Are Companies Paying Attention?
Do you conduct defection interviewsamong lost customers?
B-to-B, Sales/Marketing Managers and Purchasing Agents*
Do you know how many customersyou lose per year?
“No”
48% 30%20%
MARKETINGMANAGERS
SALESMANAGERS
40%
60%
80%
100%
0%
“No”
47% 43%20%
MARKETINGMANAGERS
SALESMANAGERS
40%
60%
80%
100%
0%
* from Customer WinBack, Jill Griffin and Michael Lowenstein
11
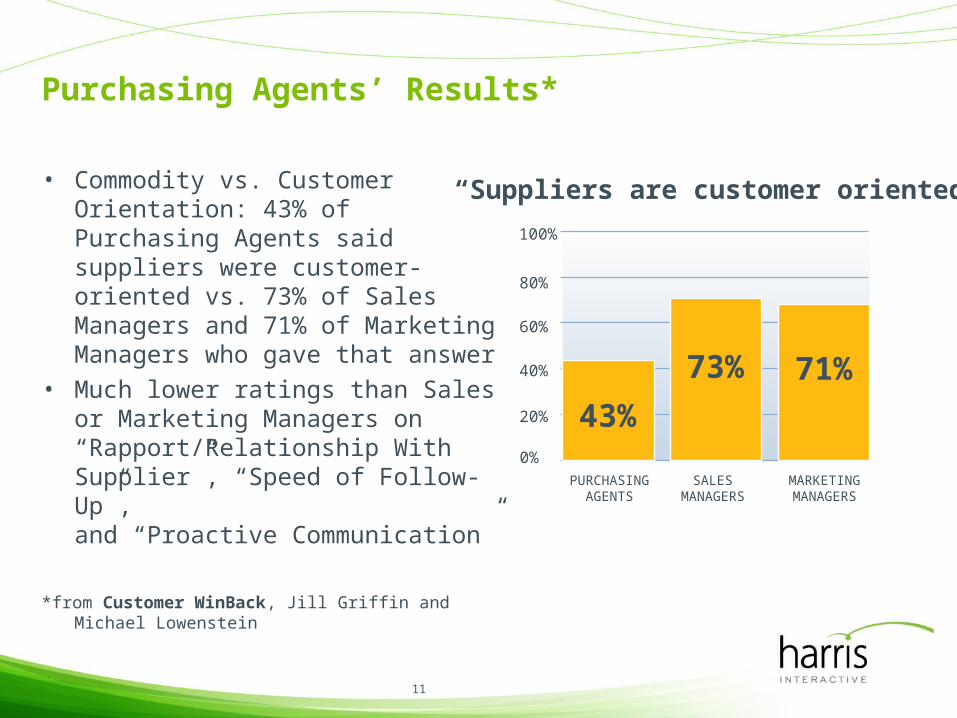
Purchasing Agents’ Results*
• Commodity vs. Customer Orientation: 43% of Purchasing Agents said suppliers were customer-oriented vs. 73% of Sales Managers and 71% of Marketing Managers who gave that answer
• Much lower ratings than Sales or Marketing Managers on “Rapport/Relationship With Supplier”, “Speed of Follow-Up”, and “Proactive Communication”
*from Customer WinBack, Jill Griffin and Michael Lowenstein
“Suppliers are customer oriented.”
43%20%
PURCHASINGAGENTS
SALESMANAGERS
40%
60%
80%
100%
0%MARKETINGMANAGERS
73% 71%
12
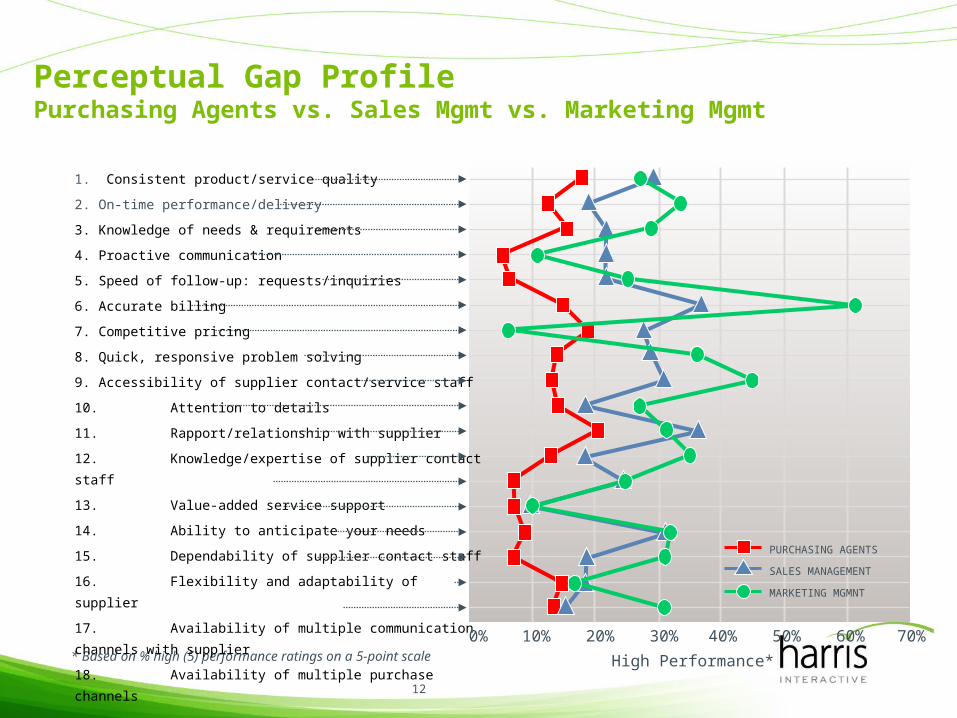
Perceptual Gap ProfilePurchasing Agents vs. Sales Mgmt vs. Marketing Mgmt
* Based on % high (5) performance ratings on a 5-point scale
1. Consistent product/service quality
2. On-time performance/delivery
3. Knowledge of needs & requirements
4. Proactive communication
5. Speed of follow-up: requests/inquiries
6. Accurate billing
7. Competitive pricing
8. Quick, responsive problem solving
9. Accessibility of supplier contact/service staff
10. Attention to details
11. Rapport/relationship with supplier
12. Knowledge/expertise of supplier contact staff
13. Value-added service support
14. Ability to anticipate your needs
15. Dependability of supplier contact staff
16. Flexibility and adaptability of supplier
17. Availability of multiple communication channels with supplier
18. Availability of multiple purchase channels
PURCHASING AGENTS
SALES MANAGEMENT
MARKETING MGMNT
0% 10% 20% 30% 40% 50% 60% 70%
High Performance*
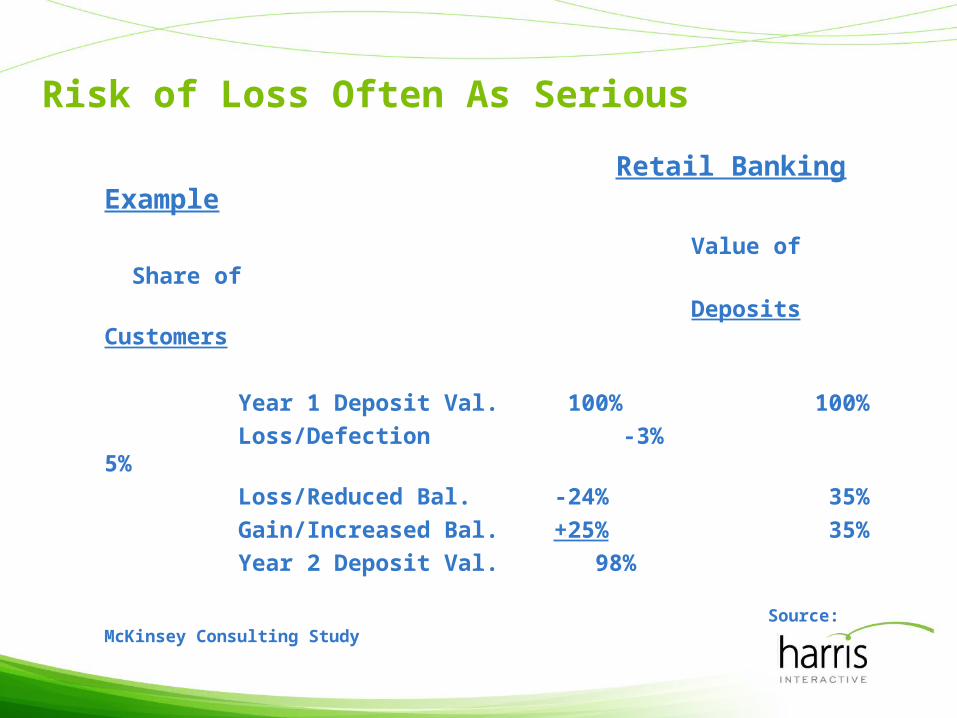
Risk of Loss Often As Serious
Retail Banking Example
Value of Share of
Deposits Customers
Year 1 Deposit Val. 100% 100%
Loss/Defection -3% 5%
Loss/Reduced Bal. -24% 35%
Gain/Increased Bal. +25% 35%
Year 2 Deposit Val. 98%
Source: McKinsey Consulting Study
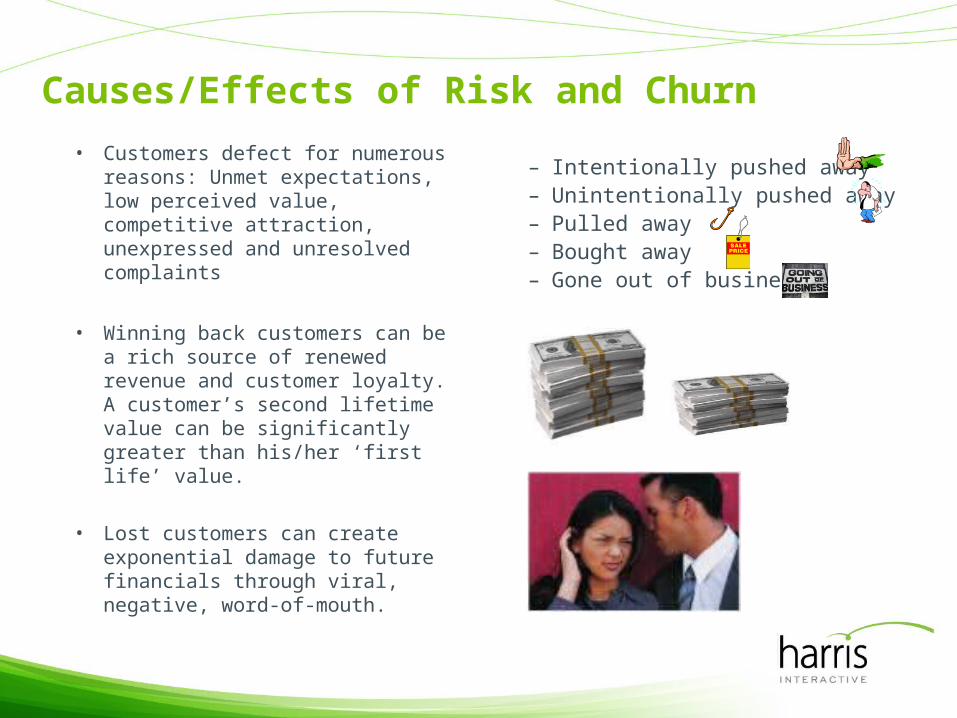
– Intentionally pushed away – Unintentionally pushed away– Pulled away– Bought away– Gone out of business
• Customers defect for numerous reasons: Unmet expectations, low perceived value, competitive attraction, unexpressed and unresolved complaints
• Winning back customers can be a rich source of renewed revenue and customer loyalty. A customer’s second lifetime value can be significantly greater than his/her ‘first life’ value.
• Lost customers can create exponential damage to future financials through viral, negative, word-of-mouth.
Causes/Effects of Risk and Churn
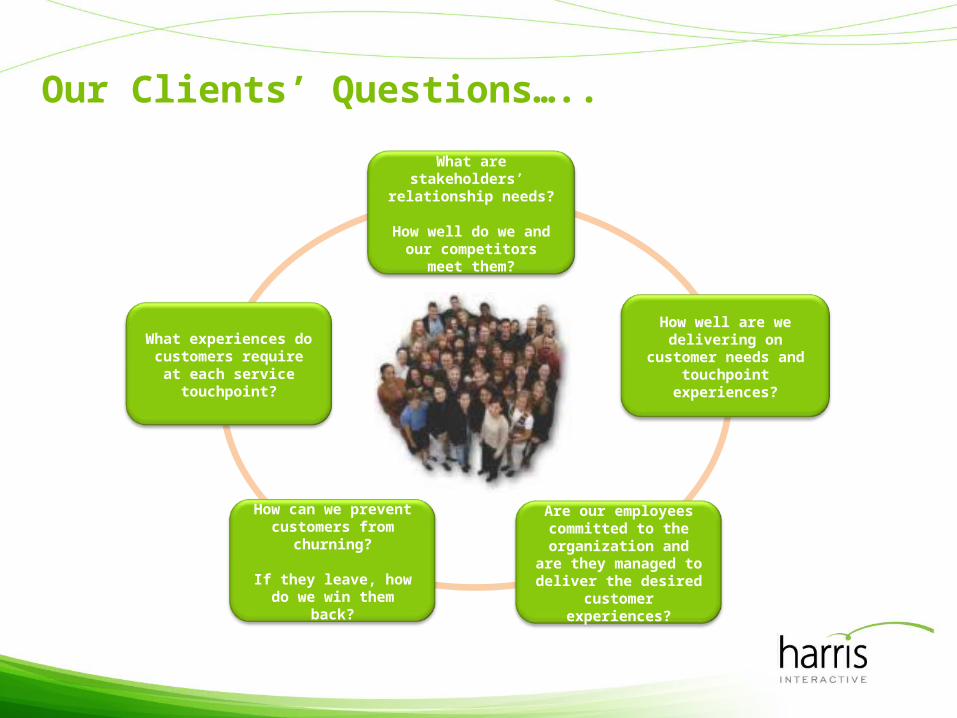
Our Clients’ Questions…..
What are stakeholders’ relationship needs?
How well do we and our competitors meet them?
How well are we delivering on customer needs and touchpoint
experiences?
Are our employees committed to the
organization and are they managed to deliver
the desired customer experiences?
How can we prevent customers from
churning?
If they leave, how do we win them back?
What experiences do customers require at
each service touchpoint?
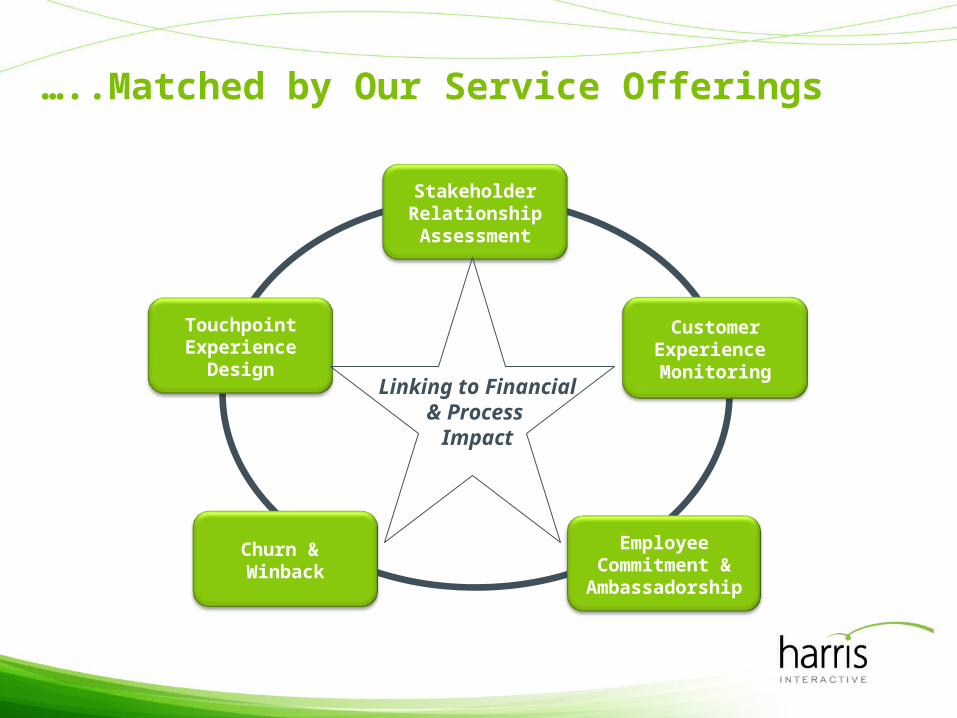
…..Matched by Our Service Offerings
Customer Experience Monitoring
Employee Commitment &
Ambassadorship
Churn & Winback
Touchpoint Experience
Design
Stakeholder RelationshipAssessment
Linking to Financial & Process
Impact
© Harris Interactive
Risk, Churn & WinBack Overview
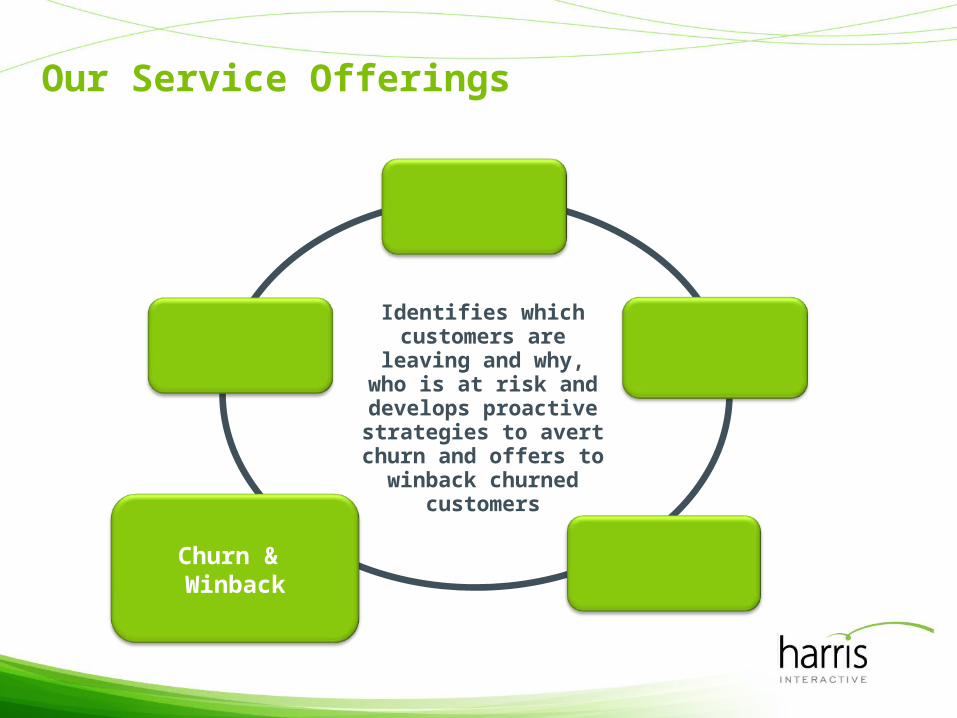
Our Service Offerings
Churn & Winback
Identifies which customers are leaving and why, who is at risk and develops proactive
strategies to avert churn and offers to winback churned
customers
19
How to identify the high percentage of their customers
who are at risk and may defect
20
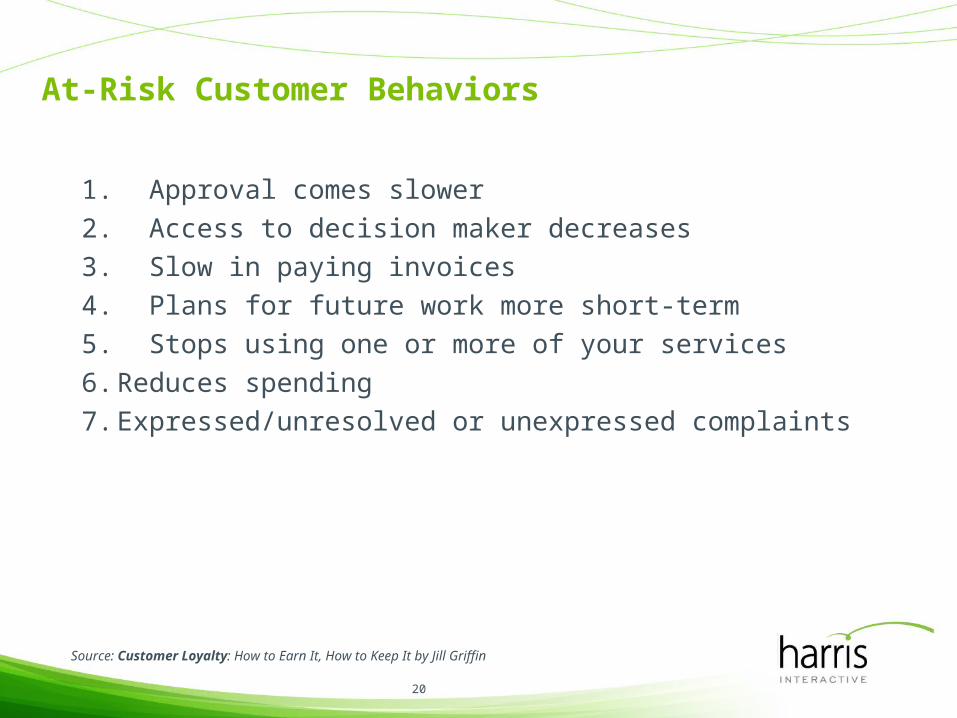
At-Risk Customer Behaviors
1. Approval comes slower
2. Access to decision maker decreases
3. Slow in paying invoices
4. Plans for future work more short-term
5. Stops using one or more of your services
6. Reduces spending
7. Expressed/unresolved or unexpressed complaints
Source: Customer Loyalty: How to Earn It, How to Keep It by Jill Griffin
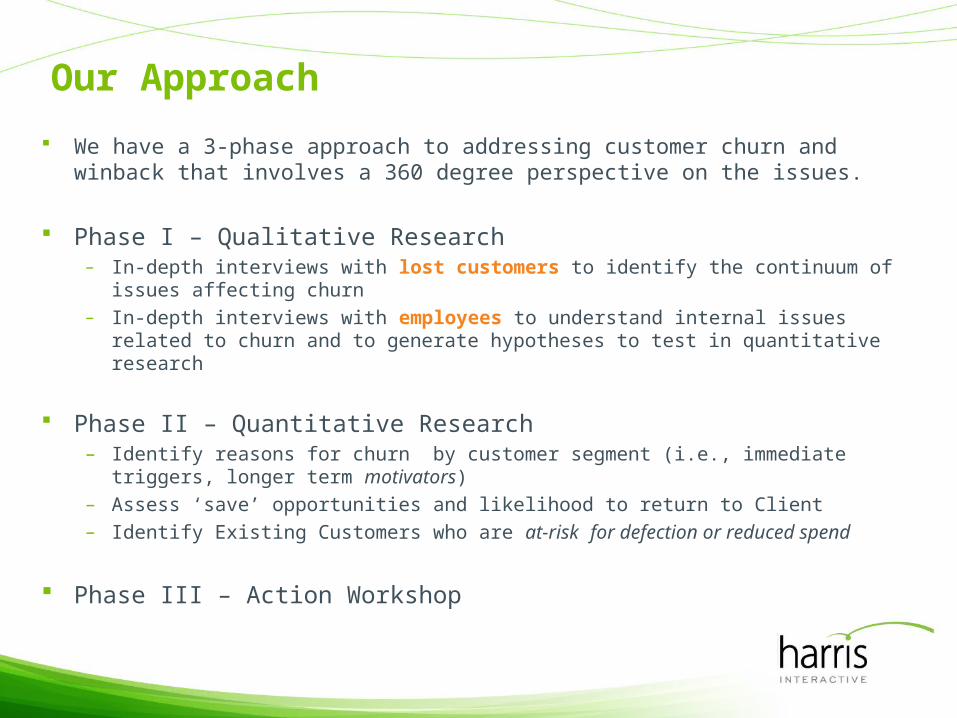
We have a 3-phase approach to addressing customer churn and winback that involves a 360 degree perspective on the issues.
Phase I – Qualitative Research– In-depth interviews with lost customers to identify the continuum of issues affecting
churn– In-depth interviews with employees to understand internal issues related to churn and
to generate hypotheses to test in quantitative research
Phase II – Quantitative Research– Identify reasons for churn by customer segment (i.e., immediate triggers, longer term
motivators)– Assess ‘save’ opportunities and likelihood to return to Client– Identify Existing Customers who are at-risk for defection or reduced spend
Phase III – Action Workshop
Our Approach
22
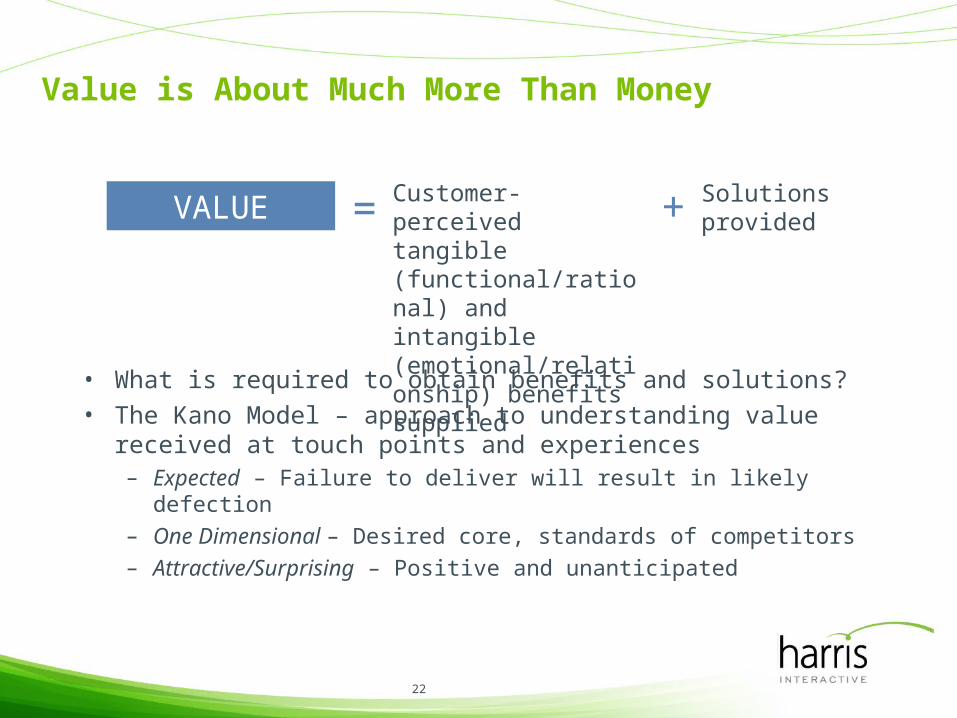
Value is About Much More Than Money
• What is required to obtain benefits and solutions?• The Kano Model – approach to understanding value received at
touch points and experiences– Expected – Failure to deliver will result in likely defection
– One Dimensional – Desired core, standards of competitors
– Attractive/Surprising – Positive and unanticipated
VALUE = Customer-perceived tangible (functional/rational) and intangible (emotional/relationship) benefits supplied
+ Solutionsprovided
23
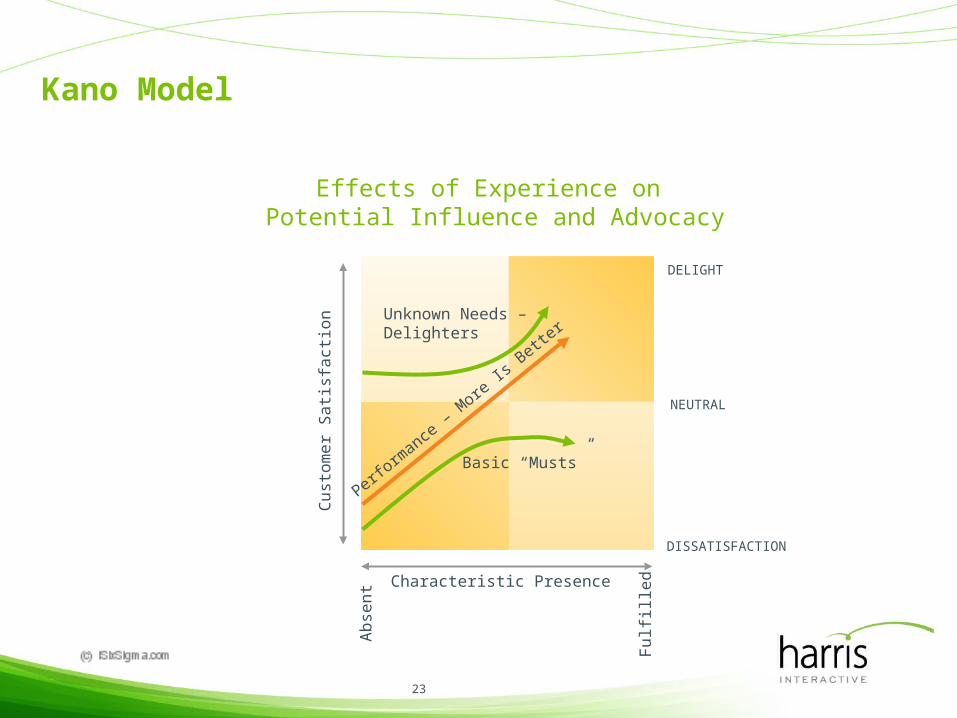
Kano Model
Effects of Experience on Potential Influence and Advocacy
DELIGHT
NEUTRAL
DISSATISFACTION
Cu
sto
me
r S
atis
fact
ion
Characteristic Presence
Ab
sen
t
Fu
lfille
d
Perform
ance – M
ore Is
Bette
r
Basic “Musts”
Unknown Needs – Delighters
24
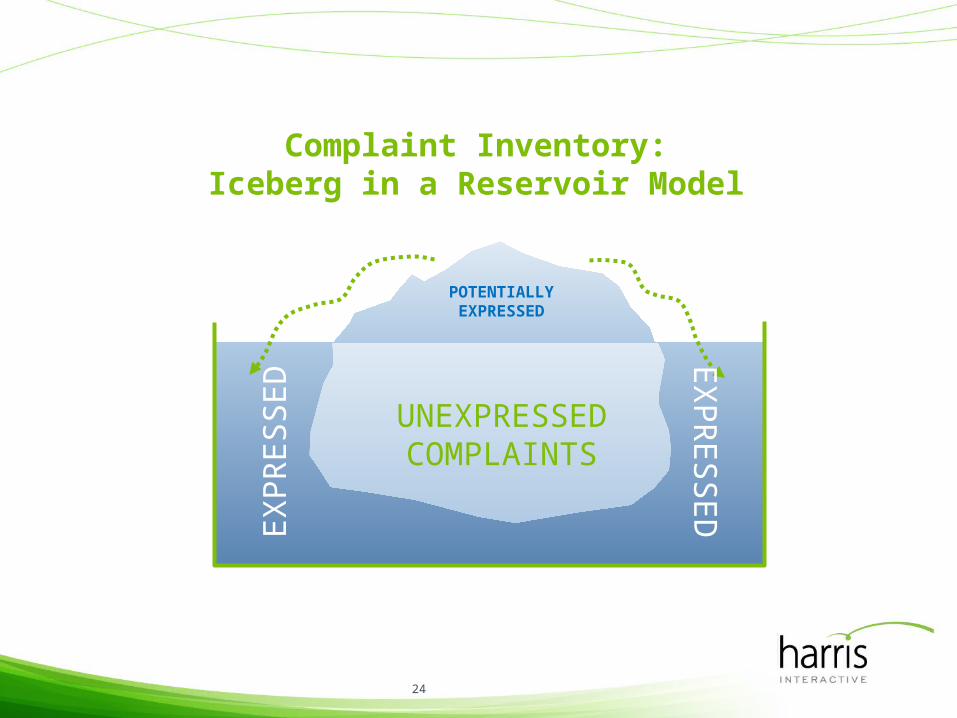
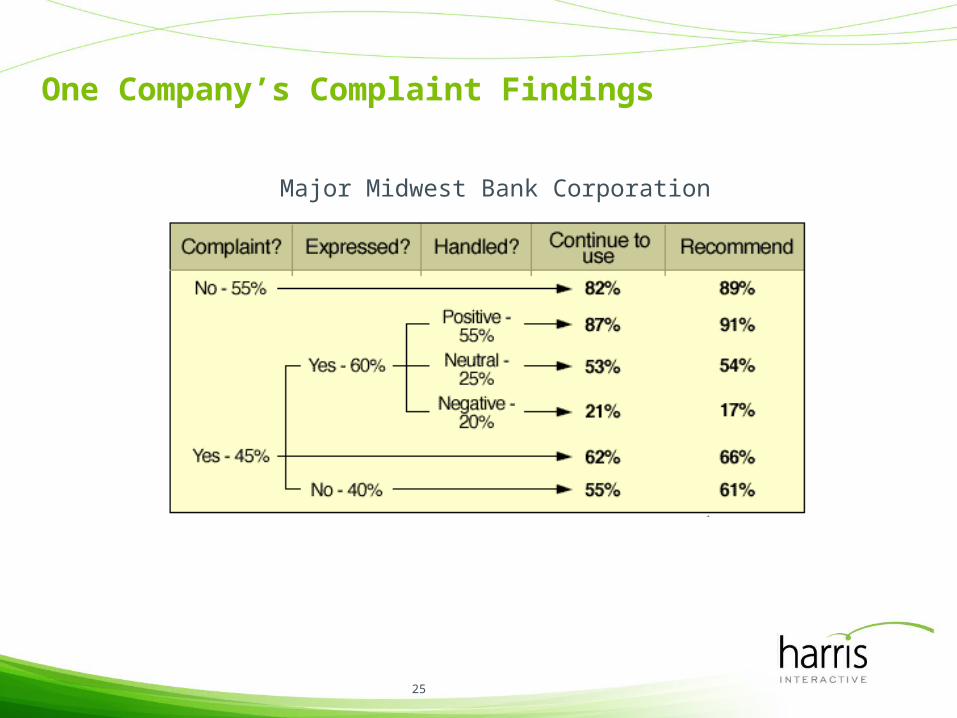
Complaint Inventory:Iceberg in a Reservoir Model
POTENTIALLYEXPRESSED
UNEXPRESSEDCOMPLAINTS
EX
PR
ES
SE
DE
XP
RE
SS
ED
25
One Company’s Complaint Findings
Major Midwest Bank Corporation
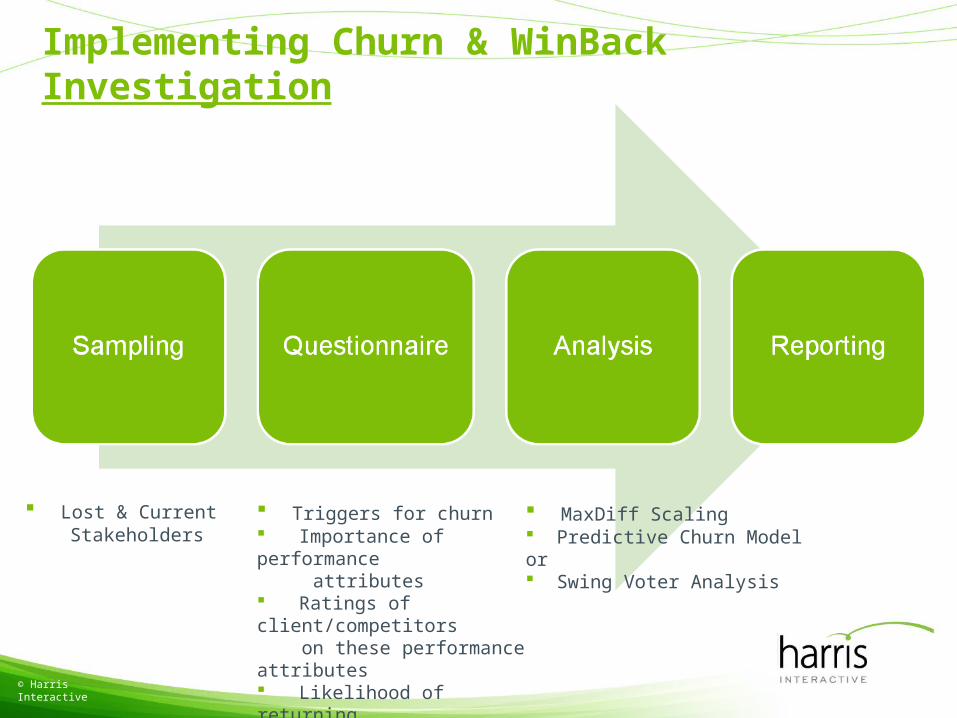
Implementing Churn & WinBack Investigation
© Harris Interactive
Lost & Current Stakeholders
Triggers for churn Importance of performance attributes Ratings of client/competitors on these performance attributes Likelihood of returning What client could do to winback Word-of-mouth behaviors
MaxDiff Scaling Predictive Churn Model or Swing Voter Analysis
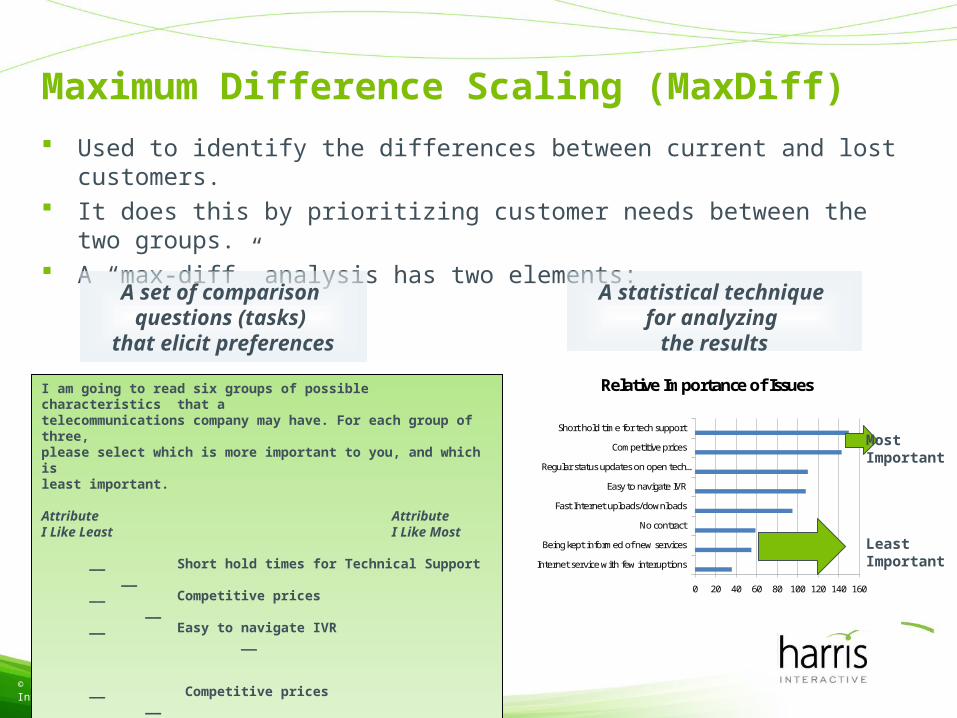
Maximum Difference Scaling (MaxDiff)
Used to identify the differences between current and lost customers. It does this by prioritizing customer needs between the two groups. A “max-diff” analysis has two elements:
© Harris Interactive
A set of comparison questions (tasks)
that elicit preferences
A statistical technique for analyzing
the results
I am going to read six groups of possible characteristics that a telecommunications company may have. For each group of three, please select which is more important to you, and which isleast important. Attribute AttributeI Like Least I Like Most
__ Short hold times for Technical Support __ __ Competitive prices ____ Easy to navigate IVR __
__ Competitive prices ____ No contract ____ Fast Internet uploads and downloads __
Relative Importance of Issues
0 20 40 60 80 100 120 140 160
Internet service with few interuptions
Being kept informed of new services
No contract
Fast Internet uploads/downloads
Easy to navigate IVR
Regular status updates on open tech …
Competitive prices
Short hold time for tech supportMostImportant
LeastImportant
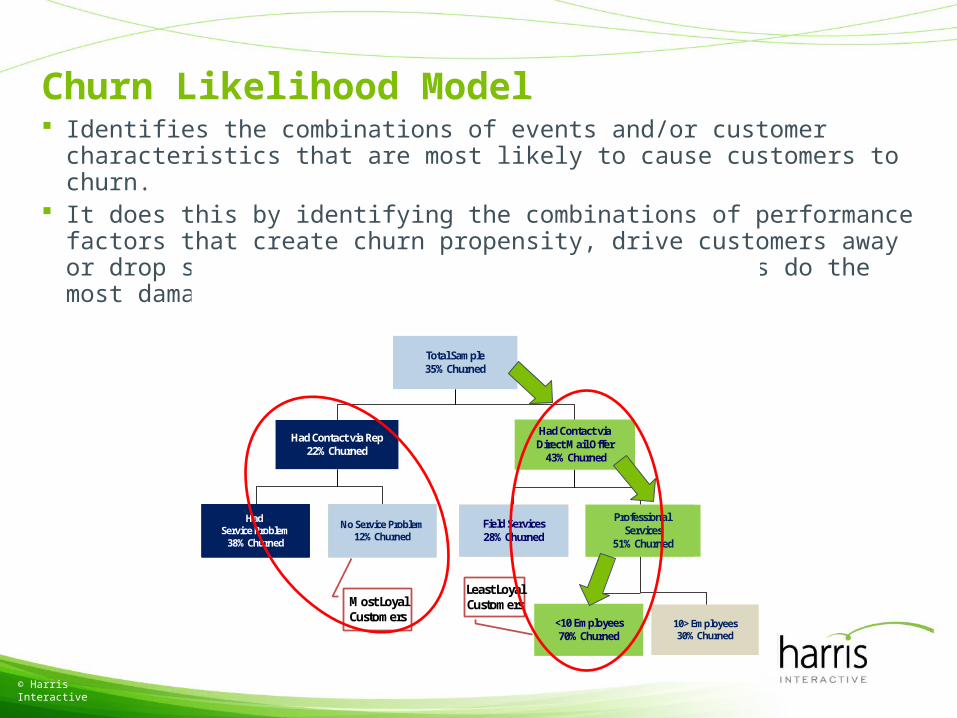
Churn Likelihood Model Identifies the combinations of events and/or customer characteristics that are
most likely to cause customers to churn. It does this by identifying the combinations of performance factors that create
churn propensity, drive customers away or drop services, and which of these combinations do the most damage.
© Harris Interactive
Total Sample35% Churned
<10 Employees70% Churned
OldestChild <1275% Loyal
Oldest Child 12+80% Loyal
Field Services31% Dropped TELUS
Professional Services
51% Dropped TELUS
Had Contact via Rep22% Churned
Had Contact viaDirect Mail Offer
43% Churned
Had Service Problem
38% Dropped TELUS12% Dropped TELUS
Week
Field Services31% Dropped TELUS
Had Service Problem
38% Dropped TELUS12% Dropped TELUS
Professional Services
51% Churned
Field Services28% Churned
10> Employees30% Churned
Had Service Problem
38% Churned
No Service Problem12% Churned
Most LoyalCustomers
Least LoyalCustomers
Swing Voter Analysis
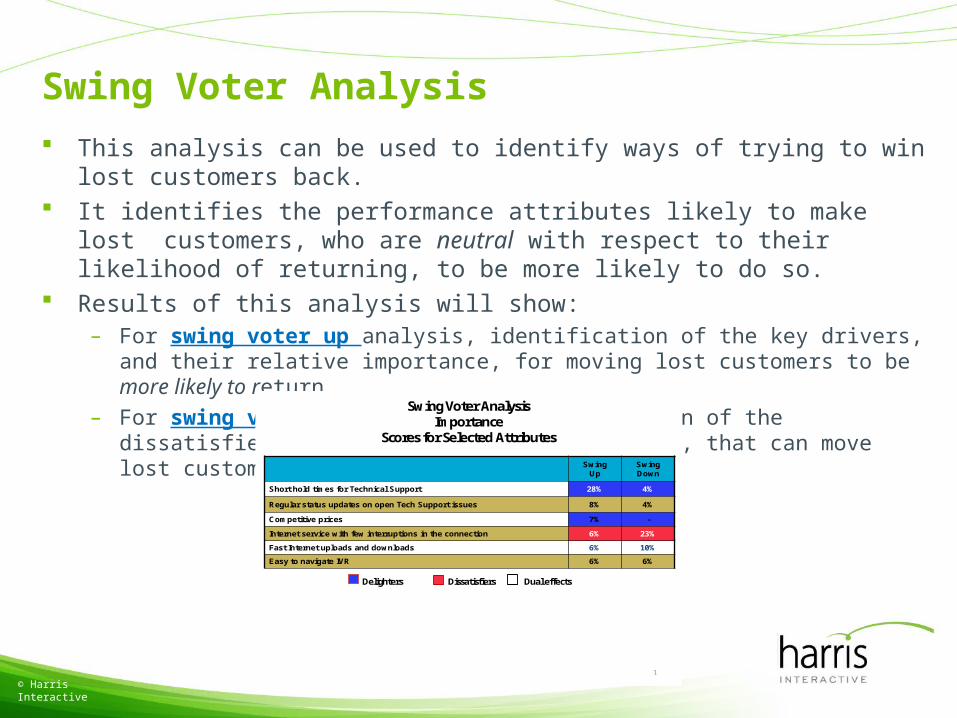
This analysis can be used to identify ways of trying to win lost customers back. It identifies the performance attributes likely to make lost customers, who are
neutral with respect to their likelihood of returning, to be more likely to do so. Results of this analysis will show:
– For swing voter up analysis, identification of the key drivers, and their relative importance, for moving lost customers to be more likely to return.
– For swing voter down analysis, identification of the dissatisfiers, and their relative importance, that can move lost customers to be even less likely to return.
© Harris Interactive
1
Swing Voter AnalysisImportance
Scores for Selected Attributes
Swing Up
Swing Down
Short hold times for Technical Support 28% 4%
Regular status updates on open Tech Support issues 8% 4%
Competitive prices 7% -
Internet service with few interruptions in the connection 6% 23%
Fast Internet uploads and downloads 6% 10%
Easy to navigate IVR 6% 6%
Delighters Dissatisfiers Dual effects
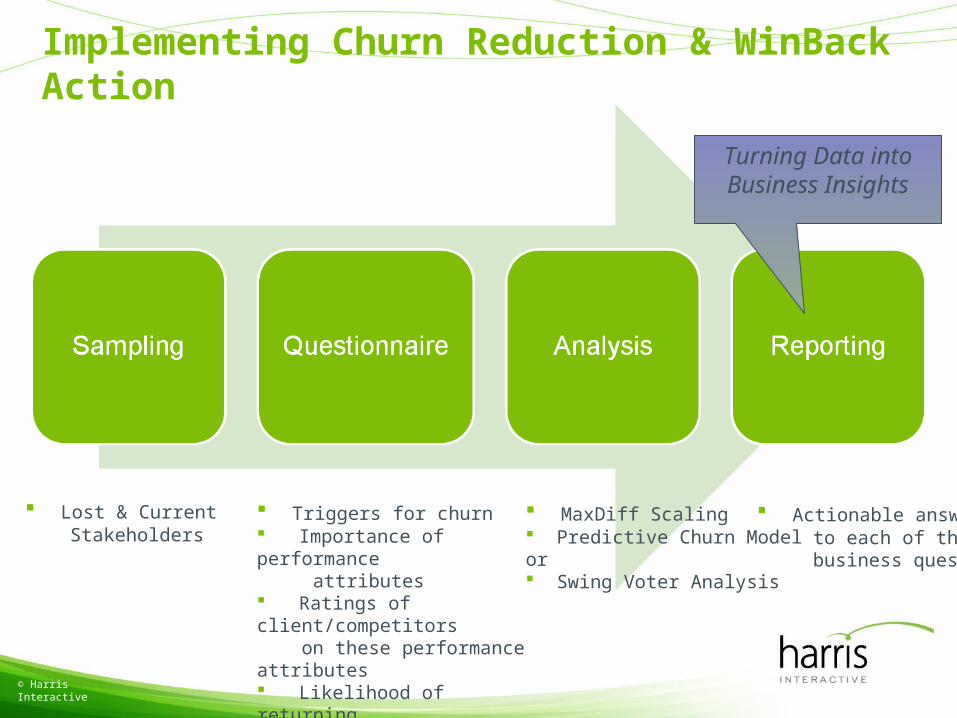
Implementing Churn Reduction & WinBack Action
© Harris Interactive
Lost & Current Stakeholders
Triggers for churn Importance of performance attributes Ratings of client/competitors on these performance attributes Likelihood of returning What client could do to winback Word-of-mouth behaviors
MaxDiff Scaling Predictive Churn Model or Swing Voter Analysis
Turning Data intoBusiness Insights
Actionable answers to each of the key business questions
The Challenge
“Good Research,Poor Actionability”
© Harris Interactive
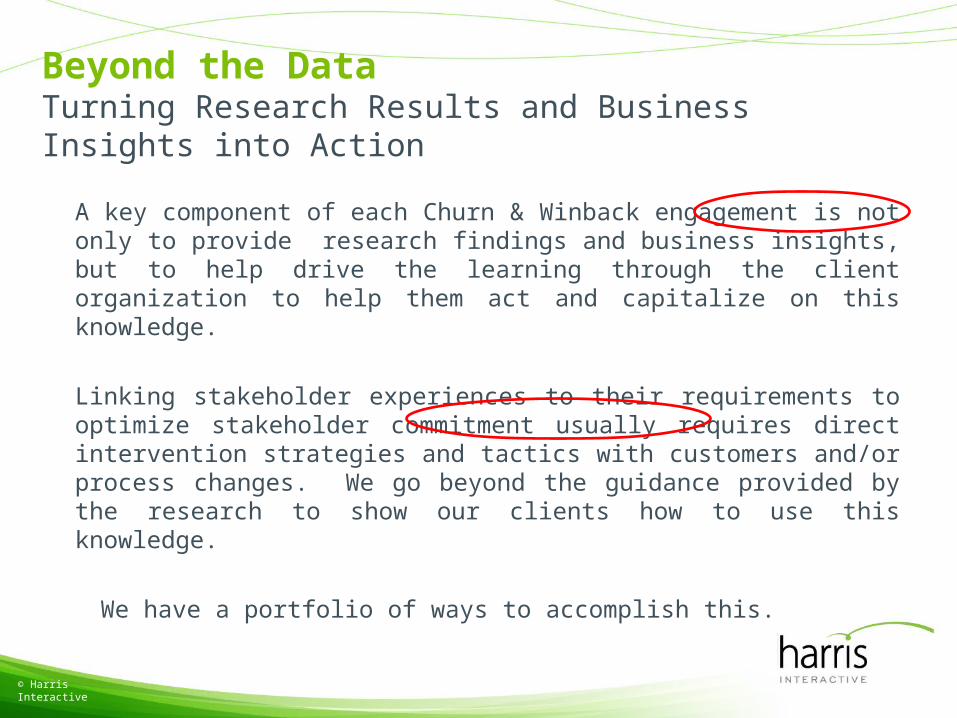
Beyond the DataTurning Research Results and Business Insights into Action
© Harris Interactive
A key component of each Churn & Winback engagement is not only to provide research findings and business insights, but to help drive the learning through the client organization to help them act and capitalize on this knowledge.
Linking stakeholder experiences to their requirements to optimize stakeholder commitment usually requires direct intervention strategies and tactics with customers and/or process changes. We go beyond the guidance provided by the research to show our clients how to use this knowledge.
We have a portfolio of ways to accomplish this.
Beyond the DataTurning Research Results and Business Insights into Action
© Harris Interactive
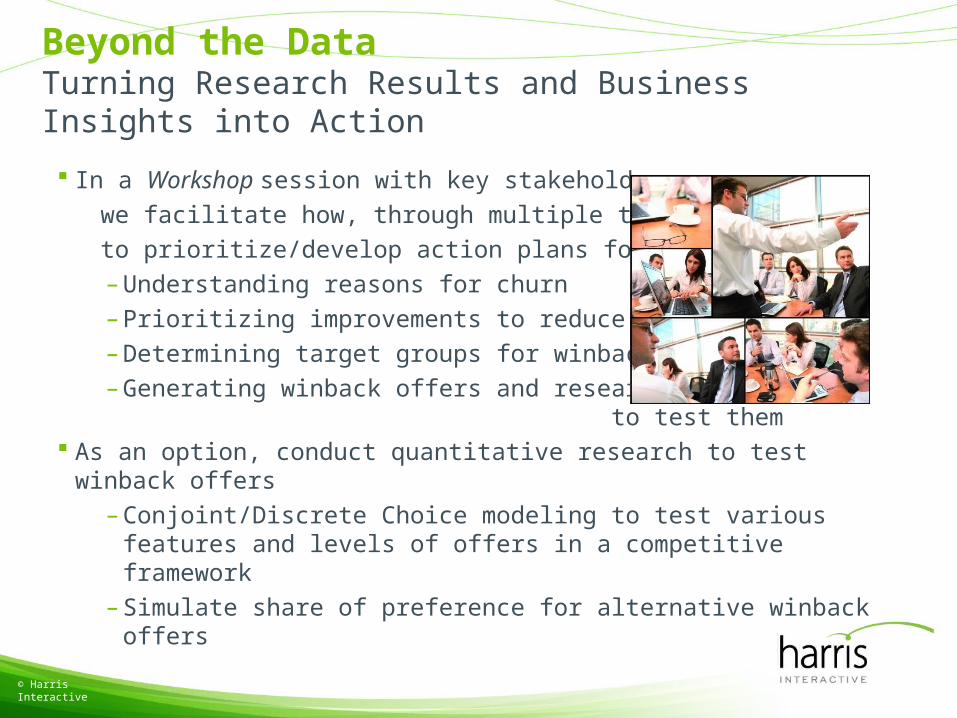
In a Workshop session with key stakeholders,
we facilitate how, through multiple techniques,
to prioritize/develop action plans focusing on:
– Understanding reasons for churn
– Prioritizing improvements to reduce churn
– Determining target groups for winback
– Generating winback offers and research to test them
As an option, conduct quantitative research to test winback offers
– Conjoint/Discrete Choice modeling to test various features and levels of offers in a competitive framework
– Simulate share of preference for alternative winback offers
© Harris Interactive
Case Study
34
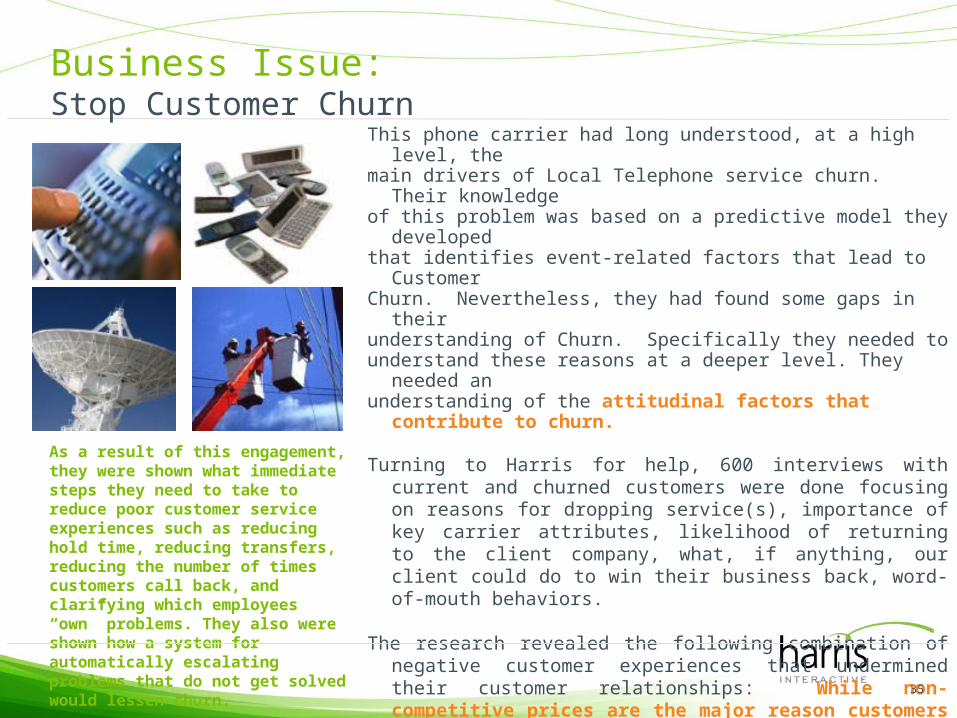
As a result of this engagement, they were shown what immediate steps they need to take to reduce poor customer service experiences such as reducing hold time, reducing transfers, reducing the number of times customers call back, and clarifying which employees “own” problems. They also were shown how a system for automatically escalating problems that do not get solved would lessen churn.
This phone carrier had long understood, at a high level, the main drivers of Local Telephone service churn. Their knowledge of this problem was based on a predictive model they developed that identifies event-related factors that lead to Customer Churn. Nevertheless, they had found some gaps in their understanding of Churn. Specifically they needed to understand these reasons at a deeper level. They needed an understanding of the attitudinal factors that contribute to churn.
Turning to Harris for help, 600 interviews with current and churned customers were done focusing on reasons for dropping service(s), importance of key carrier attributes, likelihood of returning to the client company, what, if anything, our client could do to win their business back, word-of-mouth behaviors.
The research revealed the following combination of negative customer experiences that undermined their customer relationships: While non-competitive prices are the major reason customers leave, it is poor service that keeps them away. Among Churned customers who left mostly or solely because of price, they will reconsider our client. However, Churned customers who had poor service experiences, and particularly those who felt our client violated their trust or made them feel unimportant, are far less likely to reconsider this carrier.
35
Business Issue:Stop Customer Churn
36
Why Win-Back Pays
37
Why Win-Back Often Goes Unmanaged/Unleveraged
• Retention rates can mislead– 1,000 freshmen: 80% retention rate per year
– Sophomore class 800, Junior class 640, Senior class 512
• Revenue loss and profit recovery opportunity not recognized• Lost customers considered “dead”• Politics
38
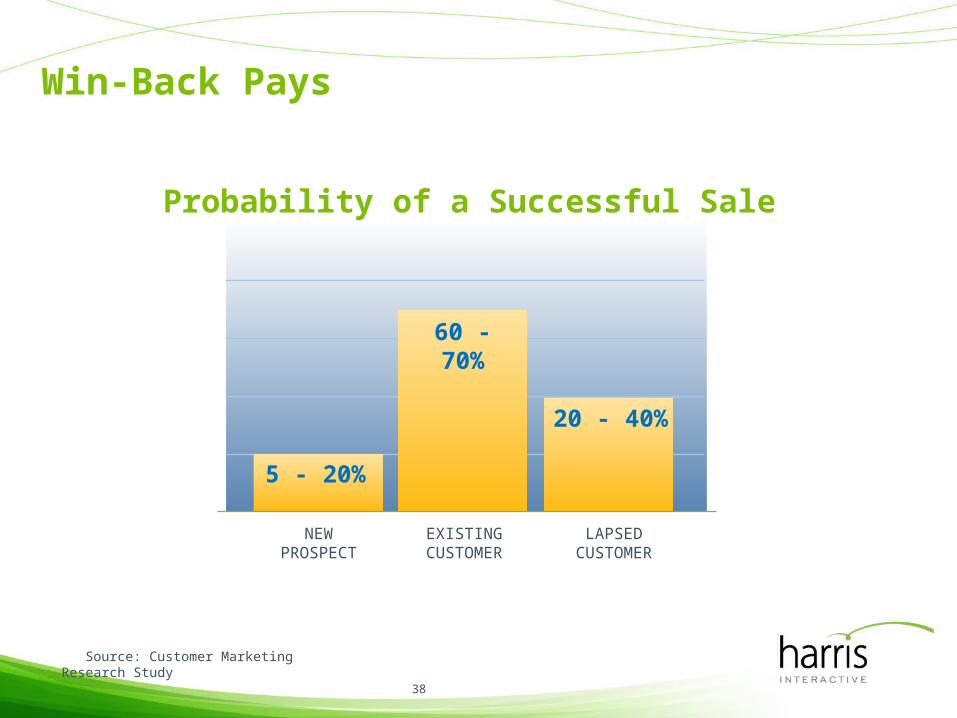
Win-Back Pays
Source: Customer Marketing Research Study
Probability of a Successful Sale
NEWPROSPECT
EXISTINGCUSTOMER
LAPSEDCUSTOMER
5 - 20%
60 - 70%
20 - 40%
39
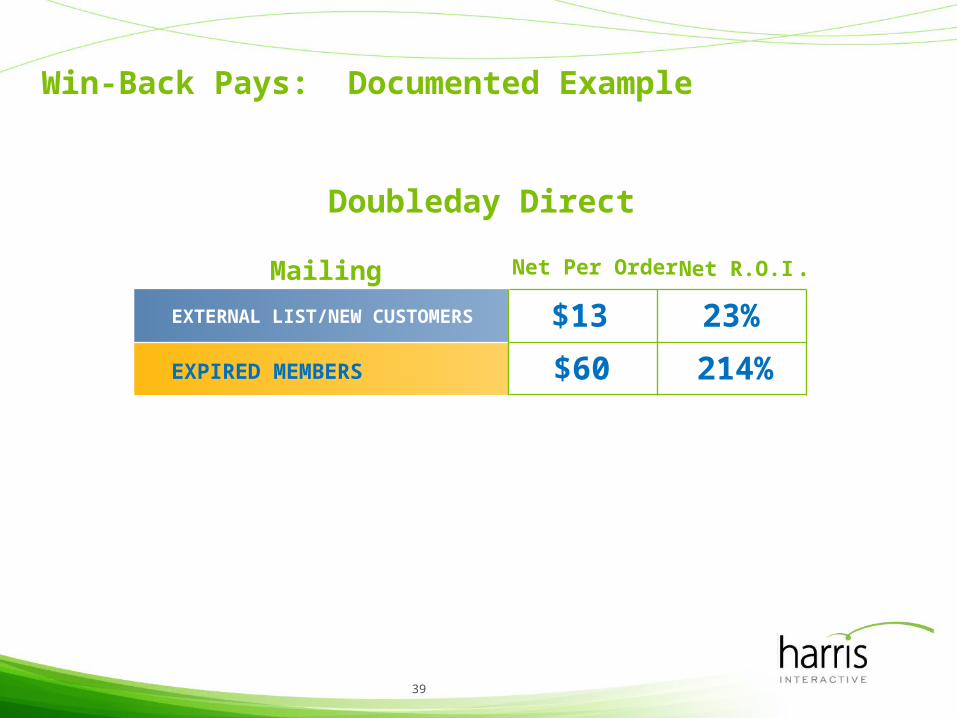
Win-Back Pays: Documented Example
Doubleday Direct
EXTERNAL LIST/NEW CUSTOMERS
EXPIRED MEMBERS
$13
$60
23%
214%
Net Per Order Net R.O.I.Mailing
40
Why Win-Back Pays
• Develop profile for lost customers that can help detect “at-risk” customers
• Improve acquisition/targeting strategies• Reduce negative word-of-mouth• Improve your bottom line by reactivating lost customers
41
Target the right former customers for WinBack
42
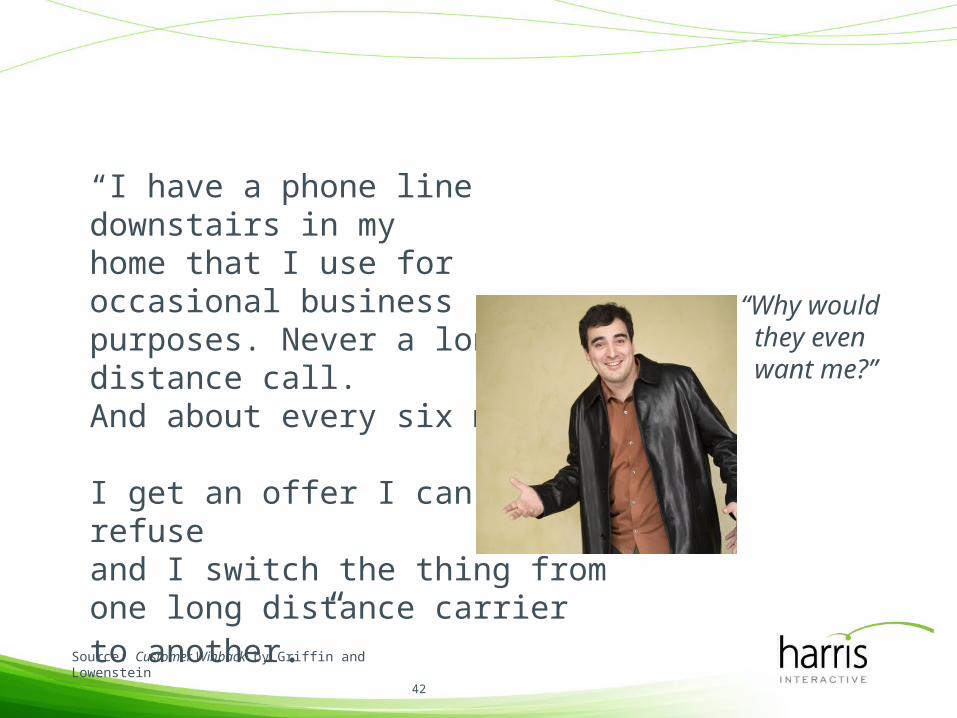
“I have a phone line downstairs in my home that I use for occasional business purposes. Never a long distance call.And about every six months, I get an offer I can’t refuseand I switch the thing fromone long distance carrier to another.”
Source: Customer Winback by Griffin and Lowenstein
“Why would they even want me?”
43
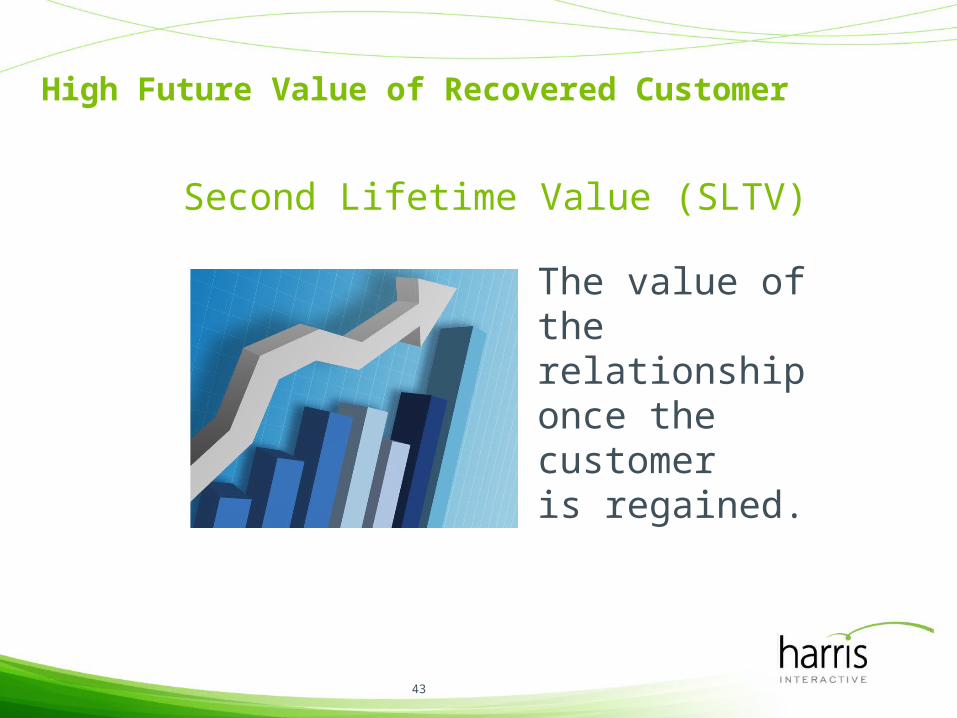
High Future Value of Recovered Customer
The value of the relationship once the customeris regained.
Second Lifetime Value (SLTV)
44
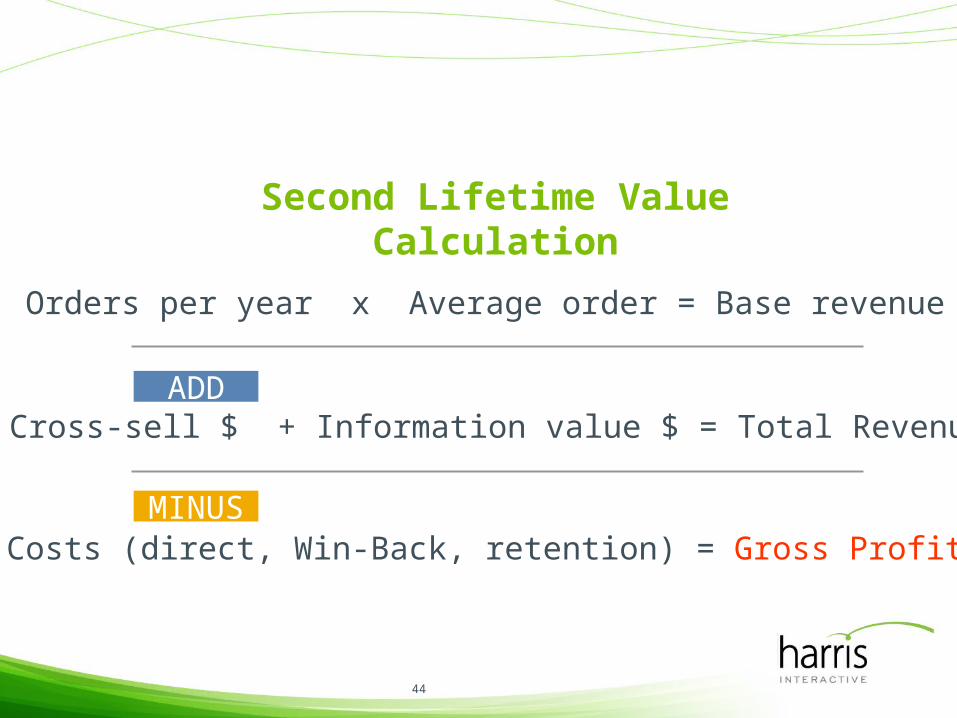
Second Lifetime Value Calculation
Orders per year x Average order = Base revenue
Cross-sell $ + Information value $ = Total Revenue
Costs (direct, Win-Back, retention) = Gross Profit
ADD
MINUS
45
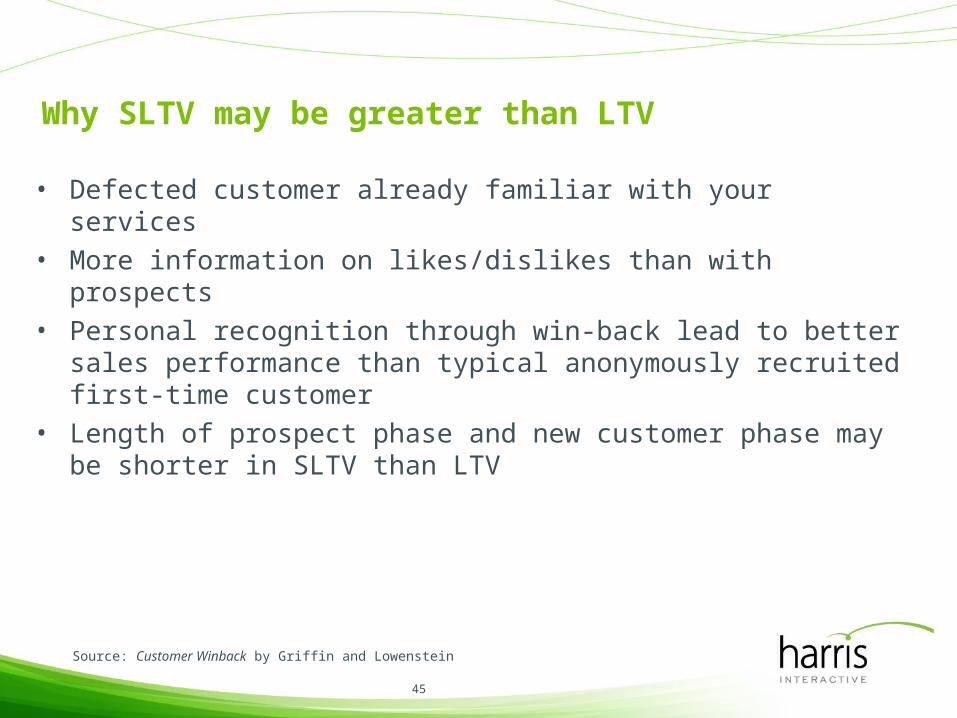
Why SLTV may be greater than LTV
• Defected customer already familiar with your services• More information on likes/dislikes than with prospects• Personal recognition through win-back lead to better sales
performance than typical anonymously recruited first-time customer • Length of prospect phase and new customer phase may be shorter in
SLTV than LTV
Source: Customer Winback by Griffin and Lowenstein
46
Lost customer recoveryprograms
47
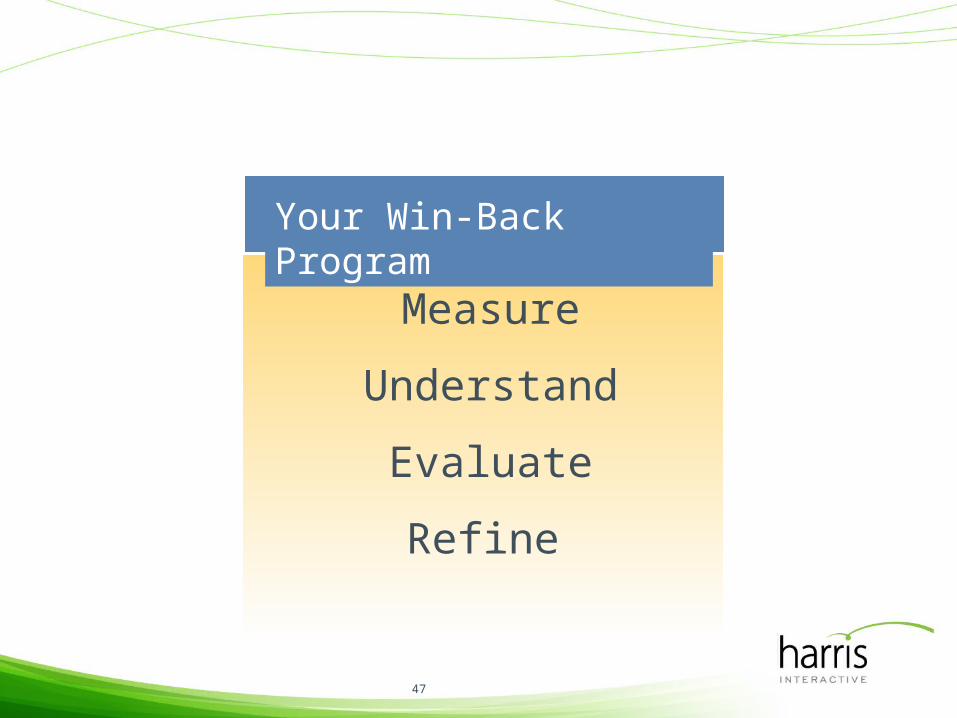
Measure
Understand
Evaluate
Refine
Your Win-Back Program
48
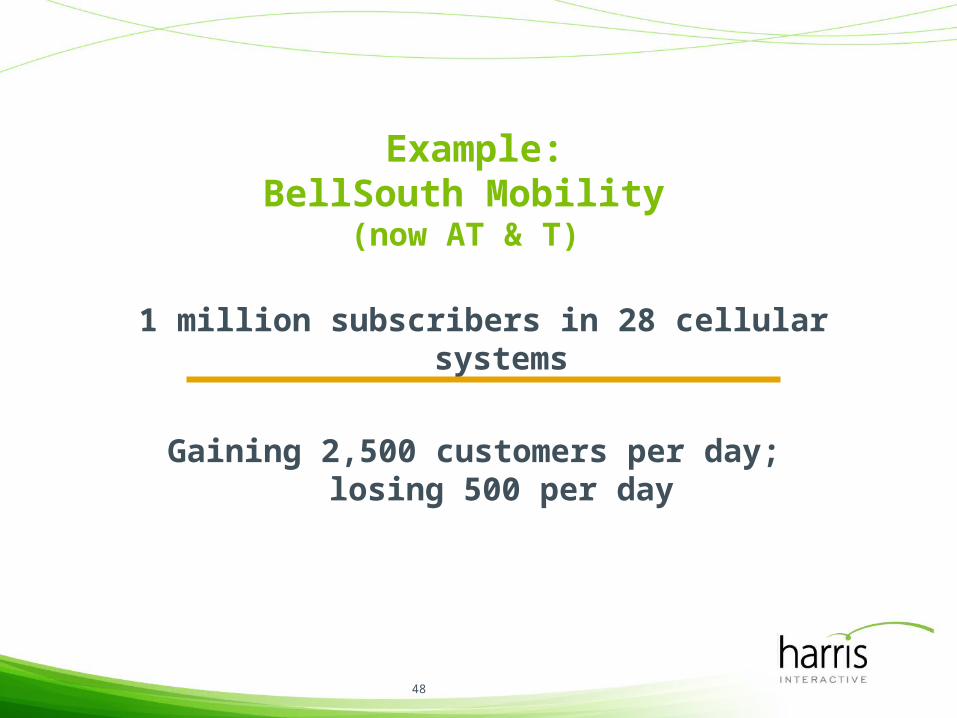
1 million subscribers in 28 cellular systems
Gaining 2,500 customers per day; losing 500 per day
Example:BellSouth Mobility
(now AT & T)
49
Win-Back Research
• Test market = regain 10% lost subscribers• Focus groups: better than competitors on...
coverage, service, billing system• Problems... drop call credit, free phone/air policies, etc.

50
Win-Back Lessons
• Get Relevant– Make your re-contact communication specific
• Test Different Offers• Watch Your Timing
– 11 months after defection
• Use Multiple Contacts– Overlay direct mail with telephone
51
More Win-Back Lessons
• Win-Back effort only as successful as the people involved• Successful Win-Back reps need training, constant coaching,
team support• Management: Recognize Win-Back work is stressful• Win-Back and marketing efforts can support each other• Effective Win-Back reps are among the most valued employees
of any company
Source: Customer Winback by Griffin and Lowenstein
52
Your Re-Approach Message
• Acknowledge past patronage• Point out improvements/changes since last visit• Emphasize ease of re-engagement• Send under recognizable name• Provide possible financial/value incentive
Source: Customer WinBack, Jill Griffin and Michael Lowenstein
53
Put successful stabilization programs into place: Manage touch points and experience
54
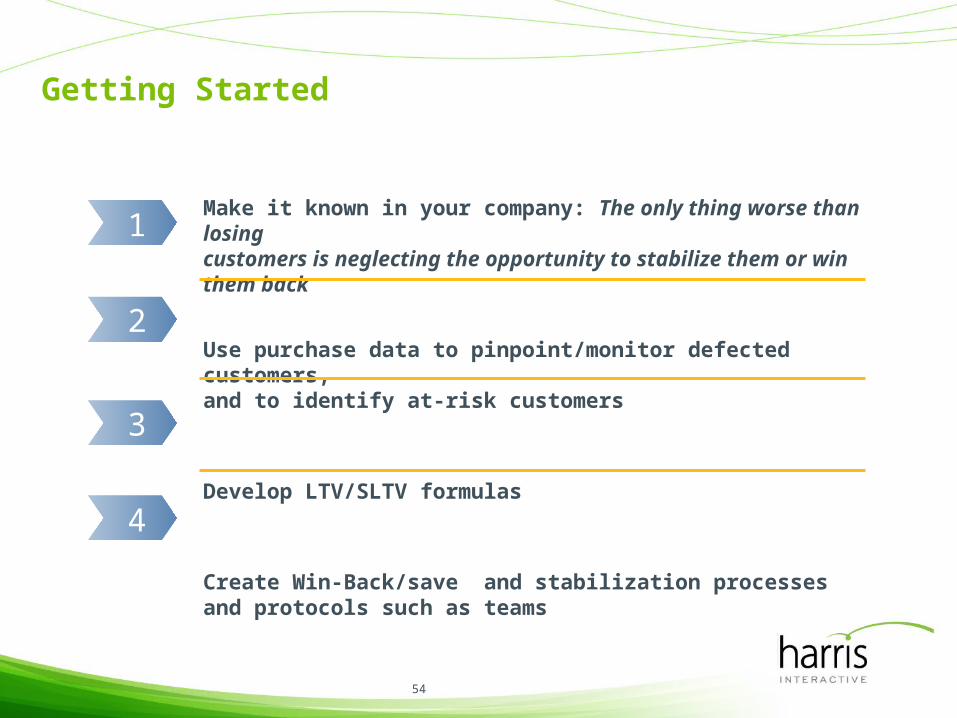
Getting Started
Make it known in your company: The only thing worse than losingcustomers is neglecting the opportunity to stabilize them or win them back
Use purchase data to pinpoint/monitor defected customers, and to identify at-risk customers
Develop LTV/SLTV formulas
Create Win-Back/save and stabilization processes and protocols such as teams
1
2
3
4
© Harris Interactive
Contact Information
Michael Lowenstein, PhD CMCSenior Vice President and Senior Consultant
Stakeholder Relationship Consulting
Harris Interactive
Princeton, NJ USA609 919-2524 or 856 283-1182