harold brooks noaa/nssl [email protected] tornado deaths: what the past tells us about the...
TRANSCRIPT


General History of Death
>20000 people have died in US tornadoes (~400 years)Deadliest decade-1920s (95 min, 4 years>200, 3169 total)
1986-1995: 419 deaths 2000-2009: 558 deaths
Only 3 years since 1974 > 100, max is 130 (1998)

10 Years of Tornado Fatalities by County
631 Total Fatalities
1999-2008
Avg. Fatalities ~2.5
Avg. Injuries ~21
Avg. Prop. Dmg. ~$18M
Avg. Track ~18 miles
Avg. Width ~500 yards
Avg. Rating ~(E)F2.5


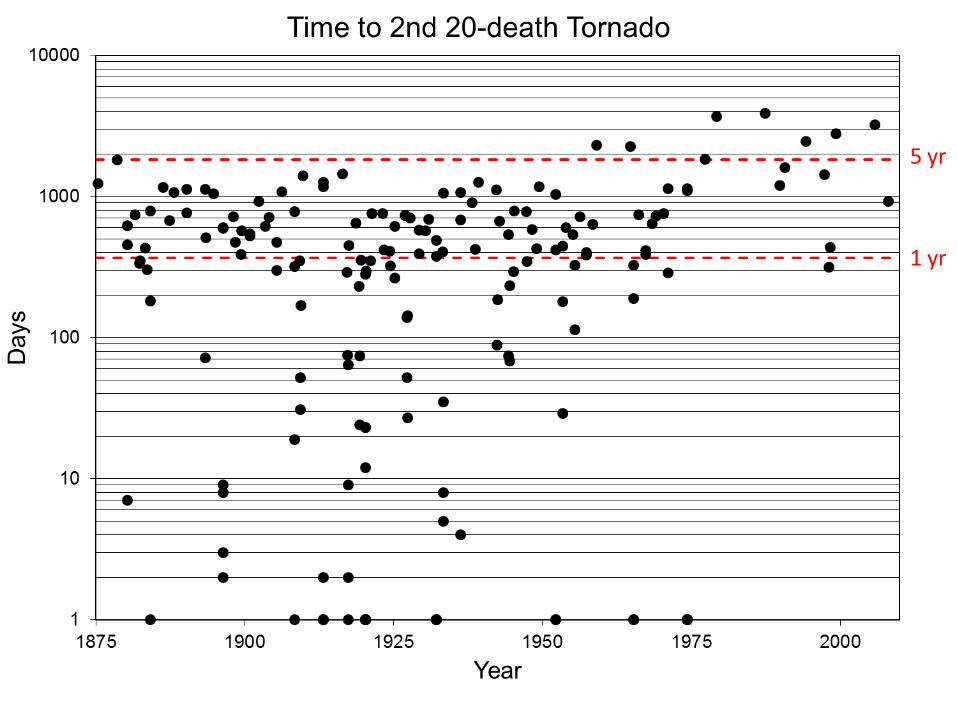
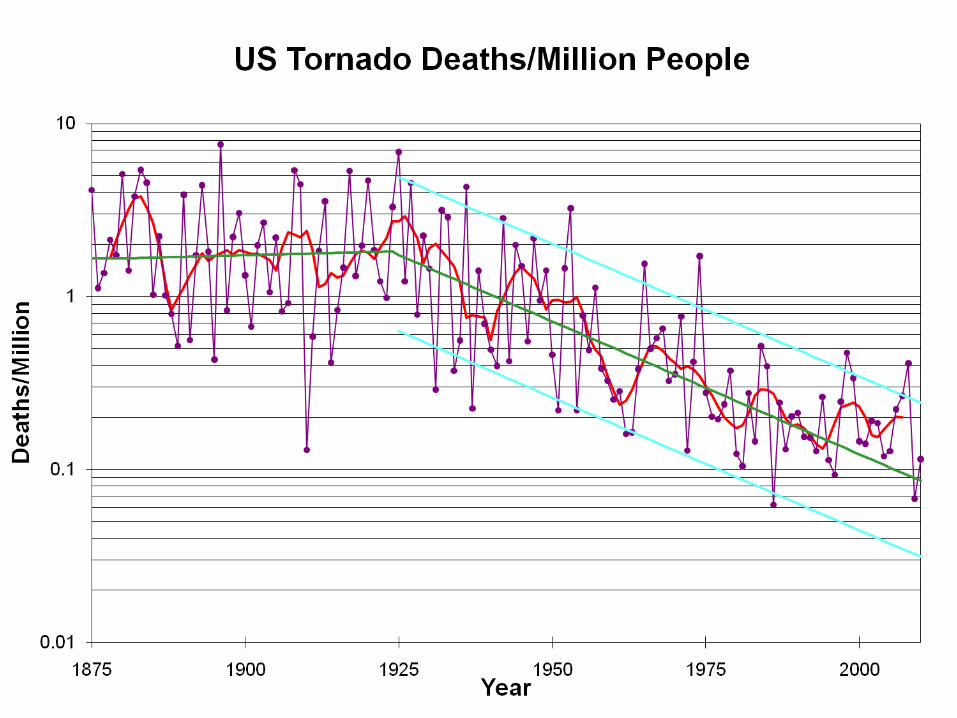
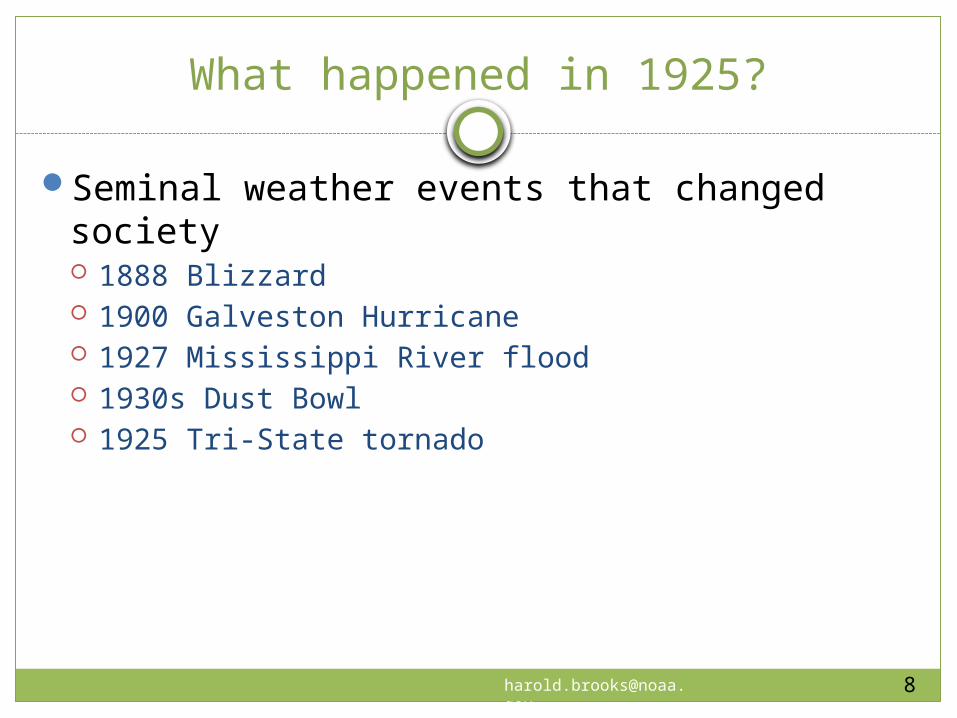
What happened in 1925?
Seminal weather events that changed society 1888 Blizzard 1900 Galveston Hurricane 1927 Mississippi River flood 1930s Dust Bowl 1925 Tri-State tornado


Mobile Home
Permanent Home


Mobile Home Fraction of Total Housing
0
2
4
6
8
10
12
14
16
18
1950 1960 1970 1980 1990 2000
Year
%
SoutheastOK-KS-NERest of US

Brooks and Doswell (2001)
Highlight role of education in reducing 3 May 1999 deaths
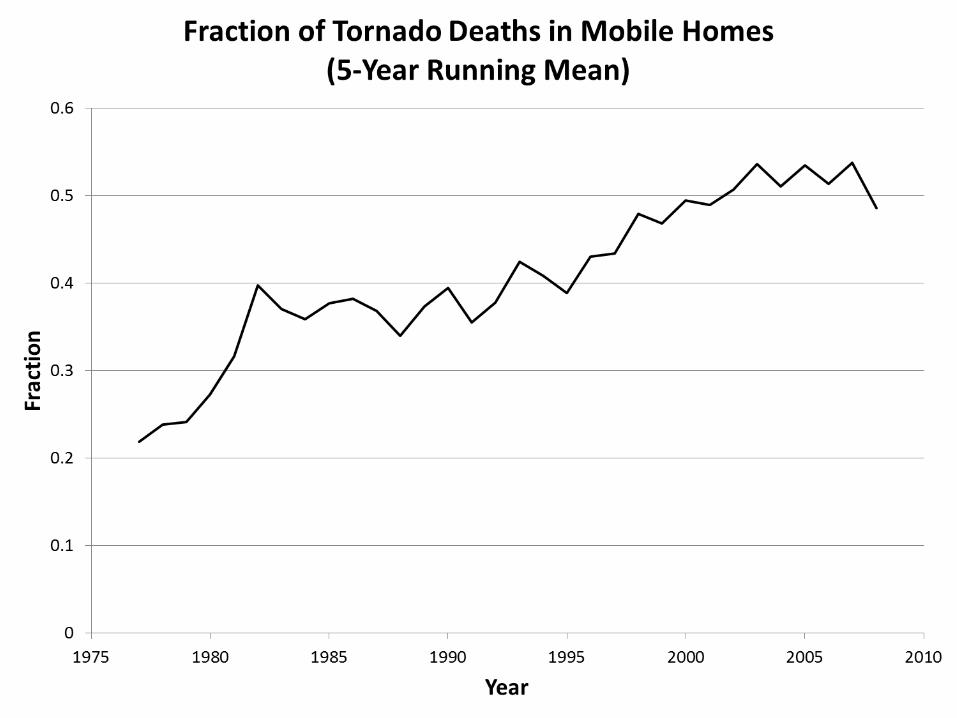
Question whether downward trend (post-1925) stoppedModel death rate as function of mobile home fraction

Model Tornado Deaths (Brooks and Doswell 2001)
Mobile home contribution to overall death rate

Mobile Home
Permanent Home
Warning/response system
Warning Decision Dissemination Reception
Response Preparation Options Action

Warning performance
Lead time? Lead time for warned tornadoes hasn’t changed in 25 years


0 0.2 0.4 0.6 0.8 10
0.2
0.4
0.6
0.8
1
Tornado Warning Performance by Watch
Overall (1986-2007)TornadoSevereNo Watch
SR (1-FAR)
POD

Warning performance
Lead time? Lead time for warned tornadoes hasn’t changed in 25 years
POD has increased Sutter and Simmons-decrease in fatalities up to 15 minutes Hoekstra
Preferred mean lead time 34 minutes Given 1 hour lead time, respondents less likely to act immediately, more
likely to flee Stalker-Long lead-people prepared to take action
False alarms? Many convolved factors (SE primarily) What do people think is a warning for them?
What are the issues?
Organization of storms (warning challenges)Ashley (2007) summarizes many aspects
Mobile homes Nocturnal/visibility Poverty
Preparation/response
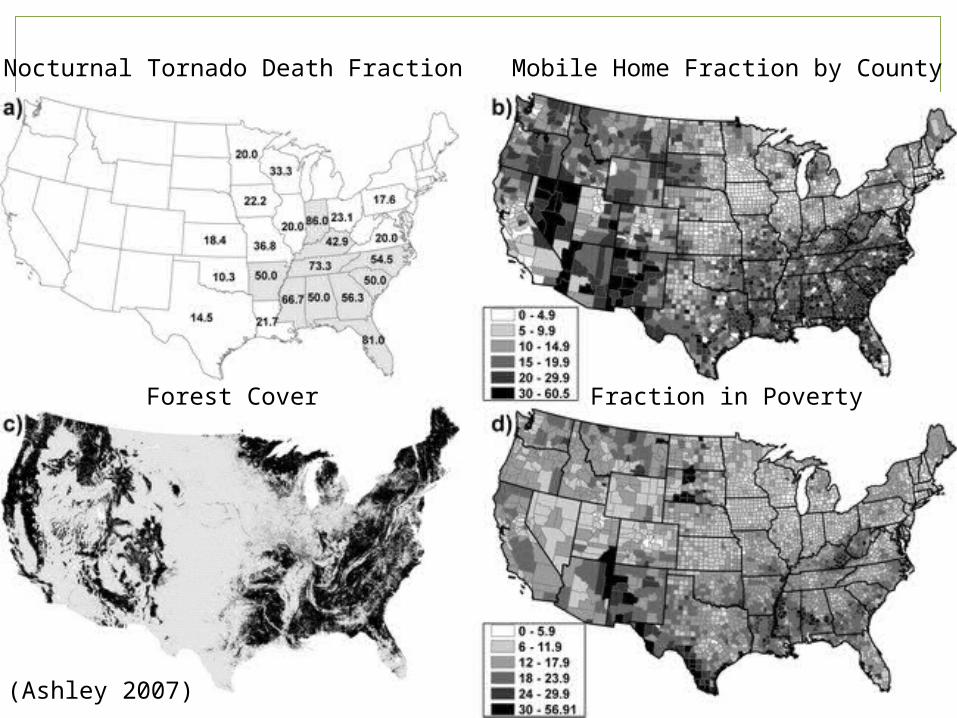
Nocturnal Tornado Death Fraction Mobile Home Fraction by County
Forest Cover Fraction in Poverty
(Ashley 2007)


1975 1980 1985 1990 1995 2000 2005 20100
20
40
60
80
100
120
140
Annual US Deaths from Hazards
TornadoLightning
Year
Dea
ths

Compare to lightning
Which kills more in US? 1976-90: Lightning (m=90), tornado (53), lightning more in 13 years 1996-2010: Lightning (41), tornado (63), lightning more in 3 years
Lightning deaths dropped dramatically starting ~1990 Education-“30-30 rule” Training-ER docs less likely to kill you now than 25 years ago
Final thoughts
Reducing deaths won’t come by improving forecast quality (lead time, POD, FAR)
Non-meteorological problem Education/preparation Choices for appropriate action Communication of messages