hardware tracing with intel processor tracehardware tracing with intel processor trace suchakrapani...
TRANSCRIPT

Hardware Tracing with
Intel Processor TraceSuchakrapani Datt Sharma
Dec 10, 2015
École Polytechnique de Montréal
Laboratoire DORSAL

POLYTECHNIQUE MONTREAL – Suchakrapani Datt Sharma
AgendaRecap
● Research Updates
New Investigations● Hardware Tracing 101
● State of the art
● Intel PT and its internals
● Experiments on PT
● Performance Benchmarks
Upcoming and in-progress● Hardware Tracing Usecases
● Accurate Instruction Profiling

POLYTECHNIQUE MONTREAL – Suchakrapani Datt Sharma
Recap
Research Focus : Integrated and streamlined framework for
tracing & debugging, dynamic instrumentation & JIT techniques
Where we left off● Exploration of eBPF + Tracing
● Improvements in eBPF data sharing and usage for runtime
trace filtering
● Paper submitted in JCST (Springer)
POLYTECHNIQUE MONTREAL – Suchakrapani Datt Sharma
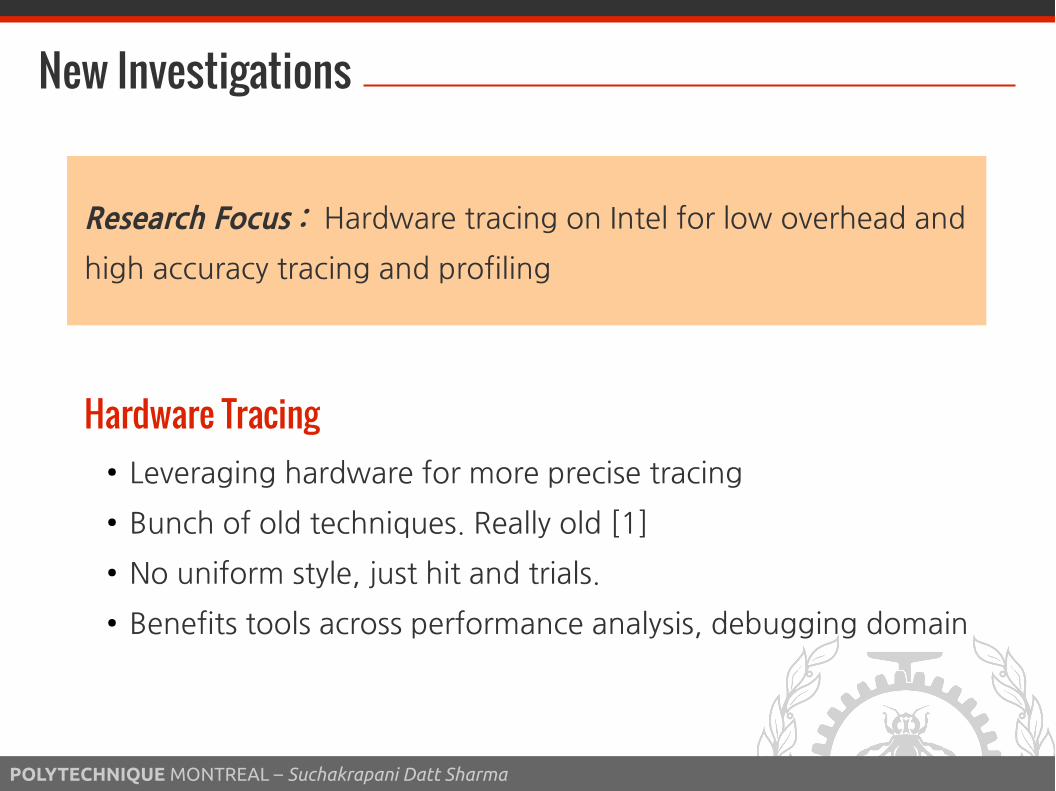
New Investigations
Research Focus : Hardware tracing on Intel for low overhead and
high accuracy tracing and profiling
Hardware Tracing● Leveraging hardware for more precise tracing
● Bunch of old techniques. Really old [1]
● No uniform style, just hit and trials.
● Benefits tools across performance analysis, debugging domain

POLYTECHNIQUE MONTREAL – Suchakrapani Datt Sharma
Hardware Tracing 101What and Why?
● In its current form, I define it as “traceless tracing”
● Has deep roots in early embedded systems
● Send data to external devices like logic analyzers by
tapping in certain 'points' of program flow [1]
● Precise real-time data for instruction level profile and debug
Mainstream Adoption● ARM soon provided EmbeddedICE [2]
● Direct access to the data and address bus of the CPU
● External device controls through TAP (JTAG interfaced)
● Intel starts with LBR support and moves on to BTS [3, 5]

POLYTECHNIQUE MONTREAL – Suchakrapani Datt Sharma
Hardware Tracing 101
19981998
Courtesy, EDN; Apr 23, 1998; 43, 9; ProQuest pg. 163

POLYTECHNIQUE MONTREAL – Suchakrapani Datt Sharma
Hardware Tracing 101What and Why?
● In its current form, I define it as “traceless tracing”
● Has deep roots in early embedded systems
● Send data to external devices like logic analyzers by
tapping in certain 'points' of program flow [1]
● Precise real-time data for instruction level profile and debug
Mainstream Adoption● ARM very early introduced EmbeddedICE [2]
● Direct access to the data and address bus of the CPU
● External device controls through TAP (JTAG interfaced)
● Intel starts with LBR support and moves on to BTS [3, 5]

POLYTECHNIQUE MONTREAL – Suchakrapani Datt Sharma
Hardware Tracing 101
ARM CoreSight● Bundled solution - ETM, PTM [4]
● Trace goes to ETB or external
devices through Trace Port
● Per Instruction high bandwidth
tracing (1-2 bytes/instruction)
● DSTREAM and ARM DS support
● Open support in terms of
ptm2human / etm2human and
recent CoreSight work in Linux
kernel
Courtesy, ARM
POLYTECHNIQUE MONTREAL – Suchakrapani Datt Sharma
Hardware Tracing 101
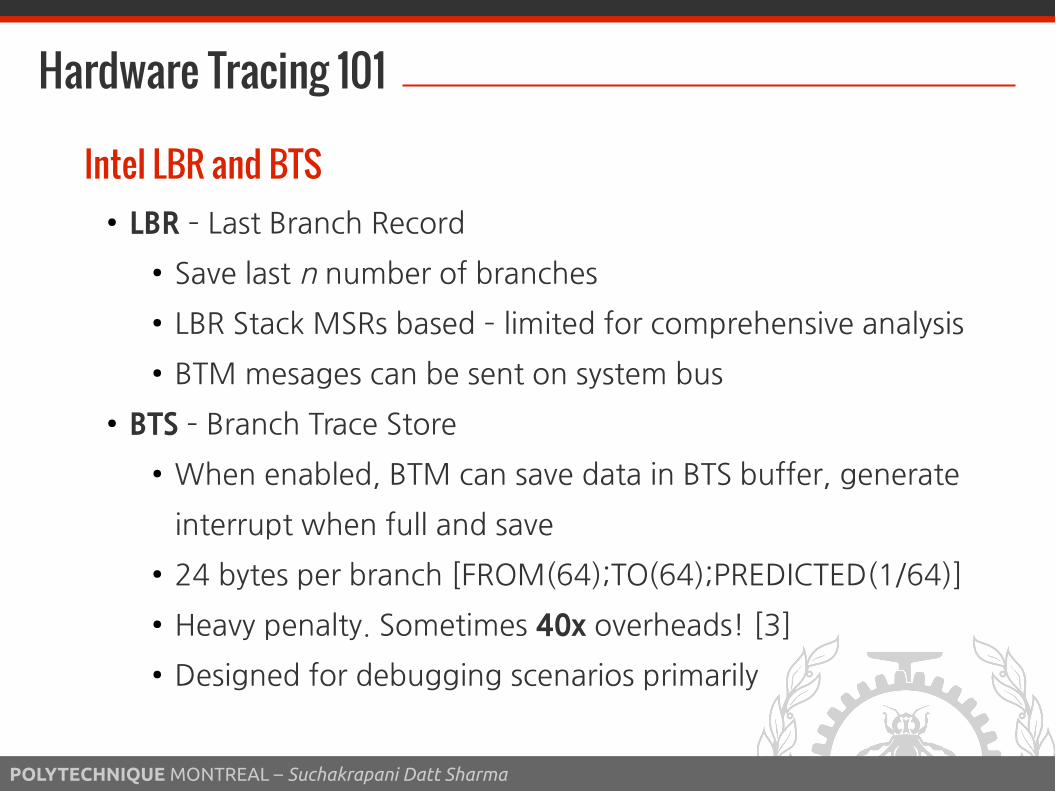
Intel LBR and BTS● LBR – Last Branch Record
● Save last n number of branches
● LBR Stack MSRs based – limited for comprehensive analysis
● BTM mesages can be sent on system bus
● BTS – Branch Trace Store
● When enabled, BTM can save data in BTS buffer, generate
interrupt when full and save
● 24 bytes per branch [FROM(64);TO(64);PREDICTED(1/64)]
● Heavy penalty. Sometimes 40x overheads! [3]
● Designed for debugging scenarios primarily

POLYTECHNIQUE MONTREAL – Suchakrapani Datt Sharma
Intel PTIntel Processor Trace
● Control Flow Tracing
● Record branches to deduce program flow
● Configure MSRs, setup buffer & generate trace packets
● Save Packets to buffer or send to 'transport layer'
● Trace Packets Overview
● PSB (Packet Stream Boundary) : Heartbeat, every 4K packets
● PIP (Paging Information Packet) : CR3 change
● TSC, OVF (Overflow), CBR (Core:Bus) Packets
● Control Flow
● TNT (Taken Not-Taken), except unconditional
● TIP (Target IP) at branches, FUP, MODE

POLYTECHNIQUE MONTREAL – Suchakrapani Datt Sharma
Intel PT
Intel Processor Trace● Cycle Accurate Mode
● CYC Packets : Cycle counter data to keep tab on instruction
count, IPC, tracking wall-clock time
● Timing
● MTC (Mini Timestamp Counter) : More frequent, based on
CTC (crystal clock counter) value (8 bit). Can be frequency
adjusted. Used with TSC to get accurate timestamps for
less cost. [TSC → TMA → MTC, MTC, MTC → TSC]
● Decoder finds out accurate time offline through elaborate
calculation

POLYTECHNIQUE MONTREAL – Suchakrapani Datt Sharma
Intel PT
Using Intel PT
Configure and Enable PT
CPU0CPU
Intel PTSoftware Decoder
Intel PT Hardware
Intel PT Packet Data
Runtime Data
Binary
Reconstructed Execution Flow
Based on, Andi Kleen's Presentation (TracingSummit 2015)

POLYTECHNIQUE MONTREAL – Suchakrapani Datt Sharma
Intel PT
Using Intel PT● Perf support
● Perf driver configures and controls PT hardware
● Generated trace data is dumped to an AUX ring buffer on
top of Perf's buffer
● Userspace Perf counterpart can decode the perf data
● Accurate instruction profiling data
● Huge trace size (~160MB/sec with 'date')
● GDB support
● Accurate reverse debugging.
● Andi Kleen's simple-pt

POLYTECHNIQUE MONTREAL – Suchakrapani Datt Sharma
Intel PT
simple-pt● Kernel module and userspace app to control PT written by
Andi Kleen [6, 7]
● Decoder based on libipt [01.org]
● Simple shell script control for simple-pt module
● Pretty printing (ftrace function_graph style or raw instructions)
● Can be used for testing, experimentation and more fine
grained control over tracing and decoding
● Used for early experiments, benchmarks
● Fun to work with, highly recommended!

POLYTECHNIQUE MONTREAL – Suchakrapani Datt Sharma
Intel PT
Hardware Trace Packets (Perf). ... Intel Processor Trace data: size 8544 bytes. 00000000: 02 82 02 82 02 82 02 82 02 82 02 82 02 82 02 82 PSB. 00000010: 00 00 00 00 00 00 PAD. 00000016: 19 ba 39 4d 7b 89 5e 04 TSC 0x45e897b4d39ba. 0000001e: 00 00 00 00 00 00 00 00 PAD. 00000026: 02 73 57 64 00 1c 00 00 TMA CTC 0x6457 FC 0x1c. 0000002e: 00 00 PAD. 00000030: 02 03 27 00 CBR 0x27. 00000034: 02 23 PSBEND. 00000036: 59 8b MTC 0x8b. 00000038: 59 8c MTC 0x8c.. 00000304: f8 TNT TTTTNN (6). 00000305: 06 00 00 TNT T (1). 00000308: 4d e0 3c 6d 9c TIP 0x9c6d3ce0. 0000030d: 1c 00 00 TNT TTN (3). 00000310: 2d f0 3c TIP 0x3cf0. 00000313: 06 TNT T (1). 00000314: 59 2e MTC 0x2e. 00000316: 94 TNT NNTNTN (6). 00000317: a8 TNT NTNTNN (6). 00000318: a6 TNT NTNNTT (6)

POLYTECHNIQUE MONTREAL – Suchakrapani Datt Sharma
Intel PT
Timing. ... Intel Processor Trace data: size 8544 bytes. 00000000: 02 82 02 82 02 82 02 82 02 82 02 82 02 82 02 82 PSB. 00000010: 00 00 00 00 00 00 PAD. 00000016: 19 ba 39 4d 7b 89 5e 04 TSC 0x45e897b4d39ba. 0000001e: 00 00 00 00 00 00 00 00 PAD. 00000026: 02 73 57 64 00 1c 00 00 TMA CTC 0x6457 FC 0x1c. 0000002e: 00 00 PAD. 00000030: 02 03 27 00 CBR 0x27. 00000034: 02 23 PSBEND. 00000036: 59 8b MTC 0x8b. 00000038: 59 8c MTC 0x8c.. 00000304: f8 TNT TTTTNN (6). 00000305: 06 00 00 TNT T (1). 00000308: 4d e0 3c 6d 9c TIP 0x9c6d3ce0. 0000030d: 1c 00 00 TNT TTN (3). 00000310: 2d f0 3c TIP 0x3cf0. 00000313: 06 TNT T (1). 00000314: 59 2e MTC 0x2e. 00000316: 94 TNT NNTNTN (6). 00000317: a8 TNT NTNTNN (6). 00000318: a6 TNT NTNNTT (6)
POLYTECHNIQUE MONTREAL – Suchakrapani Datt Sharma
Intel PT
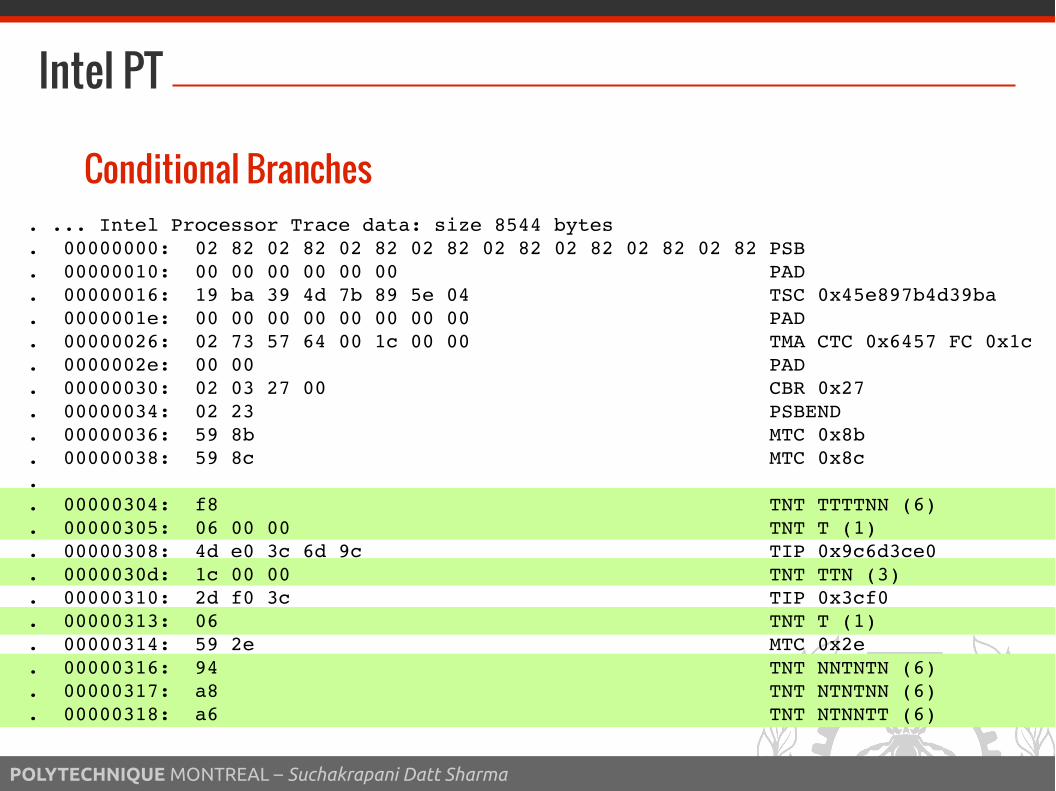
Conditional Branches. ... Intel Processor Trace data: size 8544 bytes. 00000000: 02 82 02 82 02 82 02 82 02 82 02 82 02 82 02 82 PSB. 00000010: 00 00 00 00 00 00 PAD. 00000016: 19 ba 39 4d 7b 89 5e 04 TSC 0x45e897b4d39ba. 0000001e: 00 00 00 00 00 00 00 00 PAD. 00000026: 02 73 57 64 00 1c 00 00 TMA CTC 0x6457 FC 0x1c. 0000002e: 00 00 PAD. 00000030: 02 03 27 00 CBR 0x27. 00000034: 02 23 PSBEND. 00000036: 59 8b MTC 0x8b. 00000038: 59 8c MTC 0x8c.. 00000304: f8 TNT TTTTNN (6). 00000305: 06 00 00 TNT T (1). 00000308: 4d e0 3c 6d 9c TIP 0x9c6d3ce0. 0000030d: 1c 00 00 TNT TTN (3). 00000310: 2d f0 3c TIP 0x3cf0. 00000313: 06 TNT T (1). 00000314: 59 2e MTC 0x2e. 00000316: 94 TNT NNTNTN (6). 00000317: a8 TNT NTNTNN (6). 00000318: a6 TNT NTNNTT (6)

POLYTECHNIQUE MONTREAL – Suchakrapani Datt Sharma
Intel PT
Indirect Branches. ... Intel Processor Trace data: size 8544 bytes. 00000000: 02 82 02 82 02 82 02 82 02 82 02 82 02 82 02 82 PSB. 00000010: 00 00 00 00 00 00 PAD. 00000016: 19 ba 39 4d 7b 89 5e 04 TSC 0x45e897b4d39ba. 0000001e: 00 00 00 00 00 00 00 00 PAD. 00000026: 02 73 57 64 00 1c 00 00 TMA CTC 0x6457 FC 0x1c. 0000002e: 00 00 PAD. 00000030: 02 03 27 00 CBR 0x27. 00000034: 02 23 PSBEND. 00000036: 59 8b MTC 0x8b. 00000038: 59 8c MTC 0x8c.. 00000304: f8 TNT TTTTNN (6). 00000305: 06 00 00 TNT T (1). 00000308: 4d e0 3c 6d 9c TIP 0x9c6d3ce0. 0000030d: 1c 00 00 TNT TTN (3). 00000310: 2d f0 3c TIP 0x3cf0. 00000313: 06 TNT T (1). 00000314: 59 2e MTC 0x2e. 00000316: 94 TNT NNTNTN (6). 00000317: a8 TNT NTNTNN (6). 00000318: a6 TNT NTNNTT (6)

POLYTECHNIQUE MONTREAL – Suchakrapani Datt Sharma
Intel PT
Program Control Flow (simple-pt)
826.329 [+0.019] [+ 7] intmod_ioctl+88 [+ 7] intmod_ioctl+148 > trace_hardirqs_off [+ 3] intmod_ioctl+290 > trace_hardirqs_on826.490 [+0.161] [+ 5] trace_hardirqs_on+27 [+ 8] intmod_ioctl+184 > trace_hardirqs_off [+ 2] intmod_ioctl+193 > __ndelay826.503 [+0.013] [+ 10] __ndelay+38 > delay_tsc [+ 10] delay_tsc+24 > preempt_count_add826.507 [+0.003] [+ 9] preempt_count_add+27.....826.559 [+0.008] [+ 3] delay_tsc+157 [+ 1] intmod_ioctl+198 > trace_hardirqs_on826.573 [+0.014] [+ 7] intmod_ioctl+118

POLYTECHNIQUE MONTREAL – Suchakrapani Datt Sharma
Intel PT Benchmarks
Synthetic Tests● Test Setup
● Skylake i5 6600K (3.9Ghz), controlled with simple-pt
● 2MB trace buffer
● MTC threshold (TSC update) every 512 cycles (accuracy)
● PSB packet every 2K bytes (better decoder sync and
recovery)
● Wide range of experiments
● Image processing to arithmetic intensive tests
● Mainly memory overhead as PT hardware is parallelized
● Overhead of V8 test

POLYTECHNIQUE MONTREAL – Suchakrapani Datt Sharma
Intel PT Benchmarks
Synthetic Tests
Benchmark Overhead (%) Overhead V8 (%)
TailFact 22.91 -
ParseInt 9.65 10.36
Fib 5.86 5.80
RandMatStat 2.58 20.00
Canny_NoOptimize 2.55 -
PiSum 2.47 6.20
Canny_Optimize 2.34 -
Sort 1.05 6.06
RandMatMul 0.83 11.08
Lots of TIP
packets
DGEMM using
Intel AVX

POLYTECHNIQUE MONTREAL – Suchakrapani Datt Sharma
Intel PT Benchmarks
Synthetic Tests● Omega (Ω) Test
mov $42, %r8
mov $42, %r9
cmp %r8, %r9
je <nop> ; TNT packet
● Epsilon (Ε) Test
● Empty Loop
1 1.78 %
Overhead
3.1 %
Overhead

POLYTECHNIQUE MONTREAL – Suchakrapani Datt Sharma
Intel PT Benchmarks
Benchmark TODOs● Better control on Ω and Ε tests
● Effect of varying MTC, CYC and PSB packet frequency on trace
size and overhead
● Effect of return-compression*
● Memory bandwidth consumed. Effect on other applications
● Overhead correlation with,
● Arithmetic intensity
● Branch to total instruction ratio
● Execution profiles – network, I/O, CPU

POLYTECHNIQUE MONTREAL – Suchakrapani Datt Sharma
In-progress
Instruction Profiling (Interrupts)● Small test to profile STI and CLI instructions
● Deducing superSTI and superCLI instructions based on
analyzing how kernel enables and disables interrupts
● Use debug info to deduce interrupts disabled-enabled pairs
● Small kernel module to test interrupt disabling and enabling
pattern
local_irq_save()
ndelay()
local_irq_restore()
local_irq_disable()
ndelay()
local_irq_enable()

POLYTECHNIQUE MONTREAL – Suchakrapani Datt Sharma
In-progress

POLYTECHNIQUE MONTREAL – Suchakrapani Datt Sharma
In-progress

POLYTECHNIQUE MONTREAL – Suchakrapani Datt Sharma
Upcoming
Profiling Instructions● Spinlocks in kernel, cpu_relax()
● Drivers' performance metrics through PT only
● Snapsot PT mode to get more detailed view at performance
degradation observations (irqsoff latency)
VM Tracing● System-wide VMX transitions (VM Entry and Exit
tracing/profiling)
● Host only and Guest only tracing
● Track root and non-root VMX operations

POLYTECHNIQUE MONTREAL – Suchakrapani Datt Sharma
Upcoming
Dynamic Tracing● Integrating with eBPF defined tracing actions
● Snapshot or flight-record PT data from withing kernel eBPF
helpers. Not far fetched.
● Integrating with current tracing/debugging tools
● Eg. Julien's latency tracker can use this for adding PT data
in real-time upon detecting abnormal latency pattern

POLYTECHNIQUE MONTREAL – Suchakrapani Datt Sharma
References
[1] Debugging embedded systems : using hardware tricks to trace program flow, EDN,
1998, ProQuest pp163
[2] http://infocenter.arm.com/help/index.jsp?topic=/com.arm.doc.ddi0084f/I883421.html
[3] Exploiting Hardware Advances for Software Testing and Debugging, ICSE'11, ACM
[4] Debug and Trace for Multicore SoCs, ARM Whitepaper, 2008
[5] Intel 64 and IA-32 Architecture Software Developer Manual
[6] Simple-PT https://github.com/andikleen/simple-pt
[7] Adding processor Trace Support to Linux [LWN] http://lwn.net/Articles/648154/

POLYTECHNIQUE MONTREAL – Suchakrapani Datt Sharma
Questions, if any
ask you must!
suchakra on #lttng
Image Courtesy, tetrapak (DeviantArt)