handset industry 2013 outlook
TRANSCRIPT

DISCLOSURE APPENDIX CONTAINS IMPORTANT DISCLOSURES, ANALYST CERTIFICATIONS, INFORMATION ON TRADE ALERTS, ANALYST MODEL PORTFOLIOS AND THE STATUS OF NON-U.S ANALYSTS. FOR OTHER IMPORTANT DISCLOSURES, visit www.credit-suisse.com/researchdisclosures or call +1 (877) 291-2683 US Disclosure: Credit Suisse does and seeks to do business with companies covered in its research reports. As a result, investors should be aware that the Firm may have a conflict of interest that could affect the objectivity of this report. Investors should consider this report as only a single factor in making their investment decision.
CREDIT SUISSE SECURITIES RESEARCH & ANALYTICS BEYOND INFORMATION™
Client-Driven Solutions, Insights, and Access
07 January 2013
Americas/United States
Equity Research
Telecommunications Equipment / MARKET WEIGHT
Handset Industry 2013 Outlook INDUSTRY PRIMER
Bigger market, Apple and Samsung win
■ Market size underestimated for both smartphones/handsets. Our bottom-up analysis suggests that the market underestimates the size of low-end ‘white-label’ smartphones, which causes us to restate our 2012/2013 volume estimates for the smartphone market higher by 6%/15% and 3%/4% for overall handsets. We also raise our smartphone volume estimates by 20-25% long term and now estimate 1.43bn/1.74bn smartphones to be shipped in 2015/2017. We believe that the growth of ‘white-label’ smartphone market specifically poses a threat for vendors like Nokia, RIMM, LG and possibly Samsung, given their exposure to feature phones and low-end smartphone segments.
■ Raising LT smartphone units to 1.74bn – a barbell develops for price points. We believe that the addressable market for smartphones is 4.95bn longer term, resulting in effective penetration of only 24% currently given our estimate of 1.2bn smartphone users by end of 2012. We expect effective smartphone penetration to rise to ~80% long term driving smartphone volumes of 1.43bn/1.74bn units by 2015/2017 (26%/19% CAGR over this period). By price point, we continue to see the high-end of the smartphone market rising to unprecedented levels increasing from 190mn units in 2011 to 300/400mn units in 2012/2013 (>40% of smartphone volumes), but equally see the low-end (<$200 ASP) to rise from 19% of smartphone volumes in 2012 to 25%/43% by 2013/2015 mainly driven by MediaTek and Spreadtrum ecosystem.
■ CS smartphone vendor scorecard – Apple and Samsung lead. We continue to rely on our proprietary smartphone vendor scorecard which is based on nine metrics (software, services, cloud, product, brand, distribution, compute convergence, IPR and chipset efficiency), which we think drive success in smartphones. We conclude that secular share gainers will be Samsung, Apple and Huawei, while other vendors will struggle to make returns.
■ Apple – compute advantage gives it a sustainable edge, reiterate OP. Increasingly, success in smartphones will be impacted by success in PCs and tablets. The ability to compete across all segments will be driven by software, services and hardware offerings across device types, with success in one area driving increased demand in the other. In this new paradigm of the compute market, Apple remains best positioned. Even with its current price point, we expect Apple’s smartphone share to rise from 19% in 2012 to 20% in 2013, driven by expanding distribution and an innovation advantage.
■ Nokia – a challenging turnaround. With limited differentiation for Windows Phone 8, strong competition and slow portfolio roll out, we see Nokia’s smartphone share falling further from 5% to 2% in 2013. In addition, accelerating growth in low-end Android presents further cannibalization risks to its Mobile Phone business. All of this means that cash burn will remain high, and we see net cash excl. NSN dropping from €2.6bn in 2012 to €0.8bn by the end of 2013.
■ RIMM – is there room for BB10? Despite excitement around upcoming new portfolio announcements, we believe it is too late with too little differentiation for BB10 to create material traction in the smartphone market. Consequently, we keep our Neutral rating.
Research Analysts
Kulbinder Garcha
212 325 4795
Achal Sultania
44 20 7883 6884
Talal Khan, CFA
212 325 8603
Matthew Cabral
212 538 6260
Ray Bao
212 325 1227
Asian Research Analysts
Randy Abrams, CFA
886 2 2715 6366
Keon Han
822 3707 3740
Pauline Chen
886 2 2715 6323
Yan Taw Boon
852 2101 7039
Thompson Wu
886 2 2715 6386
07 January 2013
Handset Industry 2013 Outlook 2
Executive summary The smartphone market has continued to defy expectations in recent years; indeed, we
note that a combination of fast innovation at the high end and lower cost handsets have
made the smartphone market mainstream, systematically cannibalizing several consumer
electronics (CE) products. In fact, we estimate that smartphones will account for nearly
35% of CE spend globally in 2012. At the same time, while smartphone growth is indeed
strong, the spoils are not being equally shared. So where to now? In this note, our
extensive review of the smartphone market arrives at three main conclusions. First, the
emergence of a robust white-label market is developing in smartphone so much so that
most market observers are underestimating the actual size of the smartphone market.
Second, we see continued and unprecedented growth in the high end of smartphone
market, i.e., at above $400 ASP. Finally, in terms of winners and losers, we believe Apple
and Samsung will remain truly dominant and the rest of the industry will struggle to be
even at breakeven levels in terms of handset profitability.
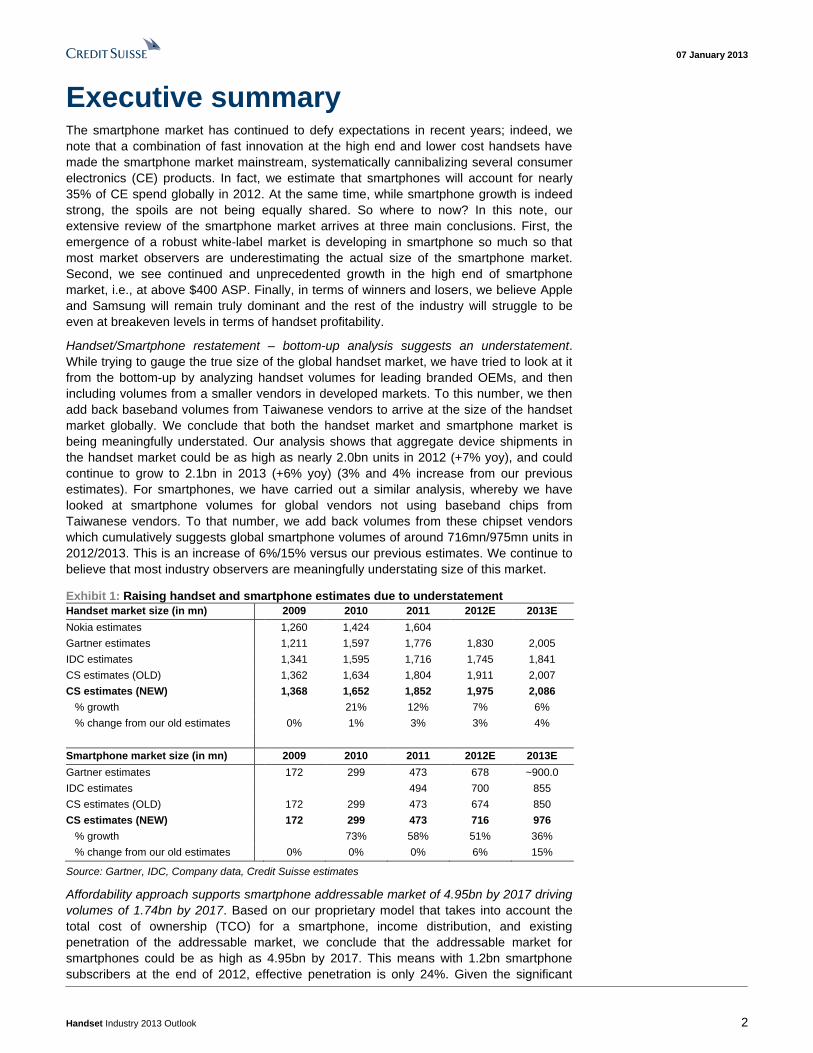
Handset/Smartphone restatement – bottom-up analysis suggests an understatement.
While trying to gauge the true size of the global handset market, we have tried to look at it
from the bottom-up by analyzing handset volumes for leading branded OEMs, and then
including volumes from a smaller vendors in developed markets. To this number, we then
add back baseband volumes from Taiwanese vendors to arrive at the size of the handset
market globally. We conclude that both the handset market and smartphone market is
being meaningfully understated. Our analysis shows that aggregate device shipments in
the handset market could be as high as nearly 2.0bn units in 2012 (+7% yoy), and could
continue to grow to 2.1bn in 2013 (+6% yoy) (3% and 4% increase from our previous
estimates). For smartphones, we have carried out a similar analysis, whereby we have
looked at smartphone volumes for global vendors not using baseband chips from
Taiwanese vendors. To that number, we add back volumes from these chipset vendors
which cumulatively suggests global smartphone volumes of around 716mn/975mn units in
2012/2013. This is an increase of 6%/15% versus our previous estimates. We continue to
believe that most industry observers are meaningfully understating size of this market.
Exhibit 1: Raising handset and smartphone estimates due to understatement
Handset market size (in mn) 2009 2010 2011 2012E 2013E
Nokia estimates 1,260 1,424 1,604
Gartner estimates 1,211 1,597 1,776 1,830 2,005
IDC estimates 1,341 1,595 1,716 1,745 1,841
CS estimates (OLD) 1,362 1,634 1,804 1,911 2,007
CS estimates (NEW) 1,368 1,652 1,852 1,975 2,086
% growth 21% 12% 7% 6%
% change from our old estimates 0% 1% 3% 3% 4%
Smartphone market size (in mn) 2009 2010 2011 2012E 2013E
Gartner estimates 172 299 473 678 ~900.0
IDC estimates 494 700 855
CS estimates (OLD) 172 299 473 674 850
CS estimates (NEW) 172 299 473 716 976
% growth 73% 58% 51% 36%
% change from our old estimates 0% 0% 0% 6% 15%
Source: Gartner, IDC, Company data, Credit Suisse estimates
Affordability approach supports smartphone addressable market of 4.95bn by 2017 driving
volumes of 1.74bn by 2017. Based on our proprietary model that takes into account the
total cost of ownership (TCO) for a smartphone, income distribution, and existing
penetration of the addressable market, we conclude that the addressable market for
smartphones could be as high as 4.95bn by 2017. This means with 1.2bn smartphone
subscribers at the end of 2012, effective penetration is only 24%. Given the significant

07 January 2013
Handset Industry 2013 Outlook 3
increase in smartphones being available at sub-$100, we see this rising to around 80%
long term, reaching 3.9bn users, i.e. 79% of the 4.95bn addressable market. In turn, even
assuming a moderate decline in replacement rates, smartphone volumes will grow to
1.74bn by 2017, almost 2.5x from levels in 2012, and seeing a CAGR of 19% over the
next five years.
Exhibit 2: We estimate smartphone market to be 716mn/976mn units in 2012/2013, growing to 1.74bn by 2017
Global Handset Volumes 2008 2009 2010 2011 2012E 2013E 2014E 2015E 2016E 2017E CAGR ‘12-‘17
Basic Phones 407 432 530 593 612 615 607 607 591 548 -2.2%
Feature Phones 761 763 823 787 646 495 324 177 107 49 -40.3%
Smartphones 139 172 299 473 716 976 1,219 1,425 1,577 1,737 19.4%
Total (in mn) 1,307 1,368 1,652 1,852 1,975 2,086 2,149 2,209 2,275 2,334 3.4%
Global Handset Volume Mix
Basic Phones 31% 32% 32% 32% 31% 30% 28% 28% 26% 24% NM
Feature Phones 58% 56% 50% 42% 33% 24% 15% 8% 5% 2% NM
Smartphones 11% 13% 18% 26% 36% 47% 57% 65% 69% 74% NM
Total (in %) 100% 100% 100% 100% 100% 100% 100% 100% 100% 100% NM
Source: Gartner, Company data, Credit Suisse estimates
A barbell develops in the smartphone market as the mid-end shrinks. We believe that the
smartphone market at $400+ ASP will grow over 4x in volume terms over 2010 to 2013
reaching nearly 400mn units by 2013, before seeing some moderation in growth. This
combined with our view around volume growth in <$200 ASP market (driven by white-label
vendors in China/India) means that smartphone volumes in the $200 to $400 ASP range
will only grow from ~300mn units in 2012 to ~400mn units by 2015. Specifically, we see
this low-end market (<$200 ASP) being enabled by a plethora of low-end launches (our
portfolio database shows 74 low-end smartphone models out of 425 models we tracked
from branded vendors) as well as low cost chipset efforts from MediaTek, Spreadtrum and
also Qualcomm. For the mid-end segment, we expect it to decline from 40% of total
smartphone volumes in 2012 to ~25% by 2015. This continued shift towards high-end now
combined with move towards low-end means that a number of branded OEMs including
RIM, Nokia, LG, Sony Mobile may continue to struggle given stiff competition in the high-
end from Apple and Samsung driven by better smartphone offering, and then aggressive
pricing from white-label vendors in the low-end.
LTE at an inflection point. We expect rapid growth in LTE devices to be driven by the
confluence of several factors, including the launch on an LTE iPhone, increasing handset
availability (we note that there are some 75 LTE smartphones available in the market out
of a total of 425 smartphones from branded OEMs). Further, we see Samsung’s robust
growth in the high-end segment as another significant driver of LTE device uptake. Further,
this is being supported by expanding LTE network coverage as Korea and Japan were
seen as early adopters of LTE, but carriers’ network rollout plans in the US and China
point to a rapid expansion of LTE network coverage over the next 2-3 years.
The importance of compute. Historically we would argue that handset, PC and other CE
devices were largely independent purchases by a consumer or corporation to fulfill a
specific need. However, the growth of smartphones has now evolved to a degree whereby
consumers and corporations demand access to their key digital content across multiple
devices. In this context, smartphone success also needs to take into account the ability of
the entire platform. Looked at from a hardware perspective, success in smartphones will
be determined by the ability to simultaneously execute in the PCs and tablet market, and
perhaps the TV market as well in the long term. In this new world, success will no longer
be judged by category unit share alone, whether it be in smartphones, mobile phones,
tablets or PCs, but in the combined compute segment.
The importance of value share. While Android continues to enjoy its dominance in the
smartphone market and indeed with a market share of 70-75% in unit terms, this cannot

07 January 2013
Handset Industry 2013 Outlook 4
be simply ignored. However, we do equally believe that scale also should be reflected by
value share, and further due to the significant volume growth we expect in the low-end
smartphone segment, this issue will be further exacerbated. Looking at value share in the
smartphone market, we see Apple and Samsung to remain #1 and #2 vendor in terms of
value share as we see Others category (non-branded OEMs) to account for 28% of
volume share in 2013 but still less than 15% value share.
Exhibit 3: Apple and Samsung to remain leaders in the smartphone market
Smartphone unit share (%) 2010A 2011A 2012E 2013E Smartphone value share (%) 2010A 2011A 2012E 2013E
Apple 16% 19% 19% 20% Apple 30% 36% 38% 40%
Samsung 9% 19% 29% 32% Samsung 8% 17% 27% 31%
Nokia 34% 18% 5% 2% Nokia 21% 10% 3% 1%
HTC 8% 9% 5% 5% HTC 10% 9% 4% 4%
Motorola 5% 4% 3% 2% Motorola 5% 4% 3% 1%
Sony 3% 4% 3% 2% Sony 4% 4% 3% 2%
Huawei 0% 3% 4% 5% Huawei 0% 2% 2% 2%
Research in Motion 17% 11% 5% 3% Research in Motion 16% 10% 3% 2%
LG 2% 4% 4% 4% LG 1% 3% 3% 2%
Others 6% 9% 24% 28% Others 5% 6% 13% 14%
Total 100% 100% 100% 100% Total 100% 100% 100% 100%
Source: Company data, Credit Suisse estimates
Apple – compute advantage gives competitive edge
Specifically in smartphones, we see Apple as continuing to gain share with its smartphone
share rising to 20% in 2013 up from 19% in 2012 driven by several factors:
Ranking first on our scorecard. Even 5 years after the first iPhone launch, Apple continues
to rank above peers, specifically when looking at our proprietary scorecard which takes in
to account 9 key factors ranging from software and services to brand and distribution,
Apple ranks #1, which is a reflection of the underlying strengths of the business. We
currently assume Apple will be able to consolidate its smartphone market share to 20% in
2013, up from 19% in 2012.
Expanding carrier distribution can drive an extra 75mn units per year. We specifically see
an opportunity for Apple to grow units through expanded carrier distribution. In fact, as
Apple scales its distribution, we estimate that the next 50 largest carriers could increase
iPhone units by around 75mn annually, compared to 138mn units we assume for 2012.
Compute advantage gives the competitive edge. Perhaps the biggest advantage for Apple
is being driven by the company’s ability to compete in the compute market, i.e.,
smartphones, tables and PC like no other vendor. Add to this, the broad range of “i-
Services” that are built well beyond iTunes, to include the Apps Store, iAd services, iBooks
and iCloud, the company allows consumers to seamlessly access content across multiple
devices. The issue is that when considered in the context of the entire compute market in
volume terms Apple has a ~18% share, which will rise given its exposure to the relatively
faster growing smartphone and tablet end markets towards 22% longer term. However,
this is unlikely to be dominant. Should Apple want to maximize this, we retain our view that
the company may want to consider launching a lower end iPhone.
Valuation. With solid product cycles in the back half of 2012 and shares trading on a P/E
of 8.8x our CY13 EPS, Apple remains inexpensive in the context of 30% bottom-line
growth and $128 of net cash per share.
Nokia – still a challenging turnaround
For Nokia, we retain our below consensus EPS estimates of €(0.28)/€(0.24), in particular
the company continues to face material challenges in turning the business around over the
07 January 2013
Handset Industry 2013 Outlook 5
next 12 months. This, combined with our concerns around cash burn, leads us to reiterate
our Underperform rating.
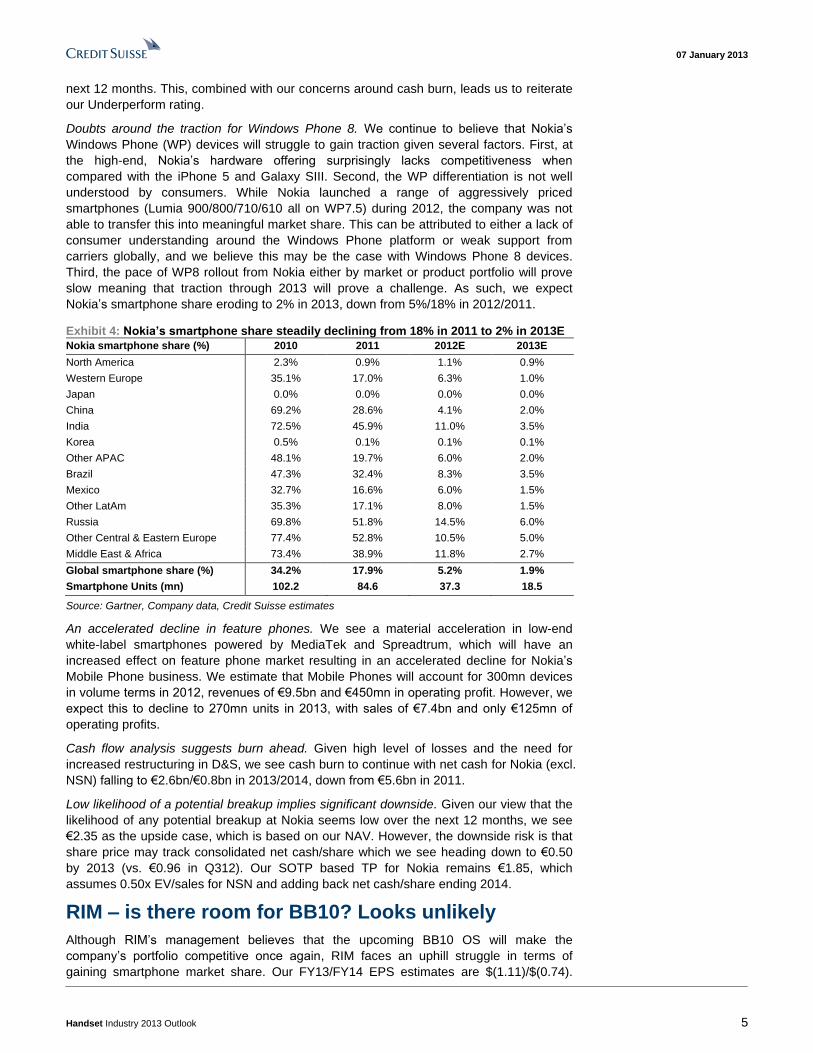
Doubts around the traction for Windows Phone 8. We continue to believe that Nokia’s
Windows Phone (WP) devices will struggle to gain traction given several factors. First, at
the high-end, Nokia’s hardware offering surprisingly lacks competitiveness when
compared with the iPhone 5 and Galaxy SIII. Second, the WP differentiation is not well
understood by consumers. While Nokia launched a range of aggressively priced
smartphones (Lumia 900/800/710/610 all on WP7.5) during 2012, the company was not
able to transfer this into meaningful market share. This can be attributed to either a lack of
consumer understanding around the Windows Phone platform or weak support from
carriers globally, and we believe this may be the case with Windows Phone 8 devices.
Third, the pace of WP8 rollout from Nokia either by market or product portfolio will prove
slow meaning that traction through 2013 will prove a challenge. As such, we expect
Nokia’s smartphone share eroding to 2% in 2013, down from 5%/18% in 2012/2011.
Exhibit 4: Nokia’s smartphone share steadily declining from 18% in 2011 to 2% in 2013E
Nokia smartphone share (%) 2010 2011 2012E 2013E
North America 2.3% 0.9% 1.1% 0.9%
Western Europe 35.1% 17.0% 6.3% 1.0%
Japan 0.0% 0.0% 0.0% 0.0%
China 69.2% 28.6% 4.1% 2.0%
India 72.5% 45.9% 11.0% 3.5%
Korea 0.5% 0.1% 0.1% 0.1%
Other APAC 48.1% 19.7% 6.0% 2.0%
Brazil 47.3% 32.4% 8.3% 3.5%
Mexico 32.7% 16.6% 6.0% 1.5%
Other LatAm 35.3% 17.1% 8.0% 1.5%
Russia 69.8% 51.8% 14.5% 6.0%
Other Central & Eastern Europe 77.4% 52.8% 10.5% 5.0%
Middle East & Africa 73.4% 38.9% 11.8% 2.7%
Global smartphone share (%) 34.2% 17.9% 5.2% 1.9%
Smartphone Units (mn) 102.2 84.6 37.3 18.5
Source: Gartner, Company data, Credit Suisse estimates
An accelerated decline in feature phones. We see a material acceleration in low-end
white-label smartphones powered by MediaTek and Spreadtrum, which will have an
increased effect on feature phone market resulting in an accelerated decline for Nokia’s
Mobile Phone business. We estimate that Mobile Phones will account for 300mn devices
in volume terms in 2012, revenues of €9.5bn and €450mn in operating profit. However, we
expect this to decline to 270mn units in 2013, with sales of €7.4bn and only €125mn of
operating profits.
Cash flow analysis suggests burn ahead. Given high level of losses and the need for
increased restructuring in D&S, we see cash burn to continue with net cash for Nokia (excl.
NSN) falling to €2.6bn/€0.8bn in 2013/2014, down from €5.6bn in 2011.
Low likelihood of a potential breakup implies significant downside. Given our view that the
likelihood of any potential breakup at Nokia seems low over the next 12 months, we see
€2.35 as the upside case, which is based on our NAV. However, the downside risk is that
share price may track consolidated net cash/share which we see heading down to €0.50
by 2013 (vs. €0.96 in Q312). Our SOTP based TP for Nokia remains €1.85, which
assumes 0.50x EV/sales for NSN and adding back net cash/share ending 2014.
RIM – is there room for BB10? Looks unlikely
Although RIM’s management believes that the upcoming BB10 OS will make the
company’s portfolio competitive once again, RIM faces an uphill struggle in terms of
gaining smartphone market share. Our FY13/FY14 EPS estimates are $(1.11)/$(0.74).

07 January 2013
Handset Industry 2013 Outlook 6
Although we retain our Neutral rating given the risk of a takeout at some point, both
fundamentals and NAV analysis suggest downside risks.
Launch of first two BB10 smartphones to be announced in January 2013. After having
seen multiple delays in launch of BB10 platform, RIM has announced that it will officially
launch its new BB10 OS as well as unveil its first two BB10 smartphones in an event on
January 30, 2013. So we have yet to see the specifications of the actual device. However,
in order to develop an ecosystem around its new BB10 OS, RIM has already issued
developers its BB10 Dev Alpha smartphone, although this is not the final product. While
we acknowledge that the new OS shows marked improvement vs. previous versions, we
still believe that it faces fierce competition from existing platforms such as Android and iOS,
given most of the features offered by new BB10 is already being offered by rivals, which
also benefit from presence of a strong ecosystem around their platforms.
A high price point could be detrimental to adoption. We believe that one of the reasons for
the delay in launching BB10 devices could have been RIM’s dependence on Qualcomm’s
Snapdragon 8960 processor, which has seen constraints during 2012 due to 28nm
capacity shortage. What this also may imply that the new BB10 smartphones could be
highly spec’d devices targeting at a high price point. We simply do not believe much of a
share opportunity exists in the high end of the market, given the success seen by Apple
and Samsung in that segment of the market.
Running out of the services revenue stream. One of the benefits that RIM had in the past
was that its strong Services revenue stream had been more or less stable so far over the
last few quarters. However, we believe that visibility of the services revenue stream is
rapidly deteriorating given BB10 monetization of the NOC, ongoing carrier renegotiation
and declining subscribers. This means that service revenue should fall, and we note the
recent quarter marks the first time management has discussed its expectation that some
of the base may generate no service revenue. We assume services revenue of
$3.9bn/$3.3bn in FY13/14, down 4%/16% y/y, further compounding issues around
profitability. In turn, this would expose the company’s high level of hardware losses which
we estimate could be as high as $3.5bn/$2.7bn in FY13/FY14.
NAV of $3.1bn (or $5.9/share). A combination of the late arrival of BB10 devices, as well
as a fiercely competitive environment, hinders RIM’s ability to turnaround its handset
business and estimate its global smartphone share declining to 3% in 2013 (vs. 5% in
2012). A break up is possible, however, we question the quality of the underlying IPR and
also believe that converting its existing NOC for other OS platforms may require a high
level of effort for minimal functionality improvement. Our NAV estimate for RIM is about
$3.1bn, and requires the acquirer to take over the company and shut down its hardware
business. At current levels, RIM does not offer meaningful upside and selling the company
will prove to be a challenge, although the appointment of bankers, the relatively small size
of a transaction, and ongoing positive FCF results in us maintaining our Neutral rating and
$11 TP (based on applying 0.3x EV/sales multiple to our FY14 estimate).
Lenovo – eyes on #1 spot in China smartphones
On Dec 28, 2012, CS raised its estimates and target price of Lenovo (covered by
Thompson Wu), and reiterated an Outperform rating. CS analyst Thompson Wu cited
positive smartphone demand in China, and improving momentum at Lenovo through
select country expansion, thus raising estimates. This is driven by his view that Lenovo
has the tools to build a profitable smartphone business long-term in China/Asia-Pac, and a
sound strategy to do so. Thompson Wu expects Lenovo to ship 25mn/38mn smartphones
in FY13/FY14, up from ~4mn in FY12. Of these, we expect the company to ship 94%/84%
respectively of its overall shipments in China. These estimates would imply Lenovo’s
China smartphone market share reaches around 10% in CY12/CY13.
Gain a strong China foothold. We expect China to account for around 30% of global
smartphone market by 2015 in volume terms. China happens to be Lenovo’s core market

07 January 2013
Handset Industry 2013 Outlook 7
generating 44%/67% of revenues/op profits YTD FY13. Lenovo can leverage its China PC
position (33% PC share YTD ‘12), localized manufacturing, PC supply chain advantages
(i.e. distribution), a popular China brand, and operational experience in the region as a
stepping stone for its smartphone business.
Selective country expansion. Lenovo is not initially building a global smartphone business.
Instead, Lenovo is focused on China and expanding into select Asia-Pac/Eastern
European countries with a large and fast growing smartphone market opportunity. In the
Dec 2012 quarter, Lenovo has entered into India (#1 in PC share), Indonesia (#3),
Philippines (#2), and Russia (#3). These are countries in which it also has top three PC
market and infrastructure investments we believe it can leverage such as distribution and
marketing. Lenovo plans to double its countries-addressed in FY14 to 10, from 5 in FY13.
Expand and strength operator relationships, leverage China distribution advantage.
Operator support is needed to deepen its penetration in China, expand into new countries,
and enter the high-end smartphone market. This latter is a market we expect Lenovo will
attack in FY14, and Lenovo will compete with other smartphone vendors (i.e.
Apple/Samsung) for subsidies and marketing dollars. According to Lenovo, roughly half of
China smartphones are sold through open-channels, which can yield 3x better gross
margins vs. operator channels. To date, more than 70% of Lenovo’s smartphones sold
have been through operators. Indeed, Lenovo will eventually leverage its China
distribution advantage once it achieves a certain level of scale, and having developed its
operator relationships. In China currently, it is deliberately choosing to distribute its popular
smartphones through operators, rather than use its own distribution, in efforts to build a
longer-lasting operator relationship. It is working with China Unicom, China Mobile, and
China Telecom and looks to balance distribution amongst the three operators in FY14.
Valuation. Lenovo’s operational leverage is a key focal point for investors next year. We
forecast its corporate operating will rise to 2.6% in FY14E (vs. 2.3% in FY13E) and for
earnings to grow ~28% (CS/Consensus of US$0.74/$0.69) driven by scaling benefits in
both its PC and MIDH business. Lenovo is trading at 13.2x our FY14E EPS (7.5x ex-cash).
Asian beneficiaries across the ecosystem
Based on bottom up analysis of smartphone chipsets for Asian built smartphones
(excluding Korean handset vendors), our Asian semiconductor analyst, Randy Abrams,
believes that has shown a ramp from 68mn units in 2011 to 244mn units in 2012. He
projects these units expanding to 816mn units in 2015, offering growth of 83% in 2013,
40% in 2014, and 31% in 2015, a substantial unit opportunity for several suppliers to
provide revenue growth even in the face of price competition. He also expects Mediatek to
lead the market, ramping from 110mn units in 2012 to 220mn in 2013 and 370mn units by
2015, with Spreadtrum achieving similar 25% share to feature phones as it expands from
31mn units in 2012 to 199mn units by 2015. The upstart is RDA which is taking material
share in feature phones and will sample its EDGE chipset from this quarter for 2H13
volumes. He expects Qualcomm to be the most material overseas competitor, with Marvell
only having high-end TD traction and Broadcom still needing to demonstrate inroads.
Looking at the beneficiaries across the smartphone ecosystem in Taiwan, Randy Abrams
notes his preference to own the space through the manufacturers benefiting from unit
growth (TSMC, ASE), IC design companies at reasonable valuations (Spreadtrum and
RDA – note Mediatek is restricted), and Asian devices gaining share (ZTE and Lenovo).
Within foundry, he downgrades UMC from Outperform to Neutral with same NT$14 target
(0.85x P/B) (reduced mobile leverage as Texas Instruments exits and Mediatek shifts to
28nm) and upgrades SMIC (turnaround and China smartphone and tablet leverage) and
raises his TP from HK$0.41 (0.7x P/B) to HK$0.57 (1x P/B). For details, please refer his
detailed note on China smartphone sector titled ‘Global handset forecast lifted by
emerging market demand’ also published concurrently.

07 January 2013
Handset Industry 2013 Outlook 8
Restating & raising smartphones Before even considering projection of smartphone volumes, it is essential to have the
correct historic estimates. The issue facing the handset industry in recent years has been
the size of the white-label market, and our analysis suggests both the handset and
smartphone markets at least in volume terms are being meaningfully understated. Next
when it comes to forecasting, most of the long-term forecasts for smartphone volumes are
based on an estimate of smartphones increasing as a percentage of the overall mobile
handset market. However, given that smartphones continue to be significantly more
expensive than a low-end phone, we continue to believe that any long-term forecast has to
be based on linking the income distribution and total cost of ownership to device
affordability. As such, we have again refreshed our proprietary analysis to look at the
smartphone market from an affordability perspective while taking in to account the total
cost of ownership (TCO) or ASP of a smartphone which is often overlooked. The
conclusion is that when we factor in the rising availability of lower end smartphones, we
see an increase in the total number of people globally who can afford to buy a
smartphone, either with a monthly data plan, or at times even without it especially in some
of the developing markets like China and India.
Raising and restating the market size as both handsets and smartphones are being
underestimated. A lingering issue for the global handset market over recent years, which
has often been debated, is the actual size of the market in volume terms. In fact, we note
there is a wide spread of handset estimates that currently exist for 2011/2012, as shown in
Exhibit 5. The key issue which causes such a diversion remains around the treatment of
the white-label and/or grey market handsets (we define this as either legitimate or
illegitimate handsets which are being sold by non-tier I global brands). By conducting a
bottom-up volume exercise, both the handset and smartphone markets are already
meaningfully higher than most analysts believe.
Exhibit 5: We see a wide range of estimates for the size of global handset market
Handset market size (in mn) 2009 2010 2011 2012E 2013E
Nokia estimates 1,260 1,424 1,604
Gartner estimates 1,211 1,597 1,776 1,830 2,005
IDC estimates 1,341 1,595 1,716 1,745 1,841
CS estimates (OLD) 1,362 1,634 1,804 1,911 2,007
CS estimates (NEW) 1,368 1,652 1,852 1,975 2,086
Source: Gartner, IDC, Company data, Credit Suisse estimates
Handset units – bottom-up analysis suggests volumes of 2bn for global handset market in
2012, but slowing growth ahead. While trying to gauge the true size of the global handset
market, we have tried to look at it from a bottom-up angle by analyzing handset volumes
for leading branded OEMs, and then including volumes from a bunch of smaller vendors in
developed markets (both of which do not use baseband chips from Taiwanese vendors).
To this, we add baseband volume numbers from MediaTek, Spreadtrum and RDA Micro in
Taiwan, and our analysis shows that aggregate device shipments in the handset market
could be as high as nearly 2bn units in 2012 (+5% yoy), and could continue to grow to
2.1bn in 2013 (+7% yoy). Beyond this, with the market being 72% penetrated in terms of
unique subscribers, and as this rises to 85% by 2017, it results in a significant slowdown in
the number of new mobile subscribers buying handsets. Simultaneously, we do not
assume any pick up in handset replacement rates (we have it constant at around 27% of
previous year’s subscriber base), which drives our view that volume growth for the global
handset market may stall to only around 3% beyond 2013.
Smartphone volumes – emergence of the white-label market. Similar to handsets, we have
done a similar bottom-up analysis for smartphone vendors to estimate the true size of the
global smartphone market. Our analysis here shows that the level of understatement in
smartphone volumes could be material especially as Taiwanese chipset vendors continue

07 January 2013
Handset Industry 2013 Outlook 9
to ramp their smartphone chip volumes in 2H12 and 2013. We now estimate that volumes
in the smartphone market could be 716mn/976mn units in 2012/2013, which are around
6%/15% higher than our earlier estimates. Note these estimates are also significantly
higher than estimates from other market research firms or analysts. For example, IDC
estimates 855mn smartphones to be shipped in 2013, while that number for Gartner is
around 900mn, as shown in Exhibit 6.
Exhibit 6: Our smartphone estimates are significantly higher than Gartner and IDC
Smartphone market size (in mn) Q112 Q212 Q312 Q412E 2011 2012E 2013E
Gartner estimates 147.0 153.7 169.2 207.6 472.9 677.5 ~900.0
IDC estimates 144.9 153.9 179.7 221.1 494.4 699.6 854.6
CS estimates (OLD) 147.0 153.7 169.0 204.1 472.9 673.8 850.2
CS estimates (NEW) 151.5 160.9 181.4 222.4 472.9 716.3 975.5
Source: Gartner, IDC, Company data, Credit Suisse estimates
Affordability/TCO approach supports LT addressable market of 4.95bn for smartphones...
To project long term market for smartphones, we continue to rely upon our proprietary
model that takes into account the total cost of ownership (TCO) for a smartphone, income
distribution, and existing penetration of the addressable market. We conclude that the
addressable market for smartphones could be as high as 4.95bn by the end of 2015. We
define TCO as the upfront cost that a consumer pays for a smartphone (subsidised or
unsubsidized depending on the region) combined with the annual service cost for a basic
voice and data plan associated with that device where relevant. Our smartphone model
suggests that by 2015/2017, the global smartphone subscriber base will rise from 1.2bn at
the end of 2012 to reach 2.8bn/3.9bn, i.e. nearly 60%/80% of the 4.95bn addressable
market.
….driving annual smartphone shipments to 1.74bn units by 2017. Based on this long-term
estimate of an addressable market of 4.95bn and that by the end of 2012, there will be
1.2bn smartphone subscribers, effective penetration for smartphones could rise from 24%
in 2012 to nearly 60%/80% by 2015/2017. This will drive smartphone volumes from 716mn
in 2012 to 1.43bn/1.74bn in 2015/2017, implying a CAGR of 26%/19% over this period.
Our 2012/2013/2014 volume estimates of 716mn/976mn/1.22bn (implying 51%/36%/25%
yoy growth) are 6%/15%/21% higher than our earlier projections. With significant
improvements in availability of lower end smartphones, this drives our smartphone volume
estimate of 1.74bn units by 2017.

07 January 2013
Handset Industry 2013 Outlook 10
Handset market to be 2.09bn/2.15bn units in 2013/14
A lingering issue for the global handset market over recent years, which has often been
debated, is the actual size of the market in volume terms. In fact, we note the wide spread
of handset estimates that currently exist for 2011/2012. The key issue which causes such
a diversion remains around the treatment of the white-label, or grey market handsets (we
define this as either legitimate or illegitimate handsets which are being sold by non-tier I
global brands). By conducting a bottom-up volume exercise, both the handset and
smartphone markets are already meaningfully higher than most analysts believe. As a
result, we are raising our 2012/2013/2014 handset estimates by 3%/4%/2% to
1.98bn/2.09bn/2.15bn respectively as shown in Exhibit 7. Similarly, the smartphone
market is materially higher than expected and we are raising our volume estimates here by
6%/15%/21% to 716mn/976mn/1.22bn units for 2012/2013/2014 respectively. Specifically,
our analysis takes in to account a bottom-up analysis for all vendors for both handset and
smartphone markets.
Exhibit 7: Our bottom-up vendor analysis shows that global handset market could be close to 2bn units in 2012 Breakdown of global handset volumes including branded OEMs, and white-label and grey market vendors
Handset sell through (mn) 2008 2009 2010 2011 2012E 2013E
Samsung 199 236 281 315 408 459
Nokia 472 441 461 422 335 289
Apple 11 25 47 89 138 191
LG Electronics 103 122 114 86 56 67
HTC 7 11 25 43 32 44
Sony Ericsson / Sony Mobile 93 55 42 33 38 34
Motorola 107 58 39 40 32 29
Research In Motion 23 34 50 52 32 26
Kyocera / Sanyo 11 10 11 15 12 11
Pantech 5 4 9 10 10 9
Sharp 11 11 9 8 7 6
Panasonic Communications 7 5 5 4 4 4
Fujitsu 4 5 5 7 8 7
NEC / Casio / Hitachi 7 5 5 4 4 3
Top 14 vendors (mn) 1,060 1,023 1,101 1,127 1,115 1,179
% yoy growth 6% -4% 8% 2% -1% 6%
Other handsets, not based on Taiwanese chipset vendors
Other small Japanese vendors 5 2 1 2
Other branded non Taiwanese based vendors 16 11 6 6
Non Taiwanese based handsets (Other small vendors) 9 11 35 37
Total non Taiwanese based Other Vendors (mn) 29 24 42 46 48 46
% yoy growth -65% -19% 75% 10% 5% -5%
Handset market excl Taiwanese based volumes (mn) 1,090 1,046 1,143 1,173 1,163 1,224
% yoy growth 0% -4% 9% 3% -1% 5%
MediaTek baseband shipments 234 355 500 540 508 621
MStar baseband shipments 10 49 76
SpreadTrum baseband shipments 21 23 89 199 266 298
RDA baseband shipments 0 10 83 124
Total Taiwanese baseband shipments 255 378 599 798 932 1,042
Discount factor for obsolescence and multiple chips -15% -15% -15% -15% -15% -15%
MediaTek / Spreadtrum / MStar based handsets (mn) 217 322 510 679 793 886
MediaTek / Spreadtrum / MStar market share (%) 17% 24% 31% 37% 41% 42%
Total handset market (mn) (based on vendor analysis) 1,307 1,368 1,652 1,852 1,956 2,110
% yoy growth (sell in) 8% 5% 21% 12% 6% 8%
Current CS estimates (sell-in as per CS handset model) 1,307 1,368 1,652 1,852 1,975 2,086
% yoy growth (sell in) 8% 5% 21% 12% 7% 6%
Market estimates, as per Nokia (mn) 1,213 1,260 1,424 1,604
% difference between Nokia and CS estimates -7% -8% -14% -13%
Market estimates, as per Gartner (mn) 1,222 1,211 1,597 1,776 1,830 2,005
% difference between Gartner and CS estimates -7% -11% -3% -4% -7% -4%
Our bottom-up analysis shows handset volumes could be close to 2bn units in 2012 1) Slight decline in unit growth for top vendors in
2012. Our bottom-up analysis of handset vendor unitsindicate that the top 14 vendors (not using Taiwanesechipset vendors) may ship 1.1bn units in 2012, implying1% decline in volumes.
2) Taiwanese chipset vendors could ship nearly
950mn baseband units in 2012.
MediaTek to ship over 500mn baseband units.
MediaTek’s volumes continue to show stronggrowth, and we expect it to ship over 500mn/600mn baseband chipsets in 2012/2013 afterregistering 7% yoy growth in 2011.
Spreadtrum also expected to ship ~265mn
units in 2012. With Spreadtrum also likely to shiparound 265mn baseband units in 2012 and nearly300mn in 2013, we believe this momentum fromTaiwan based chipset vendor has continued into2012.
RDA – another Asian entrant in basebands.
Similar to MediaTek and Spreadtrum, RDA is alsoexpected to ship over 80mn baseband units in2012, and around 125mn in 2013. Combiningthese three vendors, we get to a total of930mn/1.04bn baseband units for 2012/2013.
Assuming 15% discount rate. To account forissues like inventory build, obsolescence and useof multiple chips, we have assumed 15% discountrate for Taiwanese baseband volumes. Even then,this shows that these vendors have captured over40% volume share in the handset market.
3) Bottom-up analysis shows that global handset
units can be 2bn in 2012. Our bottom-up analysisshows that the handset market in 2012 may be close to2bn units, which implies mid-single digit yoy volumegrowth, followed by 2.1bn units in 2013 (higher thanestimates from other sources).
1
2
3
Source: Company data, Gartner, Credit Suisse estimates
Our bottom-up analysis suggests volumes of ~2bn for global handset market in 2012.
While trying to gauge the true size of the global handset market, we have tried to look at it
from a bottom-up angle by analyzing handset volumes for leading branded OEMs, and
then including volumes from a bunch of smaller vendors in developed markets (both of
which do not use baseband chips from Taiwanese vendors). To this number, we then add
back baseband volumes from Taiwanese vendors to arrive at the size of the handset
market globally. As detailed in Exhibit 7, our analysis shows that aggregate device
shipments in the handset market could be as high as nearly 2bn units in 2012 (+6% yoy),
and could continue to grow to 2.1bn in 2013 (+8% yoy).

0
7 J
an
ua
ry 2
01
3
Ha
nd
se
t Ind
us
try 2
01
3 O
utlo
ok
1
1
Exhibit 8: We estimate global handset volumes to continue to show 6% growth in 2013 before slowing down to 3% in outer years Detailed assumptions around global handset demand
Global handset summary 2010 2011 2012E 2013E 2014E 2015E 2016E 2017E CAGR 12-17E
Population ('000) 6,509,465 6,600,011 6,692,091 6,786,667 6,883,658 6,983,051 7,084,974 7,189,471
Change (%) 1.4% 1.4% 1.4% 1.4% 1.4% 1.4% 1.5% 1.5%
GDP ($ bn) 57,230 58,880 60,297 61,960 64,051 66,393 68,872 71,480 3.5%
Change (%) 4.2% 2.9% 2.4% 2.8% 3.4% 3.7% 3.7% 3.8%
Factory ASP ($) 135 147 159 168 167 163 154 146 -1.7%
Change (%) 1% 9% 8% 6% -1% -3% -5% -5%
Mobile Subscriptions ('000) (*1) 5,157,390 5,746,901 6,225,776 6,638,735 6,999,144 7,331,280 7,670,007 8,006,611 5.2%
Change (%) 14.7% 11.4% 8.3% 6.6% 5.4% 4.7% 4.6% 4.4%
Reported penetration (%) 79.2% 87.1% 93.0% 97.8% 101.7% 105.0% 108.3% 111.4%
Unique Mobile Subscribers ('000) (*2) 3,965,363 4,424,247 4,799,394 5,111,788 5,384,068 5,632,304 5,883,394 6,130,982 5.0%
Change (%) 15.1% 11.6% 8.5% 6.5% 5.3% 4.6% 4.5% 4.2%
Real penetration (%) 60.9% 67.0% 71.7% 75.3% 78.2% 80.7% 83.0% 85.3%
Subscription / Subscriber ratio 1.30 1.30 1.30 1.30 1.30 1.30 1.30 1.31
Handsets for new subscriptions ('000) 546,369 505,224 417,057 357,489 312,163 285,595 290,486 287,997 -7.1%
Change (%) 2% -8% -17% -14% -13% -9% 2% -1%
% of handset market 34% 28% 21% 17% 15% 13% 13% 12%
Replacement Market ('000) 1,070,572 1,313,680 1,537,935 1,709,216 1,824,367 1,917,535 1,971,678 2,034,948 5.8%
Change (%) 27% 23% 17% 11% 7% 5% 3% 3%
% of handset market 66% 72% 79% 83% 85% 87% 87% 88%
Replacement units as % of
previous year subscription base 23.8% 25.5% 26.8% 27.5% 27.5% 27.4% 26.9% 26.5%
Sell-through handset shipments ('000) 1,616,941 1,818,904 1,954,992 2,066,705 2,136,529 2,203,130 2,262,165 2,322,945 3.5%
Unit Growth (%) 17% 12% 7% 6% 3% 3% 3% 3%
Sell-through handset revenues ($ mn) 218,152 267,781 310,844 347,206 357,142 359,068 348,412 338,990 1.7%
Revenue Growth (%) 18% 23% 16% 12% 3% 1% -3% -3%
Weeks of inventory 8.3 8.3 8.2 8.3 8.3 8.2 8.3 8.3
Mobile Handset Inventory units ('000) 256,926 290,325 310,118 329,083 341,845 347,417 359,989 371,001
Inventory Build / (Depletion) ('000) 35,407 33,399 19,793 18,965 12,762 5,572 12,572 11,012
Sell-in Mobile handset shipments ('000) 1,652,349 1,852,303 1,974,785 2,085,670 2,149,291 2,208,702 2,274,737 2,333,957 3.4%
Unit Growth (%) 21% 12% 7% 6% 3% 3% 3% 3%
Sell-in handset revenues ($ mn) 222,929 272,698 313,991 350,393 359,276 359,976 350,348 340,597 1.6%
Revenue Growth (%) 21% 22% 15% 12% 3% 0% -3% -3%
*1) Mobile subscriptions - this is the reported subscriber base and includes double counting of subscribers due to factors like Inertia, Multiple Devices and SIM-swapping
*2) Unique Mobile subscribers - this is the true subscriber base and excludes the impact of any double counting of same subscriber
1
1) Real penetration to reach 85% by 2017. Due to high ratio of subscription/subscriber, we estimate that the true global subs base at the end of 2012 to be4.8bn vs. the reported 6.2bn, implying true penetration level of 72%. Going forward, we expect this penetration number to rise to 85% by 2017 leading to6.1bn true subscribers.
2) Handset volume growth of 7%/6% in 2012/2013. We estimate the overall handset market to be 1.98bn/2.09bn for 2012/2013, up 7%/6% respectivelydue to strong growth in the smartphone market. Beyond that, we expect volume growth to remain around 3% as we reach towards saturation levels.
2
Source: Gartner, Credit Suisse estimates

07 January 2013
Handset Industry 2013 Outlook 12
Taiwan baseband vendors continue to gain share. For chipset vendors in Taiwan, we have
looked at baseband volumes for MediaTek (which acquired MStar recently), SpreadTrum
and RDA (all 3 companies covered by our analyst Randy Abrams). Cumulatively, these
vendors continue to see strong volume growth and may ship around 930mn baseband
chipsets in 2012 (up 17% yoy) and 1.04bn units in 2013 (up 12% yoy). Even assuming a
15% discount to their volumes to take into account impact from inventory build,
obsolescence and use of multiple chips, this implies that handsets using these chips may
account for over 40% of global handset shipments in 2012 (up from ~30% in 2010).
Slowing volume growth in the long term. One of the key observations we would make here
is that the global handset market will be around 72% penetrated in our view, as we
approach around 4.8bn unique mobile subscribers by the end of 2012, out of a population
base of 6.7bn. We estimate that penetration number will rise to 85% by 2017 (Exhibit 8),
which means that there will be a significant slowdown in the number of new mobile
subscribers buying handsets for the first time. Also in our estimates, we do not assume
any pick up in handset replacement rates (we have it constant at around 27% of previous
year’s subscriber base), which drives our view that volume growth beyond 2013 may stall
to only around 3% for the global handset market.
Smartphone volumes now also being restated higher
Similar to the handset market, we carried out bottom-up analysis for smartphone vendors
to estimate the true size of the global smartphone market. Our analysis here shows that
the level of understatement in smartphone volumes could be material especially as
Taiwanese chipset vendors continue to ramp their smartphone chip volumes in 2H12 and
2013. In summary as we detail in Exhibit 9, we estimate that volumes in the smartphone
market could be 716mn/976mn units in 2012/2013, which are around 6%/15% higher than
our earlier estimates. Further, these estimates are also significantly higher than estimates
from other market research firms or analysts. For example, IDC expects the smartphone
market to be 700mn/855mn units in 2012/2013.
Bottom-up vendor analysis shows market size could be >1bn units in 2013. We have done
an analysis similar to the overall handset market, whereby we have looked at smartphone
volumes for global vendors not using baseband chips from Taiwanese vendors. To that
number, we add back volumes from Taiwan chipset vendors, which cumulatively suggests
global smartphone volumes of around 735mn/1.05bn units in 2012/2013.
Growth in the tier I branded OEM category driven by Samsung and Apple. Although
smartphone volumes at some of the branded OEMs remain under pressure (Nokia, RIMM
and HTC), volume growth within this category to remain robust as we estimate 24%/29%
unit growth in 2012/2013 driven by Samsung and Apple.
Taiwanese vendors could ship close to 335mn smartphone basebands in 2013. The
reason for volume numbers to be restated is because of significant volume ramp for
smartphone basebands at chipset vendors in Taiwan. In fact, we estimate that MediaTek
and Spreadtrum together (both covered by Credit Suisse analyst Randy Abrams) shipped
only 10mn smartphone basebands in 2011, but that number will rise to nearly
150mn/335mn units in 2012/2013 (Exhibit 9). Even assuming 15% discount to these
volumes, we estimate that smartphones powered by these chips will account for some
17%/30% of global smartphone volumes in 2012/2013.
Significant understatement of smartphone market by analysts and market research firms.
All of this means that there may be a significant level of understatement in the volume
estimates for the smartphone market. As a result, we have had to restate/increase our
global volume numbers for the smartphone market in 2012/2013 by 6%/15%. This is
something, which could also happen to estimates from other sources including market
research firms like Gartner and IDC. For example, IDC expects the smartphone market to
be 700mn/855mn units in 2012/2013, but these number could again prove low based on
our analysis.

0
7 J
an
ua
ry 2
01
3
Ha
nd
se
t Ind
us
try 2
01
3 O
utlo
ok
1
3
Exhibit 9: Bottom-up vendor analysis suggests global smartphone volumes could be around 730mn/1.05bn units in 2012/2013 Breakdown of global smartphone volumes including branded OEMs, and white-label and grey market vendors
Q112 Q212 Q312 Q412E 2011 2012E 2013E
Top 8 vendors (not using Taiwan chip vendors)
Samsung 40.6 45.6 55.1 62.6 88.3 203.9 315.3
Apple 33.1 28.9 23.6 49.8 89.3 135.4 190.7
Nokia 13.3 11.7 7.2 5.1 84.6 37.3 18.5
HTC 7.7 9.3 8.4 7.0 43.0 32.4 44.0
Research In Motion 9.9 8.0 8.9 6.7 51.5 33.6 25.9
LG Electronics 5.0 5.8 7.0 8.3 19.0 26.0 35.0
Sony Ericsson / Sony Mobile 5.4 5.3 6.6 6.1 19.6 23.5 17.5
Motorola Mobility / Google 4.7 4.6 5.1 5.1 17.4 19.5 15.0
Sub-total of top 8 vendors (not using Taiwan chip vendors) (A) 119.8 119.3 121.9 150.6 412.7 511.6 661.9
Japan / Korea vendors
Sub-total of top Japan / Korea vendors (B) 6.2 5.2 6.6 6.6 16.9 24.6 27.1
Other vendors (using both Taiwan and international chip vendors)
ZTE 4.5 6.3 7.7 9.0 10.5 27.5 38.0
Huawei 5.3 5.4 7.8 9.0 15.6 27.5 35.0
Lenovo 2.4 4.4 7.0 11.2 1.7 25.0 38.0
Other key Chinese vendors 4.9 9.4 13.1 14.4 6.2 41.7 48.0
Remaining vendors 3.8 3.7 5.2 5.7 9.2 18.4 21.2
Sub-total of top China smartphone vendors (C) 21.0 29.2 40.7 49.3 43.3 140.2 180.2
Taiwan chipset vendors
MediaTek 10.0 20.5 38.3 47.0 10.0 115.8 243.4
SpreadTrum 0.1 1.6 11.0 18.0 0.2 30.8 91.5
Sub-total of Taiwan smartphone chip vendors 10.1 22.1 49.3 65.0 10.2 146.5 334.8
Assuming 15% discount 15% 15% 15% 15% 15% 15% 15%
Sub-total of Taiwan smartphone chip vendors (assuming 15% discount) (D) 8.6 18.8 41.9 55.3 8.7 124.6 284.6
Other vendors' volumes using Taiwan chip vendors
ZTE 0.2 0.9 1.1 1.3 0.5 3.7 11.4
Taiwan chip share at ZTE (%) 5% 15% 15% 15% 5% 13% 30%
Huawei 0.3 0.8 1.2 1.3 0.6 3.6 10.5
Taiwan chip share at Huawei (%) 5% 15% 15% 15% 4% 13% 30%
Lenovo 1.0 2.0 4.2 6.7 0.4 13.9 20.9
Taiwan chip share at Lenovo (%) 40% 45% 60% 60% 24% 55% 55%
Others 5.7 9.1 15.5 17.1 7.2 47.4 58.8
Taiwan chip share at Others (%) 65% 70% 85% 85% 47% 79% 85%
Smartphones based on Taiwan chip vendors (E) 7.2 12.8 22.1 26.5 8.7 68.6 101.6
Total smartphone market (mn) (A + B + C + D - E) 148.5 159.6 189.0 235.2 472.9 732.4 1,052.2
Smartphone volumes - CS published estimates (mn) 151.5 160.9 181.4 222.4 472.9 716.3 975.5
Smartphone volumes - Gartner estimates (mn) 147.0 153.7 169.2 207.6 472.9 677.5 ~900.0
Smartphone volumes - IDC estimates (mn) 144.9 153.9 179.7 221.1 494.4 699.6 854.6
Smartphone volumes - CS OLD estimates (mn) 147.0 153.7 169.0 217.1 472.9 673.8 850.2
1) Continued smartphone growth
at tier I vendors led by
Samsung and Apple. Withrobust volume growth at bothSamsung and Apple, we believesmartphone units at tier I brandedOEMs will continue to grow ataround 25% per annum in2012/2013.
2) Smartphone baseband units
from Taiwan to more than
double in 2013. We believe thatMediaTek and Spreadtrumtogether will ship over 325mnbaseband units for smartphonesin 2013, around 2.3x unit growthvs. 2012. This will drive significantvolume growth at the low-end ofthe smartphone marketparticularly led by white-label andgrey market vendors. Evenassuming 15% discount to theirvolumes, we estimatesmartphones powered by thesechips will grow from 125mn unitsin 2012 to 285mn in 2013.
3) Bottom-up analysis shows
volumes could be over 1bn in
2013. Our analysis suggests thatglobal smartphone volumes couldbe as high as 730mn units in2012 and 1.05bn in 2013. Wehave taken a conservative viewand estimate 716mn/975mnunits, which are 6%/15% higherthan our previous estimates, andalso higher than estimates frommarket research firms.
2
1
3
Source: Company data, Gartner, IDC, Credit Suisse estimates

07 January 2013
Handset Industry 2013 Outlook 14
Forecasting smartphones based on TCO
We continue to believe that any forecast of the smartphone market needs to have at its
core the affordability and total cost of ownership (TCO) of smartphones. Given subsidies in
developed markets, handsets are primarily bundled with a service package which tends to
mask the true cost of the device. While we acknowledge that aggressive promotions can
have a significant impact on the volume ramp-up of a given product, we still believe that
the TCO remains crucial for the penetration of the overall market. To arrive at our TCO
estimates, we have made several important assumptions, as are detailed in Exhibit 12.
■ Smartphone ASPs of close to $45 in most emerging markets by 2017. In a number of
emerging market countries like India and China, we already have low end
smartphones selling at around $70. This number will decline to around $45 by 2017
driven by improvement in chipset efficiency and decline in component pricing. In
developed markets, given the pricing for smartphones is still much higher compared to
emerging markets, we have assumed around $100 of cumulative ASP decline for a
typical lower end device over the next 5 years.
■ Normal levels of ARPU decline. We have assumed annual ARPU pressure of 6% in all
markets (except for NA where we have assumed 10%) to take into account pricing
pressure at mobile operators.
■ Including only device cost in TCO calculation in some of the developing markets.
Given strong level of traction seen for low end smartphones (priced at around $70 to
$100) in a number of emerging market countries, we have adjusted the way we
calculate TCO for a smartphone. In these markets, we find that at the lower end of the
market, there is an increasing trend from consumers towards buying a low-end
smartphone on pre-paid plans (without any service plan included for voice and/or
data). This means that the TCO for a low-end smartphone user only includes the cost
of a device, which is around $70 in countries like China and India (as shown in Exhibit
10), and which we expect to fall to around $45 by 2017.
■ Smartphone affordability threshold in each region. Based on Exhibit 13, we arrive at
smartphone affordability threshold in each region by looking at mobile telecoms as a
percentage of GDP in each of the regions in 2011. As such, we have used a
smartphone affordability threshold level of 1.3% in Western Europe, 1.4% in North
America, 2.2% in Central/Eastern Europe, 2.3% in Asia-Pacific, 2.6% in Latin America
and 4.1% in Africa.
Based on these core assumptions, we conclude that 4.95bn people globally will be able to
afford a smartphone by 2017, which is around 2x compared to our estimated addressable
base of 2.4bn people in 2012. We discuss each of our assumptions in detail in the
following sections.
Smartphone TCO varies a lot by region. We analyzed the TCO for a low-end smartphone
by vendor and for around 15 countries as listed in Exhibit 10, and this demonstrates that
the ownership cost for smartphones falls in a wide range. We believe that this is owing to a
number of factors such as the stage of the smartphone market in terms of nascence,
competitive dynamics, and device positioning by vendor. We also note that our analysis is
based on the TCO at the lower end of the market, as this sub-segment of the overall
market will be key to driving adoption long term. In particular, we have looked at the lowest
consistent level of cost faced by a consumer by isolating comparable terminals and
reasonable levels of data usage. We note that the TCO varies significantly in subsidized
versus unsubsidized markets, with the cost ranging from as low as $70 for countries like
China and India (only the device cost given a number of users may use these devices on
pre-paid tariff plans to further lower their TCO) to as high as $720 in the US. This is
another trend in emerging markets which is likely to have a significant impact in terms of
further expanding the addressable market for smartphones.

07 January 2013
Handset Industry 2013 Outlook 15
Exhibit 10: TCO for a low-end smartphone – TCO composition varies significantly by region
69
70
146
158
0
0
0
0
69
1
6
128
0
1
0
0
0
0
250
311
368
374
312
388
466
451
632
720
0 100 200 300 400 500 600 700 800
India
China
Philippines
Brazil
UK
Spain
Australia
Mexico
Russia
France
Germany
Italy
Canada
United States
Low-end smartphone TCO in 2012 (US$)
Upfront Device ASP (US$)
One year Smartphone ARPU (US$)
ONLY DEVICE COST INCLUDED
BOTH DEVICE AND SERVICE COST INCLUDED
Source: Company data, Credit Suisse research
Forecasting the TCO long term. As shown in Exhibit 10, the two components of the
smartphone TCO are: i) the upfront cost of the terminal (device) to the consumer, and ii)
the annualized ARPU (voice and data) bundled with the device in markets where handset
subsidies exist. As can be seen in subsidized markets (such as Western Europe and North
America), this can be significantly different from unsubsidized markets such as Asia
Pacific.
Lower priced smartphones driven by BOM reductions. While we expect the smartphone
market to evolve with new features, at the lower end of the market, pricing will continue to
decline driven by BOM reductions. Here we would note that on a like-for-like basis,
component BOM can decline by around 10% per annum. Allowing for other fixed costs in
the total manufacturing expense and assuming some gross margin pressure at the
manufacturer level, we estimate that the ASP for low-end smartphones can continue to
decline to as low as around $45 by 2014 compared to around $70 currently. In subsidized
markets where the upfront cost for the terminal is already quite low given cost of the
device is bundled in the service plan, there will be around $100 of cumulative decline in
ASPs for a typical smartphone in developed markets over the next five years.
Expecting gradual ARPU declines. Forecasting ARPU declines is somewhat more
challenging given that each carrier tends to bundle data in a different way with a range of
voice minutes, texts and data. We note however, that at both the manufacturer and carrier
levels, there are several initiatives to bring down costs to the consumer over time. We
assume a moderate decline in the ARPU in the low-end smartphone market by 2015
based on an annualized ARPU reduction of 6% in all markets globally (except for the US
where we assume 10% decline given ARPU levels are significantly higher than other
regions).
Longer term TCO reduction to around $100 by 2017. As shown globally, by taking into
account the above assumptions for the low-end smartphone TCO (by region), we arrive at

07 January 2013
Handset Industry 2013 Outlook 16
the conclusion that the smartphone addressable market could reach 4.95bn units by 2017
in terms of affordability. We assume that at the very least, the reduction in the BOM will
pass straight on to the consumer and this implies that the TCO for a low-end smartphone
offering could reach as low as $103 longer term, a $90 decline or around 45% drop from
the current TCO of $194, which implies a CAGR decline of 12%. Geographically, we
continue to expect a variance in TCO, even in 2015 as shown in Exhibit 11.
Exhibit 11: TCO for a low-end smartphone device by 2015 in US$, unless otherwise stated
51
51
106
115
198
208
246
250
251
264
333
400
403
466
0 50 100 150 200 250 300 350 400 450 500
India
China
Philippines
Brazil
Spain
UK
Australia
Russia
Mexico
France
Germany
Canada
Italy
United States
TCO for a low-end smartphone by 2015 (US$)
ONLY DEVICE COST INCLUDED
BOTH DEVICE AND SERVICE COST INCLUDED
Source: Credit Suisse estimates

0
7 J
an
ua
ry 2
01
3
Ha
nd
se
t Ind
ustry
20
13
Outlo
ok
17
Exhibit 12: Smartphone TCO analysis – addressable market for smartphones can grow from around 2.4bn in 2012 to 4.95bn by 2017 driven by TCO declines Total cost of ownership in US$ and addressable population in millions
2012E 2015E 2017E% CAGR
(2012-2015)2012E 2015E 2017E 2012E 2015E 2017E
Additional
population
(2012 to 2017)
2012E 2015E 2017E
Developed countries
North America
United States 721 466 348 -13.5% 53 32 24 136 213 273 136 43% 66% 83%
Canada 632 400 295 -14.1% 50 27 20 18 30 33 15 53% 83% 90%
Western Europe
France 390 264 204 -12.2% 28 19 15 45 55 60 15 71% 86% 93%
Germany 503 333 264 -12.1% 36 25 19 54 69 74 20 66% 85% 91%
Italy 579 403 316 -11.4% 42 30 23 16 32 41 25 26% 51% 66%
Spain 311 198 147 -13.9% 22 15 11 30 40 43 13 66% 85% 91%
United Kingdom 250 208 184 -6.0% 18 15 14 51 55 59 8 81% 85% 90%
Rest of WE 363 277 217 -9.8% 26 20 16 67 81 88 21 67% 84% 90%
Other developed
Australia 368 246 188 -12.6% 19 11 8 21 24 24 3 91% 100% 100%
Hong Kong 363 242 185 -12.7% 19 10 8 6 7 7 1 81% 91% 95%
Japan 363 242 185 -12.7% 22 12 10 128 127 126 -2 100% 100% 100%
Singapore 363 242 185 -12.7% 19 10 8 5 5 6 1 86% 95% 100%
South Korea 363 242 185 -12.7% 19 10 8 36 46 49 13 71% 91% 95%
Taiwan 363 242 185 -12.7% 19 10 8 16 22 23 7 66% 91% 93%
Total Developed 457 322 253 -11.1% 31 21 17 628 805 905 277 63% 79% 88%
Emerging countries
China 70 51 46 -8.0% 3 2 2 948 1,236 1,248 300 70% 90% 90%
India 69 51 46 -8.0% 2 2 2 122 509 653 531 10% 40% 50%
Indonesia 69 51 46 -8.0% 3 2 2 98 204 236 138 40% 80% 90%
Brazil 158 115 94 -10.0% 6 4 3 118 121 164 46 60% 60% 80%
Pakistan 69 51 46 -8.0% 3 2 2 0 19 20 20 0% 10% 10%
Nigeria 69 51 46 -8.0% 2 1 1 33 71 113 80 20% 40% 60%
Bangladesh 69 51 46 -8.0% 3 2 2 0 15 16 16 0% 10% 10%
Russia 382 250 188 -13.2% 17 12 9 38 74 100 62 27% 53% 71%
Mexico 374 251 192 -12.5% 14 9 7 26 51 62 36 23% 43% 52%
Philippines 146 106 96 -8.0% 6 5 4 10 10 22 12 10% 10% 20%
Egypt 69 51 46 -8.0% 2 1 1 66 78 91 25 80% 90% 100%
Turkey 347 221 164 -13.9% 14 9 6 20 41 57 37 27% 53% 72%
Thailand 95 51 46 -13.6% 4 2 2 39 53 60 21 60% 80% 90%
Other emerging 136 105 92 -7.6% 5 4 3 619 1,010 1,200 581 39% 58% 65%
Total Developing 107 78 69 -8.3% 4 3 3 1,882 3,493 4,040 2,158 34% 59% 66%
Global Total 194 124 103 -12.0% 11 6 5 2,439 4,299 4,945 1,860 37% 62% 69%
% of Total population Income cutoff level,
US$ (000s) Addressable population, mn
Country
Total cost of ownership, $
(Smartphone and/or Service plan)
1
2
2
3
1) We expect the TCO for a
smartphone to decline by nearly
$90 or 45% over the next 5
years to $103 (from $194 in
2012). This decline will be driven
by a combination of lower end
smartphones and falling ARPU
levels.
2) Our affordability work shows that
an additional 275mn people will
be able to afford a smartphone in
developed markets, but more
importantly another 2.15bn in
developing markets by 2017.
The top three countries with the
largest absolute growth in
addressable population will be
India, China, Indonesia and US.
3) Around 4.95bn people will be
able to afford a smartphone
by 2017, which is around 2x the
current addressable population
base of 2.4bn globally.
Source: Company data, IMF, Credit Suisse estimates

07 January 2013
Handset Industry 2013 Outlook 18
Linking our TCO analysis to the addressable market
As we demonstrated and summarized in Exhibit 12, the TCO for a smartphone could fall
nearly 45% from the current level of $194 to $103 by 2017 as ASP and ARPU pressures
drive this trend. We now analyze effects due to income distribution and population by
region.
How much are consumers prepared to spend on smartphones? Once we have estimated
the cost of a smartphone to the consumer, the next issue is to calculate a sensible income
threshold level. While a smartphone is a desirable item, there is a limit to the income level
which the average consumer would be willing to spend on the combined hardware and
services. Here we have approached this analysis by looking at two separate metrics.
Exhibit 13: Mobile Telecoms as % GDP in 2011
1.4% 1.3%
2.6%
2.2%
4.2%
2.4% 2.3%
1.8%
0.0%
0.5%
1.0%
1.5%
2.0%
2.5%
3.0%
3.5%
4.0%
4.5%
NorthAmerica
WesternEurope
Latin America EasternEurope
Africa Middle East Asia-Pacific(ex Japan)
Japan
Mo
bil
e T
ele
co
ms
as
% o
f G
DP
(2
011
)
1.9% - Avg. global
2.5% - Avg. developing countries
1.4% - Avg. developed countries
Source: Gartner, Credit Suisse estimates
■ Mobile spending to GDP ratio of around 1.9% globally. We see in Exhibit 13 that
globally, the amount of mobile spend varies by region, with consumers spending on
average some 1.9% of GDP on mobile telephony and services. Hence, we would
argue that the TCO of a smartphone should not represent more than this level of
income. If we believe, as shown in Exhibit 12, that the TCO of a smartphone will be
$103 globally on a longer term basis, then a user would need a minimum income level
of $5,200 to afford a smartphone assuming he/she spends the same proportion on
mobile telephony. This provides our key income cut off level for different regions and
can be used to determine the potential addressable market for smartphones.
■ In emerging markets, the level is higher at 2.5%. Given the 1.9% (global) and 1.4%
(developed markets) threshold levels, the higher 2.5% ratio for developing markets
shows the importance of data and communication for users in these markets; they are
prepared to spend a higher percentage of GDP on mobile telephony. As shown, we
believe that subscribers in some emerging markets like Africa are spending around
4.2% of GDP on mobile related services.
Income distribution data suggests addressable market of 4.95bn longer term. We conclude
that users are prepared to spend as much as 1.3% to 4.2% of their income on smartphone
purchases (depending on the geographic region) and we can apply these cut-off levels to
determine the minimum level of GDP per head needed to purchase a smartphone based
on the TCO for a low-end smartphone in that market. Over the longer term, we then use

07 January 2013
Handset Industry 2013 Outlook 19
this estimate of required income to compute the level of population that is addressable. As
shown in Exhibit 12, the addressable market for smartphones is around 4.95bn globally.
Smartphone units to grow nearly 2.5x by 2017
With an addressable market of some 4.95bn by 2017, we now turn our analysis to
quantifying the market opportunity in terms of units. We conclude, based on our
affordability, penetration, and replacement analysis that the smartphone subscriber base
longer term could be as high as 3.9bn by 2017 (around 80% penetration of the 4.95bn
addressable market) and that the smartphone segment is set for a period of robust volume
growth reaching volumes of 1.74bn by 2017, up from 716mn units in 2012 as shown in our
summary smartphone model in Exhibit 18.
Exhibit 14: Mobile voice saw penetration gains of 40pp over five years after reaching 30% Base year 1 is taken as the year when penetration in individual region reached near 10%
0%
10%
20%
30%
40%
50%
60%
70%
80%
Year 1 Year 2 Year 3 Year 4 Year 5 Year 6 Year 7 Year 8 Year 9 Year 10
% s
ub
scri
ber
pen
etra
tio
n p
rog
ress
ion
on
ce p
enet
rati
on
rea
ches
10%
init
ially
Western Europe USA North America China India APAC CEE Africa Latin America Global Average
Mobile voice penetration
globally grew from 28% in
year 5 to 70% in year-10,
a 40pp absolute gain in 5
years.
Source: Gartner, Credit Suisse estimates
Penetration curves and the addressable market. We would note that effective smartphone
penetration (from affordability point of view) will be around 24% based on our estimate of
1.2bn smartphone subscribers at the end of 2012. The next step is to determine the
evolution of this penetration on a longer term basis. Here, a sensible approach is to take a
look at how the mobile voice market evolved. As shown in Exhibit 14, the voice market
followed a typical “S” curve for penetration, as it increased from 28% to 70% over a five-
year period, an increase of over 40 percentage points. Owing to the falling cost of
ownership, carrier push, and consumer pull, penetration gains will be higher in
smartphones than mobile voice. We estimate that smartphone effective penetration will
increase from 24% in 2012 to 79% by 2017 (Exhibit 15). This level of penetration would
imply smartphone subscribers of 3.9bn by 2017. In terms of sanity check, our estimates
imply that by 2017 smartphone penetration will reach i) 49% of the global mobile
subscriber base (Exhibit 16); ii) 54% of the global population; and iii) 74% of overall
handsets shipped.

07 January 2013
Handset Industry 2013 Outlook 20
Exhibit 15: Global smartphone penetration still low at 24% Effective smartphone penetration (based on affordability) over time
Exhibit 16: Smartphones account for 19% of mobile subs Smartphone subs base as percentage of mobile subscriptions
0%
20%
40%
60%
80%
100%
120%
NorthAmerica
WesternEurope
Japan APAC (exJapan)
CEE MEA Latam Global
2012E 2013E 2014E 2015E 2016E 2017E
Smar
tph
on
e p
ene
trat
ion
(as
% o
f ad
dre
ssab
lem
arke
t)
0%
20%
40%
60%
80%
100%
NorthAmerica
WesternEurope
Japan APAC (exJapan)
CEE MEA Latam Global
2012E 2013E 2014E 2015E 2016E 2017E
Sm
art
ph
on
esu
bs
as
% o
f to
tal
mo
bil
e s
ub
s b
ase
Source: Company data, Credit Suisse estimates Source: Company data, Credit Suisse estimates
Replacement rates will trend down but expecting only gradual declines. Given our view
that bulk of the volume growth in smartphone market going forward will be driven by
emerging markets, we acknowledge that replacement rates are likely to trend down.
However, with smartphones still operating at the higher-end of the market (vs. the overall
mobile industry), we assume that replacement rates in smartphones will continue to be
higher than overall handset market. As such, we assume an average replacement rate of
38% for the global smartphone market over 2013-2017, which remains above the global
replacement rate of 27% we forecast for the overall handset industry. Looking at our
regional replacement forecasts as demonstrated in Exhibit 17, we expect smartphone
replacement levels in North America to continue to remain highest amongst all regions
with an average of 55% in the long term.
Exhibit 17: Smartphone replacement rate by region Replacement rate measured as % of previous year’s smartphone subscriber base
Replacement rate (%) 2008 2009 2010 2011 2012E 2013E 2014E 2015E 2016E 2017E
NA 83% 69% 67% 64% 55% 55% 55% 55% 55% 55%
Latam 33% 33% 35% 36% 32% 32% 32% 32% 32% 32%
WE 43% 42% 44% 39% 40% 40% 40% 40% 40% 40%
APAC 29% 25% 26% 32% 35% 35% 36% 36% 35% 34%
Japan 44% 37% 37% 38% 38% 38% 34% 32% 29% 28%
MEA 37% 28% 32% 33% 34% 33% 33% 33% 33% 33%
CEE 33% 29% 34% 34% 36% 35% 34% 35% 35% 35%
Global 43% 39% 41% 41% 40% 39% 38% 38% 37% 36%
Source: Company data, Credit Suisse estimates

0
7 J
an
ua
ry 2
01
3
Ha
nd
se
t Ind
us
try 2
01
3 O
utlo
ok
21
Exhibit 18: We expect smartphone volumes to grow 36%/25% yoy in 2013/2014 driving CAGR unit growth of nearly 20% over 2012-2017 in millions, unless otherwise stated
Smartphone model summary 2008A 2009A 2010A 2011A 2012E 2013E 2014E 2015E 2016E 2017E CAGR 12-15 CAGR 12-17
Global mobile subscriptions (mn) 3,866 4,498 5,157 5,747 6,226 6,639 6,999 7,331 7,670 8,007 6% 5%
Global new subscriptions (mn) 616 632 660 590 479 413 360 332 339 337
Global mobile unit sell-in shipments (mn) 1,307 1,368 1,652 1,852 1,975 2,086 2,149 2,208 2,272 2,333 4% 3%
Global smartphone subscribers (mn) 242 321 490 763 1,178 1,693 2,267 2,841 3,373 3,892 34% 27%
as % of total mobile subscribers 6% 7% 9% 13% 19% 26% 32% 39% 44% 49%
Global smartphone addressable market (in mn by 2017) 4,945 4,945 4,945 4,945 4,945 4,945 4,945 4,945 4,945 4,945
Smartphone Effective Penetration (subs / addressable market) 5% 6% 10% 15% 24% 34% 46% 57% 68% 79%
Net smartphone adds (mn) 63 79 169 273 415 515 574 574 532 519 11% 5%
as % of total smartphone units 45% 46% 56% 58% 58% 53% 47% 40% 34% 30%
Replacements units (mn) 76 93 130 199 302 460 645 851 1,044 1,218 41% 32%
as % of last year's smartphone subs 43% 39% 41% 41% 40% 39% 38% 38% 37% 36%
as % of total smartphone units 55% 54% 44% 42% 42% 47% 53% 60% 66% 70%
Global smartphone units (mn) 139 172 299 473 716 976 1,219 1,425 1,577 1,737 26% 19%
% change yoy 14% 24% 73% 58% 51% 36% 25% 17% 11% 10%
as % of mobile shipments 11% 13% 18% 26% 36% 47% 57% 65% 69% 74%
Smartphone ASPs ($) 320 332 324 331 307 286 258 232 209 188 -9% -9%
% change yoy 4% -2% 2% -7% -7% -10% -10% -10% -10%
Global smartphone revenues ($ mn) 44,603 57,175 96,880 156,558 219,645 279,185 313,854 330,274 328,952 326,071 15% 8%
% change yoy 12% 28% 69% 62% 40% 27% 12% 5% 0% -1%
% of global handset market 26% 31% 44% 58% 71% 81% 88% 92% 94% 96%
1) Smartphone penetration still low at 24%. Given an installed base of some 1.18bn smartphone subscribers we estimate at the end of 2012 andour long-term smartphone addressable market forecast of around 4.95bn, the effective penetration at the end of 2012 is still low at 24%. Based onpenetration gains driven by a falling TCO, we believe that smartphone adoption will gradually rise towards 80% over the next few years.
2) Slight moderation in volume growth but only after 2014. Driven by increasing affordability, smartphones will continue to see strong volumegrowth in 2012 (we estimate volumes to be up 51% yoy) resulting in revenue growth of 40% yoy as average ASPs decline only 7% in spite ofgrowth in low end of the market helped by mix of higher ASP smartphones. We expect to see strong growth in 2013/2014 where we expectvolumes to grow 36%/25% yoy reaching 976mn/1.22bn units respectively before seeing any moderation in volume growth.
3) Still looking for double digit growth in outer years. We believe smartphones remain one of the most attractive secular trends in technology, withvolumes set to grow at a CAGR of 19% over the period 2012-2017. Even with some moderation in growth in outer years, we still expect thesmartphone market to see double digit volume growth over 2015-2017, eventually reaching annual shipments of 1.74bn units in 2017.
Smartphone volumes to grow at around 20% CAGR longer term
Source: Gartner, Credit Suisse estimates
1
2
3
Source: Gartner, Company data, Credit Suisse estimates

0
7 J
an
ua
ry 2
01
3
Ha
nd
se
t Ind
us
try 2
01
3 O
utlo
ok
22
Exhibit 19: Emerging Markets to account for over 75% of global smartphone volumes long term, up from 47%/60% in 2011/2012 respectively in ‘000s, unless otherwise stated
1) Developed markets to grow 8% long-term.
Developed markets currently account for 40% of
the global smartphone volumes with NA and WE
representing 17% and 16% respectively. With
strong growth coming from EMs, we estimate that
the contribution of developed markets may fall to
less than 25% of global volumes over the next few
years. We expect around 8% volume CAGR growth
out of developed markets through 2017.
2) Strong growth in EMs over the next 3 years.
Driven by increasing affordability and falling TCO,
we believe that smartphone volumes in EMs could
grow as much as 51%/33%/21% over the next 3
years, following two successive years of 90%+
volume growth. This would mean that EMs could
account for 75% of the global demand long term,
up from 47%/60% in 2011/2012.
3) China to account for 28% of incremental
volumes over 2012-2017. We expect
smartphone market in China to grow from 78mn
units in 2011 (16% of total volumes) to 487mn
units by 2017 (28% of volumes). This implies that
China alone as a region will see an incremental
290mn smartphone units over 2012-2017, which
is around 28% of our estimate for volume increase
at the global level.
Smartphone Shipments ('000) 2010 2011 2012E 2013E 2014E 2015E 2016E 2017E CAGR 12-17E
Developed Markets
North America 71,986 107,267 120,829 135,686 149,168 161,396 172,038 180,403 8.3%
% change 58% 49% 13% 12% 10% 8% 7% 5%
% of global market 24% 23% 17% 14% 12% 11% 11% 10%
Western Europe 86,185 96,963 113,989 132,557 145,682 156,521 164,631 170,419 8.4%
% change 89% 13% 18% 16% 10% 7% 5% 4%
% of global market 29% 21% 16% 14% 12% 11% 10% 10%
Japan 17,927 25,004 32,242 35,724 37,767 39,700 41,405 42,873 5.9%
% change 3% 39% 29% 11% 6% 5% 4% 4%
% of global market 6% 5% 5% 4% 3% 3% 3% 2%
Korea 7,146 20,409 20,994 23,994 25,961 26,426 27,057 28,397 6.2%
% change 186% 3% 14% 8% 2% 2% 5%
% of global market 2% 4% 3% 2% 2% 2% 2% 2%
Total Developed Markets (A) 183,244 249,643 288,054 327,961 358,578 384,044 405,131 422,092 7.9%
% change 69% 36% 15% 14% 9% 7% 5% 4%
% of global market 61% 53% 40% 34% 29% 27% 26% 24%
Emerging Markets
China 27,808 77,703 196,460 288,413 363,611 421,249 446,810 487,064 19.9%
% change 179% 153% 47% 26% 16% 6% 9%
% of global market 9% 16% 27% 30% 30% 30% 28% 28%
India 9,036 13,139 20,726 40,590 64,910 102,865 133,414 160,559 50.6%
% change 45% 58% 96% 60% 58% 30% 20%
% of global market 3% 3% 3% 4% 5% 7% 8% 9%
Rest of Asia Pacific 29,459 48,683 72,103 103,800 129,354 148,878 169,279 192,473 21.7%
% change 65% 48% 44% 25% 15% 14% 14%
% of global market 10% 10% 10% 11% 11% 10% 11% 11%
Brazil 5,156 9,350 17,776 27,230 46,713 53,096 57,240 65,502 29.8%
% change 81% 90% 53% 72% 14% 8% 14%
% of global market 2% 2% 2% 3% 4% 4% 4% 4%
Mexico 3,421 9,347 15,255 22,427 24,658 25,266 25,392 25,595 10.9%
% change 173% 63% 47% 10% 2% 0% 1%
% of global market 1% 2% 2% 2% 2% 2% 2% 1%
Rest of Latin America 9,001 15,046 24,101 37,540 46,156 55,948 66,231 73,782 25.1%
% change 67% 60% 56% 23% 21% 18% 11%
% of global market 3% 3% 3% 4% 4% 4% 4% 4%
Russia 3,654 8,349 15,827 21,050 24,808 30,217 34,765 38,079 19.2%
% change 129% 90% 33% 18% 22% 15% 10%
% of global market 1% 2% 2% 2% 2% 2% 2% 2%
Rest of Central and Eastern Europe 9,454 11,683 19,933 28,969 35,803 43,134 50,956 59,050 24.3%
% change 24% 71% 45% 24% 20% 18% 16%
% of global market 3% 2% 3% 3% 3% 3% 3% 3%
Middle East and Africa 18,615 29,948 46,047 77,555 123,939 160,060 187,508 212,379 35.8%
% change 61% 54% 68% 60% 29% 17% 13%
% of global market 6% 6% 6% 8% 10% 11% 12% 12%
Total Emerging Markets (B) 115,603 223,248 428,229 647,573 859,951 1,040,712 1,171,595 1,314,482 25.1%
% change 81% 93% 92% 51% 33% 21% 13% 12%
% of global market 39% 47% 60% 66% 71% 73% 74% 76%
Global Smartphones (A+B) 298,847 472,891 716,283 975,534 1,218,529 1,424,756 1,576,727 1,736,574 19.4%
% change 73% 58% 51% 36% 25% 17% 11% 10%
1
2
3
Source: Gartner, Company data, Credit Suisse estimates

07 January 2013
Handset Industry 2013 Outlook 23
Price point work – barbell develops While we acknowledge strong volume and revenue growth potential in the smartphone
market, we would equally note that all units are clearly not equal. For example, where as a
$100 smartphone from Android may offer some smart functionality and access to data, the
impact and value a consumer ascribes to it compared with say an Apple iPhone or
Samsung Galaxy SIII is remarkably different. Furthermore, the competitiveness within
each segment and profitability varies widely. As part of the update to our handset
estimates, we have updated our proprietary price point analysis and arrive at the following
key conclusions:
A barbell develops in the smartphone market as the mid end shrinks. We believe that the
smartphone market at $400+ ASP will grow over 4x in volume terms over 2010 to 2013
reaching nearly 400mn units by 2013, before seeing some moderation in growth and
building to 440mn long term. This combined with our view around volume growth in <$200
ASP market (driven by white-label vendors in China/India) means that smartphone
volumes in the $200 to $400 ASP range will only grow from ~300mn units in 2012 to
~400mn units by 2015. As percentage of total smartphones, we expect this to decline from
40% to ~25% over this period. This continued shift towards high-end now combined with
move towards low-end means that a number of branded OEMs including RIM, Nokia, LG,
Sony Mobile may continue to struggle given stiff competition in the high-end from Apple
and Samsung driven by better smartphone offering, and then aggressive pricing from
white-label vendors in the low-end.
Exhibit 20: Smartphone share shift towards the high-end Smartphone market volumes broken down by price point, and also as % of mix
Price band 2010 2011 2012E 2013E 2014E 2015E 2010 2011 2012E 2013E 2014E 2015E
<= $100 7 5 7 21 57 146 2% 1% 1% 2% 5% 10%
$100 - $200 74 82 129 221 378 460 25% 17% 18% 23% 31% 32%
$200 - $300 74 112 179 213 240 256 25% 24% 25% 22% 20% 18%
$300 - $400 49 84 104 122 133 126 16% 18% 14% 13% 11% 9%
$400+ 96 190 297 397 410 437 32% 40% 42% 41% 34% 31%
$400 - $500 43 71 102 138 160 187 14% 15% 14% 14% 13% 13%
$500+ 53 119 195 259 250 249 18% 25% 27% 27% 21% 18%
Total 299 473 716 976 1,219 1,425 100% 100% 100% 100% 100% 100%
Source: Company data, Credit Suisse estimates
Apple/Samsung are driving the high-end to unprecedented levels… As we have seen in
the past few iPhone launches, a successful device combined with increased levels of
global carrier support results in growing the high-end of the mobile phone market. Further,
over the past 18 months, Samsung has had a major impact on the high end of smartphone
market. Indeed, we note it has already crossed 30mn unit mark for Galaxy SIII in the first
week of Nov 2012 in the first five months of device launch, while also shipping over 3mn
units for Note II device in just over a month (as of Nov 2012). We would argue that
smartphone growth and more specifically Apple and now Samsung are increasingly
changing economics and characteristics for the mobile handset, carrier and consumer
electronics markets.
…high end cannibalizing several industries at the same time. What is surprising is that
industry growth has accelerated over the last couple of years. We believe that the
explanation rests in multiple factors, but essentially that smartphones are simultaneously
capturing value from multiple other industries especially at the high-end. In fact, we
estimate that the high-end of the smartphone market (devices at ASP of >$400) is now
close to $160bn market in revenue terms (25% of consumer electronics spend), over 5x
higher than the size in 2009 (up from 7% of CE spend) making it the largest CE category
globally, and we expect this to increase to 30% of total CE spend by 2015.

07 January 2013
Handset Industry 2013 Outlook 24
Low-end device availability improving more push even from branded OEMs. Out of around
425 smartphone models from tier I branded handset vendors which our database tracks,
nearly 75 are now available at a price point of $150 or less, which shows that smartphones
are already being offered at increasingly attractive price points. While the smartphone
segment arguably has always been competitive, we believe with an aggressive push from
new low cost providers such as Huawei and ZTE, there is a more meaningful desire to
deliver lower end products. Similarly, in an effort to drive Windows Phone adoption, we
see branded vendors such as Nokia also looking to offer smartphones at attractive price
points, although pricing from these branded OEMs are still much higher than local vendors
in China and India.
Reference design market is enabling smartphones at the low end. Qualcomm was also not
actively involved in offering reference designs to local vendors in a big way until end of
2011, which meant that local handset OEMs were not able to offer quality devices in the
low-end of the smartphone market. With improvements in its QRD portfolio (7x27A – first
1GHz single core chip launched in Q411, followed by 8x25 dual core chip introduced in
Q212), Qualcomm has been able to fuel the low-end of the smartphone market in China
and India. Furthermore, smartphone baseband volumes for MediaTek and Spreadtrum
together may grow from 10mn units in 2011 to 139mn/287mn units in 2012/2013. In the
past, both these vendors were struggling to transition from 2.5G baseband chips towards
3G/smartphone chips due to technology and performance issues, something which seems
to have been addressed. This has resulted in aggressive plans from both these companies
to target local handset OEMs in China.
A specific opportunity in China. From a regional perspective, we see robust growth for
smartphone market in China, which we think will account for 30% of global units by 2015.
Specifically, we estimate that 32% of incremental volumes globally over the next 3 years
will be driven by China. One of the issues leading to the slower uptake of 3G/smartphone
services in China in the past had been related to limited availability of devices across all
standards (TD-SCDMA, WCDMA and CDMA EVDO), but one of the common themes
emerging out of all three carriers in China seems to be an increased level of push toward
bringing down smartphone price points.
High end going higher driven by Apple and Samsung
Exhibit 21: Samsung's $400+ portfolio gaining lot of traction driven by SIII and Note II Units in mn, unless otherwise stated
0
5
10
15
20
25
30
35
40
Galaxy S Galaxy S II Galaxy S III Galaxy Note I Galaxy Note II
Un
its (
mn
)
Source: Company data, Credit Suisse estimates
New range of Galaxy devices are selling in volumes. Reviews for Galaxy SIII and Note II
are amongst the most positive seen for any of the Samsung smartphones in the past.

07 January 2013
Handset Industry 2013 Outlook 25
Distribution for these device is also strong, as Galaxy SIII is shipping with over 290
carriers globally compared to 140 carriers for Galaxy SII. Samsung recently noted that it
has already crossed 30mn unit mark for Galaxy SIII in the first week of Nov 2012 in the
first five months of device launch. In addition, it has shipped over 3mn units for Note II
device in just over a month of shipping (as of Nov 2012).
Exhibit 22: iPhone growth should accelerate with the recent launch of new iPhone 5 Units in millions, unless otherwise stated
0
10
20
30
40
50
F2Q
10
F3Q
10
F4Q
10
F1Q
11
F2Q
11
F3Q
11
F4Q
11
F1Q
12
F2Q
12
F3Q
12
F4Q
12
F1Q
13
E
F2Q
13
E
F3Q
13
E
F4Q
13
E
iPh
on
e u
nit
s (
mn
)
Source: Company data, Credit Suisse estimates
Apple remains the leader in the high end market. As with any Apple product cycle, we
believe the key selling period for iPhone 5 with likely be calendar Q412 and Q113. As we
have seen in the past few Apple launches, a successful device combined with increased
levels of global carrier support results in growing the high-end of the mobile phone market.
Exhibit 23: $400+ smartphone market being dominated by Apple and Samsung Market share of different vendors in the $400+ ASP smartphone market over time
47% 46% 44% 45%
3%
22%40% 43%
11%
9%
3%4%
0%
20%
40%
60%
80%
100%
2010 2011 2012E 2013E
Others
RIMM
Nokia
LG
Sony
Motorola Mobility
HTC
Samsung
Apple
Sm
art
ph
on
e m
ark
et
sh
are
in
4
00
+ A
SP
seg
me
nt
(%)
Source: Company data, Credit Suisse estimates
A two player high-end market. In the above $400 smartphone market, Apple has enjoyed a
market share of around 45% over the last 2-3 years, and we expect this trend to continue
with the recent launch of iPhone 5. However, what is worth noting here is that Samsung
has managed to grow its market share in the high end to as high as 40% as per our

07 January 2013
Handset Industry 2013 Outlook 26
estimates in 2012, and expected to rise further to 45% in 2013. This growth in the high end
for both Apple and Samsung has resulted in several other vendors being squeezed out of
the market such as Nokia, RIMM and HTC, as can be seen in Exhibit 23.
High end in the smartphone market to continue to expand in 2013 before seeing any
slowdown. Even if the rate of smartphone adoption is surprising in terms of market growth,
investors could argue that this is perhaps just another product cycle. We, on the other
hand, would argue that smartphone growth and more specifically Apple and now Samsung
are increasingly changing economics and characteristics for the mobile handset, carrier,
and consumer electronics markets. Indeed, based upon our expectations for iPhone 5 and
Galaxy SIII effect, we now believe that the above $400 smartphone market could be close
to 300mn in 2012 and rise further to 400mn in 2013, which implies over 4x increase from
volume levels seen in 2010.
Exhibit 24: Smartphone share shift towards the high-end Smartphone market volumes broken down by price point, and also as % of mix
Price band 2010 2011 2012E 2013E 2014E 2015E 2010 2011 2012E 2013E 2014E 2015E
<= $100 7 5 7 21 57 146 2% 1% 1% 2% 5% 10%
$100 - $200 74 82 129 221 378 460 25% 17% 18% 23% 31% 32%
$200 - $300 74 112 179 213 240 256 25% 24% 25% 22% 20% 18%
$300 - $400 49 84 104 122 133 126 16% 18% 14% 13% 11% 9%
$400+ 96 190 297 397 410 437 32% 40% 42% 41% 34% 31%
$400 - $500 43 71 102 138 160 187 14% 15% 14% 14% 13% 13%
$500+ 53 119 195 259 250 249 18% 25% 27% 27% 21% 18%
Total 299 473 716 976 1,219 1,425 100% 100% 100% 100% 100% 100%
Source: Company data, Credit Suisse estimates
Significant growth being seen in the low end
Significant low-end smartphone product launches from branded OEMs. A glance at our
smartphone portfolio database in Exhibit 25 shows that out of around 425 smartphone
models from tier I branded handset vendors which our database tracks, nearly 75 are now
available at a price point of $150 or less. Out of these 74 models, we note that some 12
models are less than six months old, which shows that smartphones are already being
offered at increasingly attractive price points.
Exhibit 25: Our portfolio database shows nearly 75 smartphone devices selling at factory ASP of <$150 Detailed feature set of lower end smartphones being sold from different manufacturers
Single Dual 16M 256K 65K NA <= 2GB 4GB 8GB > 8GB
Nokia 6 26 23% 3.5 3.1 700 6 0 5 3 6 6 0 0 0 5 0 1 0 127
RIMM 0 13 0% 0 0 0 0 0 0 0 0 0 0 0 0 0 0 0 0 0
HTC 5 54 9% 4.3 3.0 666 5 0 5 4 5 0 5 0 0 5 0 0 0 94
Apple 0 4 0% 0 0 0 0 0 0 0 0 0 0 0 0 0 0 0 0 0
HP/Palm 1 3 33% 5.0 2.6 800 1 0 1 1 1 0 1 0 0 0 0 1 0 90
Motorola 3 54 6% 3.8 3.0 733 3 0 3 3 3 1 2 0 0 3 0 0 0 111
Samsung 17 90 19% 2.9 3.1 774 17 0 17 15 17 6 11 0 3 12 2 0 0 119
Sony 3 34 9% 4.4 3.0 867 3 0 3 3 3 3 0 0 0 3 0 0 0 132
LG 10 52 19% 3.8 3.3 863 9 1 10 10 10 3 7 0 3 5 1 0 1 115
Acer 2 11 18% 4.1 3.4 800 2 0 2 2 2 1 1 0 0 1 1 0 0 119
Huawei 6 28 21% 3.3 3.1 651 6 0 6 6 6 2 4 0 3 3 0 0 0 105
ZTE 7 36 19% 3.8 3.6 720 6 1 7 6 6 1 5 1 2 3 2 0 0 113
Micromax 8 14 57% 3.0 3.4 788 8 0 8 8 8 2 5 1 1 7 0 0 0 98
Spice 6 7 86% 3.4 3.3 817 6 0 6 6 5 0 6 0 2 4 0 0 0 93
Total 74 426 17% 3.5 3.2 766 72 2 73 67 72 25 47 2 14 51 6 2 1 111
Camera
(MP)
Screen
(in)Vendor
# of models
(<$150 ASP)
# of total
models
% of
total
Touch
Screen Wi-Fi GPS
Processor
Speed (MHz)
Processor Type Colour Screen Factory
ASP ($)
Memory
1
1) Significant launches in the low-end of
smartphone market. Over the last 12-18 months, we have seen a number ofsmartphone launches targeted at the lowerend of the smartphone market. We havenearly 75 smartphone models priced atfactory ASP of <$150, which represents17% of their overall smartphone portfolio.The average ASP of these devices isaround $110.
2) Supporting strong set of features. Looking atspecifications of these devices, we would note:
Average screen size is 3.2”
Camera quality is 3.5MP
Processor speed (an area where low-end smartphonesused to lag in the past) stands at over 750MHz on anaverage
Around 1/3rd of these devices have 16M color screen
2
3) Memory is one area for further
improvement. Nearly 70% ofthese low-end smartphones stillhave less than 2GB of memorysupport, which is an area where weneed to see further improvement tohandle rising level of content storedon mobile devices.
3
Source: Company data, Credit Suisse research

0
7 J
an
ua
ry 2
01
3
Ha
nd
se
t Ind
us
try 2
01
3 O
utlo
ok
2
7
Exhibit 26: Both branded and non-branded OEMs have launched a range of smartphone terminals targeted at low end of the smartphone market Detailed specifications for smartphones being launched at lower end of the smartphone market from both branded and non-branded OEMs
Manufacturer Nokia Motorola Samsung LG Huawei ZTE Lenovo Micromax
Model Lumia 510 Defy Mini Galaxy Pocket Optimus L3 Ascend G300 Avail A60 A80
Image
Technology UMTS/GSM UMTS/GSM UMTS/GSM UMTS/GSM UMTS/GSM UMTS/GSM UMTS/GSM UMTS/GSM
Announced Oct-12 Jan-12 Feb-12 Jan-12 Feb-12 Oct-11 Jul-11 Aug-12
Shipping date Nov-12 Feb-12 Apr-12 Feb-12 May-12 Dec-11 Jul-11 Aug-12
Operating System WP7.5 Android Android Android Android Android Android Android
Application Processor 800MHz 600MHz 832MHz 800MHz 1GHz 600MHz 650MHz 800MHz
RAM 256MB 512MB NA 384MB 512MB 512MB 256MB 256MB
Memory 4GB 512MB 3GB 1GB 4GB 512MB 220MB 50MB
Pixels 480 x 800 320 x 480 240 x 320 240 x 320 480 x 800 320 x 480 320 x 480 480 x 800
Dimensions (w x h x d) (mm) 120.7 x 64.9 x 11.5 131.5x70.7x9.9 103.7 x 57.5 x 12 102.6 x 61.6 x 11.9 122.5 x 63 x 10.5 116 x 62 x 13 116 x 59.9 x 12.6 129.5 x 64 x 13.5
Weight (g) 129 107 97 110 140 127 135 110
Volume (cc) 81 92 72 75 81 93 88 112
Screen (inches) 4.0 3.2 2.8 3.2 4.0 3.5 3.5 3.8
Megapixel 5.0 3.2 2.0 3.2 5.0 5.0 2.0 5.0
Wi-Fi yes yes yes yes yes yes yes yes
GPS yes yes yes yes yes yes yes yes
Talk time (hrs) 8.5 10.0 5.7 10.0 5.0 5.0 6.0 7.0
Standby time (hrs) 653 504 500 600 350 225 200 288
Price (USD) 166 129 106 122 189 129 123 147
BRANDED OEMs
Chipset SC6820 MTK 6515 MTK 6515M MTK 6515 MTK 6575 MTK 6577 QCOM MSM 8255 MTK 6577
Model N9300 Mini i9300 Dex Nebula V11 Elysium Coolpad 7266 W3
Image
Technology GSM/EDGE GSM/EDGE GSM/EDGE GSM/EDGE UMTS/GSM UMTS/GSM UMTS/GSM UMTS/GSM
Operating System Android 2.3 Android 2.3 Android 2.3 Android 2.3 Android 4.0 Android 4.0 Android 4.0 Android 4.0
Application Processor 1GHz 800MHz 1GHz 1GHz 1GHz Dual Core 1GHz Dual Core 1GHz Dual Core 1GHz
RAM 256MB 256MB 256MB 256MB 512MB 512MB 512MB 1GB
Memory 256MB 256MB 256MB 256MB 512MB 4GB 4GB 4GB
Pixels 320 x 480 320 x 480 320 x 480 320 x 480 480 x 800 480 x 800 480 x 800 480 x 800
Dimensions (w x h x d) (mm) 116 x 61 x 10 127 x 68 x 10 115 x 61 x 11 110 x 60 x 13 120 x 65 x 10 126 x 65 x 11 124 x 65 x 10.7 125 x 65 x 13
Weight (g) 100 NA 128 115 90 120 125 150
Volume (cc) 71 86 77 86 78 90 86 106
Screen (inches) 3.5 3.5 3.5 3.5 3.5 4.3 4.0 4.5
Megapixel 3.0 3.2 8.0 0.3 5.0 5.0 5.0 8.0
Wi-Fi yes yes yes yes yes yes yes yes
GPS no no no no no no yes yes
Dual SIM yes yes yes yes yes yes no yes
Talk time (hrs) 4.0 NA 3.0 4.0 4.0 6.0 6.0 3.0
Standby time (hrs) 72 NA 90 72 90 72 80 90
Wholesale Price (USD) 65 78 70 82 130 150 185 240
NON-BRANDED OEMs
Source: Company data, Credit Suisse research

07 January 2013
Handset Industry 2013 Outlook 28
Aggressive pricing from branded vendors. While the smartphone segment arguably has
always been competitive, we believe with an aggressive push from new low cost providers
such as Huawei and ZTE (covered by Credit Suisse analyst Yan Taw Boon), there is a
more meaningful desire to deliver lower end products. Similarly, in an effort to drive
Windows Phone adoption, we see branded vendors such as Nokia also looking to offer
smartphones at attractive price points, although we believe pricing from these branded
OEMs are still much higher than local vendors in China and India. For example, Nokia
recently launched an entry-level WP7.5 smartphone called Lumia 510, which is expected
to retail at $199 excluding taxes and subsidies.
Qualcomm already engaging with local vendors in China with its reference designs.
Although Taiwanese chipset vendors (MediaTek and Spreadtrum) have seen a lot of
traction with local handset vendors in China, up until 1H12, their success in 3G and
smartphone market had been limited. In addition, Qualcomm was also not actively
involved in offering reference designs to local vendors in a big way until end of 2011,
which meant that local handset OEMs were not able to offer quality devices in the low-end
of the smartphone market. With improvements in its QRD portfolio (7x27A – first 1GHz
single core chip launched in Q411, followed by 8x25 dual core chip introduced in Q212),
Qualcomm has been able to fuel the low-end of the smartphone market in China and India
with its reference design partnerships with a number of local vendors including Huawei,
ZTE, Lenovo, Oppo, Coolpad, Haier, BYD, TCL-Alcatel to name a few. In fact, Qualcomm
now has reference designs in over 100 smartphone devices with over 40 OEMs across 12
countries (Exhibit 27).
Exhibit 27: Qualcomm’s Reference Design (QRD) portfolio of smartphone chips
First 1GHz
Single Core
Q4’11
7x27ASingle Core
First High Volume
Q2’11 / Q3’11
MSM7x25
MSM7x27
Dual Core
Q2’12
8x25Dual Core
Quad Core
Q1’13
8x30Dual Kraits
MSM
8x25QQuad Core
40+ OEMs 100+ Launches 100+ in Design <60 days Launch Time-to-Market
Source: Company data, Credit Suisse research
MediaTek and Spreadtrum fuelling low-end smartphones in China. According to our
analyst Randy Abrams (who covers both MediaTek and Spreadtrum), smartphone
baseband volumes for these two vendors together may grow from 10mn units in 2011 to
nearly 150mn/335mn units in 2012/2013 (Exhibit 28). In the past, both these vendors were
struggling to transition from 2.5G baseband chips towards 3G/smartphone chips due to
technology and performance issues, something which seems to have been addressed.
This has resulted in aggressive plans from both these chipset vendors to target local
handset OEMs in China to fuel the low-end smartphone market. In fact, China Unicom’s
recently launched devices focused on mass market dual core smartphones from branded
Chinese vendors and saw an almost even split of designs based on MediaTek and
Qualcomm. Qualcomm secured wins from Hisense, KTouch/Tianyu, Coolpad, and Huawei
while MediaTek was designed into smartphones from Malata, Lenovo, TCL, and ZTE.

07 January 2013
Handset Industry 2013 Outlook 29
Even on quad core, MediaTek is trying to keep up pace with Qualcomm's release
schedule, targeting initial samples of its Quad Core Cortex A7 chipset (MT6588) also in
late 4Q12 with mass production in 1Q13 and supporting TD-SCDMA/HSPA+. For detailed
specification of quad core chips, please see Exhibit 29.
Exhibit 28: Smartphone baseband volumes at MTEK/SPRD in millions, unless otherwise stated
Exhibit 29: Quad core designs from QCOM and MTEK Specifications of quad core smartphone chip for China market
10 2138 47
10
116
243
02
1118
0
31
91
0
50
100
150
200
250
300
Q112 Q212 Q312 Q412E 2011 2012E 2013E
SpreadTrum MediaTek
Sm
art
ph
on
e b
aseb
an
d u
nit
s (
mn
)
MediaTek Qualcomm
MT6558 MSM 8225Q
Mass production 1Q13E 1Q13E
Baseband HSPA+ / TD-SCDMA HSPA+ / CDMA
CPU Core Quad-core ARM Cortex A7 Quad-core ARM Cortex A5
Clock Speed 1.X GHz 1.X GHz
Graphics PowerVR SGX544 Adreno 203
GPU Performance 1,600M Pix/s, 55M Tri/s 294M Pix/s, 49M Tri/s
Camera Support 13 MP 8 MP
Video Playback 1080p Full HD 780p
Process 28nm 28nm
Source: Company data, Credit Suisse estimates Source: Company data, Credit Suisse research
Mid-end of the smartphone market shrinking
As discussed above in detail, given the volume growth that we expect to see in both the
high and low-end of the smartphone market, it implies that the mid-end of the smartphone
market will continue to represent lesser proportion of total smartphone market. Here we
would make two observations:
Exhibit 30: Mid-end of smartphone market to represent only 25% of total units by 2015 Percentage of global smartphone volumes broken down by price point over time
0%
10%
20%
30%
40%
50%
60%
70%
80%
90%
100%
2010 2011 2012E 2013E 2014E 2015E
$500+
$400 - $500
$300 - $400
$200 - $300
$100 - $200
<= $100
Source: Company data, Credit Suisse estimates
$200 to $400 ASP smartphones to account for only around 25% of volumes by 2015. As
we note in above sections, we believe that the smartphone market at $400+ ASP will grow
over 4x in volume terms over 2010 to 2013 reaching nearly 400mn units by 2013, before
seeing some moderation in growth. This combined with our view around volume growth in
less than $200 ASP market (mainly driven by white-label vendors in China and India)
means that smartphone volumes in the $200 to $400 ASP range will only grow from
around 300mn units in 2012 to 400mn units by 2015. But more importantly, as percentage

07 January 2013
Handset Industry 2013 Outlook 30
of total smartphone volumes, we expect this to decline from 40% in 2012 to around 25%
over this period, as shown in Exhibit 30.
Implications for branded smartphone vendors. This continued shift towards high-end of the
smartphone market now combined with move towards low-end means that a number of
branded OEMs including RIM, Nokia, LG, Sony Mobile may continue to struggle given stiff
competition in the high-end from Apple and Samsung driven by better smartphone offering,
and then aggressive pricing from white-label vendors in the low-end.
Exhibit 31: Vendors like RIM, Nokia, LG and Sony have significant exposure to lower end of smartphone market
Smartphone volumes by price band 2010 2011 2012E 2013E 2014E 2015E CAGR 12-15E
<= $100 7 5 7 21 56 146 173%
$100 - $200 74 82 129 221 378 460 53%
$200 - $300 74 112 179 213 240 256 13%
$300 - $400 49 84 104 122 133 126 7%
$400+ 96 190 297 397 411 437 14%
$400 - $500 43 71 102 138 160 187 22%
$500+ 53 119 195 259 251 249 8%
Total (mn) 299 473 716 976 1,219 1,425 26%
Volumes breakdown by price band
<= $100 2% 1% 1% 2% 5% 10%
$100 - $200 25% 17% 18% 23% 31% 32%
$200 - $300 25% 24% 25% 22% 20% 18%
$300 - $400 16% 18% 14% 13% 11% 9%
$400+ 32% 40% 42% 41% 34% 31%
$400 - $500 14% 15% 14% 14% 13% 13%
$500+ 18% 25% 27% 27% 21% 18%
Total (%) 100% 100% 100% 100% 100% 100%
Smartphone volume exposure in 2012 (%) Apple Samsung Nokia RIM HTC LG MMI Sony
<= $100 0% 1% 2% 0% 0% 1% 1% 0%
$100 - $200 0% 14% 28% 6% 0% 19% 19% 4%
$200 - $300 0% 17% 37% 48% 30% 33% 33% 36%
$300 - $400 3% 11% 16% 34% 38% 25% 25% 25%
$400+ 97% 57% 17% 13% 32% 22% 22% 35%
$400 - $500 10% 27% 9% 10% 23% 18% 18% 21%
$500+ 87% 30% 8% 3% 8% 4% 4% 14%
Total 100% 100% 100% 100% 100% 100% 100% 100%
Source: Company data, Credit Suisse estimates
A specific growth opportunity within China
Specifically from a regional perspective, we see robust growth for smartphone market in
China, which we think will account for 30% of global units by 2015. Interestingly, we
estimate that 32% of incremental volumes globally over the next 3 years will be driven by
China as shown in Exhibit 32. There are several drivers at work here:
3G device availability has improved significantly. One of the issues leading to the slower
uptake of 3G services in China in the past had been related to limited availability of 3G
terminals across all standards (TD-SCDMA at China Mobile, WCDMA at China Unicom
and CDMA EVDO at China Telecom, all covered by Credit Suisse analyst Colin
McCallum). However, 3G terminal availability has seen significant improvements, which
was clearly evident from carriers’ commentary as mentioned below.
■ China Mobile has noted that device supply chain for TD-SCDMA technology continues
to mature. Here the carrier is focusing on bringing down price points for TD-SCDMA
handsets, and it had an offering of 60 different models of TD smartphones in March

07 January 2013
Handset Industry 2013 Outlook 31
2012. Total number of smartphone models offered by carrier was around 166 in Aug
2012, of which 126 devices were priced at around Rmb1,000.
■ China Unicom noted that it has already launched a series of Rmb1,000 smartphones
to accelerate WCDMA penetration.
■ China Telecom now has an offering of around 580 models for CDMA EVDO handsets,
compared to 300/500 models in 2010/2011, as it continues to focus on adoption of 3G
handsets. Of these, 240 devices are smartphones. In fact, it sold 16mn smartphone
units in 1H12, which was up 2x yoy.
Exhibit 32: We think China will account for >30% of volume growth in smartphones in millions, unless otherwise stated
∆ (2012 to 2015)
Smartphone units (mn) 2010 2011 2012E 2013E 2014E 2015E Units %
NA 72 107 121 136 149 161 41 6%
WE 86 97 114 133 146 157 43 6%
Japan 18 25 32 36 38 40 7 1%
Korea 7 20 21 24 26 26 5 1%
China 28 78 196 288 364 421 225 32%
India 9 13 21 41 65 103 82 12%
Rest of APAC 29 49 72 104 129 149 77 11%
Brazil 5 9 18 27 47 53 35 5%
Mexico 3 9 15 22 25 25 10 1%
Rest of Latam 9 15 24 38 46 56 32 4%
Russia 4 8 16 21 25 30 14 2%
Rest of CEE 9 12 20 29 36 43 23 3%
MEA 19 30 46 78 124 160 114 16%
Total 299 473 716 976 1,219 1,425 708 100%
Source: Gartner, Company data, Credit Suisse estimates
Increased push towards lower end smartphones. One of the common themes emerging
out of all three carriers in China is the increased push toward bringing down smartphone
price points. During 2011, the focus had been on launching smartphones priced at around
Rmb1,000 with a number of product introductions in that price range. For 2012, the target
seems to be to further price point reductions.
■ China Mobile noted that out of 166 smartphone models it offered during mid-2012, 126
of them are being sold at a price point of around Rmb1,000 (or US$150), with the
company already working towards launching smartphones priced at Rmb500.
■ China Unicom highlighted that after having successfully launched a series of
Rmb1,000 smartphones in 2011, it has been working on to introduce smartphones
priced at Rmb700 (US$ 100) or below during 2012.
■ China Telecom had an offering of around 240 models for smartphones in mid-2012,
compared to only 100/200 models at the end of 2010/2011. Further, the carrier sold
16mn smartphone devices in 1H12 compared to 17mn in 2011 (up 2x yoy).
Simultaneous cannibalization of several industries
What is surprising is that industry growth has accelerated over the last couple of years
when perceptions would be that the mobile phone industry has reached level of maturity
with close to 2.0bn unit shipments per year and 6.2bn mobile subscriptions. We believe
that the explanation rests in multiple factors, but essentially that smartphones are
simultaneously capturing value from multiple other industries especially at the high-end. In
fact, as shown in Exhibit 33, high end of the smartphone market (devices at ASP of over
$400) is now close to $160bn market in revenue terms, over 5x higher than the size in
2009.

07 January 2013
Handset Industry 2013 Outlook 32
■ Wireless carriers. We have discussed the economics of smartphone growth in an
earlier section in the note, but it would hard to argue that some value has not shifted
from wireless carriers whose margins have seen pressure at a time when mobile
handset industry profits have shifted upwards, even if causation cannot be proved.
■ Portable Media Players. The portable media player market is dominated by the iPod,
however it is hard to see this standalone segment not being impacted especially with
the sheer range of music stores now available for access via smartphones (especially
with DRM-free music). We assume that 100% of MP3 player market can be potentially
cannibalized by smartphones in a best case scenario.
■ Personal Navigation Devices. Here we believe that a large portion of the PND market
can be potentially cannibalized by smartphones in the long term; especially with the
quality of GPS and mapping technologies on the latest smartphones being of
comparable quality.
■ Digital Still Cameras. We assume that a smartphone with a robust enough camera
(both in terms of pixel quality and memory capacity) will be able to successfully
replace a significant percentage of point-and-shoot digital still cameras over time. Here
we would note that majority of all DSCs with camera quality less than 15MP can be
potentially cannibalized by smartphones.
■ Portable Gaming Devices. With the onset of applications stores, and a particular focus
on leveraging smartphones as gaming platforms, we believe much of the portable
gaming market can be cannibalized.
■ Mid-end Feature Phones. We assume mid-end of the handset market (which we
usually refer to as feature phones selling at a price point of $100-200) have already
seen significant level of cannibalization by smartphones, a trend which will continue
over the next few years.

0
7 J
an
ua
ry 2
01
3
Ha
nd
se
t Ind
us
try 2
01
3 O
utlo
ok
33
Exhibit 33: Mobile Compute to drive and dominate consumer electronic market – high-end smartphone market is now the largest portion of the CE market
1%6% 7% 10%
17%25%
30% 30% 30%
6% 8% 8%4%
6%
9%
9%
9%
10% 13% 13%
2%
6%
8%
10%
13%16%
22% 20% 21% 22%23%
22%
20%
18%
18%
18%18%
5% 5%5%
6%5%
5%
5%
4%
3%
3%2%
27% 26% 22%22%
23%
19%
15%
11%
7%4%
2%
19% 20% 23% 23%21%
22%19%
16%14% 13% 12%
6% 6% 5% 5%4%
4%3% 3% 3% 3% 2%14% 15% 14% 13% 11%
9% 7% 6% 6% 5% 5%
0%
10%
20%
30%
40%
50%
60%
70%
80%
90%
100%
2005 2006 2007 2008 2009 2010 2011 2012E 2013E 2014E 2015E
Others
Camera
TV
Feature Phones
Basic Phones
PC (Consumer)
Tablets
Low & Mid-endsmartphone
High-endsmartphone
Co
nsu
mer
sp
en
d b
reakd
ow
nb
y s
eg
men
t
4 26 30 51103
159209 220 231
21 29 36 19 2746
54
61
7094 99
10
34
51
73
98123
74 7791 101 102
117
116
119
129
134
135
0
100
200
300
400
500
600
700
800
900
2005 2006 2007 2008 2009 2010 2011 2012E 2013E 2014E 2015E
Others
Camera
TV
Feature Phones
Basic Phones
PC (Consumer)
Tablets
Low & Mid-endsmartphone
High-endsmartphone
Co
ns
um
er
sp
en
d i
n U
S$ b
n
Global consumer electronic consumption breakdown (as % of total)
Global consumer electronic consumption (in $bn) 1) Consumer Electronics growth decent. The globalconsumer electronic industry is a $645bn market andachieved around 10% CAGR from 2005 to 2012.Going forward, we forecast the market to maintain a7% growth rate and reach $760bn in 2015.
2) Mobile computing (smartphones & tablets)growth outpaces the CE industry. Smartphonesand tablets together are expected to have a CAGR of68% during 09-12E, which is significantly higherthan the rest of industry (which declined 2% duringthe same period). We expect this category to be theprimary driver of the CE industry and reach close to$450bn by 2015.
3) Within CE, high-end smartphones will be thebiggest category in 2012. The high-endsmartphone market will become a $160bn market in2012 from $4bn in 2007. This explosive growthtrajectory will make the high-end smartphone thelargest category within the CE industry. Goingforward, we forecast the market size to expand to$230bn in 2015 driven by the strength of Apple andSamsung’s product portfolios. The two companiestogether will get ~90% of market share in the $400+ASP market.
4) Mobile computing cannibalizes other markets.With considerable advancement in hardwarecomponents, software integration, and eco-systemdevelopment, we believe smartphones and tabletsare the future of computing and will significantlycannibalize other markets such as PC, TV, camera,and DVD, etc. Going forward, we expectsmartphones and tablets together will account fornearly 60% of CE industry in 2015 compared to32% in 2011.
8% CAGR
Source: IDC, Gartner, Credit Suisse estimates

07 January 2013
Handset Industry 2013 Outlook 34
LTE at an inflection point When looking at the handset market by technology, we observe that there are several
drivers at play now which will drive not only strong adoption of LTE devices but also ramp
up uptake of 3G devices driven by increased device affordability.
LTE volumes at an inflection point. We believe that the significant leap in network speeds
on LTE will push use of new applications which in turn could drive incremental growth in
the smartphone market, as we expect LTE handsets to grow from 85mn in 2012 to around
450mn in 2015, accounting for 20% of global handset market (Exhibit 35). This strong
growth is being driven by a confluence of factors. First, we see a rapid expansion of
network coverage (globally to increase from 5% in 2011 to around 7% in mid-2012 (455mn
people) and then to 50% by 2017). Second, we see LTE handset availability improving
and specifically Apple and Samsung being key enablers of this in 2013. Third, we believe
that faster speeds for LTE (over 300Mbps downlink and 86Mbps uplink) are likely to create
consumer demand in many ways that other networking technologies did not.
WCDMA low-end growth is ramping. We believe that 3G handset market will continue to
see robust growth driven by emerging markets. This will be driven by ongoing expansion
in the coverage of WCDMA, which we see rising from 45% of population in 2011 to 85%
by 2017, and lower priced devices as chipset availability and quality improves especially
given recent success of Taiwanese chipset vendors.
■ WCDMA/HSPA to account for over 40% of handset market by 2015. In 2012, we
estimate that there would be close to 550mn WCDMA/HSPA enabled handsets
shipped globally, accounting for 27% of global handset volumes. Although we expect a
significant shift in the higher end of 3G market towards LTE especially in developed
markets (US, Japan, Korea and WE), we still believe there will be significant growth in
3G adoption in emerging markets. As such, we assume WCDMA handsets to
represent slightly over 40% of total market by 2015.
■ 3G device availability much improved driven by 3G chipset portfolio at MTEK/SPRD.
In addition to Qualcomm, which remains focused on reference designs for the Chinese
white-label handset manufacturers, we would note that both MediaTek and
Spreadtrum have already made a lot of strides when it comes to improving the quality
of their 3G chipsets, while RDA also has WCDMA chip on its roadmap for 2013. This
improvement in 3G chipset offering will continue to drive significant technology shift
especially at white-label vendors in China as they move from GSM/EDGE based
phones to 3G devices.
Exhibit 34: LTE to account for 4% of handsets in 2012… Breakdown of handset shipments by technology (2012)
Exhibit 35: …but expect this to increase to ~20% by 2015 Breakdown of handset shipments by technology (2017)
iDEN0%
CDMA10%
GSM / GPRS / EDGE55%
WCDMA / HSPA28%
TD-SCDMA3%
LTE4%
iDEN0%
CDMA7%
GSM / GPRS / EDGE26%
WCDMA / HSPA42%
TD-SCDMA4%
LTE21%
Source: Company data, Credit Suisse estimates Source: Company data, Credit Suisse estimates

0
7 J
an
ua
ry 2
01
3
Ha
nd
se
t Ind
ustry
20
13
Outlo
ok
35
Exhibit 36: Global handset market by technology: LTE handsets to rise from 85mn in 2012 (4% of all handsets) to over 450mn by 2015 (~20% of volumes) in millions, unless otherwise stated Handset units (mn) 2010 2011 2012E 2013E 2014E 2015E 2016E 2017E CAGR 12-17E
Analog/other 0 0 0 0 0 0 0 0 NM
iDEN 15 11 4 2 1 1 0 0 -47.6%
CDMA 218 216 198 183 173 154 140 113 -10.7%
TDMA 0 0 0 0 0 0 0 0 NM
GSM/GPRS/EDGE 1,027 1,092 1,069 942 797 575 403 293 -22.8%
PDC 0 0 0 0 0 0 0 0 NM
WCDMA/HSDPA 342 457 537 623 771 933 1,033 1,044 14.2%
TD-SCDMA 15 36 61 98 96 80 82 84 6.7%
LTE 0 7 86 219 298 460 604 789 55.8%
Total 1,617 1,819 1,955 2,067 2,137 2,203 2,262 2,323 3.5%
CDMA handsets (mn) 2010 2011 2012E 2013E 2014E 2015E 2016E 2017E CAGR 12-17E
Asia Pacific 108 110 117 120 122 109 104 80 -7.3%
North America 93 91 70 56 45 41 31 28 -16.6%
Western Europe 0 0 0 0 0 0 0 0 NM
Africa 4 4 4 3 3 2 2 1 -25.8%
CEE 3 3 2 1 1 1 1 1 -10.5%
Latin America 8 6 2 2 1 1 1 1 -17.4%
Middle East 2 2 2 1 1 1 1 1 -15.7%
Total CDMA handsets 218 216 198 183 173 154 140 113 -10.7%
% of the handset market 13% 12% 10% 9% 8% 7% 6% 5%
Others (inventory addition/depletion and modems) 20 19 9 6 2 (1) (1) (2)
Total CDMA Devices 238 235 207 189 176 153 139 111 -11.8%
WCDMA/HSDPA handsets 2010 2011 2012E 2013E 2014E 2015E 2016E 2017E CAGR 12-17E
Asia Pacific 101 143 181 254 342 478 518 549 24.8%
North America 57 76 61 49 61 57 72 62 0.4%
Western Europe 107 125 132 117 120 114 99 82 -8.9%
Africa 20 30 40 52 70 86 113 116 23.9%
CEE 33 42 51 59 68 73 81 84 10.5%
Latin America 11 24 43 56 68 80 104 106 19.8%
Middle East 14 17 30 35 42 46 45 45 8.7%
Total WCDMA/HSDPA handsets 342 457 537 623 771 933 1,033 1,044 14.2%
% of the handset market 21% 25% 27% 30% 36% 42% 46% 45%
Others (inventory, modems and tablets) 46 79 77 72 69 72 67 63
Total WCDMA Devices 389 536 614 695 840 1,005 1,100 1,107 12.5%
TD-SCDMA devices 28 52 80 118 116 97 98 99 4.4%
LTE handsets 2010 2011 2012E 2013E 2014E 2015E 2016E 2017E CAGR 12-17E
Asia Pacific 0 2 31 71 117 215 308 388 65.4%
North America 0 5 42 81 87 106 104 123 24.1%
Western Europe 0 0 10 41 49 67 86 107 60.3%
Africa 0 0 0 0 2 8 17 37 NM
CEE 0 0 0 6 9 17 24 36 NM
Latin America 0 0 2 13 23 34 46 71 101.1%
Middle East 0 0 1 7 10 13 18 28 107.4%
Total LTE handsets 0 7 86 219 298 460 604 789 55.8%
% of the handset market 0% 0% 4% 11% 14% 21% 27% 34%
Others (incl tablets) 1 11 47 88 125 152 180 202
Total LTE devices 1 17 133 307 423 612 784 991 49.4%
2010 2011 2012E 2013E 2014E 2015E 2016E 2017E CAGR 12-17E
CDMA 238 235 207 189 176 153 139 111 -11.8%
WCDMA 389 536 614 695 840 1,005 1,100 1,107 NM
TD-SCDMA 28 52 80 118 116 97 98 99 4.4%
LTE 1 17 133 307 423 612 784 991 49.4%
Total CDMA/WCDMA/HSDPA/TD-SCDMA/LTE sell-in 655 841 1,035 1,309 1,554 1,867 2,121 2,308 17.4%
% change 28.9% 28.4% 23.0% 26.5% 18.8% 20.2% 13.6% 8.8%
1) CDMA on a gradual decline. With fast-
paced rollout of LTE in the US, we believe
that global CDMA volumes will continue on
a gradual decline in spite of EV-DO
adoption in China driven by China Telecom.
We expect CDMA to decline from 10% of
global handsets in 2012 to 7% by 2015.
2) WCDMA to rise to >40% of handsets
by 2015. Given strong adoption trends in
emerging markets helped by white-label
vendors, we expect WCDMA to rise from
27% of handset market in 2012 to 42%
by 2015. This is despite a strong shift in
the high-end of smartphone market
towards embracing LTE standard.
3) LTE – 2012 is the takeoff year. For LTE
devices, we see 2012 as the takeoff year,
with LTE enabled handsets rising from
only 4% of global volumes in 2012 to
~20% by 2015, reaching over 450mn
handset units.
1
2
3
Source: Gartner, Company data, Credit Suisse estimates

07 January 2013
Handset Industry 2013 Outlook 36
LTE could be a game changer
We would argue that historically faster network speeds have not really been the driver for
the smartphone market. In fact, though 3G networks have been in existence since 2002, it
was really the introduction of touch-screen technology, and perhaps the iPhone itself, that
accelerated 3G adoption. However, we believe that with LTE, the significant leap in
network speeds will push use of new applications which in turn could drive incremental
growth in the smartphone market. As shown below, we expect LTE handsets to grow from
some 86mn in 2012 to over 450mn in 2015.
Exhibit 37: 2012 could be the take-off year for LTE handsets – we expect 86mn/219mn LTE handsets in 2012/2013 in millions, unless otherwise stated
LTE handsets 2011 2012E 2013E 2014E 2015E
Asia Pacific 2 31 71 117 215
North America 5 42 81 87 106
Western Europe 0 10 41 49 67
Africa 0 0 0 2 8
CEE 0 0 6 9 17
Latin America 0 2 13 23 34
Middle East 0 1 7 10 13
Total LTE handset units (mn) 7 86 219 298 460
% growth 1203% 154% 36% 54%
% of the handset market 0% 4% 11% 14% 21%
Source: Gartner, Company data, Credit Suisse estimates
LTE coverage to expand to 50% by 2017
While South Korea and Japan have been the early adopters of LTE, carriers network
rollout plans in two key markets (US and potentially China) point to a rapid expansion of
LTE network coverage over the next 2-3 years. In fact, Ericsson in its recent Mobility
Report in Nov 2012 noted that there are around 100 LTE networks in commercial
operation today, and expects LTE population coverage globally to increase from 5% in
2011 to around 7% in mid-2012 (455mn people) and then to 50% by 2017. Below we
highlight the LTE rollout plans for carriers in the US and China.
Exhibit 38: LTE coverage to expand to 50% of global population by 2017 Global population coverage for different wireless standards
85%
35%
53%
2%
86%
46%
53%
5%
92%
85%
55%50%
0%
25%
50%
75%
100%
GSM/EDGE WCDMA/HSPA CDMA LTE
2010 2011 2017
Po
pu
lati
on
co
vera
ge (
%)
Source: Ericsson Mobility Report (Nov 2012)

07 January 2013
Handset Industry 2013 Outlook 37
Strong focus on LTE rollouts in the US
In terms of LTE network rollouts, we note that US remains the key market with all the top 4
carriers expected to aggressively roll out nationwide LTE networks. Even Tier II carriers
such as MetroPCS and Leap have aggressive plans for LTE coverage. In fact, both
Verizon and AT&T aim to cover majority of their customer base on LTE networks over the
next 12-18 months as can be seen below.
Exhibit 39: All carriers in the US already have aggressive plans for LTE rollouts
LTE Deployment in US (Network Launch Schedule)
2010 2011 2012 2013
Verizon
AT&T
Sprint
T-Mobile
MetroPCS
LEAP
LightSquared
38 Markets launched 200MM POPs Nearly 300MM POPs Build comple teby YE 2010 by YE 2011 by YE 2012 by mid 2013
74MM POPs 170MM POPs 250MM POPs Build completeby YE 2011 by YE 2012 by YE 2013 during 2014
123MM POPs 250MM POPs Build completeby YE 2012 by YE 2013 by early 2014
5 Markets launched Build completeMid 2010 by YE 2011
Trial Markets launched 25MM POPs "Expect to deploy 2/3 of our network by YE 2011 by YE 2012 footprint (66MM POPs) over next 2-3 years"
133MM POPs 200MM POPsby YE 2012 by YE 2013
Source: Company data, Credit Suisse research
Verizon leading the way in LTE coverage. At its Q312 results, Verizon had LTE services in
419 markets covering 250mn POPs (nearly 80% of US population), and also noted its
plans to continue to build out its LTE network to a similar footprint as its existing 3G
network by middle of 2013. Further, the carrier highlighted that 35% of total data traffic on
its mobile network is already going through its LTE network.
AT&T planning to extend LTE build to 300mn POP by 2014 end. As of Q312, AT&T had
LTE population coverage of 135mn with plans to increase this to 250mn by end of 2013.
However, at its Analyst Day in Nov 2012, the carrier noted that it is now targeting to cover
300mn people in the US with LTE network by end of 2014.
T-Mobile US also has ambitious plans. Following bigger rivals, T-Mobile USA also
announced in Feb 2012 that the carrier plans to spend $4bn over time for network
modernisation and LTE deployment, and this represents around $1.4bn of incremental
network investment over the next two years. This would result in LTE service being
launched in the vast majority of the top 50 markets across the US during 2013.
Ambitious LTE plans from China Mobile
We note that China Mobile has ambitious plans with respect to transitioning towards the
TD-LTE (4G) standard. The company sees its mobile network evolving in three distinct
elements. The GSM network will be used primarily for carrying voice traffic and
maintaining a leading voice experience, TD-SCDMA (its existing 3G standard) for carrying
data on handsets for the mass market and TD-LTE for high quality wireless broadband
experience. For TD-LTE, it expects the rollout to progress in 3 phases (Exhibit 40).
■ Phase 1 – This phase has now been completed with China Mobile having launched
scale-trials in 6 cities using over 900 base stations.
■ Phase 2 – This part will be implemented during 2012 with plans to construct over
20,000 TD-LTE base stations for scale-trials in 9 cities. The company has noted that
there is ongoing upgrade of base stations in major cities in Zhejiang and Guangdong,
with Hangzhou and Shenzhen expected to start pre-commercial trials. In addition,
China Mobile expects the launch of multi-mode smartphones (which will support TD-
LTE, LTE FDD, 3G and 2G standards) during 2012.

07 January 2013
Handset Industry 2013 Outlook 38
■ Phase 3 – For 2013, the company is targeting the number of TD-LTE base stations to
exceed 200,000 either through new-builds or upgrades of existing 2G/3G base
stations. As a frame of reference, China Mobile currently has around 700,000 GSM
base stations and close to 220,000 TD-SCDMA base stations.
Exhibit 40: China Mobile has accelerated its plans for TD-LTE large scale deployment
TD-LTE Scale Deployment Accelerated
Phase 1: Scale-trials in 6
cities, constructed over 900
base stations
Phase 3: Number of base
stations will reach 200,000
through new-builds or smooth
upgrade to extend scale of
pre-commercial trials
Phase 2 (1H 2012): Successfully
completed scale-trials in "6+1"
cities , commenced expanded
build-out
2011 2012 2013
Phase 2 (2H 2012): Base stations will
reach 20,000 with extended coverage
to 13 cities. Over 90% effective
coverage in key areas of Hangzhou,
Shenzhen and Guangzhou
Source: China Mobile (FY11 results in Mar 2012)
At the global level, China Mobile expects TD-LTE technology to cover over 2 billion people
across countries by 2014 with more than 500,000 base stations installed and over 100
models of mobile terminals available, as it continues to see commercial large scale
deployments from international carriers.
LTE handset availability improving all the time
In the early days of WCDMA handset availability, device size/weight and battery life were
gating factors to rapid 3G uptake. In contrast, this is not the case with LTE. Although we
expect Apple and Samsung to dominate the LTE smartphone/tablet market in the
intermediate term, we note that there has been a lot of focus from tier I vendors around the
launch of new LTE devices. In addition, most devices sport sleek form factors and battery
lives that are at par with 3G devices, ensuring that these factors do not constrict uptake.
Increasing focus on LTE launches from tier I vendors. Driven by expanding LTE coverage
in the US, Japan, Korea and parts of Europe, we have seen a significant level of interest in
LTE device launches from a number of handset vendors. For example, apart from iPhone
5, we have already seen a range of LTE smartphones being introduced by Samsung,
Motorola, LG, HTC and Nokia. In fact, our analysis on Exhibit 41 shows that there are
around 75 LTE smartphone models selling in the market, which represent nearly 20% of
their overall smartphone portfolio.

07 January 2013
Handset Industry 2013 Outlook 39
Exhibit 41: Around 75 LTE smartphones selling in the market (up from around 25 in middle of 2012) Detailed feature set of lower end smartphones being sold from different manufacturers
Single Dual 16M 256K 65K NA <= 2GB 4GB 8GB > 8GB
Nokia 4 26 15% 8.0 4.4 1475 1 3 37 4 4 4 4 0 0 0 0 0 1 3 486
RIMM 0 13 0% - - - 0 0 - 0 0 0 0 0 0 0 0 0 0 0 -
HTC 11 54 20% 7.9 4.5 1391 2 9 37 11 11 11 10 1 0 1 0 0 4 6 370
Apple 1 4 25% 8.0 4.0 1200 0 1 42 1 1 1 1 0 0 0 1 0 0 0 649
HP/Palm 0 3 0% - - - 0 0 - 0 0 0 0 0 0 0 0 0 0 0 -
Motorola 10 54 19% 8.0 4.4 1440 0 10 21 10 10 10 10 0 0 0 2 0 5 3 394
Samsung 19 90 21% 6.7 4.3 1306 10 9 23 19 19 19 18 1 0 3 3 3 3 7 344
Sony 5 34 15% 11.8 4.3 1500 0 5 27 5 5 5 5 0 0 0 1 0 2 2 416
LG 16 52 31% 7.2 4.5 1388 1 15 21 16 16 16 16 0 0 3 2 5 1 5 393
Acer 0 11 0% - - - 0 0 - 0 0 0 0 0 0 0 0 0 0 0 -
Huawei 2 28 7% 8.0 4.3 1500 0 2 21 2 2 2 2 0 0 0 0 2 0 0 480
ZTE 5 36 14% 7.7 4.4 1380 1 4 - 5 5 5 5 0 0 3 0 1 1 0 252
Micromax 0 14 0% - - - 0 0 - 0 0 0 0 0 0 0 0 0 0 0 -
Spice 0 7 0% - - - 0 0 - 0 0 0 0 0 0 0 0 0 0 0 -
Total 73 426 17% 7.7 4.4 1387 15 58 25.9 73 73 73 71 2 0 10 9 11 17 26 380
Colour Screen Factory
ASP ($)
MemoryTouch
Screen Wi-Fi GPS
HSPA speed
(Mbps)
Camera
(MP)
Screen
(in)Vendor LTE
# of total
models
% of
total
Processor
Speed (MHz)
Processor Type
1
1) A number of LTE device launches in
the last few months. Over the last 12months, we have seen a number ofsmartphone launches supporting LTEtechnology. We see nearly 75 models inthe market (up from 27 in mid 2012),which accounts for around 17% of totalportfolio from different vendors.
2) Devices supporting faster processor
speeds. Apart from faster network speeds,these LTE devices are also supporting fasterprocessors, which result in better userexperience. Average processor speed for LTEdevices in the market are 1.4GHz, with anumber of smartphones having dual coreprocessors.
2
3) Devices across a range of price
points. Apart from strong feature set,these LTE smartphones address arange of price points. For example,average ASP of LTE portfolio is around$380.
3
Source: Company data, Credit Suisse research
Supporting strong feature set, but also addressing a varied range of price points. Apart
from faster network speeds driven by LTE technology, a number of these devices also
support dual core processors with average processor speed of around 1.4GHz. Further,
they support high resolution on screen, and also are equipped with a range of memory
options. In terms of price point, we see that the LTE portfolio has an average price of
$380.
Apple – key driver for LTE device uptake in 2012
Although Apple was not the first to launch LTE devices, in our view, the company’s latest
iPad and iPhone launches have been the most significant catalysts for LTE market growth
in 2012. Indeed, we estimate that Apple LTE devices will account for 70% of all LTE
smartphones and tablets to be sold in the market in 2013, as we show in Exhibit 42.
Exhibit 42: Apple devices will comprise 68% of the LTE smartphone/tablet market in 2013
2012E 2013E 2014E 2015E
LTE handset units 86 219 298 460
LTE tablet units 30 51 69 84
Total LTE handsets + tablets (mn) 116 269 367 544
LTE iPhones 51 153 206 250
LTE enabled iPads 24 38 51 60
Total Apple LTE devices (mn) 75 190 257 310
Apple as % LTE smartphones + tablets 65% 71% 70% 57%
Source: Company data, Credit Suisse estimates
Samsung’s growth in high-end of smartphone market also driving LTE
Further, Samsung’s robust growth in high-end of the smartphone market (as evidenced in
the company’s Q2 and Q312 results, also see our note titled ‘Smartphones – High-end
going higher’ dated 4th Sep 2012) is another significant driver of LTE device volumes as its
new range of high-end Galaxy devices are selling in volumes. Reviews for Galaxy SIII and
Note II are amongst the most positive seen for any of the Samsung smartphones in the
past. Distribution for these device is also strong, as Galaxy SIII is shipping with over 290
carriers globally compared to 140 carriers for Galaxy SII. Samsung recently noted that it

07 January 2013
Handset Industry 2013 Outlook 40
has already crossed 30mn unit mark for Galaxy SIII in the first week of Nov 2012 in the
first five months of device launch. In addition, it has shipped over 3mn units for Note II
device in just over a month of shipping (as of Nov 2012). Both these devices have support
for LTE technology although it has been designed to work depending on regional/carrier
support.
Exhibit 43: Samsung's $400+ portfolio gaining lot of traction driven by S III and Note II Units in mn, unless otherwise stated
0
5
10
15
20
25
30
35
40
Galaxy S Galaxy S II Galaxy S III Galaxy Note I Galaxy Note II
Un
its (
mn
)
Source: Company data, Credit Suisse estimates
LTE speeds to drive devices, including tablets
While the promise of faster network speeds did not drive 3G uptake until smartphone
penetration hit an inflection, we believe the faster speeds for LTE (over 300Mbps downlink
and 85Mbps uplink) are likely to create consumer demand in many ways that other
networking technologies did not.
Exhibit 44: Relative LTE speeds should drive uptake
0.0
50.0
100.0
150.0
200.0
250.0
300.0
350.0
LT
E
WiM
AX
:
802.1
6e
UM
TS
W-
CD
MA
HS
PA
+
UM
TS
-TD
D
iBurs
t: iB
urs
t
UM
TS
W-
CD
MA
HS
UP
A
CD
MA
EV
-DO
Rev.
B
CD
MA
EV
-DO
Rev.
A
GS
M E
DG
E
Evolu
tion
UM
TS
W-
CD
MA
HS
DP
A
CD
MA
RT
T 1
x
CD
MA
EV
-DO
Rev.
0
GS
M G
PR
S
Cla
ss 1
0
Mb
it/s
Peak Downlink Peak Uplink
Source: Company data, Credit Suisse research
In addition, we expect wireless enabled tablets and data cards to be incremental drivers
for LTE going forward. For example, we estimate that the majority of wireless enabled
tablets will leverage LTE technology and we forecast 85mn LTE tablets by 2015. In

07 January 2013
Handset Industry 2013 Outlook 41
addition, we expect nearly 50% of the data card/dongle market to be based on LTE by
2015 driving nearly 70mn units by 2015. Combining this with our view around robust
growth in LTE handsets, we believe that LTE devices in total (handsets, tablets and data
cards) will grow from 135mn units in 2012 to over 600mn units by 2015 (Exhibit 45).
Exhibit 45: We expect strong growth in LTE devices – handsets, tablets and data cards
LTE devices (mn) 2011 2012E 2013E 2014E 2015E
LTE handsets 7 86 219 298 460
as % of total handsets 0% 4% 11% 14% 21%
LTE tablets 0 30 51 69 84
as % of total tablets 0% 27% 30% 29% 26%
LTE data cards 11 17 38 56 68
as % of total data cards 10% 13% 28% 40% 47%
Total LTE devices 17 133 307 423 612
Source: Gartner, Company data, Credit Suisse estimates
Low-end 3G market develops as high-end moves to 4G
Although we expect that the high-end of the 3G market will see strong migration to LTE,
3G handset market will continue to see robust growth driven by emerging markets. This
will be driven by ongoing expansion in the coverage of WCDMA, which we see rising from
45% of population in 2011 to 85% by 2017, and lower priced devices as chipset availability
and quality improves especially given recent success of Taiwanese chipset vendors.
WCDMA/HSPA to account for over 40% of handset market by 2015. In 2012, we estimate
that there would be close to 550mn WCDMA/HSPA enabled handsets shipped globally,
accounting for 27% of global handset volumes. Although we expect a significant shift in
the higher end of 3G market towards LTE especially in developed markets (US, Japan,
Korea and WE), we still believe there will be significant growth in 3G adoption in emerging
markets. As such, we assume WCDMA handsets to represent slightly over 40% of total
market by 2015.
Exhibit 46: WCDMA to continue to grow reaching 40% of all handsets by 2015 in millions, unless otherwise stated
WCDMA/HSDPA handsets 2009 2010 2011 2012E 2013E 2014E 2015E
Asia Pacific 92 101 143 181 254 342 478
North America 32 57 76 61 49 61 57
Western Europe 99 107 125 132 117 120 114
Africa 15 20 30 40 52 70 86
CEE 26 33 42 51 59 68 73
Latin America 7 11 24 43 56 68 80
Middle East 11 14 17 30 35 42 46
Total WCDMA/HSDPA handsets 282 342 457 537 623 771 933
% of the handset market 20% 21% 25% 27% 30% 36% 42%
Source: Gartner, Company data, Credit Suisse estimates
3G device availability has improved significantly in developing markets. One of the issues
leading to the slower uptake of 3G services in a number of emerging markets in the past
had been limited availability of 3G terminals. For example, in China, consumers did not
have a lot of choice when it came to picking 3G enabled phones across different
technologies (TD-SCDMA at China Mobile, WCDMA at China Unicom and CDMA EVDO
at China Telecom, all covered by Credit Suisse analyst Colin McCallum). However, driven
by improvement in chipset roadmap at a number of chipset vendors, 3G terminal
availability has seen significant improvements. Some of the recent commentary from
carriers in China clearly prove this point.
■ China Mobile has noted that device supply chain for its 3G technology (TD-SCDMA)
continues to mature. Here the carrier is focusing on bringing down price points for TD-

07 January 2013
Handset Industry 2013 Outlook 42
SCDMA handsets, and it had an offering of 60 different models of TD smartphones in
March 2012. Total number of smartphone models offered by carrier was around 166 in
Aug 2012, of which 126 devices were priced at around Rmb1,000.
■ China Unicom noted that it has already launched a series of Rmb1,000 smartphones
to accelerate WCDMA penetration.
■ China Telecom had an offering of around 580 models for CDMA EVDO handsets
around mid-2012, compared to 300/500 models in 2010/2011, as it continues to focus
on adoption of 3G handsets. Of these, 240 devices are smartphones. In fact, it sold
16mn smartphone units in 1H12, which was up 2x yoy.
Low end 3G growth driven by improvement in 3G chipset portfolio at MTEK/SPRD. One of
the most notable change in WCDMA landscape over the last year has been the rise of
Asian chipset vendors. In fact, MediaTek and Spreadtrum have already made a lot of
strides when it comes to improving the quality of their 3G chipsets, while RDA also has
WCDMA chip on its roadmap for 2013. In addition, Qualcomm continues to focus on
reference designs for the Chinese white-label manufacturers. This improvement in 3G
chipset offering will continue to drive significant technology shift at white-label vendors in
China as they move from GSM/EDGE based phones to 3G devices.

0
7 J
an
ua
ry 2
01
3
Ha
nd
se
t Ind
us
try 2
01
3 O
utlo
ok
4
3
Exhibit 47: WCDMA chipset roadmap for key vendors – significant improvement being seen at Asian vendors (MediaTek and Spreadtrum)
2010 2011 2012 2013
Qualcomm
Marvell
ST-Ericsson
Broadcom
Intel
MediaTek
8260, 45nm, 1.2-
1.7GHz, 2 Scorpion,
Adreno220, HSPA+
8660, 45nm, 1.2-
1.7GHz, 2 Scorpion,
Adreno220, SPA+
PXA968, 40nm,
1GHz, 1 Armv7,
Vivante, TD, HSPA
PXA978, 40nm,
1.2GHz, 1 Cortex A9,
Vivante, TD, HSPA+
PXA28145/PXA281554
40nm, 1.3GHz, 2
CortexA9, VC4, HSPA+
PXA28150, 40nm,
1.1GHz, 1 Cortex A9,
Video Core 4, HSPA+
U8500, 45nm, 1GHz, 2
Cortex A9, ARM Mali
400, HSPA
U9500, 45nm, 1GHz, 2
Cortex A9, ARM Mali
400, HSPA+
MT6588, 28nm, 1
GHz, 4 Cortex A7,
Power VR, HSPA+
MT8326, 28nm, 1.5
GHz, 4 Cortex A9,
Power VR, HSPA+
7630, 45nm, 800MHz,
1 Scorpion, Adreno
205, HSP
7227T, 45nm, 1GHz,
1 Cortex-A5, Adreno
200, HSPA
8225, 45nm, 1-1.2GHz
2 Cortex-A5, Adreno
203, HSPA
7227A, 45nm, 0.8-
1GHz, 1 Cortex-A5,
Adreno 200, HSPA
7227, 65nm, 600-
800MHz, 1 Arm11,
Adreno 200, HSPA
8227/8230, 28nm, 1-
1.2GHz, 2 Krait,
Adreno 305, HSPA+
8225Q, 28nm, 1 GHz,
4 Cortex-A5, HSPA+
8226, 28nm,
1.5GHz, 4 Cortex A7,
HSPA+
PXA910, 65nm,
806MHz, 1 Arm9,
Vivante, HSDPA
BCM21654, 40nm,
1GHz, 1 Cortex A9,
VideoCore 4, HSPA
BCM2157, 65nm, 500
MHz, 1 Arm11,
VideoCore 3, HSDPA
BCM2153, 65nm, 312
MHz, 1 Arm11,
VideoCore 3, HSDPA
BCM21553, 65nm, 1
GHz, 1 Arm11,
VideoCore 3, HSDPA
U6715, 65nm, 460
MHz, 1 Arm 9, HSPA
modem
Z2000, 32nm, 1.2GHz,
XMM6265, HSPA+
MT6575, 40nm, 1
GHz, 1 Cortex A9.
Power VR5, HSPA
MT6577, 40nm, 1
GHz, 2 Cortex A9.
Power VR5, HSPA
MT8320, 28nm, 1.5
GHz, 2 Cortex A9.
Power VR5, WCDMA
Spreadtrum
RDA 8850, WCDMA,
RDA 8860 TD
Smartphone
RDA
XMM6260, 65nm,
HSPA+
SC7710 (WCDMA),
40nm, 1 GHz, 1 Cortex
A5, ARM Mali
SC77xx (WCDMA),
40nm, 1.5GHz, 2
Cortex A7, ARM Mali,
HSPA+
Source: Company data, Credit Suisse research

07 January 2013
Handset Industry 2013 Outlook 44
The importance of compute Historically we would argue that handset, PC and other CE devices were largely
independent purchases by a consumer or corporation to fulfill a specific need. However,
the growth of smartphones has now evolved to a degree whereby consumers and
corporations demand access to their key digital content across multiple devices. In this
context, smartphone success also needs to take into account the ability of the entire
platform. Looked at from a hardware perspective, success in smartphones will be
determined by the ability to simultaneously execute in the PCs and tablet market, and
perhaps the TV market as well in the long term.
In this new world, success will no longer be judged by category unit share alone, whether
it be in smartphones, mobile phones, tablets or PCs, but in the combined compute
segment. Given the increasing level of mobile connectivity, the traditional computing and
mobile phone markets have collided and both industries are unlikely to ever quite be the
same again. In addition, the actual business model to address the growing needs for
consumers and corporates is evolving. There is the whole debate on closed versus open
standards and as well vertical versus horizontal business models. Apple is clearly a
pioneer on the vertically integrated model and operating on a much more closed basis
than say either Android/Google and/or Microsoft/Windows. Success in this market will of
course ultimately be measured by the platform market share in the end markets of PCs,
smartphones and tablets, all put together.
Exhibit 48: Overall compute units to grow at 22% CAGR... Exhibit 49: …while revenues to grow at CAGR of 9%
0
500
1,000
1,500
2,000
2,500
2006 2007 2008 2009 2010 2011 2012E 2013E 2014E 2015E
Un
its
in
mil
lio
ns
Smartphones Tablets PCs
0
100,000
200,000
300,000
400,000
500,000
600,000
700,000
800,000
2006 2007 2008 2009 2010 2011 2012E 2013E 2014E 2015E
$ in
mil
ion
s
Smartphones Tablets PCs Source: Gartner, Company data, Credit Suisse estimates Source: Gartner, Company data, Credit Suisse estimates
At stake is a significant opportunity, which we estimate could be worth $680bn in the long
term (by 2015) as consumers and corporates spend this amount on buying PCs,
smartphones and tablets, as shown in Exhibit 49. Further, this does not include the outlay
for applications or additional software and accessories. When looked at from a platform
perspective, we arrive at 4 main conclusions:
Simultaneous execution across multiple product lines will be key. Historically, vendors
have been able to report success by focusing on a specific feature, or product line. For
example, in the mobile phone market it can be argued that Nokia and RIM enjoyed
success in various capacities in the earlier days of the smartphone market. However, as
compute devices (which we define as PCs, tablets, and smartphones) increasingly
converge, the use case of one versus another, and potential for cannibalization exists.
This is not to say that we think tablets can replace PCs or smartphones can replace any of
the other two, but there is a clear recognition emerging within the industry that consumers
and enterprise workers demand simultaneous access to data, applications, services and
content across multiple platforms. The key differentiators across all of these will most likely
be on the software side.

07 January 2013
Handset Industry 2013 Outlook 45
Apple – mastering all, but for what share? If success is to be judged in this compute
market across multiple devices, the challenges facing vendors focused on a single device
are significant. For now at least, Apple is materially advantaged, principally because the
company’s vertically integrated structure allowing it to simultaneously address all three
markets i.e. PCs, tablets, and smartphones effectively. Moreover, much of the innovation
comes in software. Add to this, the broad range of “i-Services” that are built well beyond
iTunes, to include the Apps Store, iAd services, iBooks and now iCloud, the company
allows consumers to seamlessly access content across multiple devices. The issue is that
when considered in the context of the entire compute market in volume terms Apple have
a ~18% share, this will rise given their exposure to the relatively faster growing
smartphone and tablet end markets towards 22% longer term. However, this is unlikely to
be dominant. Should Apple want to maximize this, we retain our view that the company
may want to consider launching a lower end iPhone.
Exhibit 50: Overall compute experience to revolve around iOS, Android and Windows longer term
0%
10%
20%
30%
40%
50%
60%
70%
80%
90%
100%
2006 2007 2008 2009 2010 2011 2012E 2013E 2014E 2015E
Other Symbian Blackberry Windows (PCs) Windows (SP / Tablets) Android Mac OS iOS (iPad/iPhone)
1
3
1 2Apple mastering all, but for what share? For now webelieve that Apple is materially advantaged, principallybecause the company’s vertically integrated structureallows it to simultaneously address all three markets i.e.PCs, tablets and smartphones effectively. Moreover muchof the innovation comes in software. Add to this the broadrange of “i-Services” that are built well beyond iTunes; toinclude an apps store, iAd service, iBooks and nowiCloud; the company allows consumers to seamlesslyaccess content across multiple devices. The issue is thatwhen considered in the context of the entire computemarket in volume terms Apple have a ~18% share, thiswill rise given their exposure to the relatively faster growthsmartphone and tablet end markets to 22% longer term.
Google/Android, monetizing growth, need to expand beyondsmartphone. Google is aiming to address the compute marketas well as protect and grow its search revenues through multiplestrategies. To date Android has collectively captured significantvolume share within smartphones – close to 70% share,however, its share within tablets remains weak at 25%.Furthermore it has seen limited traction with its Chrome OS.Longer term it will without doubt have a robust level of share inthe market based upon its smartphone exposure of the computemarket. share could rise to ~50% longer term from 43%currently. However we believe its execution outside ofsmartphones remains to be seen. In particular, the ongoingcontinuous complaints against the headaches of Androidfragmentation, risk alienating either consumers or developers,which are two main stakeholders in this new compute world.
Microsoft traditional strength, can it all change withWindows 8? Historically this platform has dominatedthe market, however with the higher exposure ofWindows to the PC market, limited success insmartphones and tablets this has been eroded. Thegood news is that we believe the company isstrategically targeting the move towards a commonUI, with Windows 8, which will support the new MetroUI. In addition given the alliance with Nokia and levelof support on the smartphone side, not to mentionMicrosoft’s traditional strong hold in the corporatemarket; we believe that long term share will decline to25% compared to 30% currently.
3
Source: Company data, Credit Suisse estimates
Source: Gartner, Company data, Credit Suisse estimates
Google/Android – monetizing growth, need to expand beyond smartphones. When judging
success by considering the entire compute market, Google/Android’s fortunes have been
somewhat mixed. Clearly, Google is aiming to address the compute market as well as
protect and grow its search revenues through multiple strategies. While Android has
collectively captured significant volume share within smartphones – 67% share in 2012,
much of this is low-quality share, i.e. not necessarily a loyal user base with significantly
lower end phones. In addition, its share within tablets remains relatively weak at around
25% given the rapid growth seen in this market as well as Apple’s dominant share of
~65%. In addition, it has seen limited traction with its Chrome OS. Longer term, it will
without doubt have a robust level of share in the overall compute market based upon its
smartphone exposure, as we think its overall compute share could rise to 43% in 2012
from 27% in 2011, and towards 50% long term. However, we believe its execution outside

07 January 2013
Handset Industry 2013 Outlook 46
of smartphones remains to be seen. In particular, the ongoing complaints against the
headaches of Android fragmentation means that there is a potential risk of alienating
consumers and/or developers, which are two main stakeholders in this new compute
world.
Microsoft – traditional strength, can it all change with Windows 8? As shown in Exhibit 50,
historically this platform has dominated the market, however with the higher exposure of
Windows to the PC market, limited success in smartphones and tablets, this position of
strength in the compute world continues to erode. The good news is that we believe the
company is strategically targeting the move towards a common user interface (UI), with
Windows 8, which will support the new Metro UI. In addition, given the alliance with Nokia
and level of support on the smartphone side, not to mention Microsoft’s traditional strong
hold in the corporate market, we believe that long term share will decline to 30% in 2012
compared to 39% in 2011, and towards 25% long term.

0
7 J
an
ua
ry 2
01
3
Ha
nd
se
t Ind
us
try 2
01
3 O
utlo
ok
47
Exhibit 51: Apple's entry into the handset market has been a game changer, driving industry revenues and ASPs while taking incremental profits
0%
2%
4%
6%
8%
10%
12%
$0
$50
$100
$150
$200
$250
$300
$350
$400
2000 2001 2002 2003 2004 2005 2006 2007 2008 2009 2010 2011 2012E 2013E
Ha
nd
se
t in
du
str
y Y
/Y r
eve
nu
e g
row
th (
%)
Ha
nd
se
t in
du
str
y r
eve
nu
es
($
bn
)
Other Nokia Motorola HTC RIM LG Mediatek/Spreadtrum Samsung Apple
1) Apple and now Samsung driving handset market growth.
Handset industry revenues grew from $150bn in 2007 to $300bnin 2012. Within this, Apple has accounted for nearly 60% ofincremental growth. Interestingly, between 2000 and 2007, themarket grew at a CAGR of 7%, but Apple’s entry it has grown atalmost double the pace (CAGR of 14%). For 2013, we believethat the growth will be driven by both Apple and Samsung.
2) Industry profits moving to a new high. While overall industrymargins are at a new high (around 15% in 2012), the industryexcluding Apple and Samsung has been at a slight loss. WhileApple and Samsung make 55% of industry revenues, we estimatethey account for slightly over 100% of profits.
3) Handset ASPs continuing to rise. Given Apple’s rising shareand higher ASPs, it has actually led to industry ASPs rising in2011, a trend which has continued in 2012 and likely to continuein 2013.
1
2 3
-5%
-1%
3%
7%
11%
15%
19%
($15)
($5)
$5
$15
$25
$35
$45
$55
$65
2000 2001 2002 2003 2004 2005 2006 2007 2008 2009 2010 2011 2012E 2013E
Han
ds
et
ind
us
try O
M (
%)
Ha
nd
se
t o
pe
rati
ng
pro
fit
($ b
n)
Nokia Samsung
HTC RIM
LG Motorola
Others Apple
Industry margins (incl Apple & Samsung) Industry margins (excl Apple & Samsung)
-3%
-2%
-2%
-1%
-1%
0%
$100
$150
$200
$250
2000 2001 2002 2003 2004 2005 2006 2007 2008 2009 2010 2011 2012E 2013E
Ha
nd
se
t Y
/Y A
SP
gro
wth
(%
)
Ha
nd
se
t A
SP
($
)
Source: Company data, Gartner, Credit Suisse estimates

07 January 2013
Handset Industry 2013 Outlook 48
Apple – the iOS and Mac ecosystem
Software – leading the way with its iOS platform
Few would doubt that Apple’s simultaneous success in the smartphone, tablet and higher
end of the PC market is driven by products, but also by software competence. iOS when
initially introduced was an innovative touch based OS. It has clearly evolved since then,
with significant improvements as shown in Exhibit 52. For example, whether it was the
addition of simple cut, copy and paste in iOS3, or the integration of Twitter and PC free
messaging in iOS5 or recent Facebook integration and Passbook features in iOS6, we
would argue that Apple has delivered consistent improvements.
Continuous improvements in iOS. As shown in Exhibit 52, we have seen continuous
improvements in software functionality of Apple’s iOS ranging from the introduction of the
App store, to copy-paste, to multitasking, to cloud-based offering. iOS was already seen
as a leading software platform in its own right and the one to emulate in terms of intuitive
navigation of menus, ease of set up, and integration of applications, which is largely
assisted by its easy synchronization with iTunes.
Exhibit 52: Continuous evolution of Apple's iOS platform since June 2007 means it has held on to its leading position Jun-07 Sep-07 Dec-07 Jul-08 Sep-08
v1.0 v1.1 v1.1.3 v2.0 v2.1
u Cover flow for Albums/Songs
u Photos
u Calendar
u SMS Messaging
u Safari web browser
u Rich HTML email
u Google Maps
u Widgets (Stock, Weather, Calculator,
Calendar)
u Wi-Fi + EDGE Networking
u iTunes Wi-Fi Music store available
u Custom ring tones for $0.99
u Starbucks and Apple iTunes Wi-Fi iTunes
partnership
u Home button double-click shortcut
u Support for TV out
u Google Maps "Locate Me"
u Multiple SM Messaging
u Web Clips features
u Re-arrangeable widgets and icons
u Customizable homepages (up to nine)
u Further content management support
u Software Development Kit (SDK)
u Free for iPhone users
u Support for Microsoft Exchange ActiveSync
and Cisco IPsec VPN
u Push email functionality
u App Store
u Support for MobileMe
u Multiple Calendar support
u Video orientation expanded
u YouTube plug-in for Safari
u Genius playlist creation
u Improved iPod functionality
u Improved Podcast functionality
Nov-08 Jun-09 Apr-10 Jun-10 Sep-10
v2.2 v3.0 v3.2 v4.0 v4.1
u Enhancements to Google Maps
u Several App Store changes
u Enhancements to Safari
u iTunes over EDGE and 3G
u Improved iPod functionality
u Cut, copy and paste
u Multimedia messaging including pictures,
audio, video files
u MobileMe offers "Find My iPhone" option
u Shake to shuffle during play in iPod
u Apple push notification services
u Peer-to-peer connectivity
u Expanded search capabilities
u Introduced with iPad
u Support for landscape home screen
u 720p HD videos available in YouTube App
u iBook
u iAds
u Introduced with iPad
u iPhone 4 with over 100 new features
u Multitasking
u Folders
u Mail - unified inbox and threading
u Enhanced camera and & photo apps
(location) landscape mode
u Deeper enterprise support
u iBooks
u UI customization
u 5x digital zoom
u Bing support
u Game center
u TV show rentals ($0.99)
u iTunes Ping
u HDR camera on iPhone 4
u HD video uploads to YouTube and
MobileMe on iPhone 4
u FaceTime calling from favorites
Nov-10 Mar-11 Jun-11 Mar-12 Jun-12
v4.2 v4.3 v5.0 v5.1 v6.0
u Mainly iPad update
u Printing
u AirPlay (stream audio, video & photo over
Wi-Fi)
u Multitasking
u New Javascript engine for Safari
u iTunes Home Sharing
u Enhancements to AirPlay
u Personal hotspot support
u Using iPad side switch to either lock the
screen or mute the audio
u Notification aggregation
u iMessage between all iOS devices
u Newsstand for aggregation of
publications
u Camera updates (enhanced)
u Reminders across dates and locations
u Split keyboard
u Safari Reader and Reading List
u Twitter (single sign on)
u PC Free (wireless sync and OTA updates)
u Japanese language support for Siri
u Ability to delete from photo stream
u Improved camera face detection
u New camera app for iPad
u Genius Mixes and Genius playlists for
iTunes Match subscribers
u Fixes issues with battery life and call
quality
u Updated Siri- Sports, Yelp/ OpenTable
integration, eyes free (auto integration)
u Facebook integration
u Increased incoming call options
u FaceTime over cellular
u New Maps, turn by turn, traffic, 3D
presentation
u Safari update
u Chinese market features (Baidu, Todoku,
Youku etc)
u PhotoStream sharing
u Passbook- QR barcode and membership
center
Source: Company data, Credit Suisse research
iCloud conveys strategic advantages. With the launch of iCloud in iOS5 during 2011,
which allows automated wireless synchronization of the main types of digital data
(excluding video) across a user’s multiple iOS and Mac devices, we believe Apple
continues to lead the competition in terms of innovation and differentiation. Notable
features in iOS 6 include Facebook integration, Passbook, improved browser and Siri
functionality and facetime over cellular to name a few. These evolutionary improvements,
with more to come, will continue to hold Apple’s operating system in the leading position.
Apple demonstrates that not all browsing experiences are created equal. The statistics
speak for themselves regarding Apple’s Safari browser as shown below in Exhibit 53. In
fact, although Apple held only around 20% smartphone share in 2012, the vendor has
consistently managed to have over 60% browsing share, way ahead of all other mobile

07 January 2013
Handset Industry 2013 Outlook 49
platforms. This proves the point that Apple’s WebKit-based Safari browser has almost
become the smartphone standard for mobile Internet browsing, followed by Android.
Exhibit 53: Mobile web usage share by OS is dominated by Safari
0% 10% 20% 30% 40% 50% 60% 70% 80% 90% 100%
Oct 2011
Nov 2011
Dec 2011
Jan 2012
Feb 2012
Mar 2012
Apr 2012
May 2012
Jun 2012
Jul 2012
Aug 2012
Sep 2012
Oct 2012
Nov 2012
Safari Android Opera Mini BlackBerry Other Source: NetApplications, Credit Suisse research
The “i-Services” portfolio is by far the most advanced
Under the services heading, we consider any aspect that a smartphone can deliver which
allows some sort of differentiation. This, in itself, can become a key competitive
advantage, creating a degree of stickiness for the platform. As we have reviewed Apple’s
portfolio of “i-Services”, we have arrived at the following conclusions:
App Store – over 700K apps, 35bn downloads and counting. With over 700,000 available
apps for mobile devices (this includes over 275K apps for iPad), Apple seems to be the
clear leader in terms of mobile applications content, closely followed by Android also at
around 700,000 apps. The success of its apps store is also evidenced by the fact that total
downloads on its store crossed the 35bn mark in October 2012 (compared with 10bn in
March 2011 and 25bn in March 2012). In addition, Apple has paid over $6.5bn in
cumulative payments to developers since the launch of App Store in 2008.
Exhibit 54: Total apps on Apple store has crossed 700K… Exhibit 55: …with iPad specific apps at over 275K
0
100,000
200,000
300,000
400,000
500,000
600,000
700,000
800,000
Oct-
10
No
v-1
0
Dec-1
0
Jan
-11
Feb
-11
Ma
r-11
Ap
r-11
Ma
y-1
1
Ju
n-1
1
Ju
l-11
Au
g-1
1
Sep
-11
Oct-
11
No
v-1
1
De
c-1
1
Jan
-12
Feb
-12
Ma
r-12
Ap
r-12
Ma
y-1
2
Ju
n-1
2
Ju
l-12
Au
g-1
2
Sep
-12
Oct-
12
To
tal n
um
ber
of
ap
ps
0
50,000
100,000
150,000
200,000
250,000
300,000
Ap
r-10
Ma
y-1
0
Ju
n-1
0
Ju
l-10
Au
g-1
0
Sep
-10
Oct-
10
No
v-1
0
Dec-1
0
Jan
-11
Feb
-11
Ma
r-11
Ap
r-11
Ma
y-1
1
Oct-
11
Ma
r-12
Ju
n-1
2
Sep
-12
Nu
mb
er
of
ap
ps
Within 2.5 years of launch, iPad specific apps have already reached over 275,000 in total on Apple's App Store
Source: 148apps.biz, Credit Suisse research Source: 148apps.biz, Company data, Credit Suisse research
Music/Video/Books – again one of the leaders on content side. Looking at the number of
songs available on the store, we see that the iTunes has over 28mn songs from major
record labels such as EMI, Universal, Warner, and Sony BMG, and over 2,000

07 January 2013
Handset Industry 2013 Outlook 50
independent labels. This 28mn number is way ahead of Amazon, Google and RIM, as
shown Exhibit 56. The impact of this strong music catalogue is evident from the fact that
Apple reached the 8bn mark for downloaded songs in July 2009, making it the largest
legal music retailer worldwide, and the number of downloads have now increased to 20bn
currently. In addition, the company has been partnering with a number of film studios for
movie and TV show content, and also a number of book publishers for its iBookstore; this
is facilitating its global expansion.
Exhibit 56: Apple’s services offering well beyond primary competitors Feature/Metric Apple Google RIM Microsoft Amazon
Application content App Store Android Market BlackBerry App World Windows Phone Store Amazon Appstore
Number of apps >700,000 >700,000 >105,000 >120,000 >50,000
Book Store iBookstore Google Books r r Kindle eBooks
Music / Video content iTunes Google Music BBM Music/Video Xbox Music Amazon MP3 Store
Music catalogue size (mn) >28mn >15mn >10mn >30mn >20mn
Movie catalogue size ('000s) >45K a a a a
TV Show catalogue size ('000s) >55K a >10K a a
Developer community
Number of downloads (mn) >35,000 (as of Oct 2012) >25,000 (as of Sep 2012) >3,000 a a
Revenue sharing with developers 70% 70% 70% 80% 70%
Others
Advertising Strategy iAd Admob r r r
Revenue sharing with developers 70% - - - -
Billing system iTunes (CC) Google Checkout (CC) PayPal / CC / Carrier billing CC / Carrier billing CC Source: Company data, Credit Suisse research
iAd service – seeking advertising revenue. With this service, Apple allows advertisers to
effectively place ads that function as fully-functional apps within another app. Should a
user click the ad, it then opens the app for the ad and a variety of features are available,
including games, movies, or app purchases. Apple started this service with a 60% revenue
sharing agreement with developers, which was less than the 70% shared for purchase of
apps. However, recently the company has increased this revenue sharing deal to 70%,
similar to its revenue share for apps. We believe that this is an effort not only to partially
monetize the apps ecosystem but also to attract developers to the platform.
Multi product dominance – increasing collaboration between iOS and OS X
While in this note, we assess the smartphone prospects for each vendor, the issue now
becomes that a smartphone user may increasingly wish to consume content across
multiple devices. To this end, smartphone success will also be judged against multiple
product suites. Here we believe market share is not so much a function of just PCs or
smartphones but across all compute devices. Here we would argue that Apple’s
dominance in the tablet market as well as continuous share gains within PCs can be key
competitive advantages. Indeed, success here should be judged across all form factors
and can in fact prove self-reinforcing.
Exhibit 57: Apple commands share simultaneously across the major compute markets
2012 market share (%) Smartphones Tablets PCs
Apple 19% 58% 5%
Nokia 5% 0% 0%
Samsung 29% 12% 4%
Research in Motion 5% 1% 0%
HTC 5% 1% 0%
LG 4% 0% 1%
Motorola 3% 1% 0%
Sony 3% 0% 0%
Others 28% 27% 90%
Total 100% 100% 100%
Source: Gartner, Company data, Credit Suisse estimates
Apple is one of the few players to simultaneously have a product offering in all three
compute product categories. Indeed as shown in Exhibit 57, we look at the current levels
of PC, tablet and smartphone volume share for different vendors within these end markets.

07 January 2013
Handset Industry 2013 Outlook 51
What is clear is that apart from Samsung, none of its rivals (for example Nokia, HTC or
LG) play in more than one or two categories. This shows that with increasing move
towards a seamless compute offering, Apple may continue to hold its competitive edge
over rivals in these markets.
Bringing both iOS and OS X closer together with new management structure. Having a
common user interface and software platform can be a competitive advantage on many
levels. The look and feel of the product and user interface, shortcuts and means of
navigating multiple devices can become seamless. In the recent management changes
announced by Apple in Oct 2012, the company appointed Craig Federighi as head of both
iOS (smartphones and tablets) and OS X (PCs). In our view, this shows that Apple may be
looking to bring together both these platforms even further in an attempt to offer an
increasingly seamless user experience to its smartphone, tablet and PC users.
Synchronization can be key for the consumer. In addition, one advantage that Apple holds
is by manufacturing the devices as well as the software, the company has become
effective at synchronizing information. For example, its iCloud service had nearly 200mn
users in Oct 2012 (up from 125mn in Apr 2012), which works simultaneously across all of
Apples devices. Although this cloud service is something which is now also being offered
by rivals (Google Drive and Microsoft SkyDrive), the ease of synchronization means that
the overall experience of iCloud is still superior for Apple users.
Opens up new markets. We would note historically Windows has been a dominant
platform in the work place. However, whether it is the move towards bring your own device
(BYOD), or the consumerization of IT as can be seen from below charts, it appears at
least anecdotally, this has allowed Apple, previously a more consumer focused company,
to gain traction within the enterprise.
Exhibit 58: Bring Your Own Device (BYOD) on the rise…. Exhibit 59: …as is the smartphone/tablet usage at work
46%
33%
16%
5% I own my smartphone
Work supplies me with mysmartphone
Work provides me with asmartphone and I also have apersonal smartphone
I don’t have a smartphone
Do you own your own smartphone that you use for work or does work supply you with a smartphone?
70%
21%
52%
33%
10%
58%
41%
4%
17%
1%3%
25%
3%
20%
4%
38%
0%
10%
20%
30%
40%
50%
60%
70%
80%
Laptop Tablet Smartphone Desktop PC
Same More Less Don’t use for work
In 2013, do you see yourself relying on any of the following devices that you now use more or less?
Source: iPass Global Mobile Workforce Report (Q4 2012) Source: iPass Global Mobile Workforce Report (Q4 2012)
Rising consumer devices within the enterprise. iPass recently published a detailed survey
of some 1,700 mobile workers across 1,100 enterprises. The trend for smartphones is
increasingly clear, whereas some 66% of users had a corporate issued smartphone in
2010 and by 2011 this had fallen to 58%, and further to 49% in 2012 (Exhibit 58). In other
words, increasingly, mobile workers are using a smartphone of their choice, rather than
having one prescribed by their employer. The clear trend is that enterprises are
increasingly allowing mobile workers to choose the smart devices that the consumer wants,
as opposed to issuing them.
Purchase intentions imply continued growth for Apple and Android in the enterprise.
Looking forward, in terms of purchase intentions for 2013, these market adoption trends
are expected to continue. iPhone leads the pack in terms of intended smartphone
purchases (41%) followed by Android (22%) as shown in Exhibit 60. Interestingly,
Windows Phone came in third with 8% of respondents citing an intention to
purchase/receive a device, followed by BlackBerry at 5% despite the upcoming debut of

07 January 2013
Handset Industry 2013 Outlook 52
BlackBerry 10 in Jan 2013. Similarly, in tablet space, 54% of enterprise workers who plan
to purchase or receive a tablet device in 2013 indicated their preference for iPad (Exhibit
61).
Exhibit 60: iPhone leads in purchase intentions at work Exhibit 61: iPad is way ahead of competition in enterprise
41%
22%
8%
5%
1%
0%
5%
10%
15%
20%
25%
30%
35%
40%
45%
iPhone 5 Android WindowsPhone
BlackBerry Symbian /Nokia
Do you currently intend to change or upgrade your smartphone(s) between now and end of 2013?
54%
29%
11% 11%8% 7%
2%6%
0%
10%
20%
30%
40%
50%
60% Do you currently have, or intend to receive/purchase any of the following tablets between now and end of 2013?
Source: iPass Global Mobile Workforce Report (Q4 2012) Source: iPass Global Mobile Workforce Report (Q4 2012)
Exposure to all segments means platform share gains will continue. When judging
success of a given platform along these lines, we would note that we expect Apple’s share
to expand over time, partly due to its exposure. Indeed, Apple’s exposure to the faster
growing tablet and smartphone segments will mean that within this segment characterized
as mobile computing, Apple will see its compute share (smartphones, tablets and PCs) to
rise from 18% currently to 22% over the long term.
Google – all about smartphones so far
Google will continue to be a strong player in the battle of ecosystems
Traction so far being driven by all smartphones. In the compute market, we estimate
Google to have captured a 43% share in 2012 and given its exposure to the fast growing
smartphone market, this will grow close to 50% longer term. However, we would highlight
as shown in Exhibit 57 that perhaps more worryingly is the fact that it has failed to gain
meaningful traction to date in other product areas. Since its introduction in 2008, Android
has steadily grown in share within the smartphone market, reaching nearly 75% unit share
(Exhibit 62) during Q312. Despite this rise in popularity, the OS continues to be impacted
by the platform’s inherent fragmentation causing headaches for app developers and
consumers alike. In addition, we would argue that while the company has attempted to
expand beyond smartphones with products/services such as Google TV, Chrome OS and
now possibly Google glasses, these products have yet to deliver a meaningful advantage.
Exhibit 62: Android’s smartphone share at ~75% in Q312 Exhibit 63: Android daily activations over time
0%
10%
20%
30%
40%
50%
60%
70%
80%
An
dro
id s
ma
rtp
ho
ne
ma
rke
ts
ha
re
110130160
200
300350
450500
550
700
850900
1,000
1,300
0
200
400
600
800
1,000
1,200
1,400
Ap
r-10
May-1
0
Ju
n-1
0
Ju
l-10
Au
g-1
0
Sep
-10
Oct-
10
No
v-1
0
Dec-1
0
Jan
-11
Feb
-11
Mar-
11
Ap
r-11
May-1
1
Ju
n-1
1
Ju
l-11
Au
g-1
1
Sep
-11
Oct-
11
No
v-1
1
Dec-1
1
Jan
-12
Feb
-12
Mar-
12
Ap
r-12
May-1
2
Ju
n-1
2
Ju
l-12
Au
g-1
2
Sep
-12
An
dro
id d
ail
yd
evic
e a
cti
vati
on
s (
'000)
Source: Gartner, Credit Suisse estimates Source: Company data, Credit Suisse research

07 January 2013
Handset Industry 2013 Outlook 53
Daily device activations continue to surge. At Motorola’s event in Sep 2012, Google noted
there are around 500mn Android devices being used currently. In addition, 1.3bn Android
devices were being activated on a daily basis as compared to 1bn run-rate in July 2012.
Interestingly, of these 1.3bn activations, only 70K were linked to tablets, which shows all
the traction for Android is being driven by smartphones and tablets remain an area of
concern for the company.
Android OS’ fast-paced evolution and fragmentation issues linked to that
Android is the preferred OS of many handset vendors. Android remains the preferred
operating system platform for a number of handset OEMs mainly due to its open source
software and also due to lack of licensing fee payments to OS provider. Furthermore,
Android is constantly evolving to adopt the latest technologies through frequent iterations
of the OS. While both of these are inherently positive attributes, both contribute to a
fragmented landscape that continues to plague the Android operating system.
Exhibit 64: Android evolution continues with the introduction of Jelly Bean (version 4.2) in Oct 2012 Sep-08 Feb-09 Apr-09 Sep-09 Oct-09
v1.0 v1.1 v1.5/ Cupcake v1.6/ Donut v2.0/2.1/ Éclair
u Watch/ record videos
u Upgraded soft keyboard/text prediction
u Improved Android Market
u Universal search
u Support for CDMA/EVDO, VPNs, text to
speech
u Free turn by turn Google navigation
u Optimized hardware speed
u Updated UI
u Improved maps, exchange integration
u Live wall papers
May-10 Jan-11 Feb-11 May-11 Nov-11
v2.2/ Froyo v2.3/ Gingerbread v3.0/ Honeycomb (for tablets) v3.1 (for tablets) v4.0/ Ice Cream Sandwich
u USB tethering
u Flash 10.1
u Performance optimization
u Integration of Chrome's V8 JavaScript
engine for browser
u Revised UI
u Extra large screen size
u Support for NFC
u Improved copy and paste feature
u Gyroscope sensor
u New audio effects
u New UI themes (system bar, action bar,
customizable homescreens)
u Redesigned keyboards
u Support for tablets
u New connectivity options (improved Wi-Fi,
keyboard over USB or Bluetooth)
u Connectivity for USB accessories
u Resizable Home screen widgets
u Support for external keyboards and
pointing devices
u Support for joysticks and gamepads
u Updated set of standard apps like gallery,
calendar, contacts, email
u Unified OS for smartphones, tablets and
other platforms like TV
u Holographic UI
u Improved multitasking and richer widgets
u Support for 3D and OpenGL facetracking
u Android Beam for NFC-based sharing
u Powerful voice input engine
u Redesigned gallery app with photo editor
Jun-12 Oct-12
v4.1/ Jelly Bean v4.2/ Jelly Bean
u Improved interface and home screen -
60fps
u New Google Now
u Offline voice dictation
u Updated camera app
u Voice activated search engine
u Smart app updating
u Refined and refreshed user interface
u Improved camera with HDR
u New NFC hardware and controller
interface
u Enhancements for international
languages
u Interactive screen saver mode
u Lock screen widgets
u Share single tablet with dedicated user
space Source: Company data, Credit Suisse research
Broad vendor adoption leads to a wide variety of hardware form factors. Hardware
differences leading to platform fragmentation on Android include screen size, resolution,
inclusion of a physical keyboard (or lack thereof), processor capability, and so on.
Fragmented hardware and software causes support issues for vendors and carriers as
well as a more complicated application creation process for developers.
Exhibit 65: Current distribution of Android install base by platform version Cupcake (v1.5)
0.1%Donut (v1.6)
0.3% Éclair (v2.1)3.1%
Froyo (v2.2)12.0%
Gingerbread (v2.3 - v2.3.2)
0.3%
Gingerbread (v2.3.3 - 2.3.7)
53.9%
Honeycomb (v3.1)0.4%
Honeycomb (v3.2)1.4%
Ice Cream Sandwich (v4.0.3 -
4.0.4)25.8%
Jelly Bean (v4.1)2.7%
Source: Android Developers (Nov 2012)

07 January 2013
Handset Industry 2013 Outlook 54
Frequent updates to Android OS further leads to fragmentation problems. As the software
is controlled by Google, while the phone is manufactured by various vendors, hardware
cycles do not typically coincide with software cycles on the platform. Further, due to
varying hardware capabilities, most phones currently in the market either cannot support
newer versions of the OS or require significant R&D spend by the vendors to iron out
compatibility. As seen in Exhibit 65, there are more than 10 versions of Android in use in
the marketplace. The vast majority of Android users are running Android 2.3 version
(nicknamed “Gingerbread”) which was first introduced in late 2010. Less than 3% of users
are running the latest version of Android (Android 4.1, known as “Jelly Bean”) due to
support and compatibility issues.
Developers discouraged by combination of hardware and software fragmentation
While Android’s popularity within the smartphone market forces many developers to create
apps for the platform, there are several points of contention with the OS that frustrate and
discourage developers. A highly fragmented operating system can present many different
issues for developers, as it requires frequent updating and re-writing of apps. Android’s
fragmentation issues manifest both in the form of constant software updates and different
hardware platforms.
Developers see fragmentation as the biggest risk to Android. According to an IDC-
Appcelerator survey of over 2,700 apps developers in mid-2011, there was a question
asking what the biggest threat to the success of Android is. As seen in Exhibit 66 below,
the overwhelming majority identified the fragmentation of the OS, devices, etc. as the
biggest risk to the platform. A fragmented landscape makes it difficult for developers to
identify and adequately serve a target audience.
Exhibit 66: IDC Developer Survey: What is the biggest threat to the success of Android?
0% 10% 20% 30% 40% 50% 60% 70%
I have my hands full with iOS and/or Android (not
enough time)
I can make more money with Apple
The Android OS is inferior to Apple iOS
Pricing on Tablets too high
Too many Android app stores
Tablet devices haven't seen traction yet
Fragmentation of the OS, Devices, and so forth
Source: IDC-Appcelerator Developers Survey (Q2 2011)
Variety of hardware across vendors complicates development... Android is extremely
popular with smartphone vendors, as the OS can be licensed for free and the platform is
open-sourced, enabling a greater degree of customization. However, such broad adoption
complicates application development as each vendor creates unique hardware
specifications for different phones running Android. These differences include screen size,
resolution, the inclusion of a physical keyboard (or lack thereof), processor capability, and
so on. The lack of consistency makes the platform difficult to write for as the user
experience varies considerably from one device to another.
…as does the slow adoption of new OS releases. As seen above in Exhibit 65, nearly 55%
of the current Android installed base is running Gingerbread version of Android OS, which
is around 18 months old. Further, many phones currently in the marketplace do not have

07 January 2013
Handset Industry 2013 Outlook 55
the technical compatibility required to upgrade to the latest software. Similar to the
complications caused by a variety of hardware form factors, the slow adoption of new
Android OS releases makes it difficult for developers to design apps to target all Android
users.
Google trying to offer a range of services
Over the past decade, Google has tried to offer a range of services for wireless platforms,
which have been built around its search dominance, in an effort to improve the
competitiveness of its overall offering.
Google Play is now catching up with Apple App Store. In March 2012, Google also
launched its all-in-one entertainment suite combined with cloud offering, termed as Google
Play. This service offers consumers access to over 700,000 apps, millions of songs and
books collection and thousands of movies all in one place. Given this service is cloud
based, all the user content is stored online and readily available without having to store
them or move them from one device to another.
Still early days for Google Play Music. After not having a music-based service, Google had
launched its Music Beta service in mid-2011, which since then has been integrated into its
Google Play offering under the name Google Play Music. This music service allows users
to store up to 20,000 songs over the cloud. Interesting features include the ability to play
music even offline (using recently played tracks), ease of collation (even across multiple
computers) and synchronization and playlist creation. Also in Nov 2012, the company
signed a new agreement with European music publishers which gives it access to another
5.5mn tracks spanning 35 countries, and also announced launch of ‘scan and match’
music service for free (similar to Apple but the company charges $25 per year for this) for
EU users, which will be followed by a US launch later.
Wider range of Google services. Apart from offering typical mobile services such as an
apps store, music and messaging, one of the strengths of the Android platform has been
its tight integration, with a wide range of services offered by Google. This synergy can
already be seen in areas of mobile advertising, social networking, blogging, and search
through a number of services being launched by Google (either specifically designed or
customized to work on mobile devices) over the past two to three years. AdMob, Buzz and
Blogger are a few examples of such kind of services.
Exhibit 67: List of other mobile services offered by Google/Android
Mobile services Date of launch Details
Gmail Mar 2004 Free webmail offering a search-oriented interface
Google Picasa Jul 2004 Image organizer and viewer for digital photos, plus an integrated photo-sharing website
Google Talk Aug 2005 Free Windows and web-based application for instant messaging and VoIP
Blogger Aug 2006 Blog publishing service that allows private or multi-user blogs with time-stamped entries
YouTube Oct 2006 Video sharing website allowing users to upload and share videos
Google Maps Nov 2007 Web mapping service application for mobile devices
Google Voice Mar 2009 Calling features like voicemail, call blocking/screening, call conferencing, international calls. Outbound call
options available to US and international users, but incoming only available to US users
AdMob Nov 2009 One of the largest mobile advertising platforms, which claimed to have more than 40bn mobile banner and
text ads per month
Goggles Dec 2009 Beta visual search app allowing users to take a picture and the app will bring up a description of the
picture, a list of businesses nearby etc.
Google Play Music May 2011 Online music streaming service with support for storing 20,000 songs
Google+ Jun 2011 Launched as a social network platform, this service integrates many of other Google services like Gmail
and Google Talk; user base of 400mn as of Sep 2012, of which 100mn are active users
Google Play Mar 2012 Merger of Android Market and Google Music/Video services, along with cloud based support
Google Drive Apr 2012 A suite of productivity applications (with 5GB of cloud storage for free, expandable on subscription)
offering editing on documents, spreadsheets, presentations and more
Source: Company data, Credit Suisse research
Installed base rapidly growing, could be a major advantage for services. We believe that
Google’s strategy behind Android will be to create a large installed base of Android

07 January 2013
Handset Industry 2013 Outlook 56
devices for ultimate access to the lucrative mobile advertising/search market. In particular,
we believe the most likely approach is that Google will want to target the opportunity as
being the search engine of choice on mobile devices that are Android enabled, thereby
driving its potential advertising revenues and business model. With a 60-65% market
share in online search, this can be leveraged in what is still a nascent mobile advertising
world; this represents considerable upside potential in additional Internet advertising
revenues. We estimate that Android-based smartphone shipments will grow from 220mn
in 2011 to around 675mn/900mn by 2013/2015, thereby driving a significant increase in its
smartphone subs base.
Carrier friendliness missing in spite of carrier alliances. Although there are a number of
global carriers that continue to be part of Android’s Open Handset Alliance (OHA), such as
Vodafone, Telecom Italia, Telefonica, Sprint, KDDI, NTT DoCoMo and China Mobile, we
would highlight that Android does not directly share service revenues with carriers at this
stage. This suggests that carrier friendliness remains limited at best for the Android
platform, especially when compared with RIM and Nokia’s strategy.
Multi product strategy, but limited success so far
Google’s strategy suggests that having a commanding share in one platform or having a
product in one segment is not sufficient, as such the company has set about driving a
multi-product strategy. In aggregate, we would argue this is an area where Google
remains disadvantaged today, relative to Apple’s vertically integrated strategy, as the
experience is not exactly seamless. For example, a Samsung smartphone does not work
seamlessly with a Motorola tablet and a Dell PC. Over time, we would argue this
disadvantage could fade.
Motorola Mobility acquisition. Clearly, Google is interested in the mobile handset business
given its $12.5bn acquisition of Motorola Mobility (MMI) in Aug 2011. More importantly,
MMI was bought for its portfolio of 17,000 existing and 7,500 pending patents. How this
impacts the smartphone market remains to be seen, however the move clearly allows
Google to provide patent protection to its device makers.
A range of new tablet launches. We believe that success in the broader compute space
will be defined by a robust ecosystem and the ability to simultaneously compete across
multiple devices (i.e. smartphone, tablet, and PC).
■ Google Nexus 7 tablet has several differentiating features. In June 2012, Google
announced the launch of the Nexus 7 tablet which began shipping in mid-July. The
tablet is manufactured by Asus and features a 7” form factor that weighs in at 340g. It
boasts a NVidia Tegra 3 chipset with a quad core CPU and a 12-core GPU, and the
8GB version currently sells for $199. While the hardware is an improvement vs. the
original Kindle Fire, we suspect that Google is subsidizing this device and hence it
may not be a template other OEMs can follow.
■ Google expanding to 10” tablet market with Nexus 10: Following Apple’s 4th generation
iPad, Google introduced its own 10” tablet the Nexus 10 in late Oct 2012. The new
Google tablet boasts a 10.1” high resolution screen (2560x1600 pixels), Android 4.2
OS, a 5MP/1.9MP rear/front facing camera and is priced at $399/$499 for the
16GB/32GB models (a $100 discount to Apple’s 4th generation iPad). Outside of the
Apple vs. Android user experience, one of the largest differences between the Nexus
10 and 4th generation iPad is the lack of LTE/Cellular option from Google. While the
Nexus 10 offers a solid alternative to iOS, we believe it will likely consolidate the slew
of 10” Android devices rather than take meaningful share from Apple.
■ Will it succeed in tablets? So far there has been limited sustainable traction for
Android in terms of tablet share as shown in Exhibit 68, certainly the profitability of the
vendors involved has been relatively weak. The issue has been a combination of too
high a price point, lack of applications and poor user experience. We do believe that

07 January 2013
Handset Industry 2013 Outlook 57
with the improvements made to Google Play (the cloud service), the price point,
design and recent improvement in available applications many of these have been
addressed. As to whether this will capture material share the issue we would have is
that given its spec we would believe Google are probably heavily subsidizing this
device to achieve a $199 price point (for Nexus 7) meaning that this is not necessarily
platform its other hardware OEMs will or can follow. Second, with Apple also now
having launched the iPad mini (starting from $329) means that competition at the
lower end of the tablet market will be stiff.
Exhibit 68: Tablet share by OS, CY11
Apple, 58%
Amazon, 7%
RIM, 1%
Android, 33%
Source: Company data, Credit Suisse estimates
Google TV. Google TV is the smart TV platform offering launched by the company in Oct
2010 which includes video on demand, an internet browser, and internet television. To
date, adoption of the product has been poor, however it shows another area through which
Google aspires to expand its software and services offering.
Google Glass. This is currently an augmented reality project under testing in Google X
Labs. The intended purpose for this project is to allow for internet use seamlessly via voice
instruction, much like how Siri works today. It is still clearly in prototype form, but Google
made it available for developers to purchase for $1,500 who were at its developer event in
June 2012. Clearly it remains unseen whether such a compute form factor will take off,
especially given the high price point, however it does strategically show Google’s desire to
go address all potential compute products long term.
Exhibit 69: Google Glass prototype seen at I/O event in June 2012
Source: Company

07 January 2013
Handset Industry 2013 Outlook 58
Nexus Q dropped from lineup after poor customer feedback. Along with Android v4.1 OS
and Nexus 7 tablet launch, Google had introduced a media player called Nexus Q in June
2012. The internet connected home media player connects to TVs, stereo systems, or just
speakers and allows Android user to stream and share their content via Google Play. The
device allows different Android smartphone and tablet users to stream content from
Google Play Music, Movies and TV as well as YouTube to Q connected devices
(TV/Stereo/Speakers). While much of the device connectivity is similar to Apple TV (Wi-Fi,
Ethernet, HDMI, optical audio, micro-USB) it lacked a unique UI, and it was also priced
higher at $299 vs. Apple TV at $99. Another noticeable difference was that it did not offer
a similar ‘Mirroring’ for games as is offered on the Apple TV. Given poor feedback from
customers, Google decided to drop this product from its offering in Oct 2012.
Windows 8 – focusing on similar UI across devices
The third ecosystem in this market remains Microsoft, with a 93% share in the PC market
and a strong presence in consumer and enterprise markets translates into a meaningful
30% share overall today which drops to 25% longer term due to the tablet and smartphone
markets growing faster than the PC market.
Windows 8 software – adapting the OS to a multi-device product portfolio
After a number of updated Windows Mobile versions over the last few years, Microsoft
launched its completely revamped smartphone operating system in late 2010, named
Windows Phone 7 (WP7), which has been refreshed with WP8 launch in Oct 2012.
Windows 8’s development has been focused around adapting the OS to the tablet form
factor in terms of its touch interface, instant-on, and power consumption. In addition,
Windows 8 is the only tablet OS that is able to run MS Office and iTunes natively and
integrate with Xbox which makes the software a compelling platform for the consumer
segment in addition to the business segment where Microsoft has traditionally been
strong.
Windows 8 aiming to create a seamless experience. Given that Microsoft’s tablet OS will
be Windows, all applications designed to run on Windows for desktop or laptops will also
run on tablets with Windows 8. iTunes runs on Windows, therefore, tablets running
Windows 8 are the only other tablet form factor able to natively run iTunes besides Apple’s
iPad. Windows 8’s ability to run iTunes, improved touch UI for tablets, and integrate
functionality from elsewhere in Microsoft’s product portfolio (e.g. Xbox) will make Windows
8 a more compelling tablet platform for consumers versus other non-iOS tablets, including
Android. A Windows 8 tablet could represent a competitive offering for consumers
(particularly those with an Xbox connected to their primary TV). Microsoft embraces a
simple, streamlined, guided experience for consumers, drawing on the design strengths of
other Microsoft products like the WP8 OS and Xbox offering. Microsoft enables consumers
to easily access and transfer media content in a multi-screen ecosystem, including
desktops, laptops, tablets, Windows Phone 8 smartphones, and Xbox 360.
Exhibit 70: Windows Metro UI allows for a similar interface across all devices like Apple
Smartphone Tablet Laptop
Source: Company, Credit Suisse research

07 January 2013
Handset Industry 2013 Outlook 59
Enterprise use case. When considering help desk calls, employee productivity, and
employee satisfaction issues, the familiarity of the Windows operating system, combined
with the support costs/infrastructure (e.g., helpdesk, security) needed to maintain multiple
client operating systems, will likely outweigh the alternative operating systems for tablet
devices from many business customers. Given that more than 4 million applications have
been written for Windows, the majority being business applications, which is more than 10
times the next OS platform, and because of the added operational costs (which account
for 60-70% of the TCO of a business computing device) of supporting an additional OS
platform, we believe Windows 8 may prove to be an attractive tablet OS for the business
vertical. Windows will ultimately be less expensive and easier to deploy/support for
business users as compared with transitioning users to alternative an operating system for
the tablet when factoring in application compatibility, migration, support, security, and
retraining costs.
Windows Phone – can WP8 revive falling customer traction and developer interest?
Trying to keep up pace with Android on adding new OS features. When Microsoft
announced an updated OS version (WP7.5 aka Mango) for its WP platform in mid-2011, it
introduced more than 500 new features making it one of the major software upgrades.
Among the new features incorporated were Bing Vision (support for visual search),
improved communication features (like group contacts, threaded message view and
Twitter integration), unified mailbox and support for multi-tasking and app switching. In the
recent WP8 update, it has added a few incremental functionalities like new start screen,
improved browser in the form of Internet Explorer 10, Skype app integration and ‘tap +
send’ feature for sharing content.
Exhibit 71: Microsoft’s Windows Phone 8 has been improving, but will it prove enough? Oct-01 Jun-03 Mar-04 May-05
Pocket PC 2002 Mobile 2003 Mobile 2003 SE Mobile 5
u 240 x 320 Power PC devices but was also
used for mobile phones
u enhanced UI with theme support
u VPN support
u MSN messenger
u Window Media Player 8 with streaming
u Palm OS support
u Microsoft Reader 2 with DRM support
u Improved Pocket Outlook
u Support for external keyboards
u Bluetooth support
u Enhanced Pocket Outlook
u Pocket Internet Explorer
u Windows Media Player 9.0
u MIDI support for ringtones
u VGA support for 640 x 480, 176 x 220, 480
x 480 screen resolution
u Landscape switching for pocket PCs
u WiFi support
u Office Mobile with mobile PowerPoint,
graphing in Excel and table/graphics for
Word Mobile
u Windows Media Player 10
u Caller ID with photo
u Enhanced Bluetooth support
u GPS management interface
u QWERTY keyboard support
u ActiveSync
Feb-07 Apr-08 May-09 Oct-09
Mobile 6 Windows Mobile 6.1 Windows Mobile 6.5 Windows Mobile 6.5.1
u 320 x 320 and 800 x 480 WVGA support
u Remote desktop access
u VoIP support
u Windows Live for Windows Mobile
u HTML email support for Outlook Mobile
u JavaScript support on Internet Explorer
Mobile
u Operating System Live Update
u Redesigned home screen
u Threaded SMS
u Full page zooming of Internet Explorer
u Enhanced ActiveSync
u New UI
u Internet Explorer Mobile 6 browser
u Improved UI with finger-touch
u Upgrade to icon buttons from text
u Improved threaded SMS
Feb-10 Oct-10 May-11 Oct-12
Windows Mobile 6.5.3 Windows Phone 7 Windows Phone 7.5 (Mango) Windows Phone 8
u Enhanced finger-friendly UI
u Support for multi-touch
u Complete touch support
u Upgrade of the entire OS
u Integration of Xbox Live and Zune services
u Social and Productivity hubs
u Tile-based UI
u Support for multi-tasking and app
switching
u New communication features (group
contacts, threaded message view, Twitter
integration)
u Unified mailbox
u Enhanced search (Visual Search)
u App switching
u New start screen (resize live tile bars)
u Better browsing experience with IE10
u Tap + Send for sharing photos, websites,
contacts and other
u Update on the lock screen
u Word flow keyboard for fun and faster
typing
u Wallet for store cards and digital coupons
u Skype app integration
u Rooms for privately sharing a calendar,
photo album, group chat with other Source: Company data, Credit Suisse research
Waning developer traction but still waiting to see the impact from WP8. Windows Phone
Store now offers over 120,000 apps (up from around 40,000 at the start of 2012), which is
decent improvement. But more importantly, both Apple and Android have already crossed
700K mark, which shows that the gap on the apps content is increasing. We believe this
may be driven by developer interest remaining at high levels for both iOS and Android

07 January 2013
Handset Industry 2013 Outlook 60
platforms, while Windows Phone has seen falling level of developer interest (Exhibit 72).
Maybe this is something which could see some revival with the recent launch of WP8
platform, but it remains difficult to see how Microsoft/Nokia can break this vicious circle.
Exhibit 72: Can WP8 revive the falling interest in Windows Phone amongst developers?
0%
10%
20%
30%
40%
50%
60%
70%
80%
90%
100%
Jan 2010 Mar 2010 Jun 2010 Sep 2010 Jan 2011 Apr 2011 Jun 2011 Nov 2011 Jan 2012 May 2012 Aug 2012 Nov 2012
'Very Interested' in developing for each platform (over time)
iPhone (iOS) iPad (iOS) Android Phone Android Tablet Windows Phone BlackBerry Phone Windows 8 tablets Source: IDC Appcelerator Developer Survey (Q4 2012)
Windows Phone Store still missing a number of popular apps. While we acknowledge that
the total number of apps available on a store is less of a critical factor once the platform
supports a critical mass of apps used by consumers on a regular basis. Although Windows
Phone Store has seen an improvement in both the quantity and quality of apps being
offered and is now supporting a number of popular apps like Facebook, Twitter, Kindle and
Words with Friends, we would note that it still misses a number of other popular apps like
Instagram, Dropbox, Spotify, Pandora radio and YouTube to name a few. Given these
apps have been available on Apple and Android, this again shows apps developers’
preference to write for the latter two platforms vis-à-vis Windows Phone.
Windows 8 trying to catalyze the ecosystem, but will it succeed?
The Windows 8 product launch has been billed by Microsoft as the company’s most
important release in a generation. The release is supposed to bring the company forward
with a modern day’s operating system that is capable of renewing its efforts in the area of
mobile computing. However, despite the release and the related product launches, we
question the level of traction that the platform will garner in both smartphones and tablets.
WP8 smartphone launches – so far so good, but is it enough? Looking at the device
specifications of some of the new Windows Phone 8 smartphones launched by vendors
including Nokia, HTC and Samsung (as we see in Exhibit 73), we note that Microsoft has
worked upon improving some of the deficiencies in its smartphone offering. A clear
example of this is support for dual core processors in all the recent WP8 smartphone
models. While this is an improvement, competition is already on its way to support quad
core processors like Samsung in its high end Galaxy offering. In addition, we believe that
both iOS and Android continue to be way ahead of Windows Phone in terms of software
functionalities and services ecosystem.

07 January 2013
Handset Industry 2013 Outlook 61
Exhibit 73: Smartphones based on Windows Phone OS following recent WP8 device launches Vendor Samsung HTC HTC Nokia Nokia Nokia Nokia
Model Ativ S Windows Phone 8X Windows Phone 8S Lumia 920 Lumia 820 Lumia 810 Lumia 822
Image
Technology UMTS/GSM UMTS/GSM/LTE UMTS/GSM UMTS/GSM/LTE UMTS/GSM/LTE UMTS/GSM LTE/CDMA
Announced Aug-12 Sep-12 Sep-12 Sep-12 Sep-12 Oct-12 Oct-12
Shipping date Exp Q4 2012 Nov-12 Nov-12 Nov-12 Nov-12 Nov-12 Nov-12
Operating System WP8 WP8 WP8 WP8 WP8 WP8 WP8
Application Processor Dual Core 1.5GHz Dual Core 1.5GHz Dual Core 1GHz Dual Core 1.5GHz Dual Core 1.5GHz Dual Core 1.5GHz Dual Core 1.5GHz
RAM 1GB 1GB 512MB 1GB 1GB 1GB 1GB
Memory 32GB 16GB 4GB 32GB 8GB 8GB 16GB
Pixels 720 x 1280 720 x 1280 480 x 800 768 x 1280 480 x 800 480 x 800 480 x 800
Dimensions (w x h x d) (mm) 137.2 x 70.5 x 8.7 132.4 x 66.2 x 10.1 120.5 x 63 x 10.3 130.3 x 70.8 x 10.7 123.8 x 68.5 x 9.9 127.8 x 68.4 x 10.9 127.8 x 68.4 x 11.2
Weight (g) 135 130 113 185 160 145 142
Volume (cc) 84 89 78 99 84 95 95
Screen (in) 4.8 4.3 4.0 4.5 4.3 4.3 4.3
Megapixel 8.0 8.0 5.0 8.7 8.0 8.0 8.0
NFC yes yes no yes yes yes yes
Wi-Fi yes yes yes yes yes yes yes
GPS yes yes yes yes yes yes yes
Talk time (hrs) 14.8 12.0 NA 10.0 8.0 10.2 11.7
Standby time (hrs) 218 290 NA 400 330 360 400 Source: Company data, Credit Suisse research
Microsoft Surface tablets support decent feature set. Microsoft’s Surface tablets have an
impressive feature set that is on-par with devices currently available in the market. Both
versions (the Surface RT and the Surface Pro) feature a 10.6” ClearType HD display as
well as a built-in kickstand and a removable case that doubles as a keyboard. The Surface
RT runs on ARM, is available in 32GB or 64GB, and is slightly heavier than the latest iPad
at 652g. The Surface Pro uses an Intel Ivy Bridge Core i5 running Windows 8, will have a
USB 3.0 port, and will support the use of a stylus. The Surface Pro will, however, be
significantly heavier and thicker than competing tablets at 903g and 13.5mm respectively.
Exhibit 74: A slew of tablet refreshes and new product introductions through 2H12 Manufacturer Apple Apple Google/Samsung Google/Asus Amazon Amazon Microsoft Microsoft
Model iPad - 4th Generation iPad mini Nexus 10 Nexus 7 Kindle Fire HD 8.9 Kindle Fire HD Surface Windows RT Surface Windows 8 pro
Announced Oct-12 Oct-12 Oct-12 Jun-12 Sep-12 Sep-12 Jun-12 Jun-12
Form factor
Dimensions (w xhxd) mm 241.2 x 185.7x 9.4 200 x 134.7 x 7.2 264 x 178x 9 198 x 120 x 10.4 240 x 164 x 8.8 193 x 137 x 10.3 274.6 x 172 x 9.4 274.6 x 173 x 13.5
Volume (cc) 421 194 423 247 346 272 444 641
Weight (gm) 652 308 603 340 567 395 676 903
Display size (in) 9.7 7.9 9.7 7.0 8.9 7.0 10.6 10.6
Resolution 2048 x 1536 1024 x 768 2560 x 1600 1280 x 800 1280 x 800 1280 x 800 1366 x 768 1920 x 1080
Core internals
Processor
A6X chip w ith quad core
graphicsDual-core A5 1.7 Ghz Dual Core Quad Core Tegra 3 1.5 Ghz Dual Core 1.2 GhzDual Core ARM Ivy Bridge Core i5
Operating system iOS 6 iOS 6 Android 4.1 Android 4.1 Android 4.0 Android 4.0 Window s RT Window s 8 Pro
Memory (RAM) NA NA 2 GB 1 GB 1 GB 1 GB 2GB 4GB
Storage (f lash) 16/32/64 GB 16/32/64 GB 16/32GB 8/16 GB 16/32GB 16/32GB 32/64 GB 64/128 GB
Features
Cellular technology 4G LTE / 3G 4G LTE / 3G No No 4G LTE / 3G No N/A N/A
Rear Camera Yes Yes Yes No No No Yes Yes
Camera MP 5 MP / 1080p Video 5 MP / 1080p Video 5 MP / 1080p Video 1.2 MP / 720p Video 1.3 MP No 720p HD 720p HD + TruColor
Front-facing camera (MP) 1.2MP HD Camera 1.2MP Camera 1.9MP HD Camera Yes No No 720p HD 720p HD + TruColor
Wi-Fi 802.11 a/b/g/n 802.11 a/b/g/n 802.11 a/b/g/n 802.11 a/b/g/n 802.11 a/b/g/n Yes 802.11a/b/g/n 802.11a/b/g/n
GPS Yes Yes Yes Yes Yes NA N/A N/A
Bluetooth 4.0 4.0 4.0 Yes Yes NA Yes Yes
NFC No No Yes Yes No No No N/A
Battery life (hrs) 10 10 7 8 11 11 N/A N/A
USB No No Yes Micro USB Micro USB Micro USB Full size USB 2.0 Full size USB 3.0
Application Store Apple App Store Apple App Store Google Play Google Play Amazon Appstore Amazon Appstore Window s Store Window s Store
Price $499 - $899 $329 - $659 $399 - $499 $199 - $249 $299-$499 $199 $499 - $699 N/A Source: Company data, Credit Suisse estimates

07 January 2013
Handset Industry 2013 Outlook 62
Windows 8 portfolio may be see limited traction given price points and competition.
Microsoft has launched a massive marketing campaign to promote Windows 8, the
Surface tablet, and Windows Phone 8, reportedly with a budget as high as $1.8bn and an
expectation of generating 1.6bn impressions. Management believes that the ramp of
Windows 8 products will be fairly quick in the coming holiday season. The company
launched its new operating system on 60 model of products launched including desktops,
laptops, ultrabooks, tablets, and smartphones (from Nokia, HTC, and Samsung). While the
product set is extensive and spans the entire compute market, we see limited impact in the
overall compute and tablet markets given the price points in both segments (as highlighted
in Exhibit 74). Within tablets, $499 as starting price for the tablet with an additional $100
for the keyboard places Microsoft’s Surface in the same price point range as Apple’s iPad.
While Surface has some unique features compared to other tablets, past Android tablet
launches have shown us that it is very difficult to compete with iPad in the same price
range. In addition, Microsoft will also have to compete with iPad mini and a number of
Android tablets (with screen size ranging from 7” to 10”).

0
7 J
an
ua
ry 2
01
3
Ha
nd
se
t Ind
us
try 2
01
3 O
utlo
ok
6
3
Exhibit 75: Windows 8 portfolio – pricing remains a challenge for Microsoft in ultrabook and tablet markets
Acer 8 1 3 1 1 2 6.0 101 710 16.6 1,063 0 0 5 1 2 0
Asus 7 0 2 0 4 1 3.7 139 826 13.3 1,149 0 1 0 0 1 5
Dell 8 2 1 2 0 3 6.4 160 514 16.2 966 0 2 1 2 1 2
HP 9 1 3 0 1 4 8.0 32 1024 17.4 878 0 3 3 3 0 0
Lenovo 5 0 3 1 1 0 4.0 256 209 11.8 829 0 1 3 1 0 0
Microsoft 2 0 0 2 0 0 3.0 NA 96 10.6 499 0 1 0 0 0 1
Samsung 9 0 1 2 3 3 4.0 72 413 15.7 1,057 0 0 3 2 1 3
Sony 4 0 3 0 0 1 5.3 128 667 15.5 1,054 0 0 3 1 0 0
Toshiba 4 0 4 0 0 0 7.0 80 667 14.0 892 0 0 3 1 0 0
Vizio 4 0 2 0 0 2 5.5 192 1024 20.2 1,209 0 0 1 2 1 0
Total/Average 60 4 22 8 10 16 5.5 114.6 652.9 15.5 991 0 8 22 13 6 11
Average Price 1,362 910 649 879 1,122
High Price 1,649 1,599 850 1,199 1,900
Low Price 1,199 499 499 699 449
Price
(US$)Vendor # Models Ultrabook Laptop Tablet Hybrid Desktop
RAM
(in GB)
SSD
(in GB)
HDD
(in GB)
Screen
(inches) NA< $400
$400-
$700
$700-
$1000
$1000-
$1500 > $1500
1) Microsoft making a major marketing push around Windows 8. Microsoft has launched a massive marketing campaign to promote Windows
8, its Surface tablet, and Windows Phone 8 OS, expecting to generate 1.6bn impressions. Management believes that the ramp of Windows 8
products will be fairly quick in the coming holiday season.
2) Broad product portfolio launch. Microsoft released Windows 8 in late October and so far there are at least 60 models of products launched
running on the new system, including desktop, laptop, ultrabooks, tablets. Additionally we have seen smartphone launches from 3 major handset
vendors so far – Nokia, HTC and Samsung. The broad portfolio launch shows OEM’s embracement for the new ecosystem.
3) Limited stimulation on PC market. While the successful launch of Windows 8 has gained decent attraction from media, we think its impact on
the PC market growth will be limited due to the high price points of Windows 8 products. Most ultrabooks are priced above $1,000, which is on
par with Mac Air and much higher than iPad. Without meaningful discount compared to Apple’s products, we think ultrabooks and laptops are hard
to compete with and gain traction from consumers.
4) Tablet pricing remains a challenge. A $499 price for the tablet with an additional $100 for the keyboard make Microsoft’s Surface tablet in the
same price point range of iPad. While Surface has some unique features compared to other tablets, past Android tablet launches have shown us
that it is very difficult to compete with iPad in the same price range. We remain cautious on the outlook of Windows 8 tablet sales given the
dominant position Apple has in the 10” market, introduction of iPad Mini (8” screen) and aggressive pricing from 7” Android tablets.
Source: Company data, Credit Suisse estimates

07 January 2013
Handset Industry 2013 Outlook 64
BlackBerry on a slide – can BB10 revive it?
BlackBerry’s market share in the overall compute market continues to slide down (from 7%
in 2010 to 6%/3% in 2011/2012) given sharp declines in the smartphone market along with
the weak traction for its PlayBook device in the tablet market. Having already seen a
number of delays in the launch of its new smartphone operating system, the company has
finally announced that it is planning to launch its first two smartphones based on the new
BB10 platform in Jan 2013. Although there are limited details at this stage around these
devices, we have had a detailed look at the videos/reviews of the new OS and how it
works on BlackBerry Dev Alpha smartphone (released only for developers). Although we
acknowledge that the company is promising a number of improvements in its new OS, we
are skeptical on the future of BlackBerry software as its BB10 OS may prove to be too little
too late as the competing platforms in the market already support most of the new features.
Improvements coming with BB10, but maybe too little too late
Based on QNX, RIM’s new management believe that the new BB10 OS could make the
company’s portfolio competitive once again. While BB10 is still not available, the OS has
made a few appearances at developer events in the last few months, and although we
acknowledge that the new OS shows marked improvement vs. previous versions, we still
believe that it faces fierce competition from existing platforms such as Android and iOS,
given most of the features offered by new BB10 is already being offered by rivals, which
also benefit from presence of a strong ecosystem around their platforms. Some of the
software features supported by BB10 are:
Introducing ‘Flow’ with unified Hub application and ‘Peek’ feature. Within BB10, the
company is planning to introduce an improved UI which allows for seamless integration of
messages and notifications. It also allows for improved flow between screens and
applications (fading animation as one flicks from one screen to another). The BlackBerry
Hub app unifies all notifications from emails, texts, BBMs, third party messaging apps and
social media messages in one place and allows users to ‘peek’ at those notifications by
sliding from left to right (but not completely) without having to open the Hub application.
Exhibit 76: RIM’s BB10 OS shows marked improvement Exhibit 77: View of ‘Peek’ and ‘Active Frames’ on BB10
Source: Company Source: Company
Active Frames on homescreen. As shown on Exhibit 76, the main homescreen on BB10
allows users to have 16 apps on the screen at a time, with the option of adding additional
pages (similar to Android and iOS). Also users can save upto a maximum of 8 ‘Active
Frames’ (maximum of 4 on one single screen) which are essentially mini-apps, which give
summarized information from a particular app and keep running in the background for
latest updates.
True multi-tasking with ‘Cascades’. With apps running in the background, BB10 offers a
true multi-tasking on a smartphone/tablet. While difficult to gauge the impact on battery,

07 January 2013
Handset Industry 2013 Outlook 65
the demos show seamless switching between applications without start/stop lags, a
feature still not available on some platforms. Also ‘Cascades’ feature allows for quick
multitasking from within apps by showing all the app’s layers stacked up like a visual trail.
BlackBerry Balance for personal and work modes. Sweeping down on screen of the
device allows a user to switch between personal and work modes, fully sandboxed
partition (Exhibit 78). This gives enterprise complete control over content saved on the
work section of the device, along with full privacy for the user on the content stored on the
personal mode.
Improved touch keyboard. Given its history of strong keyboard design, RIM introduced a
new touchscreen keyboard that is adaptive. The keyboard features large keys, easy one
hand typing (predictive text), and gestures commands (like swiping the keyboard to delete
or jump to numbers/symbols).
Exhibit 78: ‘Balance’ partitions personal & work content Exhibit 79: A look at ‘Cascades’ and improved keyboard
Source: Company Source: Company
Refreshed browser. RIM has also refreshed the browser, which is based on Webkit and
also supports its new ‘peek’ feature and an inbuilt reader mode, which makes reading
more enjoyable by stripping out advertisements and other clutter from a webpage.
‘Time Shift’ mode in camera. BB10 will allow users to adjust the photo frame back in time.
An example is taking a photo while someone blinks, and being able to adjust the frame in
time to a desired point (eyes open).
BB10 has ambitions beyond smartphones and tablets
RIM has also demonstrated the ability to port BB10 outside of just smartphones and
tablets, as it can be integrated into cars (demo included a Porsche with integrated BB10).
The integrated design could allow for cars to receive over the air software upgrades. In
fact at RIM’s BlackBerry World event in May 2012, CEO Thorsten Heins noted that 60% of
all cars already use the QNX platform, which forms the core of BB10, and there is a clear
trend towards ‘connected car’ market.
Trying to expand the ecosystem, but BB App World is #4 in terms of apps
One of the critical measures that will be key in BB10’s success or failure will be the
support from developer community, and quality of ecosystem around BB10 platform. While
we acknowledge that it remains to be seen what level of developer support BB10 enjoys
when the platform is officially launched in Jan 2013, we would note that with BB7 and
predecessor platforms, apps support was quite weak.
Also revamping its BlackBerry App World with its OS. After first launching its app store in
April 2009, which has not met with a lot of success, RIM provided a much needed

07 January 2013
Handset Industry 2013 Outlook 66
improvement in an upgraded version of BlackBerry App World. In the new version demoed
in Sep 2012, the app store has similar look and feel to Google’s Play Store giving users
option to scroll through a vertical list of apps, and a carousel at the top placing certain
apps under temporary spotlight.
BlackBerry App World only has >105K apps vs. 700K for Apple and Android. One of the
important things to consider is that even after 3.5 years since launch, BlackBerry App
World had only over 105K apps (as of Sep 2012) as compared to Apple and Android, both
of which boast of over 700K apps currently, which shows the gap between these platform
when it comes to support from developer community. Although RIM has announced a
number of partnerships in 2012 with major developers to issue BB10 specific apps, we
remain of the view that with a new platform rolling out, developers would remain skeptical
in terms of allocating their resources towards writing apps for BB10, as can be seen from
Exhibit 72 which shows that developer interest in BB platform has fallen from 21% in Nov
2011 to 9% in Aug 2012. In addition, according to Flurry Analytics, the percentage of new
projects built by developers per mobile platform within Flurry continues to remain at a
mere 1% in Q212 (Exhibit 80), with iOS still maintaining its leading position with 67%
share. Also, yoy growth rate per platform for BlackBerry projects in Q2 2012 was only 13%,
much lower than iOS at 66%, Android at 82% and Windows Phone at 521%. Some of the
developer partnerships announced by RIM are:
■ Gameloft: Gameloft announced that it will issue 11 new games on the BB10 platform
including Shark Dash, The Oregon Trail, Nova 3, and Ice Age.
■ Pixelmags: Enables consumers to gain access to a number of digital publications and
magazines on mobile devices. As a part of the partnership with RIM, Pixelmags will
offer all BB10 users 10 free min a month to all of its digital content.
■ Mippin & Appcelerator: RIM is also working with app creation platforms Mippin and
Appcelerator to help developers create apps on their BB10 platform. Mippin has about
40K apps on its platform, while Appcelerator has about 50K.
■ Citrix: In combination with BB10 rollout, Citrix is enabling full remote log in on BB10
devices. A user is able to connect the tablet/smartphone to a keyboard and monitor
and enable secure remote.
Exhibit 80: New project starts for BlackBerry at Flurry remains low at mere 1% in Q2 2012
iOS, 71%
Android, 27%
Windows Phone, 1%
BlackBerry, 1%
New Project Starts at Flurry (Q2 2011)
iOS, 67%
Android, 28%
Windows Phone, 4%
BlackBerry, 1%
New Project Starts at Flurry (Q2 2012)
Source: Flurry Analytics (Q2 2012)

07 January 2013
Handset Industry 2013 Outlook 67
Smartphones – winners and losers The significant market opportunity associated with smartphones has not gone unnoticed
and is attracting a raft of new competitors. The fact that the market is quickly approaching
the 1bn unit mark and $270bn+ in size is attracting more competitors from adjacent
technology segments, as smartphones provide a computing experience that, to a degree,
overlaps with PCs, netbooks and notebooks. Chipset companies such as Qualcomm can
deliver scale to all OEMs, while reliable high quality operating systems such as Android
and Windows Phone make software expertise less of a barrier. These factors break down
barriers to entry and accelerate the competitive dynamics in the industry.
A rising market will lift all players, but what investors really care about is who will
dominate. In addition, market share gains should no longer be viewed in the traditional
sense of simply higher volumes, or by hardware design and technology alone. Now, the
ability to monetize services needs to be addressed. Also, is a vertically integrated
business model such as Apple/RIM more or less viable versus the horizontal
considerations proposed by Android? The final question is, therefore, what is needed to
succeed in this ‘ever changing smartphone world’? Against this backdrop, the key issue
then becomes what it takes to win the smartphone market. We have already discussed in
the previous section the importance of platforms and the overall compute market. We
believe that for smartphone manufacturers, there are nine key success factors, which are
highlighted in Exhibit 81.
We rank each vendor with a score out of 10 for each of these metrics objectively. We also
recognize that many vendors are currently in a state of flux, with continually evolving
strategies and, as such, have sought to try to quantify the maximum scope for
improvement. Ultimately, our conclusions shape our view as to how each vendor is
positioned for the market evolution, and which vendors are likely to take share in the
smartphone and associated services profit pools. We outline our key conclusions for each
vendor in the industry in this section.

0
7 J
an
ua
ry 2
01
3
Ha
nd
se
t Ind
us
try 2
01
3 O
utlo
ok
68
Exhibit 81: Credit Suisse smartphone vendor scorecard – Apple and Samsung lead in 1st
and 2nd
place respectively
Scorecard methodology: We believe that there are 9 key metrics insmartphone industry today. As such, we have ranked smartphone vendorson each of these metrics. In addition, we have weighted each metricdepending on the relative importance to arrive at our score for vendors:
Apple: Apple maintains its #1 rank with a score of 8.6/10. Apple scoresvery high on Software, Services, Cloud offering and Compute Convergence,along with strong Brand and Distribution scores. We believe areas wherethere is scope for improvement are IPR and Chipset Efficiency.
Samsung: Samsung ranks #2, as the company benefits from its broadportfolio across price points, strong distribution, Brand and Android focusedOS strategy. A differentiated Services offering and IPR remain weak points.
Nokia: Nokia maintain its position at #3, driven by strong distribution andIPR, coupled with an improving software and services offering as thecompany transitions its smartphone portfolio to Windows Phone. The lack ofa cloud offering and compute convergence remains major shortcomings.
HTC: HTC ranks #4 as the company gets mediocre scores across mostmetrics and weak scores on IPR, Cloud, Brand and Compute Convergence.
Huawei: Huawei ranks #5 with weak scores in Cloud, ComputeConvergence and Brand being offset by reasonable scores for distributionand Product Portfolio. Relative to the company’s #9 position in terms ofvalue share, the company’s #5 ranking suggests share gains ahead.
Motorola: Motorola scores #6 also with mediocre scores across all metrics.While the company gets a Software score in-line with Android peers, itscores poorly on Cloud given the lack of a meaningful offering.
Sony: Sony, following the split of the Sony-Ericsson JV ranks #7 on ourscorecard and despite being focused on Android, the vendor suffers fromlimited distribution, lack of a Cloud offering and a weak IPR position.
LG: LG ranks at #9 (after ZTE at #8) on our scorecard with particularlyweak scores in Cloud, Compute Convergence, Brand, Distribution, and IPR.This limits a share recovery in our view.
RIM: RIM slides down to #10 position with strength in Distribution beingmore than offset by a weak Cloud offering, IPR, Chipset, ComputeConvergence position, and Software position (pending the launch of BB10devices in early 2013). This suggests continued share loss ahead.
Note: All scores are based on a scale of 1 to 10, with 10 being the best, and 1 being the lowest score
Source: Gartner, Company data, Credit Suisse estimates
Smartphones Weighting Apple Samsung Nokia HTC Huawei Motorola Sony ZTE LG RIM Lenovo
Software 25% 9.0 7.2 7.5 7.2 7.2 7.2 7.2 7.2 7.2 5.3 7.2
Services 15% 8.4 7.4 6.0 7.4 7.4 7.4 7.4 7.4 7.4 5.6 7.4
Cloud 5% 9.5 5.0 4.5 5.0 5.0 5.0 5.0 5.0 5.0 2.0 5.0
Product Portfiolio 15% 8.0 8.0 5.0 7.0 5.0 5.5 5.5 5.0 4.0 4.0 3.0
Distribution & Supply Chain 10% 9.0 8.8 7.5 5.3 6.5 4.5 3.3 5.5 3.5 6.5 2.3
Compute Convergence 5% 10.0 6.5 0.0 2.0 3.0 2.0 4.0 3.0 2.0 3.0 4.0
Brand 10% 9.0 8.0 5.5 4.5 2.5 3.5 4.0 2.5 3.0 6.0 1.5
IPR 10% 6.0 5.5 9.0 2.0 5.0 6.5 4.0 4.0 3.5 4.5 1.0
Chipset efficiency 5% 7.0 7.0 6.0 4.0 5.5 5.5 3.5 3.0 5.0 4.0 1.0
Total Score 100% 8.6 7.3 5.8 5.7 5.6 5.6 5.5 5.4 5.0 4.8 4.5
% score 86% 73% 58% 57% 56% 56% 55% 54% 50% 48% 45%
Overall Rank 1 2 3 4 5 6 7 8 9 10 11
Unit share (2012E) 18.9% 29.1% 5.2% 4.5% 3.9% 2.7% 3.3% 3.8% 3.6% 4.6% 2.9%
Rank 2 1 3 5 6 11 9 7 8 4 10
Value share (2012E) 37.9% 27.0% 3.4% 4.5% 2.2% 2.7% 3.0% 2.1% 2.6% 3.3% 1.6%
Rank 1 2 4 3 9 7 6 10 8 5 11
Source: Gartner, Company data, Credit Suisse estimates

07 January 2013
Handset Industry 2013 Outlook 69
Apple – maintaining its share in fast growing market
More than five years after the first iPhone launch, we believe that few handset vendors
come close to the quality of its hardware, software, and services of the Apple product. In
particular, we believe the success of iTunes and App Store are examples of the potential
of new initiatives like iBooks and iAd. With Apple’s growing ecosystem of services further
enhanced by iCloud, consumer attraction and developer loyalty remains strong. The iPad
and its success also confirms the affinity of Apple users and will likely serve to keep
Apple’s market share stable in the smartphone space, something that is atypical in the
handset space. These factors are key to our determination of Apple’s first place ranking in
our scorecard of smartphone vendors.
Despite the strong growth in the low end of the smartphone market, we believe that Apple
will maintain its global smartphone share at around 19-20% over 2012/2013, driven by
distribution led growth especially in international markets. We would highlight several key
drivers in favour of Apple’s ability to maintain its smartphone share:
Exhibit 82: Apple’s smartphone share by region – maintaining its share at around 19-20%
Apple Share 2010 2011 2012E 2013E Apple Units (mn) 2010 2011 2012E 2013E
North America 23.5% 30.8% 38.0% 38.0% North America 16.9 33.0 45.9 51.6
Western Europe 17.6% 21.8% 24.5% 26.5% Western Europe 15.1 21.2 27.9 35.1
Japan 15.5% 20.7% 24.0% 28.0% Japan 2.8 5.2 7.7 10.0
China 6.4% 9.9% 11.8% 13.0% China 1.8 7.7 23.1 37.5
India 0.3% 2.5% 1.3% 1.5% India 0.0 0.3 0.3 0.6
Korea 23.2% 12.6% 7.0% 12.5% Korea 1.7 2.6 1.5 3.0
Other APAC 20.5% 26.0% 24.0% 29.0% Other APAC 6.0 12.7 17.3 30.1
Brazil 7.1% 10.2% 10.5% 13.0% Brazil 0.4 1.0 1.9 3.5
Mexico 6.8% 8.4% 8.5% 12.0% Mexico 0.2 0.8 1.3 2.7
Other LatAm 4.4% 4.0% 6.3% 7.0% Other LatAm 0.4 0.6 1.5 2.6
Russia 7.8% 5.8% 6.0% 8.0% Russia 0.3 0.5 0.9 1.7
Other Central & E. Europe 4.6% 7.4% 7.5% 10.0% Other Central & E. Europe 0.4 0.9 1.5 2.9
Middle East & Africa 3.2% 9.9% 9.8% 12.0% Middle East & Africa 0.6 3.0 4.5 9.3
Global smartphone share (%) 15.6% 18.9% 18.9% 19.5% Global smartphone share (%) 15.6% 18.9% 18.9% 19.5%
Smartphone Units (mn) 46.6 89.3 135.2 190.7 Smartphone Units (mn) 46.6 89.3 135.2 190.7
Source: Gartner, Company data, Credit Suisse estimates
Innovation on multiple fronts. Aside from just the company’s differentiation on software, we
are of the opinion that perhaps Apple’s key competitive advantage in the smartphone
segment is the ability to complement this with its vast product line up i.e. the iPad, Macs,
as well as a potential move into the TV market long term. This creates stickiness to the
platform that few others can replicate.
Carrier expansion – next 50 carriers in EMs could add over 75mn units per year. Having
looked at the telecom market by carrier, we create a list of top 50 carriers in EMs (in terms
of mobile subscriptions) where Apple still does not have any carrier relationship for selling
the iPhone. Using the framework below, we estimate that addressing these carriers is
likely to drive an incremental 75mn iPhone units annually for Apple in the long term.
■ Top 50 unaddressed carriers in EMs support 1.8bn mobile subs. Put together, these
top 50 carriers account for 1.8bn mobile subscriptions, as we show in Exhibit 84. We
expect this number to grow to 2.3bn by 2015. As a reminder, 2.3bn subscriptions will
account for over 35% of the global subscriber base in 2015. This shows that Apple can
significantly expand its opportunity in EMs by simply addressing these carriers. While
the iPhone is selling with China Unicom and China Telecom, we expect distribution to
possibly expand further covering China Mobile at some point in future. Clearly, China
Mobile is the largest carrier here with over 700mn subscriptions and it remains to be
seen how and when Apple will address such an important carrier.

07 January 2013
Handset Industry 2013 Outlook 70
Exhibit 83: iPhone is now selling with over 250 carriers in over 105 countries Quarterly progression of number of carriers and countries where iPhone is being sold
Calendar quarter # of countries # of carriers
Q2 2012 >100 >250
Q1 2012 >100 >230
Q4 2011
Q3 2011 105 230
Q2 2011 105 228
Q1 2011 90 186
Q4 2010 90 185
Q3 2010 89 166
Q2 2010 88 154
Q1 2010 88 151
Q4 2009 86 Added 17 new carriers
Q3 2009 80+
Q2 2009 80+
Q1 2009 81
Q4 2008 70
Q3 2008 51
Source: Company data, Credit Suisse research
■ High end of handset market is around 15% of industry volumes. We estimate that the
high end of the handset market (devices priced at more than $400) will account for
15% of total volumes in 2012. Based on a subscription base of 2.3bn users not
currently addressed by Apple, and assuming a 50% replacement rate for high-end
devices, we estimate that Apple has the potential to address an incremental 175mn
subscribers by extending its relationships for iPhone with these top 50 carriers in EMs.
■ Around 75mn incremental iPhone units annually. We estimate the iPhone to have
around 45% market share in the handset market priced at more than $400. Using this,
we work out that Apple can potentially sell around 75mn iPhones per year if it starts
supplying these 50 carriers as seen in Exhibit 84.
Exhibit 84: The next 50 carriers could add over 75mn units per year
Additional iPhone Opportunity with top 50 unserved carriers Long term
# of subscriptions at top 50 carriers not covered by Apple (in emerging markets) 2,306
% of global subscriptions 37%
Handsets at > $400 ASP as % of total market 15%
Handset replacement rate (%) 50%
Opportunity from expanding distribution in underserved markets 176
Apple's market share in handsets > $400 ASP (%) 44%
Potential opportunity for Apple (mn) 76
Source: Credit Suisse estimates
A low end iPhone at some point? We maintain our view that Apple at some point will need
to consider a lower price product for several reasons:
■ Saturation at some point in the high end. Apple has gained significant smartphone
share over the period 2007-2012 and we believe the company is likely to maintain its
smartphone share at around 19-20% going forward. However, with Apple already
having around 60-70% share in the $500+ smartphone segment, which we assume to
remain stable going forward, we believe that iPhone volumes at more than $500+ ASP
segment could peak in the range of 150mn units per year. Although we assume some
share gains (in the range of 15-20%) for Apple in the $350–$500 ASP market driven
by older discounted iPhone models (iPhone 4/4S), we still believe that strong growth in
the lower end of the smartphone market will result in declining smartphone share for

07 January 2013
Handset Industry 2013 Outlook 71
Apple in the long term. Given that we expect the smartphone market in the price range
of $200-350 to grow from 165mn in 2011 to over 325mn by 2015, we believe it will be
difficult for Apple to ignore this segment of the market much longer.
Exhibit 85: Apple’s share may peak at 20% in the absence of a low end iPhone model
Global smartphone units (mn) 2008 2009 2010 2011 2012E 2013E
<= $50 0 1 1 0 0 0
$50 - $100 0 0 6 5 7 21
$100 - $150 0 8 26 24 36 61
$150 - $200 5 20 48 59 93 160
$200 - $250 17 15 55 72 115 139
$250 - $300 20 24 18 40 64 74
$300 - $350 19 36 26 52 67 77
$350 - $400 23 11 23 32 37 45
$400 - $450 5 9 29 42 58 76
$450 - $500 29 9 14 29 44 62
> $500 21 40 53 119 195 259
Total 139 172 299 473 716 976
Apple share (%) 2008 2009 2010 2011 2012E 2013E
<= $250 0% 0% 0% 0% 0% 0%
$250 - $300 0% 0% 0% 0% 0% 0%
$300 - $350 0% 0% 0% 0% 0% 6%
$350 - $400 9% 0% 6% 5% 10% 20%
$400 - $450 0% 0% 0% 5% 10% 20%
$450 - $500 0% 0% 24% 10% 17% 18%
> $500 45% 63% 79% 69% 61% 58%
Total 8% 15% 16% 19% 19% 20%
Source: Company data, Credit Suisse estimates
■ Android now selling nearly 4:1 vs. iPhone. With Android smartphones having sold
nearly as much as 4x vs. Apple iPhone in 9M2012, we believe Apple will keep a close
eye on competition from Google, not only in the smartphone space but also tablets.
Indeed as we discuss in an earlier section, we note that Apple’s share of the compute
market will be only 22% in volume terms long term in spite of success in
smartphones/tablets, which means that the most practical means of gaining further
share will be through a low end product.
Exhibit 86: Android smartphones have outsold Apple by nearly 4:1 so far in 2012
0
25
50
75
100
125
150
Q109 Q209 Q309 Q409 Q110 Q210 Q310 Q410 Q111 Q211 Q311 Q411 Q112 Q212 Q312
Nu
mb
er
of
sm
art
ph
on
es
sh
ipp
ed
per
qu
art
er
(mn
)
Android smartphone units (mn) Apple smartphone units (mn) Source: Gartner, Credit Suisse research

07 January 2013
Handset Industry 2013 Outlook 72
Samsung – targeting all price tiers, a strong #2
We expect the strong smartphone growth seen by Samsung in 2011/2012 to continue and
believe the company will capture significant volume share within the industry. We believe
the company can achieve smartphone share of 32% by 2013 given several factors:
Exhibit 87: Samsung’s smartphone share gains to continue into 2013
Samsung Share 2010 2011 2012E 2013E Samsung Units (mn) 2010 2011 2012E 2013E
North America 9.8% 15.7% 26.5% 30.6% North America 7.1 16.8 32.0 41.5
Western Europe 9.6% 22.9% 39.0% 41.5% Western Europe 8.3 22.2 44.5 55.0
Japan 1.8% 6.3% 8.0% 17.5% Japan 0.3 1.6 2.6 6.3
China 4.4% 18.8% 17.5% 20.7% China 1.2 14.6 34.4 59.6
India 5.0% 25.1% 43.5% 42.5% India 0.5 3.3 9.0 17.3
Korea 45.4% 55.7% 62.5% 57.5% Korea 3.2 11.4 13.1 13.8
Other APAC 8.4% 16.3% 32.0% 35.5% Other APAC 2.5 7.9 23.1 36.8
Brazil 9.6% 17.0% 37.5% 40.0% Brazil 0.5 1.6 6.7 10.9
Mexico 12.1% 17.3% 25.0% 32.5% Mexico 0.4 1.6 3.8 7.3
Other LatAm 9.9% 20.6% 37.0% 42.5% Other LatAm 0.9 3.1 8.9 16.0
Russia 2.5% 12.9% 37.0% 39.0% Russia 0.1 1.1 5.9 8.2
Other Central & Eastern Europe 2.8% 6.3% 46.5% 48.5% Other Central & Eastern Europe 0.3 0.7 9.3 14.0
Middle East & Africa 1.1% 8.0% 32.5% 37.0% Middle East & Africa 0.2 2.4 15.0 28.7
Global smartphone share (%) 8.5% 18.7% 29.1% 32.3% Global smartphone share (%) 8.5% 18.7% 29.1% 32.3%
Smartphone Units (mn) 25.4 88.3 208.1 315.3 Smartphone Units (mn) 25.4 88.3 208.1 315.3
Source: Gartner, Company data, Credit Suisse estimates
A broad smartphone portfolio with some innovations. Samsung’s product portfolio includes
a broad range of devices across various price points. The company has seen success
both in the entry level (Galaxy Ace, Pocket, Music) and high end (Galaxy SIII, Note II)
under the banner of its Galaxy branded smartphones. In addition, the company has also
enjoyed success in its experiment with launching bigger screen size smartphones like
Galaxy Note II which supports a 5.5” touchscreen. Also driven by the success of its Galaxy
SIII smartphone, it has recently introduced Galaxy SIII mini aimed at mid-end of the
market as the device supports smaller screen size (4” vs. 4.8” on Galaxy SIII) and 1GHz
dual core processor (vs. 1.4GHz quad-core used in Galaxy SIII).
Exhibit 88: Samsung has a broad range of smartphone offerings Vendor Samsung Samsung Samsung Samsung Samsung Samsung Samsung
Model Galaxy Discover Galaxy SIII mini Galaxy Music Duos Galaxy SIII Galaxy Pocket Duos Note II Ativ S
Image
Technology UMTS/GSM UMTS/GSM UMTS/GSM UMTS/GSM/LTE UMTS/GSM UMTS/GSM/LTE UMTS/GSM
Announced Nov-12 Oct-12 Oct-12 Sep-12 Aug-12 Aug-12 Aug-12
Shipping date Nov-12 Nov-12 Exp Dec 2012 Sep-12 Sep-12 Sep-12 Exp Q4 2012
Operating System Android 4.0 Android 4.1 Android 4.0 Android 4.1 Android 2.3 Android 4.1 WP8
Application Processor 800MHz Dual Core 1GHz 850MHz Quad Core 1.4GHz 832MHz Quad Core 1.6GHz Dual Core 1.5GHz
RAM 512MB 1GB 512MB 2GB 512MB 2GB 1GB
Memory 4GB 16GB 4GB 16/32/64GB 3GB 16/32/64GB 32GB
Pixels 320 x 480 480 x 800 240 x 320 720 x 1280 240 x 320 720 x 1280 720 x 1280
Dimensions (w x h x d) (mm) 112.8 x 61.5 x 11.5 121.6 x 63 x 9.9 110.1 x 59 x 12.3 136.6 x 70.6 x 8.6 103.9 x 57.9 x 13 151.1 x 80.5 x 9.4 137.2 x 70.5 x 8.7
Weight (g) 122 112 107 131 103 183 135
Volume (cc) 80 76 80 83 78 114 84
Screen (in) 3.5 4 3 4.8 2.8 5.5 4.8
Megapixel 3.2 5.0 3.2 8.0 2.0 8.0 8.0
NFC no yes no yes no yes yes
Wi-Fi yes yes yes yes yes yes yes
GPS yes yes yes yes yes yes yes
Talk time (hrs) 7.4 7.2 6.0 11.0 6.0 16.0 14.8
Standby time (hrs) 440 430 370 390 370 890 218 Source: Company data, Credit Suisse research

07 January 2013
Handset Industry 2013 Outlook 73
New range of Galaxy devices are selling in volumes. Reviews for Galaxy S III and Note II
are amongst the most positive seen for any of the Samsung smartphones in the past.
Distribution for these device is also strong, as Galaxy SIII is shipping with over 290
carriers globally compared to 140 carriers for Galaxy SII. Samsung recently noted that it
has already crossed 30mn unit mark for Galaxy SIII in the first week of Nov 2012 in the
first five months of device launch. In addition, it has shipped over 3mn units for Note II
device in just over a month of shipping (as of Nov 2012).
Exhibit 89: Samsung's $400+ portfolio gaining a lot of traction, driven by SIII and Note II
0
5
10
15
20
25
30
35
40
Galaxy S Galaxy S II Galaxy S III Galaxy Note I Galaxy Note II
Un
its
(m
n)
Source: Company data, Credit Suisse estimates
Robust distribution. An additional strength that Samsung has is that the company already
has a distribution network in place covering both direct and indirect channels. The
company has a strong distribution network in all key geographic regions with both carriers
and retailers.
Addressing the compute market effectively. With the company extending its Galaxy brand
(Galaxy Tab, Galaxy Note and Galaxy line of smartphones) and given Samsung’s heritage
in both mobile devices and PCs, we expect the company to become a major player in the
compute market in the long term. Although we see Samsung is also extending support to
Windows 8 and WP8 platforms (launch of Ativ S smartphone along with plans to ship
19mn laptops and tablets running Windows 8 in 2012), we believe that Android will
continue to be the dominant platform for the company especially for smartphones.
Some differentiation vs. rival Android vendors gives Samsung the edge. The major
obstacle facing Samsung especially in the long run remains the need for differentiation
from other Android vendors. Although the company so far has enjoyed an edge vs. other
Android vendors driven by its scale, vertical integration, component quality (display
screen) and more recently introduction of new features in addition to already available
ones on Android, it needs to maintain this lead vs. rival Android vendors to avoid
becoming yet another commoditized hardware company longer term.
■ Motion-based features add unique element to Galaxy SIII. Samsung’s customized OS
includes several unique motion-based features that function as shortcuts in its Galaxy
SIII. These features include Direct Call, which places a call from a text message
conversation by simply lifting the phone to your ear (Exhibit 91), and Instant Muting
which mutes incoming calls by placing your hand over the screen or turning the phone
over. Tilt Zooming also allows users to scroll around zoomed in images by tilting the
phone in any direction.

07 January 2013
Handset Industry 2013 Outlook 74
Exhibit 90: New motion controls in Samsung Galaxy SIII… Exhibit 91: …offer some differentiation vs. Android rivals
Source: Company data Source: Company data
■ Photo app boasts several innovative features. The photo app on Galaxy SIII comes
with several innovative features including burst mode, the ability to recognize faces,
and Buddy Share. Burst mode takes 8 photos in rapid succession, then allows the
user to scroll through for the best shot before deleting the rest. The application
automatically recognizes faces in photos and matches the name with the face if they
have previously been tagged on the device. Buddy Share allows the user to easily
send a photo to tagged friends with just a few simple clicks.
■ S Voice has high aspirations, but is still rough around the edges. S Voice is
Samsung’s answer to the iPhone’s Siri as it provides voice-activated personal
assistant services. The application is capable of composing memos, text messages,
and emails, can get the weather, and search the internet. It can also launch
applications and place and answer calls, among many other features.
Some litigation risks coming to the fore. Patent litigation has been one area which has
been in limelight especially over the last couple of years with companies trying to either
defend or aggressively monetize their portfolio of patents. Given the success Samsung
has seen since 2011 (its smartphone market share has risen from 9% in 2010 to around
30% in 2012), we have seen the company being embroiled in a number of patent
litigations globally.
■ Samsung vs. Apple. In Aug 2012, a federal court jury in the US determined that
Samsung was infringing on 6 of 7 patents in question (mainly related to design and
software) and awarded $1.05bn as damages to Apple. Both these companies have
been engaged in patent battles in a number of countries including Korea, Japan,
Germany, Australia, UK, Netherlands, France and Italy. Since the US judgment, the
rulings in other countries have been mixed for Apple, with Samsung having an upper
hand in Korea, Japan and UK. With both companies adding more devices from each
other in their ongoing patent litigation claims, this battle between these two companies
will continue to become more complicated.
■ Ericsson filing a lawsuit Samsung. In Nov 2012, Ericsson filed a patent infringement
lawsuit against Samsung claiming after despite spending nearly 2 years in trying to
reach patent negotiations, Samsung has declined to renew its license to Ericsson’s
portfolio of patents on FRAND terms. As a reminder, Samsung had previously
licensed Ericsson’s patents in 2001 and renewed in 2007, but its license has now
expired, and talks around renewal have failed.
Nokia – further share loss ahead
Our view remains that Nokia will continue to see further smartphone share as its share
slides to 2% in 2013 down from 5% in 2012. This is driven by our view around traction for

07 January 2013
Handset Industry 2013 Outlook 75
WP8 OS to remain weak and also gradual rollout of new Windows smartphones from
Nokia as it tries to be more effective with its marketing and sales efforts behind new Lumia
phones. Although the quality of new WP8 OS is much improved compared to previous
versions, we believe that iOS and Android are still superior compared to WP8 OS and with
lack of strong developer support, Windows Phone may see limited traction even in 2013.
Exhibit 92: Nokia’s smartphone share to decline further to 2% in 2013
Nokia Share 2010 2011 2012E 2013E Nokia Units (mn) 2010 2011 2012E 2013E
North America 2.3% 0.9% 1.1% 0.9% North America 1.7 0.9 1.3 1.3
Western Europe 35.1% 17.0% 6.3% 1.0% Western Europe 30.2 16.5 7.2 1.3
Japan 0.0% 0.0% 0.0% 0.0% Japan 0.0 0.0 0.0 0.0
China 69.2% 28.6% 4.1% 2.0% China 19.2 22.2 8.1 5.8
India 72.5% 45.9% 11.0% 3.5% India 6.6 6.0 2.3 1.4
Korea 0.5% 0.1% 0.1% 0.1% Korea 0.0 0.0 0.0 0.0
Other APAC 48.1% 19.7% 6.0% 2.0% Other APAC 14.2 9.6 4.3 2.1
Brazil 47.3% 32.4% 8.3% 3.5% Brazil 2.4 3.0 1.5 1.0
Mexico 32.7% 16.6% 6.0% 1.5% Mexico 1.1 1.5 0.9 0.3
Other LatAm 35.3% 17.1% 8.0% 1.5% Other LatAm 3.2 2.6 1.9 0.6
Russia 69.8% 51.8% 14.5% 6.0% Russia 2.5 4.3 2.3 1.3
Other Central & Eastern Europe 77.4% 52.8% 10.5% 5.0% Other Central & Eastern Europe 7.3 6.2 2.1 1.4
Middle East & Africa 73.4% 38.9% 11.8% 2.7% Middle East & Africa 13.7 11.7 5.4 2.1
Global smartphone share (%) 34.2% 17.9% 5.2% 1.9% Global smartphone share (%) 34.2% 17.9% 5.2% 1.9%
Smartphone Units (mn) 102.2 84.6 37.3 18.5 Smartphone Units (mn) 102.2 84.6 37.3 18.5
Source: Gartner, Company data, Credit Suisse estimates
Nokia’s hardware offering surprisingly lacks iPhone and Galaxy SIII. Although we believe
that hardware feature set is becoming less of a differentiating factor in the smartphone
market, it still remains important to be competitive vs. rival offerings. Looking at Lumia 920,
we believe that both iPhone 5 and Samsung Galaxy SIII have set the benchmark in this
space with a number of improvements vs. earlier models.
■ Samsung the clear leader in processor speeds. The Lumia 920 supports Qualcomm’s
dual-core 1.5GHz Snapdragon S4 processor. In terms of specs, although this is
slightly faster than the iPhone 5’s 1.2GHz dual-core processor but Samsung already
has support for quad-core processor in its Galaxy SIII models sold outside the US
(which run its internally designed Exynos processor).
■ Nokia behind in device weight and thinness. One area where we believe Nokia lacks
significantly in hardware is the thinness and weight of its new devices. The Lumia 920
weighs 185g, which is significantly higher than the weight of iPhone 5 (at 112g),
Galaxy S3 (at 131g) and even HTC 8X (at 130g). Also in terms of device thinness,
Lumia 920 is 10.7mm thick, whereas iPhone 5 is only 7.6mm thick and Galaxy SIII at
8.6mm (Exhibit 93).
■ Inching towards Samsung in screen size. In terms of screen size, we see that
Samsung is clearly ahead of competition with Galaxy SIII supporting 4.8” touchscreen,
significantly bigger than iPhone 5 at 4” and even Lumia 920 at 4.5”.
■ Wireless charging is something different. Within the Lumia 920, users have the option
of charging the phone when near a wireless charging accessory, without any need to
plug it in. Nokia has also been using a common standard for wireless charging which
means it could be compatible with other brands’ charging systems.

07 January 2013
Handset Industry 2013 Outlook 76
Exhibit 93: Nokia’s Lumia 920 is lacking in certain hardware features when compared to iPhone 5 and Galaxy SIII Detailed specifications of Nokia Lumia 920 vs. flagship smartphones from competing vendors Vendor Nokia HTC Samsung Samsung Apple LG
Model Lumia 920 Windows Phone 8X Galaxy SIII Ativ S iPhone 5 Nexus 4
Image
Technology UMTS/GSM/LTE UMTS/GSM/LTE UMTS/GSM/LTE UMTS/GSM UMTS/GSM/LTE UMTS/GSM
Announced Sep-12 Sep-12 Sep-12 Aug-12 Sep-12 Oct-12
Shipping date Nov-12 Nov-12 Sep-12 Exp Q4 2012 Sep-12 Nov-12
Operating System WP8 WP8 Android 4.1 WP8 iOS6 Android 4.2
Application Processor Dual Core 1.5GHz Dual Core 1.5GHz Quad Core 1.4GHz Dual Core 1.5GHz Dual Core 1.2GHz Quad Core 1.5GHz
RAM 1GB 1GB 2GB 1GB 1GB 2GB
Memory 32GB 16GB 16/32/64GB 32GB 16/32/64GB 8/16GB
Pixels 768 x 1280 720 x 1280 720 x 1280 720 x 1280 640 x 1136 768 x 1280
Dimensions (w x h x d) (mm) 130.3 x 70.8 x 10.7 132.4 x 66.2 x 10.1 136.6 x 70.6 x 8.6 137.2 x 70.5 x 8.7 123.8 x 58.6 x 7.6 133.9 x 68.7 x 9.1
Weight (g) 185 130 131 135 112 139
Volume (cc) 99 89 83 84 55 84
Screen (in) 4.5 4.3 4.8 4.8 4 4.7
Megapixel 8.7 8.0 8.0 8.0 8.0 8.0
NFC yes yes yes yes no yes
Wi-Fi yes yes yes yes yes yes
GPS yes yes yes yes yes yes
Talk time (hrs) 10.0 12.0 11 14.8 8 15
Standby time (hrs) 400 290 390 218 225 390 Source: Company data, Credit Suisse research
WP differentiation is not well understood by consumers. With WP7.5 OS, Nokia launched
a range of aggressively priced smartphones (Lumia 900/800/710/610) during 2012,
however the company was not able to transfer this into meaningful market share. This was
either due to lack of consumer understanding around the Windows Phone platform or
weak support from carriers globally. The experience from WP7.5 clearly demonstrates
challenges around launching a viable third ecosystem in the smartphone market.
WP8 offers more differentiation…but a slow roll out. With the launch of Windows Phone 8
OS, Nokia is looking to differentiate in areas of display resolution, higher quality (multi-
core) processors, superior imaging integration as well improved location based services,
all of which have been integrated in its new devices (Lumia 920/820). However, the
company has emphasized that it plans to launch WP8 smartphones in a targeted manner,
which will allow its commercial marketing efforts to be more effective. Our concern is that it
will take some time for Nokia to ramp its upcoming WP8 portfolio and even if it is
competitive, it may mean that any potential recovery in its smartphone share remains a
2H13 prospect.
“We expect Q4 to continue the transition as we begin to ramp up sales of the Lumia
820 and the Lumia 920. We expect both products to start selling in November. As we
bring our new products into the market we are planning a deliberate rollout where we
focused our sales and marketing resources in select markets to key operator
partnerships.” – Stephen A. Elop, President and CEO, on Nokia’s Q312 earnings call
Nokia also adding software/services to WP8. In addition to features being offered by WP8,
Nokia has also introduced new software and services linked to mapping, imaging and
music that will be available on its new Lumina range.
■ Improved Maps. Given its ownership of Navteq, Nokia has increased its navigation
feature set to include voice guided turn by turn navigation with Nokia Drive. The
company also launched its public transportation navigation offering, Nokia Transport,
which provides walking distance between stops in public transit and indoor navigation
of stations. In addition, Nokia will offer full functionality while offline.

07 January 2013
Handset Industry 2013 Outlook 77
Exhibit 94: Nokia Drive allows for turn-by-turn navigation Exhibit 95: Nokia Transport for public transport navigation
Source: Company data Source: Company data
■ Lens Apps. As Nokia integrates its PureView technology into the new hardware, it has
also developed a number of preloaded apps to take advantage of the lens with Lens
Apps. Some of apps include:
o Nokia City Lens: Provides details to surrounding area by using GPS based
services and inputs from the camera.
o Cinemagraph. Allows for slight animation of still images in which a user
can record footage (~15 fps), and then select a segment to animate
within the image. For example, one would shoot an image of a flag, once
taken he/she can select the flag to continue waving while the rest of the
image stays still.
o SmartShoot. Records a series of photos, then allows a user to layer for
best overall image. For example, if someone accidentally walks across a
photo, they can later be removed, as the layers are assembled.
o Photosynth. Allows the user to capture panoramic images by taking a
series of photos in sequence as the software frames them together into a
single shot.
o Blink. Allows for a burst of photos to be taken and then the best one to be
selected.
Exhibit 96: City Lens – GPS based augmented reality Exhibit 97: SmartShoot – remove layers from images
Source: Company Source: Company

07 January 2013
Handset Industry 2013 Outlook 78
■ Nokia Music – free music streaming service. On the music front, Nokia has already
launched a music app for Lumia owners in the US which offers them a free music
streaming service. The service aims to provide consumers access to over 150
exclusive playlists curated by US based music “experts”.
o Ad-free and no subscriptions needed. The service is completely ad-free and
does not require registration or subscription.
o Offline playlists. Users can create their own playlists from a library of millions of
songs which can also be accessed offline.
o MP3 Store with over 15mn songs. Nokia’s MP3 store offers over 15mn songs
which Lumia owners can download and then play through Nokia Music.
o Gig Finder. Based off the user’s GPS based location, this feature allows one to
track down local concerts and shows as well as purchase tickets and get
directions to the location.
RIM – struggle continues, all eyes now on BB10
Exhibit 98: RIM’s smartphone share to decline from 5% in 2012 to 3% in 2013
Research in Motion Share 2010 2011 2012E 2013E Research in Motion Units (mn) 2010 2011 2012E 2013E
North America 30.2% 12.0% 3.7% 2.3% North America 21.7 12.8 4.5 3.2
Western Europe 16.2% 13.7% 7.1% 3.0% Western Europe 13.9 13.3 8.1 4.0
Japan 0.5% 0.3% 0.0% 0.0% Japan 0.1 0.1 0.0 0.0
China 0.1% 0.4% 0.0% 0.1% China 0.0 0.3 0.1 0.1
India 10.3% 10.2% 5.5% 2.5% India 0.9 1.3 1.1 1.0
Korea 0.3% 0.1% 0.0% 0.0% Korea 0.0 0.0 0.0 0.0
Other APAC 12.9% 11.4% 6.3% 2.8% Other APAC 3.8 5.6 4.5 2.9
Brazil 20.9% 18.5% 6.5% 3.0% Brazil 1.1 1.7 1.2 0.8
Mexico 24.5% 29.1% 20.5% 9.0% Mexico 0.8 2.7 3.1 2.0
Other LatAm 40.4% 34.0% 14.5% 9.0% Other LatAm 3.6 5.1 3.5 3.4
Russia 4.1% 0.5% 0.1% 0.1% Russia 0.2 0.0 0.0 0.0
Other Central & Eastern Europe 6.6% 2.5% 0.7% 0.6% Other Central & Eastern Europe 0.6 0.3 0.1 0.2
Middle East & Africa 15.8% 27.6% 15.0% 10.0% Middle East & Africa 2.9 8.3 6.9 7.8
Global smartphone share (%) 16.7% 10.9% 4.6% 2.6% Global smartphone share (%) 16.7% 10.9% 4.6% 2.6%
Smartphone Units (mn) 49.8 51.6 33.2 25.3 Smartphone Units (mn) 49.8 51.6 33.2 25.3
Source: Gartner, Company data, Credit Suisse estimates
As shown in Exhibit 98, RIM’s market share has been rapidly declining in recent years
given a combination of mixed execution, weak touchscreen offering, delays in launching its
new software platform and inherent developer issues with the existing BlackBerry OS
platform. Although the company is expected to introduce its new smartphones based on
new BB10 OS in Jan 2013, we believe that it may find difficult to get traction given the
strong positioning of both iOS and Android, and now the entry of WP8. This combined with
limited visibility on both the quality of its new BB10 OS and upcoming smartphones,
means that the company’s smartphone share may continue to erode, as we expect it to fall
from 5% in 2012 to around 3% in 2013.
Improvements coming with BB10, but maybe too little too late. Based on QNX, RIM’s new
management believe that the new BB10 OS could make the company’s portfolio
competitive once again. While BB10 is still not available, the OS has made a few
appearances at developer events in the last few months, and although we acknowledge
that the new OS shows marked improvement vs. previous versions, we still believe that it
faces fierce competition from existing platforms such as Android and iOS, given most of
the features offered by new BB10 is already being offered by rivals, which also benefit
from presence of a strong ecosystem around their platforms. Some of the software
features supported by BB10 to improve the user experience are ‘Flow’, ‘Active Frames’,

07 January 2013
Handset Industry 2013 Outlook 79
‘Cascades’ and ‘BlackBerry Balance’, all of which have been discussed in detail in an
earlier section.
Launch of first two BB10 smartphones to be announced in Jan 2013. After having seen
multiple delays in launch of BB10 platform, RIM has announced that it will officially launch
its new BB10 OS as well as unveil its first two BB10 smartphones in an event on Jan 30th
2013. So we have yet to see the specifications of the actual device when it is launched.
However, in order to develop an ecosystem around its new BB10 OS, RIM has already
issued developers its BB10 Dev Alpha smartphone, although this is not the final product.
Exhibit 99 shows this bar shaped device features a 4.2” touchscreen (1280x768), 16GB
internal storage and 1GB RAM. It also includes a microSD card slot and mini HDMI port,
as well as front and back facing cameras.
Exhibit 99: BB10 Dev Alpha smartphone (on the left) and 2nd
rumored smartphone (right)
Source: CrackBerry.com
A high price point could be detrimental to adoption. We believe that one of the reasons for
the delay in launching BB10 devices could have been RIM’s dependence on Qualcomm’s
Snapdragon 8960 processor, which has seen constraints during 2012 due to 28nm
capacity. What this also may imply that the new BB10 smartphones could be highly spec’d
devices targeting at a high price point. We simply do not believe much of a share
opportunity exists in the high end of the market, given the success seen by Apple and
Samsung in that segment of the market as we discuss in a previous section.
BlackBerry App World only has >105K apps vs. 700K for Apple and Android. Even after
3.5 years since launch, BlackBerry App World had only over 105K apps (as of Sep 2012)
as compared to Apple and Android, both of which boast of over 700K apps currently.
Although RIM has announced a number of partnerships in 2012 with major developers
(Gameloft, Mippin, Appcelerator to name a few) to issue BB10 specific apps, we remain of
the view that with a new platform rolling out, developers would remain skeptical in terms of
allocating their resources towards writing apps for BB10, as can be seen from a recent
IDC-Appcelerator developer survey which shows that developer interest in BB platform
has fallen from 21% in Nov 2011 to 9% in Nov 2012 (Exhibit 72).
After weakness in developed markets, pressures in EMs may increase. For RIM,
geographically our concern would be that a major source of pressure over the past 2 years
has come from developed markets, with the company still enjoying some traction in
markets such as Latin America and parts of APAC (for e.g. Indonesia and India) where
RIM had benefited in the past from a move towards lower end smartphone experience.

07 January 2013
Handset Industry 2013 Outlook 80
However, with Android now seeing launch of a number of low end smartphones from
different vendors in these markets, we believe RIM’s market share in some of these EM
countries will come under more pressure in 2013. Also as RIM goes through its portfolio
transition, and as its BB7 devices age, our concern is that share erosion could accelerate.
Running out of the services revenue stream. One of the benefits that RIM had in the past
was that its strong Services revenue stream had been more or less stable so far over the
last few quarters. However, we believe that visibility of the services revenue stream is
rapidly deteriorating given BB10 monetization of the NOC, ongoing carrier renegotiation
and declining subscribers. This means that service revenue should fall, and we note the
recent quarter marks the first time management has discussed its expectation that some
of the base may generate no service revenue. We assume services revenue of
$3.9bn/$3.3bn in FY13/14, down 4%/16% y/y, further compounding issues around
profitability. In turn, this would expose the company’s high level of hardware losses
which we estimate could be as high as $3.5bn/$2.7bn in FY13/FY14.
Multiple Android vendors may struggle
Within the Android camp of vendors, apart from continued strength at Samsung, we are
already seeing signs of weakness at other leading Android vendors (like HTC, Motorola
Mobility, Sony Mobile and LG) which shows that the competition within the Android
community remains stiff with vendors trying to differentiate from one another. In fact, we
believe that cumulative smartphone share of Android vendors may continue to grow
reaching nearly 70% in 2013 given robust trends at Samsung and widespread adoption by
Chinese and white-label vendors.
HTC – significant share loss in 2012
Being a pure smartphone play and having an early focus on Android, HTC enjoyed a lot of
success in smartphones in 2010/2011, as it was building its brand and distribution
especially in developed markets. However, since Q411, it has lost a significant level of
share driven by reversal of fortunes in the US market (accounted for around 40% of its
volumes in 2011). With HTC now trying to strengthen its product portfolio for both Android
and Windows Phone where it lags Samsung and Nokia respectively, our HTC analyst
Pauline Chen expects the company to ship 44mn smartphone units in 2013, which implies
5% share, down from 9%/5% in 2011/2012 (Exhibit 100).
Exhibit 100: HTC’s share may continue on downward spiral after nearly halving in 2012
HTC Share 2010 2011 2012E 2013E HTC Units (mn) 2010 2011 2012E 2013E
North America 14.6% 16.4% 7.2% 6.4% North America 10.5 17.6 8.7 8.7
Western Europe 11.7% 10.8% 5.5% 6.5% Western Europe 10.1 10.5 6.3 8.6
Japan 0.9% 1.3% 1.6% 1.0% Japan 0.2 0.3 0.5 0.4
China 3.2% 3.0% 3.2% 2.8% China 0.9 2.3 6.2 7.9
India 9.1% 8.1% 4.4% 4.5% India 0.8 1.1 0.9 1.8
Korea 2.5% 1.9% 0.2% 1.0% Korea 0.2 0.4 0.0 0.2
Other APAC 3.3% 14.4% 9.3% 10.1% Other APAC 1.0 7.0 6.7 10.5
Brazil 0.8% 0.9% 0.9% 1.5% Brazil 0.0 0.1 0.2 0.4
Mexico 0.7% 0.4% 2.5% 3.0% Mexico 0.0 0.0 0.4 0.7
Other LatAm 0.5% 0.4% 0.8% 1.0% Other LatAm 0.0 0.1 0.2 0.4
Russia 6.3% 13.3% 3.0% 4.8% Russia 0.2 1.1 0.5 1.0
Other Central & Eastern Europe 2.7% 10.4% 5.8% 5.3% Other Central & Eastern Europe 0.3 1.2 1.1 1.5
Middle East & Africa 2.1% 4.4% 1.8% 2.4% Middle East & Africa 0.4 1.3 0.8 1.9
Global smartphone share (%) 8.2% 9.1% 4.5% 4.5% Global smartphone share (%) 8.2% 9.1% 4.5% 4.5%
Smartphone Units (mn) 24.6 43.0 32.4 44.0 Smartphone Units (mn) 24.6 43.0 32.4 44.0
Source: Gartner, Company data, Credit Suisse estimates
Significant exposure to developed markets where share has been under pressure. Nearly
50% of HTC global shipments are likely to come from NA and WE markets combined in

07 January 2013
Handset Industry 2013 Outlook 81
2012. Although this number has come down from 85%/65% in 2010/2011, we believe that
the vendor still has weak presence in a number of emerging markets like China, Brazil and
Mexico. With competition getting more intense in these developed markets especially in
the high end segment from both Apple and Samsung, we believe that HTC will continue to
struggle in NA and WE markets, leading to further share loss in 2013.
Distribution is not that effective in our view. We note that HTC still supplies only a limited
number of carriers especially in emerging markets, compared with RIM and Nokia at 500
and Apple at 250 carriers globally. This focus and concentration around developed
markets was clearly highlighted as Apple’s iPhone 4S and Samsung’s Galaxy SII devices
gained a lot of traction at multiple carriers in developed markets during Q411, a trend
which continues in 2012 with the launch of iPhone 5 and Galaxy SIII.
Portfolio focused at the high end, but offers minimal differentiation. A glance at Exhibit 101
shows that HTC’s smartphone portfolio is still mainly targeted at the high-end. In addition,
with success in Android fading quickly, the company is now trying to also diversify by
launching a few Windows Phone based devices. But the main issue with HTC’s portfolio is
that it continues to lag behind Samsung and Nokia on both these platforms respectively
when it comes to hardware and software offering.
Exhibit 101: HTC’s new portfolio – focused at the high end but offers limited differentiation Detailed specifications for HTC’s latest smartphone offering in the marketplace Vendor HTC HTC HTC HTC HTC HTC HTC
Model Droid DNA One SV Desire SV One VX One X+ Windows Phone 8X Windows Phone 8S
Image
Technology CDMA/LTE UMTS/GSM/LTE UMTS/GSM UMTS/GSM/LTE UMTS/GSM/LTE UMTS/GSM/LTE UMTS/GSM
Announced Nov-12 Nov-12 Nov-12 Oct-12 Oct-12 Sep-12 Sep-12
Shipping date Nov-12 Exp Dec 2012 Nov-12 Nov-12 Nov-12 Nov-12 Nov-12
Operating System Android 4.1 Android 4.0 Android 4.0 Android 4.0 Android 4.1 WP8 WP8
Application Processor Quad Core 1.5GHz Dual Core 1.2GHz Dual Core 1GHz Dual Core 1.5GHz Quad Core 1.7GHz Dual Core 1.5GHz Dual Core 1GHz
RAM 2GB 1GB 768MB 1GB 1GB 1GB 512MB
Memory 16GB 8GB 4GB 8GB 64GB 16GB 4GB
Pixels 1080 x 1920 480 x 800 480 x 800 540 x 960 720 x 1280 720 x 1280 480 x 800
Dimensions (w x h x d) (mm) 141 x 70.5 x 9.7 128 x 66.9 x 9.2 129.7 x 67.9 x 10.7 133.5 x 67.6 x 9.2 134.4 x 69.9 x 8.9 132.4 x 66.2 x 10.1 120.5 x 63 x 10.3
Weight (g) 142 122 131 125 135 130 113
Volume (cc) 96 79 94 83 84 89 78
Screen (in) 5 4.3 4.3 4.5 4.7 4.3 4.0
Megapixel 8.0 5.0 8.0 5.0 8.0 8.0 5.0
NFC yes yes no yes yes yes no
Wi-Fi yes yes yes yes yes yes yes
GPS yes yes yes yes yes yes yes
Talk time (hrs) 12.7 22.5 NA NA 12.8 12.0 NA
Standby time (hrs) 353 NA NA NA 360 290 NA Source: Company data, Credit Suisse research
Motorola Mobility/Google – uncertain ambitions
Since Motorola Mobility has been acquired by Google (acquisition announced in July 2011
and completed in Aug 2012), the company’s exact plans in the smartphone device market
has been unclear. Uncertainty around ambitions in the smartphone hardware market along
with management changes has already led to Motorola Mobility’s smartphone share
trending down since the middle of 2011. Given our view that Google is unlikely adopt an
aggressive strategy for Motorola Mobility as it may come with the risk of alienating its other
Android partners, we believe that Motorola Mobility will continue to see gradual share
declines going forward.
Change of control with new management team. With Google having changed the control
of Motorola Mobility having appointed Dennis Woodside as CEO of Motorola Mobility
replacing Dr. Sanjay Jha in May 2012, there has been significant changes in senior

07 January 2013
Handset Industry 2013 Outlook 82
executive team at the handset company. We believe this would have had some impact in
terms of disruption in the company’s existing strategy.
Exhibit 102: Uncertainty around Google’s ambitions in smartphone hardware space has led to share loss for Motorola
Motorola Share 2010 2011 2012E 2013E Motorola Units (mn) 2010 2011 2012E 2013E
North America 13.0% 7.5% 7.4% 5.1% North America 9.4 8.1 9.0 7.0
Western Europe 0.8% 1.3% 0.9% 0.4% Western Europe 0.7 1.2 1.0 0.5
Japan 0.0% 0.1% 0.3% 0.3% Japan 0.0 0.0 0.1 0.1
China 6.1% 6.1% 2.2% 1.3% China 1.7 4.7 4.3 3.6
India 0.3% 0.4% 0.3% 0.2% India 0.0 0.1 0.1 0.1
Korea 4.6% 1.8% 0.2% 0.5% Korea 0.3 0.4 0.0 0.1
Other APAC 1.2% 1.7% 1.6% 0.5% Other APAC 0.4 0.8 1.2 0.5
Brazil 6.3% 4.2% 7.5% 2.5% Brazil 0.3 0.4 1.3 0.7
Mexico 9.7% 4.4% 6.5% 3.5% Mexico 0.3 0.4 1.0 0.8
Other LatAm 5.0% 5.2% 5.3% 3.0% Other LatAm 0.4 0.8 1.3 1.1
Russia 0.2% 0.0% 0.0% 0.0% Russia 0.0 0.0 0.0 0.0
Other Central & Eastern Europe 0.3% 2.1% 1.2% 0.8% Other Central & Eastern Europe 0.0 0.2 0.2 0.2
Middle East & Africa 0.3% 0.8% 0.5% 0.5% Middle East & Africa 0.1 0.2 0.2 0.4
Global smartphone share (%) 4.6% 3.7% 2.7% 1.5% Global smartphone share (%) 4.6% 3.7% 2.7% 1.5%
Smartphone Units (mn) 13.7 17.4 19.7 15.1 Smartphone Units (mn) 13.7 17.4 19.7 15.1
Source: Gartner, Company data, Credit Suisse estimates
Product introductions have been lackluster of late. We believe Motorola’s product
introductions over the last 12 months have been somewhat lackluster. While the company
has launched multiple Android smartphones, and tried to integrate its high-end offering
under the RAZR brand umbrella, it has struggled to differentiate its new range of DROID
RAZR smartphones versus other higher end Android devices from peers.
Exhibit 103: Motorola’s new smartphones having nothing different to offer vs. Android smartphones from other vendors Detailed specifications for Motorola’s latest smartphone offering in the market Vendor Motorola Motorola Motorola Motorola Motorola Motorola Motorola
Model Electrify M XT905 RAZR i XT890 DROID RAZR MAXX HD DROID RAZR HD DROID RAZR M DEFY XT ATRIX HD
Image
Technology CDMA/LTE UMTS/GSM CDMA/LTE CDMA/LTE CDMA/LTE CDMA UMTS/GSM/LTE
Announced Nov-12 Sep-12 Sep-12 Sep-12 Sep-12 Jul-12 Jul-12
Shipping date Nov-12 Oct-12 Nov-12 Oct-12 Sep-12 Jul-12 Jul-12
Operating System Android 4.0 Android 4.0 Android 4.0 Android 4.0 Android 4.0 Android 2.3 Android 4.0
Application Processor Dual Core 1.5GHz 2 GHz Intel Atom Dual Core 1.5GHz Dual Core 1.5GHz Dual Core 1.5GHz 1GHz Dual Core 1.5GHz
RAM 1GB 1GB 1GB 1GB 1GB 512MB 1GB
Memory 8GB 8GB 32GB 16GB 8GB 1GB 8GB
Pixels 540 x 960 540 x 960 720 x 1280 720 x 1280 540 x 960 480 x 854 720 x 1280
Dimensions (w x h x d) (mm) 123.2 x 61.5 x 8.6 122.5 x 60.9 x 8.3 131.9 x 67.9 x 9.3 131.9 x 67.9 x 8.4 122.5 x 60.9 x 8.3 115 x 58.5 x 12 133.5 x 69.9 x 8.4
Weight (g) 111 126 157 146 126 130 140
Volume (cc) 65 62 83 75 62 81 78
Screen (in) 4.3 4.3 4.7 4.7 4.3 3.7 4.5
Megapixel 8.0 8.0 8.0 8.0 8.0 5.0 8.0
NFC yes yes yes yes no no no
Wi-Fi yes yes yes yes yes yes yes
GPS yes yes yes yes yes yes yes
Talk time (hrs) 16.7 20.0 32.0 24.0 20.0 5.5 9.0
Standby time (hrs) 432 360 372 286 408 300 205 Source: Company data, Credit Suisse research
Distribution is limited to Americas and China, and its losing steam in both these regions. A
key issue for Motorola Mobility in its smartphone business has been its limited geographic
reach, which is limited to NA, China and Latam. Outside of these regions, we have seen
limited traction for Motorola smartphones, as evidenced by low smartphone share (which
is less than 2%) in each of the following geographies – WE, CEE, MEA and APAC (ex

07 January 2013
Handset Industry 2013 Outlook 83
China). Even in its core NA and Latam markets, the vendor is losing steam as competition
continues to intensify within the Android camp.
Sony Mobile – offering no differentiation in Android
Exhibit 104: Sony Ericsson / Sony Mobile’s share to continue to see gradual declines
Sony Ericsson Share 2010 2011 2012E 2013E Sony Ericsson Units (mn) 2010 2011 2012E 2013E
North America 0.5% 0.4% 0.4% 0.5% North America 0.3 0.4 0.5 0.7
Western Europe 6.3% 5.9% 5.6% 2.1% Western Europe 5.4 5.7 6.4 2.8
Japan 3.2% 8.5% 8.0% 5.0% Japan 0.6 2.1 2.6 1.8
China 2.4% 3.9% 1.2% 0.8% China 0.7 3.0 2.3 2.2
India 1.1% 3.2% 2.3% 1.0% India 0.1 0.4 0.5 0.4
Korea 1.1% 0.5% 0.2% 0.1% Korea 0.1 0.1 0.0 0.0
Other APAC 3.2% 3.4% 3.0% 1.5% Other APAC 0.9 1.6 2.2 1.6
Brazil 6.3% 6.4% 4.8% 3.0% Brazil 0.3 0.6 0.9 0.8
Mexico 11.7% 12.4% 11.0% 7.0% Mexico 0.4 1.2 1.7 1.6
Other LatAm 3.3% 6.0% 5.8% 4.0% Other LatAm 0.3 0.9 1.4 1.5
Russia 4.0% 6.5% 5.0% 3.5% Russia 0.1 0.5 0.8 0.7
Other Central & Eastern Europe 4.4% 8.3% 6.0% 3.0% Other Central & Eastern Europe 0.4 1.0 1.2 0.9
Middle East & Africa 3.4% 6.8% 7.0% 3.0% Middle East & Africa 0.6 2.0 3.2 2.3
Global smartphone share (%) 3.4% 4.2% 3.3% 1.8% Global smartphone share (%) 3.4% 4.2% 3.3% 1.8%
Smartphone Units (mn) 10.3 19.6 23.5 17.2 Smartphone Units (mn) 10.3 19.6 23.5 17.2
Source: Gartner, Company data, Credit Suisse estimates
For Sony, we expect the company’s strategy to focus on high end product offering but it
continues to lack in areas like global scale and distribution. In addition, the company
continues to lack the early mover advantage in Android-based offerings when it comes to
launching new smartphones or upgrading OS on an existing device to the latest version.
Change in control has led to some disruptions. With Sony having taken full control over
Sony Ericsson in Feb 2012, we believe changes in management team and smartphone
strategy would have had a negative impact on its smartphone share in 2012. This risk of
disruption is something similar to what we have seen in the past with handset shares of
vendors like Motorola and Sony Ericsson when they had senior management changes in
late 2007.

07 January 2013
Handset Industry 2013 Outlook 84
Exhibit 105: Sony’s smartphones all looking very similar, but breadth in portfolio and differentiation missing Detailed specifications for key smartphones from Sony Vendor Sony Sony Sony Sony Sony Sony Sony
Model Xperia TL Xperia V Xperia J Xperia TX Xperia T Xperia SL Xperia tipo dual
Image
Technology UMTS/GSM/LTE UMTS/GSM/LTE UMTS/GSM UMTS/GSM UMTS/GSM UMTS/GSM UMTS/GSM
Announced Oct-12 Aug-12 Aug-12 Aug-12 Aug-12 Aug-12 Jun-12
Shipping date Nov-12 Exp Dec 2012 Oct-12 Oct-12 Sep-12 Sep-12 Sep-12
Operating System Android 4.0 Android 4.0 Android 4.0 Android 4.0 Android 4.0 Android 4.0 Android 4.0
Application Processor Dual Core 1.5GHz Dual Core 1.5GHz 1GHz Dual Core 1.5GHz Dual Core 1.5GHz Dual Core 1.7GHz 800MHz
RAM 1GB 1GB 512MB 1GB 1GB 1GB 512MB
Memory 16GB 8GB 4GB 16GB 16GB 32GB 3GB
Pixels 720 x 1280 720 x 1280 480 x 854 720 x 1280 720 x 1280 720 x 1280 320 x 480
Dimensions (w x h x d) (mm) 129.4 x 67.3 x 9.4 129 x 65 x 10.7 124.3 x 61.2 x 9.2 131 x 68.6 x 8.6 129.4 x 67.3 x 9.4 128 x 64 x 10.6 103 x 57 x 13
Weight (g) 148 120 124 127 139 144 99.4
Volume (cc) 82 90 70 77 82 87 76
Screen (in) 4.6 4.3 4.0 4.6 4.5 4.3 3.2
Megapixel 13.0 13.0 5.0 13.0 13.0 12.0 3.2
NFC yes yes no yes yes yes no
Wi-Fi yes yes yes yes yes yes yes
GPS yes yes yes yes yes yes yes
Talk time (hrs) 7.0 7.0 7.4 6.7 7.0 8.5 6.0
Standby time (hrs) 450 400 618 400 410 420 360 Source: Company data, Credit Suisse research
Hardly any differentiation in its smartphone offering. Looking at the key smartphones
launched by Sony in the last few months, we note that all their devices look very similar in
terms of feature set. Even at the high-end of the segment, their XPERIA range of
smartphones do not seem to offer anything different from majority of Android vendors.
Chinese tier I brands – on track on gain share
Looking at Chinese vendors, we would note three tier I vendors – Huawei, ZTE and
Lenovo – have continued to gain share in 2011/2012. In fact, these vendors on a
combined basis had around 6% global smartphone share in 2011, which is likely to
expand to 10% in 2012.
Huawei – share gains have come slower than expected
Huawei gaining share but only gradually. At MWC in Feb 2012, Huawei noted that the
company is targeting to sell 60mn smartphones in 2012, up from around 20mn
smartphones in 2011. Since then, the company has lowered its target to a range of 25-
30mn smartphones for 2012. In 9M2012, the vendor had shipped 20mn units, which
means it would have to sell 10mn units to reach the high end of its revised target. This
means that the vendor will see its smartphone rise from 3% in 2011 to 4% in 2012.
Distribution still an issue. In addition to broadening its smartphone portfolio to cover range
of price points, Huawei continues to expand distribution both in carrier and retail channels.
However, its global share is still being heavily influenced by China and also US to some
extent, it is clear that traction remains limited outside these regions. In a way, this shows
the challenges and the time required to build a strong distribution network. This drives our
view that Huawei may be able to sell 45mn smartphones in 2013, which implies 5% global
share.

07 January 2013
Handset Industry 2013 Outlook 85
Exhibit 106: Huawei continues to see share gains, albeit slower than expectations
Huawei Share 2010 2011 2012E 2013E Huawei Units (mn) 2010 2011 2012E 2013E
North America 0.0% 4.3% 3.1% 3.0% North America 0.0 4.6 3.7 4.1
Western Europe 0.2% 0.9% 1.4% 1.8% Western Europe 0.2 0.9 1.5 2.3
Japan 0.0% 0.3% 0.2% 0.3% Japan 0.0 0.1 0.1 0.1
China 0.6% 10.2% 9.5% 10.0% China 0.2 7.9 18.7 28.8
India 0.0% 0.3% 0.9% 1.5% India 0.0 0.0 0.2 0.6
Korea 0.0% 0.0% 0.0% 0.0% Korea 0.0 0.0 0.0 0.0
Other APAC 0.0% 1.1% 1.3% 2.0% Other APAC 0.0 0.5 0.9 2.1
Brazil 0.0% 0.6% 0.8% 2.0% Brazil 0.0 0.1 0.1 0.5
Mexico 0.0% 1.1% 1.2% 3.5% Mexico 0.0 0.1 0.2 0.8
Other LatAm 0.0% 3.3% 3.0% 5.0% Other LatAm 0.0 0.5 0.7 1.9
Russia 0.0% 1.1% 1.2% 2.5% Russia 0.0 0.1 0.2 0.5
Other Central & Eastern Europe 0.1% 3.6% 3.5% 5.0% Other Central & Eastern Europe 0.0 0.4 0.7 1.4
Middle East & Africa 0.0% 1.5% 2.0% 2.5% Middle East & Africa 0.0 0.5 0.9 1.9
Global smartphone share (%) 0.1% 3.3% 3.9% 4.6% Global smartphone share (%) 0.1% 3.3% 3.9% 4.6%
Smartphone Units (mn) 0.4 15.6 27.9 45.1 Smartphone Units (mn) 0.4 15.6 27.9 45.1
Source: Gartner, Company data, Credit Suisse estimates
Product portfolio – hiccup at start of 2012, but improving all the time. Having announced its
high-end smartphone Ascend D Quad at MWC in Feb 2012, the device (which uses its
own internally designed quad-core apps processor and was one of the most hyped device
at MWC event) had seen a number of delays owing to chipset issues, and finally started
shipping in Oct 2012. Although this was a clear setback, more importantly, the company
has been introducing a number of terminals in the lower end of the smartphone market,
again under its Ascend flagship brand, which have been received positively in markets like
China, parts of Latam and CEE.
Exhibit 107: Huawei is looking to offer a broad range of smartphones across price points Detailed specifications for recent smartphone launches from Huawei Vendor Huawei Huawei Huawei Huawei Huawei Huawei Huawei
Model Honor 2 Ascend Y Summit Ascend P1 Fusion 2 U8665 Ascend Y201 Pro Ascend G600
Image
Technology UMTS/GSM CDMA UMTS/GSM UMTS/GSM/LTE UMTS/GSM UMTS/GSM UMTS/GSM
Announced Oct-12 Oct-12 Oct-12 Oct-12 Oct-12 Aug-12 Aug-12
Shipping date Nov-12 Oct-12 Oct-12 Oct-12 Oct-12 Oct-12 Sep-12
Operating System Android 4.0 Android 2.3 Android 2.3 Android 4.0 Android 2.3 Android 4.0 Android 4.0
Application Processor Quad Core 1.4GHz 800MHz 600MHz Dual Core 1.5GHz 800MHz 800MHz Dual Core 1.2Hz
RAM 2GB 256MB 512MB 1GB 512MB 512MB 768MB
Memory 8GB 120MB 512MB 4GB 4GB 4GB 4GB
Pixels 720 x 1280 320 x 480 320 x 480 540 x 960 320 x 480 320 x 480 540 x 960
Dimensions (w x h x d) (mm) 134 x 67.5 x 10.5 116.8 x 61 x 11.7 115.8 x 59.9 x 12.2 132.5 x 65.4 x 9.9 115.8 x 61 x 11.7 117 x 61.5 x 11.7 134 x 67.5 x 10.5
Weight (g) 145 125 125 135 124 125 NA
Volume (cc) 95 83 85 86 83 84 95
Screen (in) 4.5 3.5 3.5 4.3 3.5 3.5 4.5
Megapixel 8.0 3.2 3.2 8.0 3.2 3.2 8.0
NFC no no no no no no yes
Wi-Fi yes yes yes yes yes yes yes
GPS yes yes yes yes yes yes yes
Talk time (hrs) 13.0 7.5 7.0 6.0 5.0 5.0 6.0
Standby time (hrs) 541 300 216 336 350 500 360 Source: Company data, Credit Suisse research
ZTE – seeing gradual share gains, distribution still an issue
ZTE share gains driven by China and US. Over the last 2 years, ZTE has come from
having virtually no presence in smartphones to nearly 4% share in 2012. This has been
driven by its focus on certain markets – China and US – which together will account for

07 January 2013
Handset Industry 2013 Outlook 86
over 70% of its global shipments in 2012. Our ZTE analyst, YT Boon, expects the
company to ship around 27-28mn smartphones in 2012 which will imply 4% global share
in 2012.
Exhibit 108: ZTE in a similar situation to Huawei – gaining share but only gradually
ZTE Share 2010 2011 2012E 2013E ZTE Units (mn) 2010 2011 2012E 2013E
North America 0.0% 0.6% 2.5% 2.5% North America 0.0 0.6 3.0 3.4
Western Europe 0.1% 1.2% 1.8% 2.0% Western Europe 0.1 1.1 2.1 2.7
Japan 0.0% 0.1% 0.2% 0.2% Japan 0.0 0.0 0.1 0.1
China 0.5% 7.8% 8.3% 8.0% China 0.1 6.1 16.2 23.1
India 0.0% 0.1% 1.7% 1.5% India 0.0 0.0 0.3 0.6
Korea 0.0% 0.0% 0.0% 0.0% Korea 0.0 0.0 0.0 0.0
Other APAC 0.0% 2.0% 2.5% 2.0% Other APAC 0.0 1.0 1.8 2.1
Brazil 0.0% 2.5% 2.8% 2.8% Brazil 0.0 0.2 0.5 0.8
Mexico 0.0% 2.3% 2.8% 3.0% Mexico 0.0 0.2 0.4 0.7
Other LatAm 0.0% 4.9% 3.3% 3.5% Other LatAm 0.0 0.7 0.8 1.3
Russia 0.0% 0.0% 0.0% 1.5% Russia 0.0 0.0 0.0 0.3
Other Central & Eastern Europe 0.0% 3.0% 4.8% 6.0% Other Central & Eastern Europe 0.0 0.4 0.9 1.7
Middle East & Africa 0.0% 0.5% 2.3% 3.0% Middle East & Africa 0.0 0.1 1.0 2.3
Global smartphone share (%) 0.1% 2.2% 3.8% 4.0% Global smartphone share (%) 0.1% 2.2% 3.8% 4.0%
Smartphone Units (mn) 0.3 10.5 27.2 39.0 Smartphone Units (mn) 0.3 10.5 27.2 39.0
Source: Gartner, Company data, Credit Suisse estimates
Offering smartphones across price points and technologies. Looking at the smartphone
device specifications for some of the recent ZTE launches, it is clear that the company is
looking to offer a broad range of devices across price points and technologies, in an
attempt to cater to demands from US and Chinese carriers.
Exhibit 109: ZTE’s smartphone portfolio has seen major improvement – offering across price points and technologies Detailed specifications for recent smartphone launches from ZTE Vendor ZTE ZTE ZTE ZTE ZTE ZTE ZTE
Model V889M V790 Groove X501 Flash Anthem 4G Warp Sequent Grand Era U895
Image
Technology UMTS/GSM UMTS/GSM CDMA CDMA/LTE CDMA/LTE CDMA UMTS/GSM
Announced Nov-12 Nov-12 Nov-12 Nov-12 Sep-12 Sep-12 Sep-12
Shipping date Exp Q4 2012 Exp Q4 2012 Nov-12 Nov-12 Sep-12 Sep-12 Sep-12
Operating System Android 4.0 Android 4.0 Android 2.3 Android 4.0 Android 2.3 Android 4.0 Android 4.0
Application Processor Dual Core 1GHz 1GHz 800MHz Dual Core 1.5GHz Dual Core 1.2GHz 1.4GHz Quad Core 1.5GHz
RAM 512MB 512MB 512MB 1GB 512MB 768MB 1GB
Memory 4GB 1GB 1GB 8GB 4GB 4GB 4GB
Pixels 480 x 800 320 x 480 320 x 480 720 x 1280 480 x 800 540 x 960 720 x 1280
Dimensions (w x h x d) (mm) 120.5 x 63.6 x 11.9 116 x 61.7 x 12.6 118.6 x 62.5 x 13.9 133.9 x 65.7 x 9.7 130.1 x 68.1 x 13.7 127 x 64.8 x 9.9 133 x 66 x 8.6
Weight (g) 130 149 128 142 190 130 110
Volume (cc) 91 90 103 85 121 81 75
Screen (in) 4 3.5 3.2 4.5 4.3 4.3 4.5
Megapixel 5.0 3.2 3.2 12.6 5.0 5.0 8.0
NFC no no no yes no no no
Wi-Fi yes yes yes yes yes yes yes
GPS yes yes yes yes yes yes yes
Talk time (hrs) 8.0 NA 5.0 8.0 4.0 7.0 NA
Standby time (hrs) 450 NA 300 216 244 220 NA Source: Company data, Credit Suisse research
Lenovo – another new entrant, but already 2nd
largest smartphone brand in China
In calendar Q312, Lenovo shipped around 7mn smartphones compared to around 5mn in
the previous quarter. Although its guidance is to ship around 15-20mn smartphones in
FY13 (ending Mar 2013), given it has already shipped ~12mn units in 1HFY13, our
Lenovo analyst, Thompson Wu, believes that the company could exceed its shipment

07 January 2013
Handset Industry 2013 Outlook 87
guidance for the full year. Assuming 25mn units for Lenovo in FY13 would imply around
3% global smartphone share for the vendor.
Exhibit 110: Lenovo’s smartphone portfolio so far has been focused on China market Detailed specifications for recent smartphone launches from Lenovo Vendor Lenovo Lenovo Lenovo Lenovo Lenovo Lenovo Lenovo
Model A660 S880 S560 K860 A65 p700i A60+
Image
Technology UMTS/GSM UMTS/GSM UMTS/GSM UMTS/GSM UMTS/GSM UMTS/GSM UMTS/GSM
Announced Sep-12 Aug-12 Aug-12 Aug-12 Jul-12 Jul-12 Jan-12
Shipping date Oct-12 Sep-12 Aug-12 Aug-12 Jul-12 Jul-12 Jan-12
Operating System Android 4.0 Android 4.0 Android 4.0 Android 4.0 Android 2.3 Android 4.0 Android 2.3
Application Processor Dual Core 1GHz 1GHz Dual Core 1GHz Quad Core 1.4GHz 800MHz Dual Core 1GHz 1GHz
RAM 512MB 512MB 512MB 1GB NA 512MB 256MB
Memory 4GB 4GB 4GB 8GB 220MB 4GB 512MB
Pixels 480 x 800 480 x 800 480 x 800 720 x 1280 320 x 480 480 x 800 480 x 320
Dimensions (w x h x d) (mm) 125 x 65 x 10.5 142 x 78 x 9.9 125 x 63 x 12.3 143.6 x 74.5 x 9.5 116 x 59.9 x 12.6 125.6 x 64.6 x 12.8 115.8 x 60.8 x 11.9
Weight (g) 138 196 155 190 162 135
Volume (cc) 85 110 97 102 88 104 84
Screen (in) 4 5 4 5.0 3.5 4 3.5
Megapixel 5.0 5.0 5.0 8.0 3.2 5.0 2.0
NFC no no no no no no no
Wi-Fi yes yes yes yes yes yes yes
GPS yes yes yes yes yes yes yes
Talk time (hrs) NA 17.0 8.0 31.0 6.0 22.0 3.0
Standby time (hrs) NA 312 250 336 150 312 192 Source: Company data, Credit Suisse research
Gain a strong China foothold. This is very important as China is both the largest PC and
smartphone markets globally, consuming 22%/26% YTD 2012 shipments. We expect
China to account for around 30% of global smartphone market by 2015 in volume terms.
China happens to be Lenovo’s core market generating 44%/67% of revenues/op profits
YTD FY13. Lenovo can leverage its China PC position (33% PC share YTD ‘12), localized
manufacturing, PC supply chain advantages (i.e. distribution), a popular China brand, and
operational experience in the region as a stepping stone for its smartphone business. By
driving synergies in PCs and smartphone, we believe Lenovo’s China smartphone
business can deliver operating margins comparable, if not better, to the industry average
of 1-1.5% long-term vs. a 3.2% loss in the F2Q13 Sept.
Selective country expansion. Lenovo is not initially building a global smartphone business.
Instead, Lenovo is focused on China and expanding into select Asia-Pac/Eastern
European countries with a large and fast growing smartphone market opportunity. In the
December 2012 quarter, Lenovo has entered into India (#1 in PC share), Indonesia (#3),
Philippines (#2), and Russia (#3). These are countries in which it also has top three PC
market and infrastructure investments we believe it can leverage such as distribution and
marketing. Indeed, we believe it is choosing countries where it can leverage its PC
infrastructure and related costs to accelerate scaling benefits created through synergies
between both business units (PC/smartphones). Lenovo plans to double its countries-
addressed in FY14 to ten, from five in FY13.
Expand and strength operator relationships. Operator support is needed to deepen its
penetration in China, expand into new countries, and enter the high-end smartphone
market. This latter is a market we expect Lenovo will attack in FY14, and Lenovo will
compete with other smartphone vendors (i.e. Apple/Samsung) for subsidies and marketing
dollars. We believe having strong relationship will assist Lenovo in winning its portion of
these subsidy/marketing dollars. In China currently, it is deliberately choosing to distribute
its popular smartphones through operators, rather than use its own distribution, in efforts
to build a longer-lasting operator relationship. It is working with China Unicom, China

07 January 2013
Handset Industry 2013 Outlook 88
Mobile, and China Telecom and looks to balance distribution amongst the three operators
in FY14.
Leverage China distribution advantage. According to Lenovo, roughly half of China
smartphones are sold through open-channels, which can yield 3x better gross margins vs.
operator channels. To date, more than 70% of Lenovo’s smartphones sold have been
through operators for the reasons we discuss above. Indeed, Lenovo will eventually
leverage its China distribution advantage once it achieves a certain level of scale, and
having developed its operator relationships. Once it does so, which we expect will
gradually shift in FY14, we expect the profitability of its MIDH business unit will begin to
improve meaningfully.
In-house design and manufacturing. In Wuhan China, Lenovo is building a design and
manufacturing facility for smartphones, tablets and other mobile devices. The facility will
strengthen its R&D, enhance its supply chain by improving its end-to-end product
capability, accelerate production cycles, and product portfolio. We believe this will provide
a key time to market and product portfolio advantage in the highly competitive white-box
brands of the China smartphone market. Lenovo’s Wuhan operations are set to begin in
Oct-13.
Smartphone revenues reaching 7.5/8.5% in FY13/FY14. We expect Lenovo to ship
25mn/38mn smartphones in FY13/FY14, up from ~4mn in FY12. Of these, we expect the
company to ship 94%/84% respectively of its overall shipments in China. These estimates
would imply Lenovo’s China smartphone market share reaches ~10% in CY12/CY13.
Significant growth for white-label / grey market vendors driven by Android
China has been a key driver for smartphone volume growth, something which we believe
is likely to continue as we expect smartphone shipments in China to rise from 78mn units
in 2011 to nearly 200mn/300mn units in 2012/2013. This fast growth has been driven by
combined effect of push from all three carriers in the region along with chipset
manufacturers’ ability and intent to customize their smartphone chipsets to drive lower end
smartphones especially at white-label manufacturers. Even long term, we believe that
China would account for as much as 30% of global smartphone volumes compared to only
around 15% in 2011.
MediaTek and Spreadtrum fuelling low-end smartphones in China. According to our
analyst Randy Abrams (who covers both MediaTek and Spreadtrum), smartphone
baseband volumes for these two vendors together may grow from 10mn units in 2011 to
nearly 150mn/335mn units in 2012/2013 (Exhibit 111). In the past, both these vendors
were struggling to transition from 2.5G baseband chips towards 3G/smartphone chips due
to technology and performance issues, something which seems to have been addressed.
This has resulted in aggressive plans from both these chipset vendors to target local
handset OEMs in China to fuel the low-end smartphone market. In fact, China Unicom’s
recently launched devices focused on mass market dual core smartphones from branded
Chinese vendors and saw an almost even split of designs based on MediaTek and
Qualcomm. Qualcomm secured wins from Hisense, KTouch/Tianyu, Coolpad, and Huawei
while MediaTek was designed into smartphones from Malata, Lenovo, TCL, and ZTE.

07 January 2013
Handset Industry 2013 Outlook 89
Exhibit 111: Smartphone baseband volumes at MTEK/SPRD in millions, unless otherwise stated
Exhibit 112: QCOM remains engaged with local vendors Qualcomm’s reference design chipset roadmap for China
10 2138 47
10
116
243
02
1118
0
31
91
0
50
100
150
200
250
300
Q112 Q212 Q312 Q412E 2011 2012E 2013E
SpreadTrum MediaTek
Sm
art
ph
on
e b
aseb
an
d u
nit
s (
mn
)
First 1GHz
Single Core
Q4’11
7x27ASingle Core
First High Volume
Q2’11 / Q3’11
MSM7x25
MSM7x27
Dual Core
Q2’12
8x25Dual Core
Quad Core
Q1’13
8x30Dual Kraits
MSM
8x25QQuad Core
40+ OEMs 100+ Launches 100+ in Design <60 days Launch Time-to-Market
Source: Company data, Credit Suisse estimates Source: Company data, Credit Suisse research
Qualcomm remains engaged with local Chinese vendors with its reference designs.
Although Taiwanese chipset vendors (MediaTek and Spreadtrum) have seen a lot of
traction with local handset vendors in China, up until 1H12, their success in 3G and
smartphone market had been limited. In addition, Qualcomm was also not actively
involved in offering reference designs to local vendors in a big way until end of 2011,
which meant that local handset OEMs were not able to offer quality devices in the low-end
of the smartphone market. With improvements in its QRD portfolio (7x27A – first 1GHz
single core chip launched in Q411, followed by 8x25 dual core chip introduced in Q212),
Qualcomm has been able to fuel the low-end of the smartphone market in China and India
with its reference design partnerships with a number of local vendors including Huawei,
ZTE, Lenovo, Oppo, Coolpad, Haier, BYD, TCL-Alcatel to name a few. In fact, Qualcomm
now has reference designs in over 100 smartphone devices with over 40 OEMs across 12
countries.
Chipset roadmap improvement has led to Android smartphones flooding the China market.
Driven by this continued improvement in smartphone chipset offering from MediaTek,
Spreadtrum and Qualcomm, we have seen that white-label and grey market handset
manufacturers have flooded the smartphone market in China with a number of Android
device launches. While most of these devices are clearly aimed at the low-end of the
segment with prices ranging from $70 to $100 (Exhibit 113), we also see smartphone
launches at higher end of the market.

07 January 2013
Handset Industry 2013 Outlook 90
Exhibit 113: Slew of Android smartphones across price points being manufactured by white-label vendors in China Detailed specifications for Android smartphones from white-label manufacturers in China
Chipset SC6820 MTK 6515 MTK 6515M MTK 6515 MTK 6575 MTK 6577 QCOM MSM 8255 MTK 6577
Model N9300 Mini i9300 Dex Nebula V11 Elysium Coolpad 7266 W3
Image
Technology GSM/EDGE GSM/EDGE GSM/EDGE GSM/EDGE UMTS/GSM UMTS/GSM UMTS/GSM UMTS/GSM
Operating System Android 2.3 Android 2.3 Android 2.3 Android 2.3 Android 4.0 Android 4.0 Android 4.0 Android 4.0
Application Processor 1GHz 800MHz 1GHz 1GHz 1GHz Dual Core 1GHz Dual Core 1GHz Dual Core 1GHz
RAM 256MB 256MB 256MB 256MB 512MB 512MB 512MB 1GB
Memory 256MB 256MB 256MB 256MB 512MB 4GB 4GB 4GB
Pixels 320 x 480 320 x 480 320 x 480 320 x 480 480 x 800 480 x 800 480 x 800 480 x 800
Dimensions (w x h x d) (mm) 116 x 61 x 10 127 x 68 x 10 115 x 61 x 11 110 x 60 x 13 120 x 65 x 10 126 x 65 x 11 124 x 65 x 10.7 125 x 65 x 13
Weight (g) 100 NA 128 115 90 120 125 150
Volume (cc) 71 86 77 86 78 90 86 106
Screen (inches) 3.5 3.5 3.5 3.5 3.5 4.3 4.0 4.5
Megapixel 3.0 3.2 8.0 0.3 5.0 5.0 5.0 8.0
Wi-Fi yes yes yes yes yes yes yes yes
GPS no no no no no no yes yes
Dual SIM yes yes yes yes yes yes no yes
Talk time (hrs) 4.0 NA 3.0 4.0 4.0 6.0 6.0 3.0
Standby time (hrs) 72 NA 90 72 90 72 80 90
Wholesale Price (USD) 65 78 70 82 130 150 185 240
NON-BRANDED OEMs
Source: Company data, Credit Suisse estimates

07 January 2013
Handset Industry 2013 Outlook 91
Companies Mentioned (Price as of 04-Jan-2013)
Samsung Electronics (005930.KS, W1,525,000) LG Electronics Inc (066570.KS, W78,700) China Telecom (0728.HK, HK$4.3) China Unicom Hong Kong Ltd (0762.HK, HK$12.78) ZTE Corporation (0763.HK, HK$13.72) China Mobile Limited (0941.HK, HK$90.65) Semiconductor Manufacturing International Corp. (0981.HK, HK$0.43) Lenovo Group Ltd (0992.HK, HK$7.5) United Microelectronics (2303.TW, NT$12.4) Advanced Semicon. Engr. (2311.TW, NT$26.2) Taiwan Semiconductor Manufacturing (2330.TW, NT$101.5) Foxconn Technology Corp (2354.TW, NT$89.5) MediaTek Inc. (2454.TW, NT$305.5) HTC Corp (2498.TW, NT$287.0) Sony (6758.T, ¥968) Apple Inc (AAPL.OQ, $527.02) Amazon com Inc. (AMZN.OQ, $259.15) Broadcom Corp. (BRCM.OQ, $34.44) Cisco Systems Inc. (CSCO.OQ, $20.5) Deutsche Telekom (DTEGn.F, €8.86) Ericsson (ERICb.ST, Skr68.05) Google, Inc. (GOOG.OQ, $737.97) Leap Wireless (LEAP.OQ, $6.98) Marvell Technology Group Ltd. (MRVL.OQ, $7.82) Microsoft Corporation (MSFT.OQ, $26.78) Nokia (NOK1V.HE, €3.22) QUALCOMM Inc. (QCOM.OQ, $63.56) RDA Microelectronics (RDA.OQ, $10.98) Research In Motion Limited (RIMM.OQ, $11.95) Sprint (S.N, $5.92) Spreadtrum Communication (SPRD.OQ, $17.17) AT&T (T.N, $35.23) Texas Instruments Inc. (TXN.OQ, $31.84) Verizon (VZ.N, $44.3)
Disclosure Appendix
Important Global Disclosures
Kulbinder Garcha and Achal Sultania, each certify, with respect to the companies or securities that the individual analyzes, that (1) the views expressed in this report accurately reflect his or her personal views about all of the subject companies and securities and (2) no part of his or her compensation was, is or will be directly or indirectly related to the specific recommendations or views expressed in this report.
The analyst(s) responsible for preparing this research report received Compensation that is based upon various factors including Credit Suisse's total revenues, a portion of which are generated by Credit Suisse's investment banking activities
As of December 10, 2012 Analysts’ stock rating are defined as follows:
Outperform (O) : The stock’s total return is expected to outperform the relevant benchmark*over the next 12 months.
Neutral (N) : The stock’s total return is expected to be in line with the relevant benchmark* over the next 12 months.
Underperform (U) : The stock’s total return is expected to underperform the relevant benchmark* over the next 12 months.
*Relevant benchmark by region: As of 10th December 2012, Japanese ratings are based on a stock’s total return relative to the analyst's coverage universe which consists of all companies covered by the analyst within the relevant sector, with Outperforms representing the most attractive, Neutrals the less attractive, and Underperforms the least attractive investment opportunities. As of 2nd October 2012, U.S. and Can adian as well as European ratings are based on a stock’s total return relative to the analyst's coverage universe which consists of all companies covered by the analyst within the relevant sector, with Outperforms representing the most attractive, Neutrals the less attractive, and Underperforms the least attractive investment opportunities. For Latin American and non -Japan Asia stocks, ratings are based on a stock’s total return relative to the average total return of the relevant country or regional benchm ark; Australia, New Zealand are, and prior to 2nd October 2012 U.S. and Canadian ratings were based on (1) a stock’s absolute total return potential to its current share price and (2) the relative attractiveness of a stock’s total return potential within an analyst’s coverage universe. For Australian and New Zealand stocks, 12 -month rolling yield is incorporated in the absolute total return calculation and a 15% and a 7.5% threshold replace the 10-15% level in the Outperform and Underperform stock rating definitions, respectively. The 15% and 7.5% thresholds replace the +10-15% and -10-15% levels in the Neutral stock rating definition, respectively. Prior to 10th December 2012, Japanese ratings were based on a stock’s total return relative to the average total return of the relevant country or regional benchmark.
Restricted (R) : In certain circumstances, Credit Suisse policy and/or applicable law and regulations preclude certain types of communications, including an investment recommendation, during the course of Credit Suisse's engagement in an investment banking transaction and in certain other circumstances.

07 January 2013
Handset Industry 2013 Outlook 92
Volatility Indicator [V] : A stock is defined as volatile if the stock price has moved up or down by 20% or more in a month in at least 8 of the past 24 months or the analyst expects significant volatility going forward.
Analysts’ sector weightings are distinct from analysts’ stock ratings and are based on the analyst’s expectations for the fundamentals and/or valuation of the sector* relative to the group’s historic fundamentals and/or valuation:
Overweight : The analyst’s expectation for the sector’s fundamentals and/or valuation is favorable over the next 12 months.
Market Weight : The analyst’s expectation for the sector’s fundamentals and/or valuation is neutral over the next 12 months.
Underweight : The analyst’s expectation for the sector’s fundamentals and/or valuation is cautious over the next 12 months.
*An analyst’s coverage sector consists of all companies covered by the analyst within the re levant sector. An analyst may cover multiple sectors.
Credit Suisse's distribution of stock ratings (and banking clients) is:
Global Ratings Distribution
Rating Versus universe (%) Of which banking clients (%)
Outperform/Buy* 42% (53% banking clients)
Neutral/Hold* 39% (47% banking clients)
Underperform/Sell* 15% (43% banking clients)
Restricted 3%
*For purposes of the NYSE and NASD ratings distribution disclosure requirements, our stock ratings of Outperform, Neutral, an d Underperform most closely correspond to Buy, Hold, and Sell, respectively; however, the meanings are not the same, as our stock ratings are determined o n a relative basis. (Please refer to definitions above.) An investor's decision to buy or sell a security should be based on invest ment objectives, current holdings, and other individual factors.
Credit Suisse’s policy is to update research reports as it deems appropriate, based on developments with the subject company, the sector or the market that may have a material impact on the research views or opinions stated herein.
Credit Suisse's policy is only to publish investment research that is impartial, independent, clear, fair and not misleading. For more detail please refer to Credit Suisse's Policies for Managing Conflicts of Interest in connection with Investment Research: http://www.csfb.com/research and analytics/disclaimer/managing_conflicts_disclaimer.html
Credit Suisse does not provide any tax advice. Any statement herein regarding any US federal tax is not intended or written to be used, and cannot be used, by any taxpayer for the purposes of avoiding any penalties.
Please refer to the firm's disclosure website at www.credit-suisse.com/researchdisclosures for the definitions of abbreviations typically used in the target price method and risk sections.
See the Companies Mentioned section for full company names
The subject company (005930.KS, 066570.KS, 0728.HK, 0941.HK, 2354.TW, AAPL.OQ, 0763.HK, 2454.TW, 2498.TW, AMZN.OQ, BRCM.OQ, DTEGn.F, ERICb.ST, GOOG.OQ, 6758.T, CSCO.OQ, MSFT.OQ, NOK1V.HE, RIMM.OQ, S.N, T.N, VZ.N) currently is, or was during the 12-month period preceding the date of distribution of this report, a client of Credit Suisse.
Credit Suisse provided investment banking services to the subject company (066570.KS, 0941.HK, 2454.TW, AMZN.OQ, DTEGn.F, ERICb.ST, GOOG.OQ, CSCO.OQ, MSFT.OQ, NOK1V.HE, S.N, T.N, VZ.N) within the past 12 months.
Credit Suisse provided non-investment banking services to the subject company (005930.KS, 066570.KS, AAPL.OQ, 0763.HK, BRCM.OQ, DTEGn.F, ERICb.ST, 6758.T, CSCO.OQ, MSFT.OQ, NOK1V.HE, S.N, T.N, VZ.N) within the past 12 months
Credit Suisse has managed or co-managed a public offering of securities for the subject company (066570.KS, DTEGn.F, NOK1V.HE, S.N, T.N, VZ.N) within the past 12 months.
Credit Suisse has received investment banking related compensation from the subject company (066570.KS, 0941.HK, 2454.TW, AMZN.OQ, DTEGn.F, ERICb.ST, GOOG.OQ, CSCO.OQ, MSFT.OQ, NOK1V.HE, S.N, T.N, VZ.N) within the past 12 months
Credit Suisse expects to receive or intends to seek investment banking related compensation from the subject company (005930.KS, 066570.KS, 0728.HK, 0762.HK, 0941.HK, AAPL.OQ, 2454.TW, 2498.TW, AMZN.OQ, BRCM.OQ, DTEGn.F, ERICb.ST, GOOG.OQ, CSCO.OQ, MSFT.OQ, NOK1V.HE, QCOM.OQ, RIMM.OQ, S.N, SPRD.OQ, T.N, VZ.N) within the next 3 months.
Credit Suisse has received compensation for products and services other than investment banking services from the subject company (005930.KS, 066570.KS, AAPL.OQ, 0763.HK, BRCM.OQ, DTEGn.F, ERICb.ST, 6758.T, CSCO.OQ, MSFT.OQ, NOK1V.HE, S.N, T.N, VZ.N) within the past 12 months
As of the date of this report, Credit Suisse makes a market in the following subject companies (AAPL.OQ, AMZN.OQ, BRCM.OQ, GOOG.OQ, 6758.T, CSCO.OQ, LEAP.OQ, MSFT.OQ, QCOM.OQ, RIMM.OQ, S.N, SPRD.OQ, T.N, VZ.N).
As of the end of the preceding month, Credit Suisse beneficially own 1% or more of a class of common equity securities of (0728.HK, 0763.HK, 2454.TW, 2498.TW, DTEGn.F, NOK1V.HE).
Credit Suisse has a material conflict of interest with the subject company (2454.TW). Credit Suisse is acting as the Joint non-exclusive financial advisor and facilitator to Mediatek on their announced tender offer for Mstar Semiconductor Inc.

07 January 2013
Handset Industry 2013 Outlook 93
Credit Suisse has a material conflict of interest with the subject company (DTEGn.F). Credit Suisse Securities (USA) LLC is acting as financial advisor to MetroPCS Communications Inc on the announced proposed merger with Deutsche Telekom.
Credit Suisse has a material conflict of interest with the subject company (S.N). Credit Suisse acted as financial advisor to a shareholder of Clearwire in connection with the announced proposed acquisition of Clearwire by Sprint.
Important Regional Disclosures
Singapore recipients should contact Credit Suisse AG, Singapore Branch for any matters arising from this research report.
The analyst(s) involved in the preparation of this report have not visited the material operations of the subject company (005930.KS, 066570.KS, 0728.HK, 0762.HK, 0941.HK, 2354.TW, 0763.HK, 2454.TW, 2498.TW, AMZN.OQ, BRCM.OQ, DTEGn.F, ERICb.ST, GOOG.OQ, 6758.T, CSCO.OQ, LEAP.OQ, MSFT.OQ, NOK1V.HE, QCOM.OQ, RIMM.OQ, S.N, SPRD.OQ, T.N, VZ.N) within the past 12 months
An analyst involved in the preparation of this report has visited certain material operations of the subject company (AAPL.OQ) within the past 12 months
The travel expenses of the analyst in connection with such visits were not paid or reimbursed by the subject company, other than de minimus local travel expenses.
Restrictions on certain Canadian securities are indicated by the following abbreviations: NVS--Non-Voting shares; RVS--Restricted Voting Shares; SVS--Subordinate Voting Shares.
Individuals receiving this report from a Canadian investment dealer that is not affiliated with Credit Suisse should be advised that this report may not contain regulatory disclosures the non-affiliated Canadian investment dealer would be required to make if this were its own report.
For Credit Suisse Securities (Canada), Inc.'s policies and procedures regarding the dissemination of equity research, please visit http://www.csfb.com/legal_terms/canada_research_policy.shtml.
The following disclosed European company/ies have estimates that comply with IFRS: (DTEGn.F, ERICb.ST, NOK1V.HE).
As of the date of this report, Credit Suisse acts as a market maker or liquidity provider in the equities securities that are the subject of this report.
Principal is not guaranteed in the case of equities because equity prices are variable.
Commission is the commission rate or the amount agreed with a customer when setting up an account or at any time after that.
To the extent this is a report authored in whole or in part by a non-U.S. analyst and is made available in the U.S., the following are important disclosures regarding any non-U.S. analyst contributors: The non-U.S. research analysts listed below (if any) are not registered/qualified as research analysts with FINRA. The non-U.S. research analysts listed below may not be associated persons of CSSU and therefore may not be subject to the NASD Rule 2711 and NYSE Rule 472 restrictions on communications with a subject company, public appearances and trading securities held by a research analyst account.
Credit Suisse Securities (Europe) Limited ......................................................................................................................................... Achal Sultania
Important Credit Suisse HOLT Disclosures
With respect to the analysis in this report based on the Credit Suisse HOLT methodology, Credit Suisse certifies that (1) the views expressed in this report accurately reflect the Credit Suisse HOLT methodology and (2) no part of the Firm’s compensation was, is, or will be directly related to the specific views disclosed in this report
The Credit Suisse HOLT methodology does not assign ratings to a security. It is an analytical tool that involves use of a set of proprietary quantitative algorithms and warranted value calculations, collectively called the Credit Suisse HOLT valuation model, that are consistently applied to all the companies included in its database. Third-part data (including consensus earnings estimates) are systematically translated into a number of default algorithms available in the Credit Suisse HOLT valuation model. The source financial statement, pricing, and earnings data provided by outside data vendors are subject to quality control and may also be adjusted to more closely measure the underlying economics of firm performance. The adjustments provide consistency when analyzing a single company across time, or analyzing multiple companies across industries or national borders. The default scenario that is produced by the Credit Suisse HOLT valuation model establishes the baseline valuation for a security, and a user then may adjust the default variables to produce alternative scenarios, any of which could occur.
Additional information about the Credit Suisse HOLT methodology is available on request.
The Credit Suisse HOLT methodology does not assign a price target to a security. The default scenario that is produced by the Credit Suisse HOLT valuation model establishes a warranted price for a security, and as the third-party data are updated, the warranted price may also change. The default variable may also be adjusted to produce alternative warranted prices, any of which could occur.
CFROI®, HOLT, HOLTfolio, ValueSearch, AggreGator, Signal Flag and “Powered by HOLT” are trademarks or service marks or registered trademarks or registered service marks of Credit Suisse or its affiliates in the United States and other countries. HOLT is a corporate performance and valuation advisory service of Credit Suisse.
For Credit Suisse disclosure information on other companies mentioned in this report, please visit the website at www.credit-suisse.com/researchdisclosures or call +1 (877) 291-2683.

07 January 2013
Handset Industry 2013 Outlook 94
References in this report to Credit Suisse include all of the subsidiaries and affiliates of Credit Suisse operating under its investment banking division. For more information on our structure, please use the following link: https://www.credit-suisse.com/who_we_are/en/.This report may contain material that is not directed to, or intended for distribution to or use by, any person or entity who is a citizen or resident of or located in any locality, state, country or other jurisdiction where such distribution, publication, availability or use would be contrary to law or regulation or which would subject Credit Suisse AG or its affiliates ("CS") to any registration or licensing requirement within such jurisdiction. All material presented in this report, unless specifically indicated otherwise, is under copyright to CS. None of the material, nor its content, nor any copy of it, may be altered in any way, transmitted to, copied or distributed to any other party, without the prior express written permission of CS. All trademarks, service marks and logos used in this report are trademarks or service marks or registered trademarks or service marks of CS or its affiliates. The information, tools and material presented in this report are provided to you for information purposes only and are not to be used or considered as an offer or the solicitation of an offer to sell or to buy or subscribe for securities or other financial instruments. CS may not have taken any steps to ensure that the securities referred to in this report are suitable for any particular investor. CS will not treat recipients of this report as its customers by virtue of their receiving this report. The investments and services contained or referred to in this report may not be suitable for you and it is recommended that you consult an independent investment advisor if you are in doubt about such investments or investment services. Nothing in this report constitutes investment, legal, accounting or tax advice, or a representation that any investment or strategy is suitable or appropriate to your individual circumstances, or otherwise constitutes a personal recommendation to you. CS does not advise on the tax consequences of investments and you are advised to contact an independent tax adviser. Please note in particular that the bases and levels of taxation may change. Information and opinions presented in this report have been obtained or derived from sources believed by CS to be reliable, but CS makes no representation as to their accuracy or completeness. CS accepts no liability for loss arising from the use of the material presented in this report, except that this exclusion of liability does not apply to the extent that such liability arises under specific statutes or regulations applicable to CS. This report is not to be relied upon in substitution for the exercise of independent judgment. CS may have issued, and may in the future issue, other communications that are inconsistent with, and reach different conclusions from, the information presented in this report. Those communications reflect the different assumptions, views and analytical methods of the analysts who prepared them and CS is under no obligation to ensure that such other communications are brought to the attention of any recipient of this report. CS may, to the extent permitted by law, participate or invest in financing transactions with the issuer(s) of the securities referred to in this report, perform services for or solicit business from such issuers, and/or have a position or holding, or other material interest, or effect transactions, in such securities or options thereon, or other investments related thereto. In addition, it may make markets in the securities mentioned in the material presented in this report. CS may have, within the last three years, served as manager or co-manager of a public offering of securities for, or currently may make a primary market in issues of, any or all of the entities mentioned in this report or may be providing, or have provided within the previous 12 months, significant advice or investment services in relation to the investment concerned or a related investment. Additional information is, subject to duties of confidentiality, available on request. Some investments referred to in this report will be offered solely by a single entity and in the case of some investments solely by CS, or an associate of CS or CS may be the only market maker in such investments. Past performance should not be taken as an indication or guarantee of future performance, and no representation or warranty, express or implied, is made regarding future performance. Information, opinions and estimates contained in this report reflect a judgment at its original date of publication by CS and are subject to change without notice. The price, value of and income from any of the securities or financial instruments mentioned in this report can fall as well as rise. The value of securities and financial instruments is subject to exchange rate fluctuation that may have a positive or adverse effect on the price or income of such securities or financial instruments. Investors in securities such as ADR's, the values of which are influenced by currency volatility, effectively assume this risk. Structured securities are complex instruments, typically involve a high degree of risk and are intended for sale only to sophisticated investors who are capable of understanding and assuming the risks involved. The market value of any structured security may be affected by changes in economic, financial and political factors (including, but not limited to, spot and forward interest and exchange rates), time to maturity, market conditions and volatility, and the credit quality of any issuer or reference issuer. Any investor interested in purchasing a structured product should conduct their own investigation and analysis of the product and consult with their own professional advisers as to the risks involved in making such a purchase. Some investments discussed in this report may have a high level of volatility. High volatility investments may experience sudden and large falls in their value causing losses when that investment is realised. Those losses may equal your original investment. Indeed, in the case of some investments the potential losses may exceed the amount of initial investment and, in such circumstances, you may be required to pay more money to support those losses. Income yields from investments may fluctuate and, in consequence, initial capital paid to make the investment may be used as part of that income yield. Some investments may not be readily realisable and it may be difficult to sell or realise those investments, similarly it may prove difficult for you to obtain reliable information about the value, or risks, to which such an investment is exposed. This report may provide the addresses of, or contain hyperlinks to, websites. Except to the extent to which the report refers to website material of CS, CS has not reviewed any such site and takes no responsibility for the content contained therein. Such address or hyperlink (including addresses or hyperlinks to CS's own website material) is provided solely for your convenience and information and the content of any such website does not in any way form part of this document. Accessing such website or following such link through this report or CS's website shall be at your own risk. This report is issued and distributed in Europe (except Switzerland) by Credit Suisse Securities (Europe) Limited, One Cabot Square, London E14 4QJ, England, which is regulated in the United Kingdom by The Financial Services Authority ("FSA"). This report is being distributed in Germany by Credit Suisse Securities (Europe) This report is being distributed in the United States and Canada by Credit Suisse Securities (USA) LLC; in Switzerland by Credit Suisse AG; in Brazil by Banco de Investimentos Credit Suisse (Brasil) S.A or its affiliates; in Mexico by Banco Credit Suisse (México), S.A. (transactions related to the securities mentioned in this report will only be effected in compliance with applicable regulation); in Japan by Credit Suisse Securities (Japan) Limited, Financial Instruments Firm, Director-General of Kanto Local Finance Bureau (Kinsho) No. 66, a member of Japan Securities Dealers Association, The Financial Futures Association of Japan, Japan Investment Advisers Association, Type II Financial Instruments Firms Association; elsewhere in Asia/ Pacific by whichever of the following is the appropriately authorised entity in the relevant jurisdiction: Credit Suisse (Hong Kong) Limited, Credit Suisse Equities (Australia) Limited, Credit Suisse Securities (Thailand) Limited, Credit Suisse Securities (Malaysia) Sdn Bhd, Credit Suisse AG, Singapore Branch, Credit Suisse Securities (India) Private Limited regulated by the Securities and Exchange Board of India (registration Nos. INB230970637; INF230970637; INB010970631; INF010970631), having registered address at 9th Floor, Ceejay House, Dr.A.B. Road, Worli, Mumbai - 18, India, T- +91-22 6777 3777, Credit Suisse Securities (Europe) Limited, Seoul Branch, Credit Suisse AG, Taipei Securities Branch, PT Credit Suisse Securities Indonesia, Credit Suisse Securities (Philippines ) Inc., and elsewhere in the world by the relevant authorised affiliate of the above. Research on Taiwanese securities produced by Credit Suisse AG, Taipei Securities Branch has been prepared by a registered Senior Business Person. Research provided to residents of Malaysia is authorised by the Head of Research for Credit Suisse Securities (Malaysia) Sdn Bhd, to whom they should direct any queries on +603 2723 2020. This research may not conform to Canadian disclosure requirements. In jurisdictions where CS is not already registered or licensed to trade in securities, transactions will only be effected in accordance with applicable securities legislation, which will vary from jurisdiction to jurisdiction and may require that the trade be made in accordance with applicable exemptions from registration or licensing requirements. Non-U.S. customers wishing to effect a transaction should contact a CS entity in their local jurisdiction unless governing law permits otherwise. U.S. customers wishing to effect a transaction should do so only by contacting a representative at Credit Suisse Securities (USA) LLC in the U.S. Please note that this research was originally prepared and issued by CS for distribution to their market professional and institutional investor customers. Recipients who are not market professional or institutional investor customers of CS should seek the advice of their independent financial advisor prior to taking any investment decision based on this report or for any necessary explanation of its contents. This research may relate to investments or services of a person outside of the UK or to other matters which are not regulated by the FSA or in respect of which the protections of the FSA for private customers and/or the UK compensation scheme may not be available, and further details as to where this may be the case are available upon request in respect of this report. CS may provide various services to US municipal entities or obligated persons ("municipalities"), including suggesting individual transactions or trades and entering into such transactions. Any services CS provides to municipalities are not viewed as "advice" within the meaning of Section 975 of the Dodd-Frank Wall Street Reform and Consumer Protection Act. CS is providing any such services and related information solely on an arm's length basis and not as an advisor or fiduciary to the municipality. In connection with the provision of the any such services, there is no agreement, direct or indirect, between any municipality (including the officials, management, employees or agents thereof) and CS for CS to provide advice to the municipality. Municipalities should consult with their financial, accounting and legal advisors regarding any such services provided by CS. In addition, CS is not acting for direct or indirect compensation to solicit the municipality on behalf of an unaffiliated broker, dealer, municipal securities dealer, municipal advisor, or investment adviser for the purpose of obtaining or retaining an engagement by the municipality for or in connection with Municipal Financial Products, the issuance of municipal securities, or of an investment adviser to provide investment advisory services to or on behalf of the municipality. If this report is being distributed by a financial institution other than Credit Suisse AG, or its affiliates, that financial institution is solely responsible for distribution. Clients of that institution should contact that institution to effect a transaction in the securities mentioned in this report or require further information. This report does not constitute investment advice by Credit Suisse to the clients of the distributing financial institution, and neither Credit Suisse AG, its affiliates, and their respective officers, directors and employees accept any liability whatsoever for any direct or consequential loss arising from their use of this report or its content. Principal is not guaranteed. Commission is the commission rate or the amount agreed with a customer when setting up an account or at any time after that.
Copyright © 2013 CREDIT SUISSE AG and/or its affiliates. All rights reserved.
Investment principal on bonds can be eroded depending on sale price or market price. In addition, there are bonds on which investment principal can be eroded due to changes in redemption amounts. Care is required when investing in such instruments.
When you purchase non-listed Japanese fixed income securities (Japanese government bonds, Japanese municipal bonds, Japanese government guaranteed bonds, Japanese corporate bonds) from CS as a seller, you will be requested to pay the purchase price only.
Handset Outlook 2013_07 JAN.doc