handbook of statistical modeling for the social and ...978-1-4899-1292-3/1.pdfspringer...
TRANSCRIPT
Handbook of Statistical Modeling for the Social and Behavioral Sciences

Handbook of Statistical Modeling for the Social and Behavioral Sciences
Edited by
Gerhard Arminger Bergische Universitiit Wuppertal Wuppertal, Germany
Clifford C. Clogg Late of Pennsylvania State University University Park, Pennsylvania
and
Michael E. Sobel University of Arizona Tucson, Arizona
SPRINGER SCIENCE+BUSINESS MEDIA, LLC
Library of Congress Cataloging-in-Publication Data
Handbook of statlstlcal modellng for the soclal and behaVloral SClences / edlted by Gerhard Armlnger, Cllfford C. Clogg, and Mlchael E. SobeI.
p. cm. Includes bibllographlca I references and lndex.
1. Soclal sciences--Statlstlcal methods. 2. Psychology--Statlstlcal methods. 1. Armlnger, Gerhard. II. Clogg, Cllfford C. III. SobeI, Michael E. HA29.H2487 1994 300' .1'5195--dc20
ISBN 978-1-4899-1294-7
© 1995 Springer Science+Business Media New York Originally published by Plenum Press, New York in 1995
109876543
Ali rights reserved
94-43088 CIP
No part of this book may be reproduced, stored in a retrieval system, or transmitted in any fOfm Of by any means, electronic, mechanical, photocopying, microfilming, recording, or otherwise, without written permission from the Publisher
ISBN 978-1-4899-1294-7 ISBN 978-1-4899-1292-3 (eBook) DOI 10.1007/978-1-4899-1292-3
Softcover reprint ofthe hardcover 1st edition 1995

To Paula W eiBenbacher To the Memory of Richard G. Clogg
To the Memory of Irvin Sobel and Peggy Sobel
Contributors
Gerhard Arminger, Department of Economics, Bergische Universitat-GH Wuppertal, D-42097 Wuppertal, Germany
Michael W. Browne, Department of Psychology, Ohio State University, 142 Townshend Hall, 1885 Neil Avenue Mall, Columbus, Ohio43210, USA
Clifford C. Clogg~· Department of Sociology and Department of Statistics, Pennsylvania State University, University Park, Pennsylvania 16802, USA
Alfred Hamerle, Lehrstuhl fiir Statistik, U niversitat Regensburg, U niversitatsstr. 31, D-93053 Regensburg, Germany
Cheng Hsiao, Department of Economics, University of Southern California, Los Angeles, California 90089--0253, USA
Roderick J. A. Little, Department of Biostatistics, University of Michigan, 1420 Washington Heights, Ann Arbor, Michigan 48109-2029, USA
Nicholas T. Longford, Educational Testing Service, Princeton, New Jersey 08541, USA
Trond Petersen, Walter A. Haas School of Business, University of California, Berkeley, California 94720, USA
Gerd Ronning, Abteilung Statistik und Okonometrie I, Department of Economics, Eberhard-Karls-Universitat, Mohlstr. 36, D-72074 Tiibingen, Germany
Nathaniel Schenker, Department of Biostatistics, UCLA School of Public Health, 10833 Le Conte Avenue, Los Angeles, California 90024-1772, USA
Michael E. Sobel, Department of Sociology, University of Arizona, Tucson, Arizona 85721, USA
t Deceased
vii
Foreword
It is a pleasure to be able to contribute a foreword to this impressive handbook on quantitative methods for the analysis of data. Too often attempts such as this appear to consist of rather disconnected chapters on favorite, but possibly narrow, topics of distinguished contributors. Not so with this one! The editors have done an admirable job of blending contributions from distinguished researchers into a coherent package.
Throughout the chapters, simple but realistic examples are used to introduce fundamental ideas, and the individual authors do an especially good job of relating more advanced procedures to more basic ones, which should already be familiar to most researchers. Also, all chapters indicate, at least to some extent, the availability of software for implementing the procedures being discussed; this enterprise is always a bit hazardous in that software is constantly being born, modified, and dying, but the choice to include such references is clearly preferable to excluding them.
The selection of topics is also excellent for a researcher approaching data already collected. The general focus on conceptual parametric modeling is on-target, as such models allow the formulation of crisp scientific hypotheses, and for the natural estimation of effects and intervals for them in addition to statistical tests. As these models and their applications become more extended and developed, I expect to see more full probability (Bayesian) modelling being used so that nuisance parameters and small sample complications can be more systematically handled. Eventually, this will lead to even more discussion of computational issues, including inference by simulation, especially iterative simulation.
This is a forward-looking book with many fine contributions- congratulations to the editors and to the other authors of individual chapters.
DONALD B. RUBIN
Professor and Chairman Department of Statistics Harvard University
ix

IN MEMORIAM
Clifford C. Clogg passed away on May 7, 1995. Cliff was an excellent colleague, and we shall miss working with him. But most of all, we mourn the loss of a very dear and special friend.
G.A. M.E.S.
Preface
This is a research handbook and a reference work for quantitative methodologists, applied statisticians, empirical researchers, and graduate students in disciplines such as communications, demography, economics, education, geography, political science, psychology, statistics, and sociology. Although the focus is on models and methods for the social and behavioral sciences, this volume should also be of interest to epidemiologists and others in the health sciences, as well as to business researchers, especially those engaged in organizational or marketing research.
Researchers in these fields face a number of common modeling problems. First, much or even most of1he research in these substantive fields is based on nonexperimental data, such as surveys and quasi-experiments. Second, variables to be modeled are usually measured with error. Failing to take measurement error into account typically leads to inferences that are not reliable. Third, measurements in these disciplines may be quantitative and continuous at one extreme or categorical and nominal at another. Fourth, in recent years, longitudinal data have become more common, and special methods are needed to take full advantage of the information in such data sets.
Each of the chapters in this handbook addresses one or more of the above issues. In
Chapter 1, Sobel considers the difficulties that arise in attempting to use nonexperimental data to draw causal inferences, while in Chapter 2, Little and Schenker discuss modern methods for dealing with another ubiquitous problem: missing data. In modeling data, researchers usually attempt to describe how one or more specified dependent variables is or are related to independent variables or predictors, and the inferences that are made can depend heavily on auxiliary assumptions. For example, the assumption of normal homoscedastic errors in regression analysis needs to be examined. Arminger's chapter on mean structures focuses on the construction of parametric models for the relation between a set of predictor variables and one or more specified dependent variables; here the relationship is to be described by the "mean structure," and one wants to use models and methods that are valid with as few auxiliary assumptions as possible. Browne andArminger's chapter on mean and covariance structure models discusses latent variable models for the case
where both the observed and unobserved variables are metrical, and the case where one or more of the observed variables are ordered categorical and the unobserved variables are metrical. Sobel's chapter on discrete data focuses primarily on log-linear models for contingency tables, where all the observed variables in the analysis are categorical, while Clogg's chapter on the latent class model focuses on latent variable models where both the observed and unobserved variables are discrete; he also briefly takes up the case where the observed variables are discrete and the unobserved variable is metrical, as in the Rasch model.
xii
Preface xiii
The next three chapters focus on methods for longitudinal data. Hsiao considers models for the analysis of panel data; here measurements on the sample of respondents are taken on several occasions. He shows how to take advantage of the panel setup to answer questions that cannot be addressed with data from a cross-sectional study, or that can be answered more confidently with panel data. Panel data are also the focus of the chapter by Hamerle and Ronning; whereas Hsiao is concerned with the case where the specified dependent variable is metrical, Hamerle and Ronning take up the case where the dependent variable is discrete. Finally, Petersen considers dynamic models for the analysis of event histories, or survival models, in which a respondent can change states at arbitrary times in the study interval.
Longford's chapter considers multilevel or hierarchical models. In many ways, these models are similar to the panel-data models discussed by Hsiao. However, in panel studies (without missing data) the observations are fully crossed (time by person), whereas in multilevel models, the observations are nested within larger clusters, e.g., persons within schools within school districts. The observations within a cluster tend to be more similar than those in different clusters, and Longford shows how to estimate models that take this clustering into account.
A number of other important topics were excluded from the volume. For example, there is no chapter on model selection principles; but each chapter addresses this topic in context. Given the focus on modeling, we did not include material on the collection of data, or on sampling design. We also focused on parametric modeling, excluding, for example, consideration of nonparametric estimation of regression functions and graphical procedures. In addition, we do not discuss time series models, as there is already a large literature on the subject. Similarly, a number of other topics were excluded, including spatial models and network analysis, the latter somewhat specific to sociology. Finally, the subject of graphical modeling is not considered, despite a large statistical literature on the topic. These and other topics are surely important, but it would have been difficult to include all of them in a one-volume handbook.
In order that the handbook be accessible and useful to empirical workers and advanced graduate students, we asked our authors to follow a common format. Each chapter introduces the models in a simple context, illustrating the types of problems and data for which the models are useful. We encouraged our authors to use examples throughout their chapters and to draw upon familiar models or procedures to motivate their contributions. In addition, all the chapters include material on software that can be used to estimate the models studied. Each chapter is largely self-contained, thereby allowing a researcher who wants to "study a certain type of model useful in his or her work to do so by focusing on a particular chapter, without having to study the rest of the handbook in depth. Similarly,
instructors can easily organize an advanced-graduate level course around one or more of the handbook's themes by focusing attention on several of the chapters. For example, a one semester course on longitudinal analysis might take up the chapters by Hsiao, Hamerle and Ronning, and Petersen.
At the same time, the handbook is also intended for use by those interested in the more technical aspects of these subjects. Therefore, we also asked our authors to prepare reviews that represent the "state of the art" in their area. Not only did all of our authors do so, but many of the chapters also contain original material.

xiv Preface
We are grateful to our authors for fulfilling the difficult task of writing clear papers targeted to diverse users, and for the good humor, grace, and patience they showed with our requests for rewrites and revisions. We very much appreciate the new material in a number of the chapters. We are also grateful to our editor, Eliot Werner, who has helped us at every stage of this project. Finally, we especially want to thank Daniel Enache and Ulrich Kiisters, who wrote the lt\TP' macros used to produce this book.

Contents
Contributors
Foreword by Donald B. Rubin
Preface
1 Causal Inference in the Social and Behavioral Sciences
Michael E. Sobel
1 2 3
Introduction . . . . . . . . . . . . . . . . . . . . . . . . . . . . . . . . Deterministic Causation in Philosophy . . . . . . . . . . . . . . . . . . . Probabilistic Causation: Variations on a Deterministic Regularity Account
4 5 6
3.1 Philosophical Treatments ......... . 3.2 Granger Causation in Economics . . . . . . Causation and Statistics: An Experimental Approach Causal Inference in "Causal Models" Discussion
2 Missing Data
RoderickJ. A. Little and Nathaniel Schenker
1 Introduction . . . . . . . . 1.1 Examples . . . . . 1.2 Important Concepts 1.3 NaiveApproaches . 1.4 More Principled Approaches
2 Weighting Adjustments for Unit Nonresponse . 3 Maximum Likelihood Assuming Ignorable N onresponse
3.1 Maximum-Likelihood Theory . . . . . . . . . . 3.2 The Expectation-Maximization Algorithm . . . 3.3 Some Important Ignorable Maximum-Likelihood Methods
4 Nonignorable Nonresponse Models 4.1 Introduction . . . . . . . . . . . 4.2 Probit Selection Model . . . . . 4.3 Normal Pattern-Mixture Models .
5 Multiple Imputation . . . . . . . . . . .
...
vii
ix
xii
1
1 4
10 10 14 17 27 32
39
39 40 42 44 46 46 48 48 49 51 55 55 56 58 59
XV

xvi
6
7
5.1 Imputation ................... . 5.2 Theoretical Motivation for Multiple Imputation . 5.3 Creating a Multiply Imputed Data Set . . 5.4 Analyzing a Multiply Imputed Data Set . Other Bayesian Simulation Methods . 6.1 Data Augmentation . . . . . . . . . . . 6.2 The Gibbs Sampler . . . . . . . . . . . 6.3 The Use of Iterative Simulation to Create Multiple Imputations . Discussion . . . . . . . . . . . . . . . . . . . . . . . . . . . . . .
Contents
59 62 63 65 66 67 67 68 69
3 Specification and Estimation of Mean Structures: Regression Models 77
Gerhard Arminger
1 Introduction . . . . . . . . . 77 2 The Linear Regression Model 80
2.1 Model Specification . 80 2.2 Estimation of Regression Coefficients . 84 2.3 Regression Diagnostics . . . . 89 2.4 Multivariate Linear Regression 97
3 Maximum Likelihood Estimation . . . 100 3.1 Loglikelihood function . . . . 100 3.2 Properties ofthe ML Estimator 101 3.3 Likelihood Ratio, Wald, and Lagrange Multiplier Tests 104 3.4 Restrictions on Parameters. . . 108
4 ML Estimation Under Misspecification 111 5 Pseudo-ML Estimation. . . . . . . . . 113
5.1 Mean Structures . . . . . . . . 113 5.2 The Linear Exponential Family 114 5.3 PropertiesofPMLEstimators . 121 5.4 ComputationofPMLEstimatorsWithFisherScoring. 124 5.5 PML WaldandPMLLagrangeMultiplierTests. 128 5.6 Regression Diagnostics Under PML Estimation . 129
6 Quasi Generalized PML Estimation . . . . . . . . . . . 131 6.1 Specification of Mean and Variance . . . . . . . 131 6.2 Properties of PML Estimation With Nuisance Parameters . 132 6.3 Computation of QGPML Estimators . . . . . . . . . . . . 135 6.4 QGPML Wald, Lagrange Multiplier, and Likelihood Ratio Tests 135 6.5 Regression Diagnostics Under QGPML Estimation . 136
7 Univariate Nonlinear Regression Models . . . 139 7.1 Models for Count Data . . . . . . . . 139 7.2 7.3 7.4 7.5
Standard Nonlinear Regression Models Models For Dichotomous Outcomes . . Quantit Models for Censored Outcomes . Generalized Linear Models . . . . . . .
143 146 150 153

Contents
8
9
Multivariate Nonlinear Regression Models . . . . . . . . . . . . . . 8.1 Models for Ordered Categorical Variables . . . . . . . . . . . 8.2 Models for Doubly Censored and Classified Metric Outcomes 8.3 Unordered Categorical Variables .......... . 8.4 Generalized Estimating Equations for Mean Structures Software ........................... .
xvii
160 160 164 166 172 177
4 Specification and Estimation of Mean- and Covariance-Structure Models 185
Michael W. Browne and Gerhard Arminger
1 Introduction . . . . . . . . . . . . . . . . . . . . . . . . . . . . . . . . 185 1.1 Background and Notation ° • • • • • • • • • • • • • • • • • • • 0 0 186 1.2 Scaling Considerations for Mean, Covariance, and Correlation Struc-
tures . . . . . . . . . . . . . . 187 1.3 Fitting the Moment Structure . . . . . . . . . . 0 • 0 • 0 • • • 0 188
2 Large Sample Properties of Estimators . . . . . . . . . . . . 0 • • • 0 • 0 194 2.1 Lack of Fit of the Model and the Assumption of Population Drift . 195 2.2 Reference Functions and Correctly Specified Discrepancy Functions 195
3 Computational Aspects . . 0 • 0 0 200 4 Examples of Moment Structures . . 203
4.1 The Factor Analysis Model 203 4.2 Structural Equation Models 205 4. 3 Other Mean and Covariance Structures 216
5 Mean and Covariance Structures with Nonmetric Dependent Variables 220
6
5.1 Unconditional and Conditional Mean and Covariance Structures 221 5.2 Inclusion of Threshold Models .. 0 • • • • • • • • • • • 0 • • 223 5.3 Conditional Polyserial and Polychoric Covariance and Correlation
Coefficients . . . . . 226 5.4 Estimation 0 • • • 0 0 0 0 0 0 0 0 0 • 0 0 0 0 0 • 0 0 • • • • • • • 227 5.5 Multigroup Analysis . . . . . . . . . 0 • • • • • • • • • • • • • • 232 5.6 Example: Achievement in and Attitude toward High School Math-
ematics Software ............ .
232 241
S The Analysis of Contingency Tables
Michael E. Sobel
251
1 Introduction . . . . . . . . . . . . . . . . . . . . 251 2 Introductory Examples . . . . . . . . . . . . . 0 • 253
2.1 Some Models for Univariate Distributions . 253 2.2 Measuring Association in the Two-by-Two Table: The Odds Ratio 259
3 Odds Ratios for Two- and Three-Way Tables 264 3.1 Odds Ratios for Two-Way Tables . 264 3.2 Odds Ratios for Three-Way Tables 0 265
xviii Contents
4 ModelsfortheTwo-WayTable . 266 4.1 Basic Models . . . . . . 266 4.2 Models for Square Tables 270 4.3 Models for Ordinal Variables 274
5 Models for the Three-Way Table . . . 282 5.1 Basic Models . . . . . . . . 282 5.2 Collapsibility in Models for the Three-Way Table . 285 5.3 Models for Tables with a One-to-One Correspondence among
Categories . . . . . . . . . . . . . . . . . 288 5.4 Models for Tables With Ordered Variables 289
6 Higher-Way Tables. . . . . . . . . . . . . . . . . 291 7 Estimation Theory . . . . . . . . . . . . . . . . . 293 8 Residual Analysis and Model-Selection Procedures 298 9 Software . . . . 300
9.1 GLIM . 300 9.2 BMDP . 301 9.3 SAS . . 301 9.4 SPSS. . 302 9.5 GAUSS 302 9.6 CDAS 302 9.7 S-Plus . 303
6 Latent Class Models
Clifford C. C/oggt
311
1 Introduction . . . . . . . . . . . . . . . . . . . . 311 2 ComputerPrograms . . . . . . . . . . . . . . . . 312 3 Latent Class Models and Latent Structure Models . 313 4 Basic Concepts and Notation . . . . . . . . 315 5 The Model Defined and Alternative Forms 317
5.1 MeasuringFit . . . . . . . . . . . 318 5.2 Alternative Forms of the Model . . 319
6 An Example: Latent Classes in the American Occupational Structure . 321 6.1 Standard Latent Class Models for Two-Way Tables . . . . . . 321 6.2 Some Related Models . . . . . . . . . . . . . . . . . . . . . 324
7 Research Contexts Giving Rise to Latent Classes and Latent Class Models 327 7.1 Medical Diagnosis . . . . . . . . . . . . . . . . . . . . . 327 7.2 Measuring Model Fit with Latent Class Evaluation Models 328 7.3 Rater Agreement. . . . . . . . . . . . . . . 330 7.4 Latent Class Models for Missing Categories. 332
8 Exploratory Latent Class Analysis and Clustering . . 333 9 Predicting Membership in Latent Classes . . . . . . 336 10 Latent Class Models in Multiple Groups: Categorical Covariates in Latent
Class Analysis . . . . . . . . . . . . . . . . . . . . . . . . . . . . . . . 340 t Deceased

Contents xix
11 Scaling, Measurement, and Scaling Models as Latent Class Models . 343 11.1 Ordinal X . . . . . . . . . . . . . . . 343 11.2 Classical Scaling Models . . . . . . . . . . . . . . . . . 344
11.3 The Rasch Model and Related Models . . . . . . . . . . . 348
11.4 Extending Latent Class Models to Other Scaling Contexts 351
12 Conclusion . . . . . . . . . . . . . . . . . . . . . . . . . . . . . 352
7 Panel Analysis for Metric Data
Cheng Hsiao
1 2
3
4 5 6 7 8
9
Introduction A General Framework . . 2.1 The Basic Model . 2.2 A Bayes Solution Two Extreme Cases- All Cross-Sectional Units Have the Same Behavioral Pattern versus Different Units Have Different Behavioral Patterns .
3.1 A Common Model for All Cross-Sectional Units . . 3.2 Different Models for Different Cross-Sectional Units Variable Intercept Model . . . Error Components Models . . . . . . . . . . . Random Coefficients Models . . . . . . . . . Mixed Fixed and Random Coefficients Models Random or Fixed Effects (Parameters) . 8.1 An Example . . . . . . . . . . . . . . 8.2 Some Basic Considerations ..... . 8.3 Correlations between Effects and Included Explanatory Variables .
8.4 Hypothesis Testing or Model Selection Conclusion . . . . . . . . . . . . . . . . . . . . . . . . . . . . . . . . .
8 Panel Analysis for Qualitative Variables
Alfred Hamer/e and Gerd Ronning
Introduction . . . . . . . . .
361
361 367 367 368
374 374 374 315 376 382 384 386 386 388 390 393 395
401
401 1 2 Some Regression Models for Binary Outcomes . . . . . . . . . . . . . . 402
3
2.1 Probit Model, Logit Model, Linear Probability Model, and Maxi-mum Likelihood Estimation . . . . . . . . . . . . . . . . . . . . 402
2.2 Generalized Least Squares Estimation When There Are Repeated Observations . . . . . . . . . . . . . . .
2.3 A Note on Interpretation ........ . 2.4 Models for Limited Dependent Variables Binary Regression Models for Panel Data 3.1 The Fixed Effects Logit Model 3.2 Random Effects Models ... 3.3 Random Coefficients Models .
407 409 409 411 413 417 422
XX
4
5 6
3.4 Probit Models With Autocorrelated Errors . 3.5 AutoregressiveProbitModels . 3.6 Panel Models for Ordinal Data Markov Chain Models . . . .
Tobit Models for Panel Data . . . . . . Models for Count Data . . . . . . . . . 6.1 Poisson Distribution and Negative Binomial Distribution . 6.2 6.3 6.4 6.5 6.6 6.7
Mixtures of Poisson Distributions The Poisson Model . . . . . . . . . . . . . . . . . . . . A Model with Overdispersion . . . . . . . . . . . . . . . Maximum Quasi-likelihood Estimation Under Overdispersion An Example with Cross-Sectional Data Panel Models for Count Data . . . . .
9 Analysis of Event Histories
Trond Petersen
1 2
3
Introduction Motivation . . . . . . . . . . The Hazard-Rate Framework 3.1 Basic Concepts ... 3.2
3.3 Discrete-Time Formulations .
Continuous-Time Formulations 4 Time-Independent Covariates .... . 5 Time-Dependent Covariates ..... . 6 Observability of the Dependent Variable . 7 Repeated Events . . . . . . . . . . . . . 8 Multistate Processes: Discrete State Space . 9 Multistate Processes: Continuous State Space .
10 Estimation Procedures . . . 11 Uno bserved Heterogeneity . . . . . . . . . . 12 Time-Aggregation Bias .......... . 13 Continuous- Versus Discrete-Time Models . 14 Structural Models for Event Histories ... . 15 SamplingPlans .............. .
15.1 A Conditional Likelihood for ta, given tb 15.2 Likelihood for tb and Joint Likelihood for ta and tb 15.3 Full Likelihood in tb, ta, and x .
16 Left Censoring . 17 Conclusion . . . . . . . . . . . . . . .
Contents
423 429 431 433
435 437 437 438 438 439 441
442 444
453
453 455 456 456 457
458 465
469 476 478 481 483 488 492 495 498 500 501
504 505 508 511
512
Contents
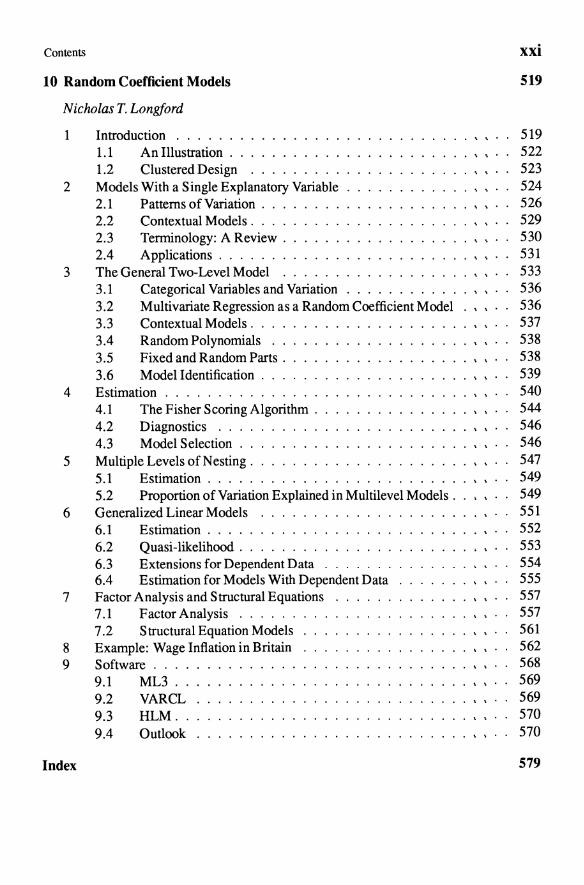
10 Random Coefficient Models
Nicholas T. Longford
1
2
3
4
5
6
7
8 9
Index
Introduction . . . . . . . 1.1 An Illustration . . 1.2 Clustered Design Models With a Single Explanatory Variable 2.1 Patterns of Variation . . . 2.2 Contextual Models . . . . 2.3 Terminology: A Review . 2.4 Applications . . . . . . . The General Two-Level Model 3.1 Categorical Variables and Variation 3.2 Multivariate Regression as a Random Coefficient Model 3.3 Contextual Models .... 3.4 Random Polynomials . . 3.5 Fixed and Random Parts . 3.6 Model Identification . . . Estimation ........... . 4.1 The Fisher Scoring Algorithm . 4.2 Diagnostics . . . . 4.3 Model Selection .. Multiple Levels of Nesting. 5.1 Estimation ..... 5.2 Proportion of Variation Explained in Multilevel Models . Generalized Linear Models 6.1 Estimation . . . . . . . . . . . 6.2 Quasi-likelihood ....... . 6.3 Extensions for Dependent Data 6.4 Estimation for Models With Dependent Data Factor Analysis and Structural Equations 7.1 Factor Analysis ..... . 7.2 Structural Equation Models Example: Wage Inflation in Britain Software .... 9.1 ML3 .. 9.2 VARCL 9.3 HLM .. 9.4 Outlook
xxi
519
519 522 523 524 526 529 530 531 533 536 536 537 538 538 539 540 544 546 546 547 549 549 551 552 553 554 555 557 557 561 562 568 569 569 570 570
579