handbook of human factors and ergonomics (salvendy/handbook of human factors 4e) || human error and...
TRANSCRIPT

CHAPTER 26HUMAN ERROR AND HUMAN RELIABILITYANALYSIS
Joseph SharitUniversity of MiamiCoral Gables, Florida
1 INTRODUCTION 734
1.1 Some Perspectives on Human Error 734
1.2 Defining Human Error 736
2 UNDERSTANDING HUMAN ERROR 737
2.1 Basic Framework: Human Fallibility,Context, and Barriers 737
2.2 Human Fallibility 738
2.3 Context 745
2.4 Barriers 748
3 ERROR TAXONOMIES AND PREDICTINGHUMAN ERROR 751
3.1 Classifying Human Error 751
3.2 Predicting Human Error 752
4 HUMAN RELIABILITY ANALYSIS 760
4.1 Probabilistic Risk Assessment 760
4.2 Methods of HRA 764
4.3 THERP 766
4.4 HEART and NARA 768
4.5 SPAR-H 769
4.6 Time-Related HRA Models 771
4.7 SLIM 773
4.8 Holistic Decision Tree Method 775
4.9 CREAM 776
4.10 HRA Methods: Concluding Remarks 781
5 MANAGING HUMAN ERROR 782
5.1 Designer Error 782
5.2 Automation and Human Error 784
5.3 Human Error in Maintenance 786
5.4 Incident-Reporting Systems 787
6 ORGANIZATIONAL CULTUREAND RESILIENCE 790
6.1 Columbia Accident 792
6.2 Deepwater Horizon Accident 793
7 FINAL REMARKS 795
REFERENCES 796
1 INTRODUCTION
1.1 Some Perspectives on Human Error
A fundamental objective of human factors and ergo-nomics is to design and facilitate the control of vari-ous artifacts, such as devices, systems, interfaces, rules,and procedures, to enable safe and effective performanceoutcomes. In principle, the realization of this goal entailsa detailed understanding of how these artifacts mightbear upon the limitations and capabilities of their users.It is when the consequences related to the artifact’s useare judged to be sufficiently harmful or inappropriatethat people may be conferred with the attribution ofhuman error. These people might include those responsi-ble for conceptualizing and designing the artifact; thoseresponsible for installing, maintaining, or providinginstruction on its use; those who determine and overseethe rules governing its use; or those who actually use it.
Concerns for human error were a major influence inestablishing the area of human factors (Helander, 1997)
and have since become increasingly emphasized in prod-uct and system design and in the operations of variousorganizations. Human error is also often on the mindsof the general public as they acknowledge, if not fullyunderstand, the failures in their everyday interactionswith products or in their situational assessments or areswept up into the media’s coverage of high-profile acci-dents that are often attributed to faulty human actions ordecisions. Yet, despite the apparent ubiquity of humanerror, its attribution has been far from straightforward.
For example, for a good part of the twentieth centurythe dominant perspective on human error by manyU.S. industries was to attribute adverse outcomes to thepersons whose actions were most closely associated tothese events—that is, to the people who were workingat what is now often referred to as the “sharp end.” Like-wise, most aircraft crashes were historically blamed onpilot error and, as in the industrial sector, there was littleinclination to scrutinize the design of the tools or system
734 Handbook of Human Factors and Ergonomics, Fourth Edition Gavriel SalvendyCopyright © 2012 John Wiley & Sons, Inc.

HUMAN ERROR AND HUMAN RELIABILITY ANALYSIS 735
or the situations with which the human was expected tocoexist.
In contrast, in the more current perspective thehuman is deemed to be a reasonable entity at the mercyof an array of design, organizational, and situationalfactors which can lead to behaviors external observerscome to regard, although to some often unfairly, ashuman errors. The appeal of this view should be readilyapparent in each of the following two cases. The firstcase involves a worker who is subjected to performinga task in a restricted space. While attempting to reachfor a tool, the worker’s forearm inadvertently brushesagainst a switch whose activation results in the emissionof heat from a device. Visual feedback concerning theactivation is not possible, due to the awkward posturethe worker must assume; tactile cues are not detectabledue to requirements for wearing protective clothing;and auditory feedback from the switch’s activation,which is normally barely audible, is not perceived dueto ambient noise levels. Residual vapors originatingfrom a rarely performed procedure during the previousshift ignite, resulting in an explosion.
In the second case, a worker adapts the relativelyrigid and unrealistic procedural requirements dictated ina written work procedure to demands that continuallymaterialize in the form of shifting objectives, constraintson resources, and changes in production schedules. Man-agement tacitly condones these procedural adaptations,in effect relying on the resourcefulness of the workerfor ensuring that its goals are met. However, when anunanticipated scenario causes the worker’s adaptationsto result in an accident, management is swift to renounceany support of the worker’s actions that were in violationof work procedures.
In the first case the worker’s action that led tothe accident was unintentional; in the second case theworker’s actions were intentional. In both cases, how-ever, whether the person committed an error is de-batable. One view that is consistent with this positionwould shift the blame for the adverse consequencesfrom the actor to management or the designers.Latent management or latent designer errors (Reason,1997)—that is, actions and decisions that occurred atthe “blunt end”—would thus absolve the actor fromhuman error in each of these cases. The worker, after all,was in the heat of the battle, performing “normal work,”responding to the work context in reasonable, even skill-ful ways. The human does not want his or her actionsor decisions to result in a negative consequence; in fact,such a desire would constitute sabotage, which is notwithin the realm of the topic of human error. In a sense,the human was “set up to fail” due to the context orsituation in which they were operating (Spurgin, 2010).
Of course, the process of shifting blame does nothave to end with designers. In the current landscapeof global competition designers may face pressuresthat limit their ability to adequately investigate theconditions under which their products will be used orto become sufficiently informed about the knowledgeand resources users would have available to them whenusing these products. Management, or the organizationsthey represent and lead, would then seem to be the true
architects of human failure, but even this attribution ofblame may be misleading. Regulatory agencies or eventhe federal government may have laid the groundwork,by virtue of poor assessments of needed control mech-anisms and through misdirected priorities, for the faultypolicies and decisions on the part of organizationsand ultimately for shaping or at least impacting theentrepreneurial and managerial cultures of these orga-nizations (Section 6). Governments themselves, how-ever, could hardly be expected to provide certainty insolutions and policies as they struggle to make sense ofthe information streaming from the complex and fluidmilieu of social, political, and economic forces.
Nonetheless, societal and organizational prescrip-tions in the form of policies and other types of remediesare powerful forces. Workers who disagree with thesepolicies, such as the worker in the case above whoadapted a procedure in the face of existing evidence, arethus risking being blamed for negative outcomes, espe-cially when such forces that run through an organizationare “hidden and undisclosed” (Dervin, 1998). At anyrate, what should be fairly clear is that attempts at pin-pointing the latent sources of human error or resolvinghow latent sources can collectively contribute to humanerror can be far from straightforward.
Another basis for dismissing attributions of humanerror derives from the doubt capable of being cast onthe error attribution process itself (Dekker, 2005). Byvirtue of having knowledge of events, especially badevents such as accidents, outside observers are able(and perhaps even motivated) to invoke a backwardseries of rationalizations and logical connections thathas neatly filtered out the subtle and complex situationaldetails that are likely to be the basis for the perpetratingactions. Whether this process of establishing causalityis due to convenience, hindsight bias (Fischhoff, 1975;Christoffersen and Woods, 1999; Dekker, 2001), or theinability to determine or comprehend the perceptionsand assessments made by the actor that interlace themore prominently observable events, the end result isa considerable underestimation of the influence of thecontext within which the person acts. Ultimately, thisobstruction at establishing cause and effect jeopardizesthe ability to learn from accidents and consequently theability to predict or prevent future failures.
Even the workers themselves, if given the opportu-nity in each of these cases to examine or reflect upontheir performance, may acknowledge their actions aserrors, easily spotting all the poor decisions and improp-erly executed actions, when in reality, within the framesof references at the time the behaviors occurred, theiractions were in fact reasonable and constituted “mostlynormal work.” The challenge, according to Dekker(2005), is “to understand how assessments and actionsthat from the outside look like errors become neutral-ized or normalized so that from the inside they appearunremarkable, routine, normal” (p. 75).
This view is also very consistent with that ofHollnagel (2004), who considers both normal humanperformance and performance failures (outcomes ofactions that differ from what was intended or required)as emergent properties of mutual dependencies that are

736 DESIGN FOR HEALTH, SAFETY, AND COMFORT
induced by the complexity and demands arising from theentire system. Therefore, it is not so much the variabilityof human actions that is responsible for failures but thevariability in the context and conditions to which thehuman is trying to adjust. This variability can result inirregular and unpredictable inputs (e.g., other people inthe system acting in unexpected ways); incompatibilitybetween demands (e.g., conflicting or unreasonableproduction requests) and available resources (e.g., lackof time, lack of training or experience for handling thesituation, or limits in cognitive capacity); and work-ing conditions falling outside of normal limits (e.g.,noise, poor communication channels, or inappropriatework schedules). Furthermore, system outputs that failto comply with expectations can result in protractedirregularity in inputs, leading to cycles of variability towhich the human must adjust.
While it is fair to assume that normally humans donot want to commit errors, there are situations wherehuman error is not only acceptable but also desirable.Mistakes during training exercises are often essentialfor developing the deductive, analogical, and inferentialskills needed to acquire expertise for handling routineproblems as well as the adaptability and creativityrequired for coping with less foreseen situations and,more generally, for learning.
In fact, it is natural for humans, when faced withuncertainty, to resort to exploratory trial-and-error be-havior in order to replace false beliefs and assumptionswith valid frames of reference for assessing andsolving problems and situations. In these learning situ-ations, the benefits of making errors are expected tooutweigh the costs. During the early stages of theU.S. space rocket program there is anecdotal evi-dence that scientists actually desired failures duringtesting phases, in much the same way that designersof complex software sometimes do, as these failuresprovide insights into improvements, and ultimatelymore effective and robust designs, that would otherwisenot have been apparent.
1.2 Defining Human Error
The position taken here is that human error is a real phe-nomenon, if only for the simple fact that humans are fal-lible. When this fallibility, in the form of committed oromitted human actions, appears in retrospect to be linkedto undesirable consequences, an attribution of humanerror is often made. It can be argued that the choice ofthe term human error is unfortunate as in many circum-stances (some may even claim in all circumstances bar-ring malicious behavior) the stigma that is bestowed byvirtue of using this term is inappropriate and misleading.
Human error, especially in the form of unintended ormistaken actions, is very much a two-sided coin, as ithas at its roots many of the same processes of attentionand architectural features of memory that also enablehumans to adapt, abstract, infer, and create. It is certainlynot incorrect, though perhaps a bit too convenient, toexplain unintended action slips (Section 3.1), such asthe activation of an incorrect control or the selection ofthe wrong medication, as rational responses in contextscharacterized by pressures, conflicts, ambiguities, and
fatigue. In reality, it is human fallibility, in all itsguises, that infiltrates these contexts. It is the task ofhuman factors researchers and practitioners to examineand understand this interplay between fallibility andcontext as humans carry out their various activities. Thisknowledge could then be used to predict the increasedpossibility for certain types of errors, ultimately enablingsafer and more productive designs.
It is not easy arriving at a satisfying definition ofhuman error. Hollnagel (1993) preferred the term erro-neous action to human error, which he defined as “anaction which fails to produce the expected result andwhich therefore leads to an unwanted consequence”(p. 67). This definition as well as Sheridan’s (2008)definition of human error as an action that fails to meetsome arbitrary implicit or explicit criterion both alludeto the subjective element that definitions of human errormust incorporate.
Another term often used by Hollnagel, and which isfrequently used throughout this chapter, is performancefailure. While this term also implies some form of neg-ative outcome related to human actions, it does so withthe recognition that this outcome derives mostly fromthe intersection of “normal” human performance vari-ability with “normal” system variability. The implicationis that a different point of intersection may have verywell brought about a favorable result.
Dekker’s (2005) view of errors as “ex post factoconstructs rather than as objective, observed facts”(p. 67) is based on the accumulated evidence for the pre-disposition of hindsight bias (Section 1.1). Specifically,observers (including the people who may have beenrecent participants of the unwanted events being inves-tigated) impose their knowledge in the form of assump-tions, facts, past experiences, and future intentions totransform what was in fact inaccessible information atthe time into neatly unfolding sequences of events anddeterministic schemes that are capable of explainingany adverse consequence. These observer and hindsightbiases presumably do not bring us any closer tounderstanding the experiences of the actor in the actualsituation for whom there is no error—“the error onlyexists by virtue of the observer and his or her positionon the outside of the stream of experience” (p. 66).
What seems to be indisputable, at least in currentthinking, is that human error involves some form ofattribution that is based on the circumstances surround-ing the offending behavior and the expectations held bysome entity concerning the corresponding actor. Theentity—a supervisor, designer, work team, regulatoryagency, organization, the public, or even the personwhose performance was directly linked to the adverseevent—decides, based on the circumstances, whetheran attribution of human error is called for.
The process of attribution of error obviously will besubject to a variety of influences. These would includecultural norms that dictate, for example, the standardsto which designers, managers, and operators are held toby their organizations and to which regulatory agenciesand the public hold organizations. Thus, a highly experi-enced pilot or nuclear power plant maintenance workerwould probably not be expected to omit an important

HUMAN ERROR AND HUMAN RELIABILITY ANALYSIS 737
step in a check-off procedure, even if distraction at aninopportune time and poor design of the procedure wereobvious culprits. But there would be less expectationthat a second-year medical resident in a trauma center,thrust into a leadership role in the absence of moresenior personnel, would not make an error related tothe management of multiple patients with traumaticinjuries. There may, however, be an attribution of errorby a state regulatory agency directed at the health careorganization’s management stemming from the absenceor poor oversight of protocols intended for preventingthese highly vulnerable allocations of responsibility.
The attribution of human error thus also encom-passes actions or decisions whose unwanted outcomesmay occur at much later points in time or followingthe interjection of many other actions by other people.Even in cases where such “blunter” actions have notresulted in adverse outcomes, an entity may considersuch decisions to be in error based on its belief thatunwanted consequences had been fortuitously averted.
Although intentional violations of procedures are agreat concern in many industries, these acts are typicallyexcluded from attributions of human error when theactions have gone as planned. For example, violationsin rigid “ultrasafe and ultraregulated systems” areoften required for effectively managing work constraints(Amalberti, 2001). However, when violations resultin unforeseen and potentially hazardous conditions,managers responsible for the design of and compliancewith the violated procedures may attribute human errorto these actions (Section 1.1).
The attribution of human error becomes moreblurred when humans knowingly implement strategiesin performance that will result in some degree ofunwanted consequences. For example, a worker maybelieve an action in a particular circumstance wouldavert the possibility of more harmful consequences.Even if these strategies come off as intended, dependingon the boundaries of acceptable outcomes established orperceived by external observers such as managers or thepublic, the human’s actions may in fact be consideredto be in error.
Accordingly, a person’s ability to provide a reason-able argument for behaviors that resulted in unwantedconsequences does not necessarily exonerate the personfrom the attribution of error. What of actions the per-son intends to commit that are normally associated withacceptable outcomes but that, due to an unusual collec-tion of circumstances, result in adverse outcomes? Thesewould generally not be attributed to human error exceptperhaps by unforgiving stakeholders who are compelledto exact blame.
2 UNDERSTANDING HUMAN ERROR
2.1 Basic Framework: Human Fallibility,Context, and Barriers
Figure 1 presents a very basic framework for under-standing human error that consists of three components.The human fallibility component addresses fundamentalsensory, cognitive, and motor limitations of humans aswell as a host of other behavioral tendencies that pre-dispose humans to error. The context component refersto situational variables that can shape, influence, force,or otherwise affect the ways in which human fallibility,in the form of normal human performance variability,can play a role in bringing about adverse consequences.This variability encompasses not only the variability thatderives from fundamental sensory, cognitive, and motorconsiderations but also the more “deliberate and pur-poseful” variability that, within the context of complexsystem operations, gives rise to the adaptive adjustmentspeople make (Hollnagel, 2004). Finally, the barrierscomponent concerns the various ways in which humanerrors or performance failures can be contained.
A number of points concerning this frameworkshould be noted. First, human error is viewed as arisingprimarily from some form of interplay between humanfallibility and context. This is probably the most intu-itive way for practitioners to understand how humanerrors come about. Interventions that minimize humandispositions to fallibility, for example, by placing fewermemory demands on the human, are helpful, but onlyto the extent that they do not create new contexts that,
Context
Variability in conditions
Human fallibility
Variability in performance
Barriers
Accidents
- Anticipated events- Unanticipated events
- Emergent events
Variability in barriers
Figure 1 Framework for understanding human error and its potential for adverse consequences.

738 DESIGN FOR HEALTH, SAFETY, AND COMFORT
in turn, can create new ways in which human perfor-mance variability can translate into negative outcomes.Similarly, interventions intended to reduce the error-producing potential of work contexts, for instance, byintroducing new protocols for communication, couldunsuspectingly produce new ways in which human fal-libility can be brought to bear.
Second, many of the elements that comprise humanfallibility can potentially overlap, as can many ofthe elements that encompass context, reflecting theinteractive complexity that can be manifest among thesefactors. Third, because of the variability that exists inboth the fallibility elements and the contextual elements,the product of their interplay will also necessarily bedynamic in nature. One consequence of this interplayis the need for anticipation, which produces humanperformance that is proactive, in addition to beingreactive, making possible the human’s ongoing adaptiveresponses. These responses, in turn, can alter thecontext that, at the same time, is experiencing its ownexogenously driven variability.
From this superimposition of human performancevariability on situational variability, accidents canemerge (Figure 1). This does not exclude the possibilityfor predictions of accidents based on underlying linear(and to some extent interactive) mechanisms, but it doesdramatically alter the conceptualization of the accidentprocess and the implications for its management.
Fourth, barriers intended to prevent the propagationof errors to adverse outcomes such as accidents couldalso affect the context, as well as human perceptionsof the work context, and thus ultimately humanperformance. These interactions are often ignored ormisunderstood in evaluating a system’s risk potential.
In some accident models, the possibility for progress-ing from human error to an adverse outcome dependson how the “gaps” (the windows of opportunity forpenetration) in existing barriers are aligned (Reason,1990). Generally, the likelihood that errors will traversethese juxtaposed barriers is low, which is the reasonfor the much larger number of near misses that areobserved compared to events with serious consequences.The avoidance or containment of or rapid recovery fromaccidents, including those resulting from emerging phe-nomena , may very well characterize the resilience of anorganization (Section 6).
Finally, this framework (Figure 1) is intended toencompass various perspectives on human error thathave been proposed, in particular, the human factors,cognitive engineering, and sociotechnical perspectives[Center for Chemical Process Safety (CCPS), 1994].In the human factors perspective, error is the result ofa mismatch between task demands and human mentaland physical capabilities. Presumably, this perspectiveallows only general predictions of human error to bemade. For example, cluttered displays or interfacesthat impose heavy demands on working memory arelikely to overload perceptual and memory processes(Section 2.2.1), possibly leading to the omission ofactions or the confusion of one control with another.Guidelines that have been proposed for designingdisplays (Wickens et al., 2004) are offered as a means
for diminishing mismatches between demands andcapabilities and thus the potential for error.
The cognitive engineering perspective, in con-trast, emphasizes detailed analysis of work contexts(Section 3) coupled with analysis of the human’s inten-tions and goals. Although both the human factors andcognitive engineering perspectives on human error arevery concerned with human information processing,cognitive engineering approaches attempt to derive moredetailed information about how humans acquire and rep-resent information and how they use it to guide actions.This emphasis provides a stronger basis for linkingunderlying cognitive processes with the external formof the error and thus should lead to more effective clas-sifications of human performance and human errors. Asa simple illustration of the cognitive engineering per-spective, Table 1 demonstrates how the same externalexpression of an error could derive from various under-lying causes.
Sociotechnical perspectives on human error focuson the potential impact of management policies andorganizational culture on shaping the contexts withinwhich people act. These “higher order” contextual fac-tors are capable of exacting considerable influence onthe designs of workplaces, operating procedures, train-ing programs, job aids, and communication protocolsand can produce excessive workload demands by impos-ing multiple conflicting and shifting performance objec-tives and by exerting pressure to meet production goals,often at the expense of safety considerations (Section 6).
2.2 Human Fallibility
2.2.1 Human Information Processing
A fundamental basis for many human errors derivesfrom underlying limitations and tendencies that char-acterize human sensory, cognitive, and motor processes(Chapters 3–5). These limitations are best understoodby considering a generic model of human informationprocessing that conceptualizes the existence of variousprocessing resources for handling the flow and transfor-mation of information (Figure 2).
According to this model, sensory informationreceived by the body’s various receptor cells gets storedin a system of sensory registers that has an enormousstorage capacity. Through the process of selectiveattention , subsets of this vast collection of brieflyavailable information become designated for furtherprocessing in an early stage of information processingknown as perception . Here, information can becomemeaningful through comparison with information inlong-term memory (LTM). This could promptly triggersome form of response or require the need for furtherprocessing in a short-term memory store referred to asworking memory (WM).
A good deal of our conscious effort is dedicated toWM activities such as visualizing, planning, evaluating,conceptualizing, and making decisions, and much ofthis WM activity depends on information that can beaccessed from LTM. The rehearsal of information inWM enables it to be encoded into LTM; otherwise, itdecays rapidly. In addition to this time constraint, WM

HUMAN ERROR AND HUMAN RELIABILITY ANALYSIS 739
Table 1 Examples of Different Underlying Causesof Same External Error Mode
Situation: A worker in a chemical processing plant closesvalve B instead of nearby valve A, which is the requiredaction as set out in the procedures. Although thereare many possible causes of this error, consider thefollowing five possible explanations.
1. The valves were close together and badly labeled. Theworker was not familiar with the valves and thereforechose the wrong one.Possible cause: wrong identification compounded bylack of familiarity leading to wrong intention (once thewrong identification occurred, the worker intended toclose the wrong valve).
2. The worker may have misheard instructions issuedby the supervisor and thought that valve B was therequired valve.Possible cause: communications failure giving rise toa mistaken intention.
3. Because of the close proximity of the valves, eventhough he intended to close valve A, he inadvertentlyoperated valve B when he reached for the valves.Possible cause: correct intention but wrong executionof action.
4. The worker closed valve B very frequently as part ofhis everyday job. The operation of A was embeddedwithin a long sequence of other operations that weresimilar to those normally associated with valve B. Theworker knew that he had to close A in this case, buthe was distracted by a colleague and reverted back tothe strong habit of operating B.Possible cause: intrusion of a strong habit dueto external distraction (correct intention but wrongexecution).
5. The worker believed that valve A had to be closed.However, it was believed by the workforce that despitethe operating instructions, closing B had an effectsimilar to closing A and in fact produced less disruptionto downstream production.Possible cause: violation as a result of mistakeninformation and an informal company culture toconcentrate on production rather than safety goals(wrong intention).
Source: Adapted from CCPS (1994). Copyright 1994 bythe American Institute of Chemical Engineers. Repro-duced by permission of AIChE.
also has relatively severe capacity constraints governingthe amount of information that can be kept active. Thecurrent contention is that within WM there are separatelimited-capacity storage systems for accommodatingvisual information presented in an analog spatial formand verbal information presented in an acoustical formas well as an attentional control system for coordinatingthese two storage systems. Ultimately, the results ofWM–LTM analysis can lead to a response (e.g., amotor action or decision) or to the revision of one’sthoughts.
This overall sequence of information processing,though depicted in Figure 2 as flowing from left to right,
in fact can assume other pathways. For example, it couldbe manifest in the form of an attention-WM-LTM loop ifone was contemplating how to modify a work operation.
With the exception of the system of sensory registersand LTM, the processing resources in this modelmay require attention . Often thought of as mentaleffort , attention is conceptualized here as a finite andflexible endogenous energy source under consciouscontrol whose intensity can be modulated over time.Although the human has the capability for distributingattention among the various information-processingresources, fundamental limitations in attention constrainthe capacities of these resources, implying that there isonly so much information that can, for example, undergoperceptual coding or WM analysis. Focusing attentionon one of these resources will usually handicap, to somedegree, the information-processing capabilities of theother resources.
In many situations, attention may be focused almostexclusively on WM, for example, during intense prob-lem solving or when conceiving or evaluating plans.Other situations may require the need for dividing atten-tion, which is the basis for time sharing . This ability isoften observed in people who have learned to rapidlyshift attention between tasks. Time-sharing skill maydepend on having an understanding of the temporal andknowledge demands of the tasks and the possibility thatone (or more) of the tasks has become automated inthe sense that very little attention is needed for its per-formance. Various dichotomies within the information-processing system have been proposed, for example,between the visual and auditory modalities and betweenearly (perceptual) versus later (central and response)processing (Figure 2), to account for how people areable, in time-sharing situations, to more effectively uti-lize their processing capacities (Wickens, 1984).
Many design considerations arise from the errorsthat human sensory and motor limitations can causeor contribute to. Indeed, human factors studies areoften preoccupied with deriving design guidelines forminimizing such errors. Knowledge concerning humanlimitations in contrast sensitivity, hearing, bandwidth inmotor movement, and sensing tactile feedback can beused to design visual displays, auditory alarms, manualcontrol systems, and protective clothing (such as glovesthat are worn in surgery) that are less likely to produceerrors in detection and response.
Much of the focus on human error, however, is onthe role that cognitive processing plays. Even seem-ingly simple situations involving errors in visual pro-cessing may in fact be rooted in much more complexinformation processing. For example, consider the fol-lowing prescription medication error, which actuallyoccurred. A physician opted to change the order for50 mg of a leukemia drug to 25 mg by putting a linethrough the zero in the “50” and inserting a “2” in frontof the “5.” The resulting dose was perceived by thepharmacist as 250 mg and led to the death of a 14-year-old boy.
On the surface, this error can be viewed as resultingfrom normal human variability associated with visualprocessing—that is, at any given moment, the attention

740 DESIGN FOR HEALTH, SAFETY, AND COMFORT
Perceptual encoding Central processing Responding
Responseexecution
Responseselection
Attentionresources
Perception
Thoughtdecision making
Workingmemory
Long-term memory
Feedback
Sensoryregister
- Hearing- Vision- Olfaction- Haptic
Figure 2 Generic model of human information processing. (Adapted from Wickens et al., 2004. Reproduced by permissionof Pearson Education, Inc.)
being directed to a given stimulus is varying and atthat critical moment the line through the zero wasmissed. However, a closer examination of the contextmay suggest ways in which this normal variabilitycan be influenced, beginning with the fact that theline that was meant to indicate a cross-out was notcentered but (due to normal psychomotor variability)was much closer to the right side of the circle. Thecross-out at that given moment could then have easilybeen construed as just a badly written zero. Also, whenone considers that perception relies on both bottom-upprocessing (where the stimulus pattern is decomposedinto features) and top-down processing (where contextand the expectations that are drawn from the contextare used for recognition of the stimulus pattern),the possibility that a digit was crossed out mayhave countered expectations (i.e., it does not usuallyoccur).
If one were to further presume that the pharmacisthad a high workload (and thus diminished cognitiveresources for processing the prescription) and a relativelack of experience or knowledge concerning dosageranges for this drug, it is easy to understand how thiserror can come about. The progression from faultyvisual processing or misinterpretation of the stimulus toadverse consequences can be put into a more completeperspective when potential barriers are considered, suchas an automatic checking system that could havescreened the order for a potentially harmful dosage orinteractions with other drugs or a procedure that wouldhave required the physician to rewrite any order that hadbeen altered. However, even if these safeguards were inplace, which was not the case, it is still possible thatthey could have been bypassed (Section 2.4).
2.2.2 Long-Term Memory’s Role in HumanError
Long-term memory has been described as a paralleldistributed architecture that is continuously being recon-figured within the brain through selective activation andinhibition of massively interconnected neuronal units(Rumelhart and McClelland, 1986). In the process ofadapting to new stimuli or thoughts, the complex inter-actions that are produced between these neuronal unitsgive rise to the generalizations and rules and ulti-mately to the knowledge that is so critical to humanperformance. When we consider the forms in whichthis knowledge is stored in LTM, we usually distin-guish between the general knowledge we have about theworld, referred to as semantic memory , and knowledgeabout events, referred to as episodic memory .
Items of information, such as visual images, sounds,and thoughts that are processed in WM at the sametime and to a sufficient degree, usually become asso-ciated with each other in LTM. The ability to retrievethis information from LTM, however, will depend on thestrengths of the individual items as well as the strengthsof their associations with other items. Increased fre-quency and recency of activation are assumed to pro-mote stronger (i.e., more stable) memory traces, whichare otherwise subject to negative exponential decays.
Much of our basic knowledge about things can bethought of as being stored in the form of semanticnetworks , which are implemented within LTM throughparallel distributed architectures. Other knowledge rep-resentation schemes commonly invoked in the humanfactors literature are schemas and mental models .Schemas typically represent knowledge organized about

HUMAN ERROR AND HUMAN RELIABILITY ANALYSIS 741
a concept or topic. When they reflect processes orsystems for which there are relationships between inputsand outputs that the human can mentally visualizeand “experiment with” (i.e., “run,” like a simulationprogram), the schemas are often referred to as mentalmodels (Wickens et al., 2004). The organization ofknowledge in LTM as schemas or mental models isalso likely based on semantic networks.
The constraints associated with LTM architecturecan provide many insights into human fallibility andhow this fallibility can interact with situational contextsto produce errors. For example, many of the contextswithin which humans operate produce what Reason(1990) has termed cognitive underspecification , whichimplies that at some point in the processing ofinformation the specification of information may beincomplete. It may be incomplete due to perceptualprocessing constraints, WM constraints, LTM (i.e.,knowledge) limitations, or external constraints, as whenthere is little information available on the medicalhistory of a patient undergoing emergency treatmentor when piping and instrumentation diagrams have notbeen updated.
Because the parallel associative networks in our brainhave the ability to recall both items of informationand patterns (i.e., associations) of information based onpartial matching of this incomplete input informationwith the contents of memory, the limitations associatedwith cognitively underspecified information can beovercome, but at a risk. Specifically, LTM can retrieveitems of information that provide a match to the inputs,and these retrieved items of information may enable,by virtue of LTM’s associative structure, an entire
rule or idea to become activated. Even if this ruleis not appropriate for the particular situation, if thepattern characterizing this rule in LTM is sufficientlysimilar to the input pattern of information, it may stillget triggered, possibly resulting in a mistaken action(Section 2.2.5).
2.2.3 Information Processingand Decision-Making Errors
Human decision making, particularly the kind thattakes place in complex dynamic environments with-out the luxury of extended time and other resourcesneeded for accommodating normative prescriptive mod-els (Chapter 7), is an activity fraught with fallibil-ity. As illustrated in Figure 3, this fallibility can arisefrom a number of information-processing considerations(Figure 2). For example, if the information the humanopts to select for examination in WM is fuzzy or incom-plete, whether it be facts, rules, or schemas residing inLTM, or information available from external sourcessuch as equipment monitors, computer databases, orother people, intensive interpretation or integration ofthis information in WM may be needed. Unfortunately,WM is relatively fragile as it is subject to both time andcapacity constraints (Section 2.2.2).
Decision-making situations that involve the consid-eration of different hypotheses as a basis for performingsome action also can place heavy demands on WM.Initially, these demands derive from the process ofgenerating hypotheses, which is highly dependent oninformation that can be retrieved from LTM. The eval-uation of hypotheses in WM may then entail searching
Cues
Selectiveattention
Workingmemory
Long-Termmemory
Outcome
Feedback
Uncertainty
Perception
Diagnosis Choice
ActionH1
HH
HHH
• Possible outcomes• Likelihood and consequences of outcomes
HH HH H
HAA
AAA
A AAAA A(H) Hypothesis
(A) Action
H2
A2
A1
Figure 3 Information-processing model of decision making. (Adapted from Wickens et al., 2004. Reproduced bypermission of Pearson Education, Inc.)

742 DESIGN FOR HEALTH, SAFETY, AND COMFORT
for additional information, which would further increasethe load on WM. Although any hypothesis for whichadequate support is found can become the basis for anaction, there may be a number of possible actions asso-ciated with this hypothesis, and they also would needto be retrieved from LTM in order to be evaluated inWM. Finally, the possible outcomes associated witheach action, the estimates of the likelihoods of theseoutcomes, and the negative and positive implications ofthese outcomes would also require retrieval from LTMfor evaluation in WM (Figure 3).
From an information-processing perspective, thereare numerous factors that could constrain this decision-making process, particularly those that could influencethe amount or quality of information brought into WMand the retrieval of information from LTM. Theseconstraints often lead to shortcuts in decision making,such as satisficing (Simon, 1966), whereby people adoptstrategies for sampling information that they perceive tobe most relevant and opt for choices that appear to themto be good enough for their purposes.
In general, the human’s natural tendency to min-imize cognitive effort (Section 2.2.5) opens the door toa wide variety of shortcuts or heuristics (Tversky andKahneman, 1974). These tendencies are usually effec-tive in negotiating environmental complexity butunder the right coincidence of circumstances can biasthe human toward ineffective choices or actions thatcan become designated as errors. For example, withrespect to the cues of information that we perceive,there is a tendency to overweight cues occurringearlier rather than later in time or that change overtime. Often, the information that is acquired earlyon can influence the shaping of an initial hypothesis;this could, in turn, influence the interpretation of theinformation that is subsequently acquired. In tryingto make sense of this information, WM will onlyallow for a limited number of possible hypotheses,actions, or outcomes of actions to be evaluated at anytime. Moreover, LTM architecture will accommodatethese limitations by making information that has beenconsidered more frequently or recently more readilyavailable (the availability heuristic) and by enabling itspartial-matching capabilities to classify cues as morerepresentative of a hypothesis than may be warranted.
There are many other heuristics (Wickens et al., 2004)that are capable of becoming invoked by virtue of thehuman’s fundamental tendency to conserve cognitiveeffort. These include confirmation bias (the tendencyto consider confirming and not disconfirming evidencewhen evaluating hypotheses); cognitive fixation (remain-ing fixated on initial hypotheses and underutilizing sub-sequent information); and the tendency to judge an“event” as likely if its features are representative ofthat event (e.g., judging a person as having a particularoccupation based on the person’s appearance or politi-cal ideology, even though the likelihood of having thatoccupation is extremely low).
Similarly, the human is often found to be biasedin matters related to making statistical or proba-bilistic assessments. One important type of statisticalassessment is the ability to recognize the existence
of covariation between events. This ability can proveessential in ensuring desired outcomes (and avoidingadverse ones), as it provides humans with the capabilityto control the present and predict the future by virtueof explaining past events (Alloy and Tabachnik, 1984).While debates continue regarding human capabilities atsuch assessments, there is ample evidence that, whenestimating the degree to which two events are correlated,people overemphasize instances in which the eventsco-occurred and disregard cases in which one eventoccurred but not the other, leading to overestimation ofthe relationship between the two events (Peterson andBeach, 1967). Top-down expectancies or preconceptionsby people can alter the detection of covariation by mak-ing it unlikely that it will be detected if the variables arenot expected to be related. Conversely, when relation-ships between variables are expected, their covariationcan be given undue weight at the expense of overlookingor discounting disconfirming evidence, especially whenpeople believe there to be a cause–effect relationshipbetween the variables. In fact, this tendency by peoplecan be viewed as one of the many manifestations of theconfirmation bias (Nickerson, 1998).
People also typically overestimate the probability ofthe joint occurrence of independent events (relative tothe objective or estimated probabilities of the individualevents) and underestimate the probability that at leastone of them will occur (Peterson and Beach, 1967;Tversky and Kahneman, 1974). These tendencies havea number of practical implications, especially whenestimation of the probability of success depends on theconjunction of two or more events. For example, inthe execution of sequential stepwise procedures, it canlead to overestimation of the probability that the entireoperation will be performed successfully or completedby a specified time and to underestimation that someproblem will be encountered in executing the procedure(Nickerson, 2004).
While the human’s lack of knowledge of certain con-cepts and principles that are fundamental to probabilitytheory may explain a few of the findings in this area,limitations in information-processing capacities coupledwith overreliance on heuristics that work well in manybut not all contexts is probably at the root of many ofthese human tendencies. Generally, however, one shouldbe cautious when providing explanations of human judg-ments and behaviors on the basis of cognitive biases. Toexclude the possibility that a human’s situational assess-ments are in fact rational, a sound understanding of thespecific context is required (Fraser et al., 1992).
2.2.4 Levels of Human Performanceand Dispositions for Errors
Rasmussen (1986) has described fundamentally differentapproaches that humans take to processing informationbased on distinctions between skill-based, rule-based,and knowledge-based (SRK) levels of performance. Thedistinctions that underlie this SRK framework have beenfound to be particularly appealing for analyzing andpredicting different types of human errors.
Activities performed at the skill-based level arehighly practiced routines that require little conscious
HUMAN ERROR AND HUMAN RELIABILITY ANALYSIS 743
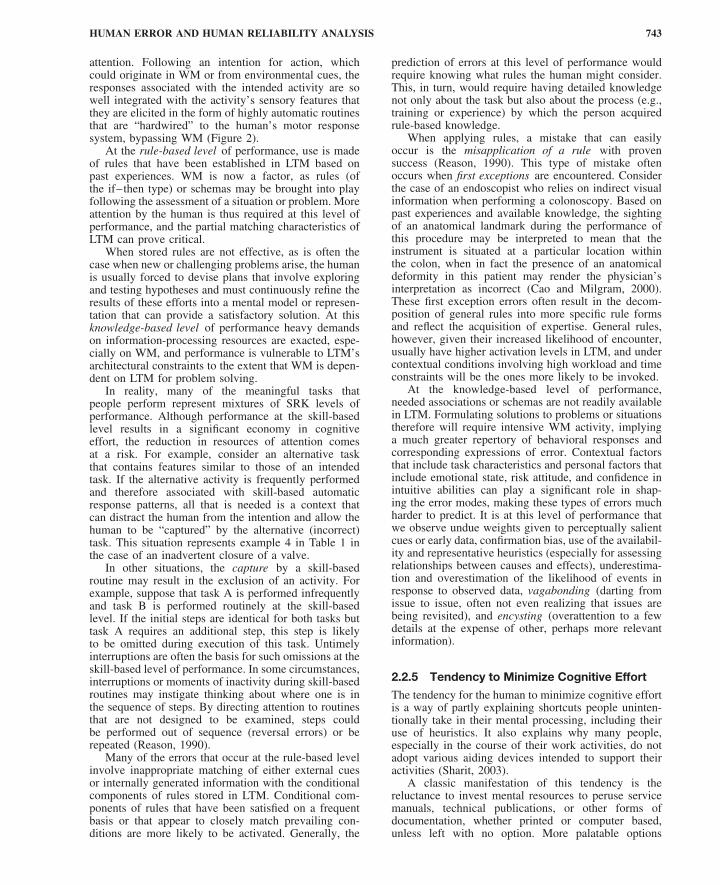
attention. Following an intention for action, whichcould originate in WM or from environmental cues, theresponses associated with the intended activity are sowell integrated with the activity’s sensory features thatthey are elicited in the form of highly automatic routinesthat are “hardwired” to the human’s motor responsesystem, bypassing WM (Figure 2).
At the rule-based level of performance, use is madeof rules that have been established in LTM based onpast experiences. WM is now a factor, as rules (ofthe if–then type) or schemas may be brought into playfollowing the assessment of a situation or problem. Moreattention by the human is thus required at this level ofperformance, and the partial matching characteristics ofLTM can prove critical.
When stored rules are not effective, as is often thecase when new or challenging problems arise, the humanis usually forced to devise plans that involve exploringand testing hypotheses and must continuously refine theresults of these efforts into a mental model or represen-tation that can provide a satisfactory solution. At thisknowledge-based level of performance heavy demandson information-processing resources are exacted, espe-cially on WM, and performance is vulnerable to LTM’sarchitectural constraints to the extent that WM is depen-dent on LTM for problem solving.
In reality, many of the meaningful tasks thatpeople perform represent mixtures of SRK levels ofperformance. Although performance at the skill-basedlevel results in a significant economy in cognitiveeffort, the reduction in resources of attention comesat a risk. For example, consider an alternative taskthat contains features similar to those of an intendedtask. If the alternative activity is frequently performedand therefore associated with skill-based automaticresponse patterns, all that is needed is a context thatcan distract the human from the intention and allow thehuman to be “captured” by the alternative (incorrect)task. This situation represents example 4 in Table 1 inthe case of an inadvertent closure of a valve.
In other situations, the capture by a skill-basedroutine may result in the exclusion of an activity. Forexample, suppose that task A is performed infrequentlyand task B is performed routinely at the skill-basedlevel. If the initial steps are identical for both tasks buttask A requires an additional step, this step is likelyto be omitted during execution of this task. Untimelyinterruptions are often the basis for such omissions at theskill-based level of performance. In some circumstances,interruptions or moments of inactivity during skill-basedroutines may instigate thinking about where one is inthe sequence of steps. By directing attention to routinesthat are not designed to be examined, steps couldbe performed out of sequence (reversal errors) or berepeated (Reason, 1990).
Many of the errors that occur at the rule-based levelinvolve inappropriate matching of either external cuesor internally generated information with the conditionalcomponents of rules stored in LTM. Conditional com-ponents of rules that have been satisfied on a frequentbasis or that appear to closely match prevailing con-ditions are more likely to be activated. Generally, the
prediction of errors at this level of performance wouldrequire knowing what rules the human might consider.This, in turn, would require having detailed knowledgenot only about the task but also about the process (e.g.,training or experience) by which the person acquiredrule-based knowledge.
When applying rules, a mistake that can easilyoccur is the misapplication of a rule with provensuccess (Reason, 1990). This type of mistake oftenoccurs when first exceptions are encountered. Considerthe case of an endoscopist who relies on indirect visualinformation when performing a colonoscopy. Based onpast experiences and available knowledge, the sightingof an anatomical landmark during the performance ofthis procedure may be interpreted to mean that theinstrument is situated at a particular location withinthe colon, when in fact the presence of an anatomicaldeformity in this patient may render the physician’sinterpretation as incorrect (Cao and Milgram, 2000).These first exception errors often result in the decom-position of general rules into more specific rule formsand reflect the acquisition of expertise. General rules,however, given their increased likelihood of encounter,usually have higher activation levels in LTM, and undercontextual conditions involving high workload and timeconstraints will be the ones more likely to be invoked.
At the knowledge-based level of performance,needed associations or schemas are not readily availablein LTM. Formulating solutions to problems or situationstherefore will require intensive WM activity, implyinga much greater repertory of behavioral responses andcorresponding expressions of error. Contextual factorsthat include task characteristics and personal factors thatinclude emotional state, risk attitude, and confidence inintuitive abilities can play a significant role in shap-ing the error modes, making these types of errors muchharder to predict. It is at this level of performance thatwe observe undue weights given to perceptually salientcues or early data, confirmation bias, use of the availabil-ity and representative heuristics (especially for assessingrelationships between causes and effects), underestima-tion and overestimation of the likelihood of events inresponse to observed data, vagabonding (darting fromissue to issue, often not even realizing that issues arebeing revisited), and encysting (overattention to a fewdetails at the expense of other, perhaps more relevantinformation).
2.2.5 Tendency to Minimize Cognitive Effort
The tendency for the human to minimize cognitive effortis a way of partly explaining shortcuts people uninten-tionally take in their mental processing, including theiruse of heuristics. It also explains why many people,especially in the course of their work activities, do notadopt various aiding devices intended to support theiractivities (Sharit, 2003).
A classic manifestation of this tendency is thereluctance to invest mental resources to peruse servicemanuals, technical publications, or other forms ofdocumentation, whether printed or computer based,unless left with no option. More palatable options

744 DESIGN FOR HEALTH, SAFETY, AND COMFORT
generally consist of trial-and-error assembly or use ofa device or asking a co-worker for help. For example,residents performing morning rounds in intensive careunits (ICUs) will often find it easier, especially whenunder time pressure to process a relatively large numberof patients, to obtain needed information concerningpatient status from ICU nurses rather than combthrough various sources of information for the purposeof constructing mental models of patient problems.Similarly, a mechanic who encounters difficulty whentrying to execute an assembly strategy may be inclinedto ask a fellow mechanic for assistance, especially ifthere are a number of impending tasks to be performed.
In contrast to the automatic processing modethat largely characterizes efficient skill-based perfor-mance, performance that requires a significant outlayof attention is effortful and potentially exhaustive ofinformation-processing resources. From an evolutionarystandpoint, this type of processing leaves us vulnera-ble: Being consumed with activities requiring focusedor divided attention leaves little capacity for negotiat-ing other environmental inputs that can prove threaten-ing. In practical work situations, especially in contextswith changing conditions and objectives, this type ofprocessing can disable or weaken performance that isbased on either feedforward control , whereby the humandevises strategies or plans for controlling a work pro-cess, or feedback control , whereby the human monitorsand assesses conditions and adjusts or adapts perfor-mance according to system outputs.
Most work and, for that matter, everyday situationsare, however, characterized by sufficient regularity andpredictability to warrant the use of shortcuts in mentalprocessing. In fact, the argument can be made that atany given time the human’s normal work performancereflects a subconscious attempt to optimally balanceuse of these efficient shortcuts with more capacity-demanding mental processing—what Hollnagel (2004)has referred to as the “efficiency-thoroughness trade-off” (ETTO). Because any protective function can fail,it should not be surprising that conditions and eventscan become aligned in ways that allow shortcuts,heuristics, or expectation-driven behaviors to lead tonegative outcomes. Although such outcomes may bedue to the momentary existence of conditions thatwere not favorable to the particular type of ETTOthat was manifest, and thus reflect normal performancevariability, they still derive in part from human fallibilityrelated to the tendency to minimize cognitive effort.
Some typical ETTO rules noted by Hollnagel (2004,p. 154) that characterize how people (or groups ofpeople) cope with particular work situations are asfollows:
• Looks ok . The worker resorts to a quick judg-ment rather than a more thorough check of thestatus and conditions but takes responsibility forthe assessment.
• Not really important . Even though there are cuesto warrant a closer examination of the workissue, the consequences of not dealing with theissue are rationalized as not being that serious.
• Normally ok, no need to check it now . Thetendency to defer closer examination of an issueis often traded off with the riskier decisionresulting from internal or external pressure tomeet production goals.
• It will be checked by someone else later/it hasbeen checked by someone else earlier . Timepressure and impending deadlines often leadto a lowered criterion for the assumption thatsomeone else will take care or has taken care ofthe issue.
• Insufficient time or resources; will do it later .The perception that there is insufficient time orresources to perform certain activities can createthe tendency to minimize the importance orurgency to complete those activities and increasethe importance of the activities in which one iscurrently engaged.
• It worked the last time around; don’t worry, it’sperfectly safe and nothing will happen . Refer-encing anecdotal evidence, resorting to wishfulthinking, and referring to authority or experi-ence rather than facts are all ways of avertingmore time- and resource-consuming activitiesthat involve checks and closer examination ofwork processes.
2.2.6 Other Aspects of Human Fallibility
There are many facets to human fallibility, and all havethe potential to contribute to human error. Peters andPeters (2006) refer to these attributes as “behavioralvectors” and suggest that “the overestimation of humancapability (to adapt) and lack of meaningful consid-eration of individual differences is a prime cause ofundesired human error” (p. 47).
One class of individual differences that has notbeen given sufficient attention with regard to itsability to influence the possibility for human error ispersonality traits. For example, in many scenarios thatinvolve hand-offs of work operations across shifts, it isessential that the incoming worker receive all pertinentinformation regarding the work activities that willbe inherited. An incoming worker with a passive orsubmissive personality, however, may be reluctant tointerrupt, interrogate, or question the outgoing workerconcerning the information that is being communicatedor to actively pursue information from that person,especially if that worker is perceived to have an aggres-sive personality or assumes a higher job status. Thesesituations are more pervasive than one might expect,and whether they involve maintenance personnel inprocess control industries or medical providers inhospitals, the end result can be the same: The incomingworker may develop an incomplete or incorrect mentalmodel of the problem. This, in turn, could lead to falseassumptions , for example, about how an assemblyprocedure may need to be completed or how a newpatient arrival into the ICU should be managed.
Personality traits that reflect dispositions towardconfidence, conscientiousness, and perseverance could

HUMAN ERROR AND HUMAN RELIABILITY ANALYSIS 745
also influence the possibility for errors. Overconfidencein particular can lead to risk-taking behaviors and hasbeen implicated as a contributory factor in a number ofaccidents. Similarly, people often can be characterizedin terms of having a propensity for taking risks (risk-prone behavior), avoiding risks (risk-averse behavior),or being risk neutral (Clemens, 1996). As implied inSection 2.2.5, these behavioral propensities can impactthe criterion by which ETTO rules become invoked.
Another important type of fallibility concerns thehuman’s vulnerability to sleep deprivation and fatigue.These physiological states can often be induced by workconditions and have aroused media attention as possiblecontributory factors in several high-profile accidents. Infact, in the maritime and commercial aviation industries,conditions of sleep deprivation and fatigue are oftenattributed to company or regulatory agency rules gov-erning hours of operation and rest time. The effects offatigue on human performance may be to regress skilledperformers to the level of unskilled performers (CCPS,1994) through widespread degradation of abilitiesthat include decision making and judgment, memory,reaction time, and vigilance. The National Aeronauticsand Space Administration (NASA) has determined thatabout 20% of incidents reported to its Aviation SafetyReporting System (Section 5.4.1), which asks pilotsto report problems anonymously, are fatigue related(Kaye, 1999). On numerous occasions pilots havebeen found to fall asleep at the controls, although theyusually wake up in time to make the landing.
An aspect of human fallibility with importantimplications for human error is situation awareness(Chapter 19), which refers to a person’s understandingor mental model of the immediate environment(Endsley, 1995). Presumably, any factor that coulddisrupt a human’s ability to acquire or perceive relevantdata concerning the elements in the environment, orcompromise one’s ability to understand the importanceof that data and relate them to events that may be unfold-ing in the near future, can degrade situation awareness.Comprehending the importance of the various types ofinformation in the environment also implies the needfor temporal awareness—the need to be aware of howmuch time tasks require and how much time is availablefor their performance (Grosjean and Terrier, 1999).
Many factors related to human fallibility and contextcan potentially influence situation awareness. Increasedknowledge (perhaps through training) or expertise(through experience) should allow for better overallassessments of situations, especially under contextualconditions of high workload and time constraints, byenabling elements of the problem and their relationshipsto be identified and considered in ways that would bedifficult for those who are less familiar with the problem.In contrast, poor display designs that make integration ofdata difficult can easily impair the process of assessingsituations. In operations involving teamwork, situationawareness can become disrupted by virtue of theconfusion created by the presence of too many personsbeing involved in activities.
Human limitations in sensory processes and motormovement (Chapters 3, 4) can also contribute to
unintended or inadequate outcomes that are oftenattributed to human error. Because sensory, motor, andcognitive abilities tend to decline with age (Chapter 52),there is the inclination to associate aging with anincreased likelihood of human error. However, the liter-ature on aging and work performance is somewhat shakyon this subject (Czaja and Sharit, 2009), and we knowthat many factors can counteract or compensate for theeffects of these declines. Examples of such compen-satory factors include the availability of environmentalsupport in the form of memory and other aiding devices;the provision of favorable ergonomic work conditionssuch as increased illumination levels; continued prac-tice on job activities that are frequently encountered; andthe use of knowledge gained from experience to devisemore efficient work strategies. The fact that older peo-ple usually are more conservative in their estimations ofrisk, either because of awareness of their physiologicaldeclines or as a result of their knowledge accumulatedfrom experience, also tends to mitigate the propensityfor their actions to produce adverse outcomes. Declineswith age in the speed of cognitive processing, however,suggest that despite such compensatory abilities, olderindividuals are generally not suitable for work activitiesthat rely heavily on fundamental information-processingabilities.
Finally, the human’s vulnerability to a numberof affective factors can corrupt human information-processing capabilities and thus predispose the humanto error. Personal crises could lead to distractions, andemotionally loaded information can lead to the substitu-tion of relevant job-related information with “informa-tion trash.” Similarly, a human’s susceptibility to panicreactions and fear can impair information-processingactivities critical to human performance. Conversely, thetendency to inhibit emotional responses during emergen-cies can contribute to effective team communication andan increased likelihood of preventing serious accidents.
2.3 Context
Human actions are embedded in contexts and can onlybe described meaningfully in reference to the detailsof the context that accompanied and influenced them(Dekker, 2005). The attribution and expression of humanerror will thus depend on the context in which taskactivities occur.
The notion of a context is not easy to define. Com-monly encountered alternative expressions include sce-nario, situation, situational context, contextual features,contextual factors, and contextual dynamics. Building ona definition of context proposed by Dey (2001) in thedomain of context-aware computer applications, contextis defined as any information that can be used to charac-terize the situation of a person, place, or object as wellas the dynamic interactions among these entities. Thisdefinition of context also encompasses information con-cerning how situations are changing and the human’sresponses to these situations.
Table 2 lists some representative contextual factorscapable of influencing human performance and thuscontributing to human errors and violations. Becausemany of these contextual factors can be described

746 DESIGN FOR HEALTH, SAFETY, AND COMFORT
Table 2 Contextual Factors Capable of Influencing Human Performance
Attributes of Production Processes Equipment/Interface Design
Degree to which processes are understoodDegree to which failed components can be isolatedDegree to which personnel are specializedDegree to which materials and tools can be
substitutedNumber of control parameters and interactions
among themDegree to which system interdependencies are well
definedDegree to which system feedback is clear and
identifiableDegree of slack possible in supplies and equipmentDegree to which production processes are invariant
Work Environment/Work Schedule
Noise and lightingThermal conditionsVibration and atmospheric conditionsTime constraintsPerceived danger or risksInterruptions and distractionsSuddenness of onset of eventsNovel and unanticipated eventsGood housekeepingWork hours and rest breaksShift rotation and circadian disruptions
Job Aids and Procedures
Designed using task analysisInstructions are clear and unambiguousLevel of description is adequateSpecification of entry/exit conditionsInstruction is available on their useOperator feedback on their designUpdated when needed without adding excessive
complexityCapability for referencing procedures during work
operations
Workspace layout and designPersonnel protective equipmentCommunications equipmentTool designLocation/access to toolsLabeling of equipment and suppliesUse of display design principlesUse of control design principlesDesign of menusAvailability and design of help systemsAvailability and design of job aidsDesign of alarms and warningsDesign of voice recognition systemsDemands on memory
Training
Training in identifying hazardous conditionsTraining individuals and teams in using new
technologiesPractice with unfamiliar situationsTraining on using emergency proceduresSimulator trainingTraining in interacting with automationUse of just-in-time trainingEnsuring workers have adequate supportive
information
Organization and Social Factors
Teamwork and communicationClarity of responsibilitiesClarity in safety–productivity prioritiesAuthority and leadershipFeedback channels from workers on procedures and
policiesSafety cultureAbsence of culture of blame and retributionManagement commitment to safety and organizational
learning
Higher Order Factors
Social, political, and economic factorsRegulatory agency factors
at much greater levels of detail, for any particulardomain of application practitioners and analysts wouldneed to determine the appropriate level of contextualanalysis.
The presumption is that higher order factors suchas sociopolitical or government regulatory factors caninfluence or shape organizational factors. Organizations,in turn, are assumed to be capable of influencingcontextual factors that are more directly linked tohuman performance. Contexts ultimately derive fromthe characterization of these factors and the interactionsamong them. Analysis of the interplay of humanfallibility and context as a basis for understandinghuman error (Section 2.1) will be beneficial to the extentthat relevant contextual factors can be identified andanalyzed in detail.
A number of quantitative approaches to humanreliability analysis (Section 4) employ concepts thatare related to context. For example, several of theseapproaches use performance-shaping factors (PSFs) orinfluencing factors (IFs) either to modify the probabilityestimate assigned to an activity the human performed inerror or as the basis for the estimation of that error.These approaches to adjusting or estimating humanerror probabilities generally assume additive effects ofPSFs on human performance rather than interactiveeffects.
Implicit to the concept of a context, however, isthe interactive complexity among contextual factorswith regard to their potential for influencing thereliability of human performance. In this regard, asociotechnical approach to assessing human reliability
HUMAN ERROR AND HUMAN RELIABILITY ANALYSIS 747
known as STAHR (Phillips et al., 1990) is somewhatmore consistent with the concept of a context. STAHRutilizes a hierarchical network of influence diagramsto represent the effects of direct influences on humanerror, such as time pressure and quality of training,as well as the effects of less direct influences, suchas organizational and policy issues, which project theirinfluences through the more direct factors.
While STAHR imposes a hierarchical constraint oninfluences, the dynamic and interactive complexity thatunderlies the concept of context, in theory, imposes nosuch constraint. Influences thus could be representedas an unconstrained network . Although it may beexceedingly difficult to generate quantitative estimatesof human error from such a conceptualization of context,it can still serve as a qualitative tool for the analysis ofwork contexts and for the prediction of the possibilityof human errors. To ensure that a manageable numberof meaningful contexts are exposed, a defined set ofinfluence mechanisms would need to be imposed on thisnetwork structure that could assess the extent to which acontextual factor is present (i.e., the level of activationof a network node within the network); the extent towhich the factor can influence and be influenced by otherfactors (i.e., the level of activation of a network arc, itsdirection, and whether the arc’s effect is excitatory orinhibitory); and the temporal characteristics underlyingthese influences.
As the human becomes engaged in setting goals,planning, assessing the situation, and carrying out activ-ities, the possibility for human performance failures orerrors would then depend on the interplay—the mutu-ally dependent coupling—between human fallibility, asbroadly defined in Section 2.2, and context, conceptual-ized as a dynamic unconstrained network of contextualfactors. In terms of this interplay, the context wouldinfluence not only the final external manifestation ofthe human failure (e.g., activation of the wrong control,performing a soldering operation incorrectly) but also allthe precursor conditions (e.g., communication of incor-rect or ambiguous information to a co-worker, makingan incorrect diagnosis) that could lead to these externalerror modes.
Knowledge of the existence of these precursor orintermediate states may in fact be of greater interest toorganizations as it can be diagnostic of numerous designand process deficiencies and thus provide the basis for anorganization’s ability to learn (Section 5.4). Moreover,intermediate conditions, such as communication failures,may not lead to observable manifestations of error andadverse consequences only because of barriers, eitherdesigned in or a result of fortuitous circumstances,which may have been in place (Section 2.4), but whichcannot always be relied on. Many highly instructive butmuch less formalized accounts of the interplay betweenhuman fallibility and context can be found in a numberof the reconstructed accidents presented by StephenCasey (1993, 2006).
The unconstrained network conceptualization ofcontext is similar to the nonhierarchical representa-tion of context underlying Hollnagel’s (1998) methodfor human reliability analysis known as CREAM
(Section 4.10). This approach distinguishes betweenphenotypes , which are the external manifestation oferroneous human actions or “error modes,” and geno-types , which are the factors that can “cause” these fail-ures. Only a limited set of phenotypes are considered,such as an action that is performed too late, is in thewrong direction, is applied to the wrong object, or isomitted. In contrast, a much larger number of genotypes,the possible “causes” of these external “error modes,”is proposed, which are categorized according to whetherthey are person related, technology related, or organiza-tion related.
In this scheme, an influence from a factor associatedwith one category to one or more factors associated withother categories gives rise to “antecedent-consequent”links that reflect cause–effect relationships. The conse-quents in these links can then serve as the antecedentsof yet other categories of factors. The critical analysislies in the examination of the paths formed by theseantecedent-consequent links. The phenotypes are eitherthe starting point in this analytical process, for example,in a retrospective analysis of an adverse event, or theendpoint in this analysis, for example, in the prospec-tive prediction of the possibility for erroneous actions.Further details related to these concepts are presented inSection 3.2.
Just as contextual factors can be resolved downwardto more refined levels of detail, the possibility also existsfor describing larger scale work domain contexts that arelikewise capable of bringing about adverse outcomes. Inthis regard, the views of Perrow (1999), which constitutea system theory of accidents , have received considerableattention. According to Perrow, the structural analysis ofany system, whether technological, social, or political,reveals two loosely related concepts or dimensions:interactive complexity and coupling . These dimensionshave their own characteristic sets of attributes thatgovern the potential for system accidents and humanrecovery of these events. Some of the contextual factorscorresponding to these attributes are listed in Table 2under the category “Attributes of Production Processes.”
The dimension of interactive complexity can be cat-egorized as either complex or linear and applies to allpossible system components, including people, materi-als, procedures, equipment, design, and the environment.The relatively stronger presence of features such asincreased interconnectivity of subsystems, the potentialfor unintended or unfamiliar feedback loops, the exis-tence of multiple and interacting controls (which can beadministrative as well as technological), the presence ofinformation that tends to be more indirect and incom-plete, and the inability to easily substitute people in taskactivities all serve to predispose systems toward beingcomplex as opposed to linear. Complex interactions aremore likely to be produced by complex systems than lin-ear systems. Because these interactions tend to be lessperceptible and comprehensible, the human’s responsesto problems that occur in complex systems can furtherincrease the system’s interactive complexity.
Systems also can be characterized by their degree ofcoupling. Tightly coupled systems are much less tolerantof delays in system processes than are loosely coupled

748 DESIGN FOR HEALTH, SAFETY, AND COMFORT
systems and are much more invariant to materials andoperational sequences. Although each type of systemhas both advantages and disadvantages, loosely coupledsystems have greater slack , which enables them tomore easily absorb the variability of system demands.This attribute provides more opportunities for recoveryfrom events with potentially adverse consequences,often through creative, flexible, and adaptive responsesby people. To compensate for the fewer opportunitiesfor recovery that are provided by tightly coupledsystems, these systems generally require more built-insafety devices and redundancy than do loosely coupledsystems.
Because Perrow’s account of technological accidentsfocuses on the properties of systems themselves ratherthan human error associated with design, operation, ormanagement of these systems, there has been criticismthat his model marginalizes factors at the root oftechnological accidents (Evan and Manion, 2002). Thesecriticisms, however, do not preclude the possibility ofaugmenting Perrow’s model with additional perspectiveson system processes that could endow the model withthe capability for providing a reasonably compellingbasis for how normal human variability in performancecan predispose a system to adverse consequences.
Finally, a contextual factor that can have an espe-cially powerful effect on predisposing the human to errorduring task performance is stress , due to the variety ofways that this phenomenon can influence human falli-bility. For example, under stress people tend to becomemore reluctant to make an immediate decision; seek con-firming evidence and disregard disconfirming evidence;become less able to recognize all the alternatives thatare available for consideration; offer explanations basedon a single global cause rather than a combination ofcauses; and take greater risks when operating in a group(Kontogiannis and Lucas, 1990).
2.4 Barriers
Barriers are entities that are capable of preventing errorsor potentially hazardous events from taking place or, ifthese events manage to occur, can lessen the impactof their consequences. As such, they represent a keyconstruct in the analysis of accidents and in the designof accident prevention systems.
The consideration of barriers was part of the Man-agement Oversight and Risk Tree (MORT) programthat was developed for the analysis of accidents andsafety programs (Johnson, 1980; Trost and Nertney,1985; Gertman and Blackman, 1994). MORT relies ona number of tree diagrams to examine factors suchas lines of responsibility, barriers toward unwantedenergy, and management factors. Its strategies for theelimination of system hazards, in order of importance,largely reflect the use of the following types ofbarriers: the elimination through design; installationof appropriate safety devices; installation of warningdevices; and the use of special procedures. Distinctionsbetween the different purposes of barriers (prevention,control, and minimization of consequences) and types ofbarriers (physical, equipment design, warning devices,
procedures, knowledge and skills, and supervision) arealso proposed within the MORT program.
Human error and barriers are linked in a numberof ways. One way in which they are connected relatesto whether human actions are capable of becomingclassified as human errors. Human actions that fail toresult in adverse consequences due to the barriers thatwere in place may not be conferred with the attributionof human error, even if these actions were capable ofgenerating hazardous conditions. They might instead,at best, be designated as near misses (Section 5.4). Ifanalysts failed to select such actions when conductinghuman reliability analysis (Section 4.1), the contributionof human–system interactions to system risks could begreatly underestimated as these barriers could fail inways that were not anticipated.
A second important connection between barriers andhuman error is that many barriers depend on sometype of human intervention, whether it be in theirdetection or interpretation. Consequently, the presenceof that barrier may contribute to defining a contextthat predisposes the human to commit actions that canproduce hazardous conditions or accidents (Section 2.1).Similarly, barriers that allow for their modification, suchas turning off alarms, can result in work contexts withhidden dangers that, when suddenly exposed, can definenew work contexts with increased human error potential.In some cases, the introduction of a barrier may sothoroughly disturb the nature of work that many newand unanticipated forms of human error can arise (asexemplified in Section 5.1.1).
A third and often overlooked connection betweenbarriers and human error concerns how the perceptionof barriers, such as intelligent sensing systems andcorrective devices, may alter human performance. Thisconnection is based in part on characterizations ofhuman fallibility in terms of risk attitude, where indi-viduals who are risk prone or even risk neutral, maybe more willing to take risks when they perceivebarriers to be in place. Adjusting risk-taking behaviorto maintain a constant level of risk is in line with risk-homeostasis theory (Wilde, 1982). These adjustmentspresume that humans are reasonably good at estimatingthe magnitude of risk, which generally does not appearto be the case. A disturbing implication of this theory isthe possibility that some interventions by organizationsdirected at improving the safety climate (Section 6)could instead result in work cultures that promoteattitudes that are nonconducive to safe operations. Thereal danger of these behaviors is that they can establishnew contexts that the barriers were not designedto prevent.
2.4.1 Classification of Barrier Systems
Hollnagel (2004) has proposed a classification ofbarriers that, for our purposes, can serve to highlightthe link between human error and barriers that canarise by virtue of human interaction with the barriersystem. In his approach, barrier systems are groupedinto four categories: physical or material barrier systems,functional barrier systems, symbolic barrier systems, andincorporeal barrier systems. The possibility also exists

HUMAN ERROR AND HUMAN RELIABILITY ANALYSIS 749
Table 3 Barrier functions
Barrier Function Example
Barrier Functions for Physical Barrier Systems
Containing or protectingPrevent transporting something from the present
location (e.g., release) or into the present location(penetration)
Walls, doors, buildings, restricted physical access, railings,fences, filters, containers, tanks, valves, rectifiers
Restraining or preventing movement or transportationof mass or energy
Safety belts, harnesses, fences, cages, restricted physicalmovements, spatial distance (gulfs, gaps)
Keeping together; cohesion, resilience, indestructibility Components that do not break or fracture easily (e.g., safetyglasses)
Separating, protecting, blocking Crumble zones, scrubbers, filters
Barrier Functions for Functional Barrier Systems
Preventing movement or action (mechanical, hard) Locks, equipment alignment, physical interlocking, equipmentmatch
Preventing movement or action (logical, soft) Passwords, entry codes, action sequences, preconditions,physiological matching (e.g., iris, fingerprint, alcohol level)
Hindering or impeding actions (spatial-temporal) Distance (too far for a single person to reach), persistence(deadman button), delays, synchronization
Dampening, attenuation Active noise reduction, active suspensionDissipating energy, quenching, extinguishing Air bags, sprinklers
Barrier Functions for Symbolic Barrier Systems
Countering, preventing, or thwarting actions Coding of functions (e.g., by color, shape, spatial layout),demarcations, labels, and (static) warnings (facilitating correctactions may be as effective as countering incorrect ones)
Regulating actions Instructions, procedures, precautions/conditions, dialoguesIndicating system status Signs (e.g., traffic signs), signals (visual, auditory), warnings,
alarmsPermission or authorization (or the lack thereof) Work permit, work orderCommunication, interpersonal dependency Clearance, approval (on-line or off-line) in the sense that the
lack of clearance, etc., is a barrier
Barrier Functions for Incorporeal Barrier Systems
Complying, conforming to Self-restraint, ethical norms, morals, social or group pressurePrescribing: rules, laws, guidelines, prohibitions Rules, restrictions, laws (all either conditional or unconditional)
Source: Hollnagel (2004).
for barriers to consist of some composite of these typesof systems. A summary of the functions associated witheach of these categories of barrier systems is given inTable 3.
2.4.2 Paradoxical Effects of Barriers
The possibility for barriers having paradoxical effectswas exemplified in a study by Koppel et al. (2005), whofound that the introduction of a hospital-computerizedphysician order entry (CPOE) system, a type of bar-rier system intended to significantly reduce medication-prescribing errors, actually facilitated errors by users.In this study, errors were grouped into two cate-gories: (1) information errors arising from the fragmen-tation of data and the failure to integrate information
across the various hospital information systems and(2) human–machine interface flaws that fail to ade-quately consider the practitioner’s behaviors in responseto the constraints of the hospital’s organizational workstructure. An example of an error related to the firstcategory is when the physician orders new medica-tions or modifies existing medications. If current dosesare not first discontinued, the medications may actu-ally become increased or decreased or be added onas duplicative or conflicting medication. Detection ofthese errors was hindered by flaws in the interface thatcould require 20 screens for viewing a single patient’smedications.
Complex organizational systems such as hospitalscan make it extremely difficult for designers to anticipate

750 DESIGN FOR HEALTH, SAFETY, AND COMFORT
the many contexts and associated problems that canarise from interactions with the systems that they design(Section 5.1). It may seem to make more sense tohave systems such as CPOEs monitored by practitionersand other workers for their error-inducing potentialrather than have designers attempt to anticipate allthe contexts associated with the use of these systems.However, this imposes the added burden of ensuring thatmechanisms are in place for collecting the appropriatedata, communicating this information to designers, andvalidating that the appropriate interventions have beenincorporated.
With a number of electronic information devices, thebenefits of reducing or even eliminating the possibilityfor certain types of errors may come at the risk ofexposing new windows of opportunity for errors throughthe alteration of existing contexts. In hospital systems,for example, the reliance on information in electronicform can disturb critical communication flows and is lesslikely than face-to-face communication to provide thecues and other information necessary for constructingappropriate models of patient problems.
2.4.3 Forcing Functions and Work Procedures
A common method often employed by designers forcreating barriers to human error is through the use offorcing functions , which are design constraints that alertsystem users to their errors by blocking their actions.For example, computer-interactive systems can forcethe user to correct an invalid entry prior to proceeding,provide warnings about actions that are potentially errorinducing, and employ self-correction algorithms thatattempt to infer the user’s intentions. Unfortunately,each of these methods can also be breached, dependingon the context in which it is used. For example, forcingfunctions can initiate a process of backtracking by theuser that can lead to total confusion and thus moreopportunity for error (Reason, 1990), and warnings canbe ignored under high workloads.
One of the most frequently used symbolic barriersystems (Table 3) in industry—the written work pro-cedure —is also one that is highly vulnerable to mis-interpretation, often due to a variety of latent factors.For example, the designers of these procedures maynot have adequately considered the human’s abilitiesor users’ concerns for their own safety or the workcontexts in which the procedure would need to be car-ried out (Sharit, 1998). Even if procedures are welldesigned, inadequate training on their execution can pro-voke actions that can lead to adverse consequences.
Many of the procedures designed for high-hazardoperations include warnings, contingencies (informationon when and how to “back out” when dangerous con-ditions arise during operations), and other supportingfeatures. To avoid the recurrence of past incidents, theseprocedures are often frequently updated. Consequently,they grow in size and complexity to the point wherethey can contribute to information overload, increasingthe possibility even more that their users will missor confuse important information (Reason, 1997). Inaddition, procedures that disrupt the momentum of
human work operations will be especially vulnerable toviolation.
2.4.4 Use of Redundancy for Error Detection
Redundancy in the form of cues presented in multi-ple modalities is a simple and very effective way ofincreasing a person’s likelihood of detecting and cor-recting errors. This strategy is illustrated in the caseof the ampoule-swap error in hospital operating rooms(Levy et al., 2002). Many drug solutions are containedin ampoules that do not vary much in size and shape,often contain clear liquid solutions, and have few distin-guishing features. If an anesthesiologist uses the wrongampoule to fill a syringe and inadvertently “swaps in”a risky drug such as potassium chloride, serious conse-quences could ensue. Contextual factors such as fatigueand distractions make it unreasonable to expect medicalproviders to invest the resources of attention necessaryfor averting these types of errors. Moreover, the useof warning signs on bins that store ampoules contain-ing “risky solutions” are poor solutions to this prob-lem, as they require that the human maintain knowledgein the head —specifically, in WM—thus making thisinformation vulnerable to memory loss resulting fromdelays or distractions between retrieving the ampouleand preparing the solution. The more reliable solutionthat was suggested by the investigators of this study wasto provide tactile cues on both the storage bins and theampoules. For example, wrapping a rubber band aroundthe ampoule following its removal from the bin providesan alerting cue in the form of tactile feedback prior toloading the ampoule into the syringe.
Another approach to error detection through redun-dancy is to have other people available for detectingerrors. As with hardware components, human redun-dancy will usually lead to more reliable systems. How-ever, successful human redundancy often requires thatthe “other people” be external to the operational sit-uation. Consequently, they would be less likely to besubject to tendencies by people to explain away incon-sistencies or evidence that contradict one’s assessmentof the situation and thus less likely to exhibit cognitivefixation errors . In a study of 99 simulated emergencyscenarios involving nuclear power plant crews, Woods(1984) found that while none of the errors involvingdiagnosis of the system state were detected by the oper-ators who made them, other people were able to detect anumber of them. In contrast, half the errors categorizedas slips (i.e., errors in execution of correct intentions)were detected by the operators who made them.
That barriers to human error based on human redun-dancy need not always be in place by design is oftendemonstrated in large-scale hospital systems. In thesesystems, one typically encounters an assortment ofpatient problem scenarios, a variety of health careservices, complex flows of patient information acrossvarious media on a continual 24-h basis, and a largevariability in the skill levels of health care providers whomust often perform under conditions of overload andfatigue while being subjected to various administrativeconstraints. Fortunately, there usually exist multiplelayers of redundancy in the form of alternative materials

HUMAN ERROR AND HUMAN RELIABILITY ANALYSIS 751
(e.g., equipment), treatment schedules, and health careworkers to thwart the serious propagation of manypotential errors. Thus, despite a number of constraintsthat are present in hospital systems, these systems aresufficiently loosely coupled (Section 2.3) to overcomemany of the risks that arise in patient care, includingthose that are generated by virtue of discontinuities orgaps in treatment (Cook et al., 2000).
2.4.5 Cognitive Strategies in Error Detection
As implied in the study by Woods (1984), humans arequite adept at detecting and correcting many of theskill-based errors they make, which is why people areoften relied upon to serve as barriers. Self-correction,however, implies two conditions: that the human departfrom automated processing, even if only momentarily,and that the human periodically invest attentionalresources to check whether the intentions are being metand that cues are available to alert one to deviation fromintention (Reason, 1990). This would apply to both slipsand omissions of actions.
These error detection processes, as well as other errordetection processes such as forcing functions or humanredundancy, are for the most part relatively spontaneousin nature and do not require significant outlays of effort.At the knowledge-based level of performance, however,the human’s error detection abilities are greatly reduced.Error detection in these more complex situations willdepend on intensive cognitive processing activities suchas the ability to think about possible errors that mightoccur, predicting the time course of multiple processes,or discovering that the wrong goal has been selected.
Human error detection and recovery at the knowl-edge-based level of performance may in fact represent ahighly evolved form of expertise. Interestingly, whereasknowledge-based errors decrease with increased exper-tise, skill-based errors increase. Also, experiencedworkers, as compared to beginners, tend to disregard alarger number of errors that have no work-related conse-quences, suggesting that with expertise comes the abilityto apply higher order criteria for regulating the worksystem, thus enabling the allocation of attention to errorsto occur on a more selective basis (Amalberti, 2001).
Kontogiannis and Malakis (2009) have developedand discuss in detail a taxonomy of cognitive strategiesin error detection and identification that is based on thefollowing four stages in error detection:
• Awareness-Based Detection. At this stage, intro-spection is used to critique one’s mental mod-els in terms of their completeness, coherence,and reliability, in order to enable revisions ofsituational assessments to consider hidden anduntested assumptions through the collection ofadditional data.
• Planning-Based Detection. These strategies in-clude the consideration of a time scale for revis-ing plans in the face of new evidence; balancingconflicting goals through mental simulation ofthe risks associated with carrying out alterna-tive plans; regulation of plan complexity to fit
the circumstances; and relying on loosely cou-pled rather than integrated plans to enable greaterflexibility in error detection.
• Action-Based Detection .These proactive strate-gies include running preaction and postactionchecks on highly routine tasks in order to avertslips and lapses; creating barriers in the form ofreminders to combat the susceptibility to inter-ruptions and “task triggers” to combat captureerrors (Section 2.2.4) when tasks need to be per-formed in a different way; and rehearsing tasksthat may need to be carried out later on undertime pressure.
• Outcome-Based Detection . This stage includesstrategies such as examining changes in rela-tional and temporal data patterns over time;cross-checking data to manage mismatchesbetween expected outcomes and observed out-comes; and the use of a mental model to considerthe effects of interventions by other agents.
These cognitive strategies for error detection areclearly effortful. For example, they may call for thehuman to engage in simultaneous belief and doubtor to forego the use of well-used rules in order tocast familiar data in new ways. However, they haveimportant implications for error management training(Kontogiannis and Malakis, 2009) and thus constitute apotentially critical consideration in the development ofhighly reliable and resilient organizations (Section 6).
3 ERROR TAXONOMIES AND PREDICTINGHUMAN ERROR
3.1 Classifying Human ErrorMany areas of scientific investigation use classificationsystems or taxonomies as a means for organizingknowledge about a subject matter. The subject of humanerror is no exception. Taxonomies of human error canbe used retrospectively to gather data on trends thatpoint to weaknesses in design, training, and operations.They can also be used prospectively, in conjunction withdetailed analyses of tasks and situational contexts, topredict possible errors.
Earlier (Section 2.3), a distinction was made betweenphenotypes, which are the error modes that describe theexternal (i.e., observable) manifestation of an erroneousaction, and genotypes, which are the factors thatcan influence or “cause” these failures. Eight basicphenotypes, or error modes, have been defined byHollnagel (1998):
• Timing : actions performed too early or too lateor omitted
• Duration: actions that continued for too long orwere terminated too early
• Force: actions performed with insufficient or toomuch force
• Distance/magnitude: movements taken too far ornot far enough
752 DESIGN FOR HEALTH, SAFETY, AND COMFORT
• Speed : actions performed too quickly or tooslowly
• Direction: movements in the wrong direction orof the wrong kind
• Wrong object : a neighboring, similar, or unre-lated object used by mistake
• Sequence: within a series of actions, actions thatwere omitted, repeated, reversed in their order,or inappropriately added
When directed at highly specific tasks or operations,this kind of taxonomy can be used to characterize thevarious ways that a particular task can be performedincorrectly. For example, in the health care industry,the diversity of medical procedures and the varietyof circumstances under which these procedures areperformed may, in fact, call for highly specific errortaxonomies that are derived from more general errorclassification systems.
For more cognitively complex tasks, it may beuseful to classify “cognitive failures.” One approachis to categorize these errors in cognition according tostages of information processing (Figure 2), therebydifferentiating, for example, errors related to perceptionfrom errors related to failures in working memory.The characterization of performance as skill, rule,or knowledge based (Section 2.2.4) also has provenparticularly useful in thinking about the ways in whichcognitively based failures can arise, in light of thedifferent kinds of information-processing activities thatare presumed to be occurring at each of these levels.
Figure 4 and Tables 4 and 5 illustrate several othertypes of error classification systems. The flowchartin Figure 4 classifies different types of human errorsthat can occur under SRK levels of performance. Thisflowchart seeks to answer questions concerning howan error occurred. Similar flowcharts are provided byRasmussen (1982) to address why an error occurred aswell as what type of error occurred.
Reason’s (1990) taxonomy (Table 4) also exploitsthe distinctions among skill, rule, and knowledge-basedlevels of performance, but draws attention to how errormodes related to skill-based slips and lapses differfrom error modes related to rule and knowledge-basedmistakes . The taxonomy presented in Table 5 illustratesthe classification of external error modes into differentaspects of information processing.
3.2 Predicting Human Error
The use of taxonomies for the purpose of revealingpatterns or tendencies related to human performancefailures can provide valuable data about weaknessesin design, training, and operations. These classificationschemes can also support the gathering of data for per-forming quantitative human error assessments, whichare often required in probabilistic system risk assess-ments (Section 4.1) and are integral to the analysis ofaccidents for root causes (Chapter 38).
In addition to these benefits, taxonomies of humanerror, especially those that emphasize cognitive or causalfactors, have predictive value as well. However, asimplied in Figure 5, predicting the types of errorshumans might commit under actual work conditions is adifficult undertaking. The multidimensional complexitysurrounding actual work situations and the uncertaintyassociated with the human’s goals, intentions, andattentional and affective states that unfold over timeintroduce many layers of guesswork into the process ofestablishing reliable mappings between human fallibilityand situational contexts.
In 1991, Senders and Moray stated: “To understandand predict errors . . . usually requires a detailed taskanalysis” (p. 60). Very little has changed since thento diminish the validity of this assertion. In fact, ourgreater understanding of mechanisms underlying humaninteraction with complex systems (e.g., Woods andHollnagel, 2005) have probably made the process ofpredicting human error more laborious than ever, as itshould be. Expectations of shortcuts are unreasonable;error prediction by its very nature should be a tediousprocess and will often be influenced by the schemeselected for error classification.
As implied by Senders and Moray (1991), taskanalysis (TA) is an essential tool for predicting humanerror or performance failures. TA describes the human’sinvolvement with a system in terms of the goals tobe accomplished and all the human’s activities, bothphysical and cognitive, that are necessary to meet thesegoals.
Within a TA, the analysis of human–system inter-actions could be performed using a variety of perspec-tives and methods. For example, the analyst may resortto simple models of human information processing todetermine if the human is receiving sufficiently salient,clear, complete, and interpretable input; has adequatetime to respond to the input with respect to being ableto mentally code, classify, and resolve the informationor in terms of the time the system allows for executingan action; and whether feedback is available to enablethe human to determine whether the action was exe-cuted correctly and was appropriate for dealing with thegoal in question. More complex information-processingschemes can also be used.
These human–system interaction descriptions couldalso include activity time lines; dependencies thatmight exist among activities; alternative plans forperforming an operation; contingencies that may ariseduring the course of activities and options for handlingthese contingencies; characterizations of informationflow between different subsystems; and descriptionsof displays, controls, training, and interactions withother people. Depending on whether the analysis is tobe applied to a process that is still in the conceptualstages, to a newly implemented process, or to anexisting process, broad applications of TA techniquesthat may include mock-ups, walkthroughs, simulations,interviews, and direct observations may be needed toidentify the relevant contextual elements.

HUMAN ERROR AND HUMAN RELIABILITY ANALYSIS 753
Figure 4 Decision flow diagram for analyzing an event into one of 13 types of human error. (From Rasmussen, 1982.Copyright 1982 with permission from Elsevier.)

754 DESIGN FOR HEALTH, SAFETY, AND COMFORT
Table 4 Human Error Modes Associated withRasmussen’s SRK Framework
Skill-Based PerformanceInattention Overattention
Double-capture slipsOmissions following
interruptionsReduced intentionalityPerceptual confusionsInterference errors
OmissionsRepetitionsReversals
Rule-Based PerformanceMisapplication of Good
RulesApplication of Bad Rules
First exceptionsCountersigns and
nonsignsInformational overloadRule strengthGeneral rulesRedundancyRigidity
Encoding deficienciesAction deficiencies
Wrong rulesInelegant rulesInadvisable rules
Knowledge-Based Performance
SelectivityWorkspace limitationsOut of sight, out of mindConfirmation biasOverconfidenceBiased reviewingIllusory correlationHalo effectsProblems with causality
Problems with complexityProblems with delayed
feedbackInsufficient consideration
of processes in timeDifficulties with
exponentialdevelopments
Thinking in causal seriesand not causal nets
Thematic vagabondingEncysting
Source: Reason (1990). Copyright © Cambridge UniversityPress 1990. Reprinted with permission of CambridgeUniversity Press.
TA can often be enhanced through the use of avariety of auxiliary tools. For example, the analyst maychoose to employ checklists that cover a broad range ofergonomic considerations to determine if the human isbeing subjected to factors (such as illumination, noise,awkward postures, or poor interfaces) that can contributeto erroneous actions. These types of checklists can beexpanded to include human fallibility considerations(Section 2.2) and contextual factors (Section 2.3) atvarious levels of detail.
However, prior to making any such embellishments,it is essential that the analyst identify an appropriateTA method for the particular problem or work domainas a number of different methods exist for performingTA (e.g., Kirwan and Ainsworth, 1992; Luczak, 1997;Shepherd, 2001; Chapter 13). Also, task analysts con-tending with complex systems will often need toconsider various properties of the wider system orsubsystem in which human activities take place (Sharit,1997). As noted by Shepherd (2001), “Any task analysismethod which purports to serve practical ends needs tobe carried out beneath a general umbrella of systemsthinking” (p. 11).
Table 5 External Error Modes Classified Accordingto Stages of Human Information Processing
1. Activation/detection1.1 Fails to detect signal/cue1.2 Incomplete/partial detection1.3 Ignore signal1.4 Signal absent1.5 Fails to detect deterioration of situation
2. Observation/data collection2.1 Insufficient information gathered2.2 Confusing information gathered2.3 Monitoring/observation omitted
3. Identification of system state3.1 Plant-state identification failure3.2 Incomplete-state identification3.3 Incorrect-state identification
4. Interpretation4.1 Incorrect interpretation4.2 Incomplete interpretation4.3 Problem solving (other)
5. Evaluation5.1 Judgment error5.2 Problem-solving error (evaluation)5.3 Fails to define criteria5.4 Fails to carry out evaluation
6. Goal selection and task definition6.1 Fails to define goal/task6.2 Defines incomplete goal/task6.3 Defines incorrect or inappropriate goal/task
7. Procedure selection7.1 Selects wrong procedure7.2 Procedure inadequately formulated/shortcut
invoked7.3 Procedure contains rule violation7.4 Fails to select or identify procedure
8. Procedure execution8.1 Too early/late8.2 Too much/little8.3 Wrong sequence8.4 Repeated action8.5 Substitution/intrusion error8.6 Orientation/misalignment error8.7 Right action on wrong object8.8 Wrong action on right object8.9 Check omitted
8.10 Check fails/wrong check8.11 Check mistimed8.12 Communication error8.13 Act performed wrongly8.14 Part of act performed8.15 Forgets isolated act at end of task8.16 Accidental timing with other
event/circumstance8.17 Latent error prevents execution8.18 Action omitted8.19 Information not obtained/transmitted8.20 Wrong information obtained/transmitted8.21 Other
Source: Kirwan (1994).
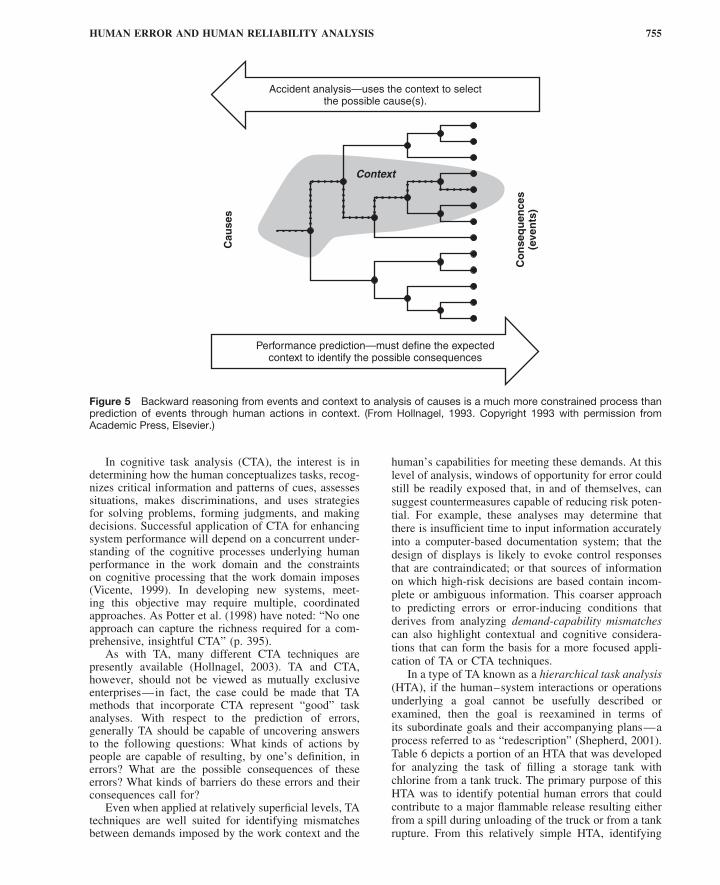
HUMAN ERROR AND HUMAN RELIABILITY ANALYSIS 755
Accident analysis—uses the context to selectthe possible cause(s).
Performance prediction—must define the expectedcontext to identify the possible consequences
Cau
ses
Context
Co
nse
qu
ence
s(e
ven
ts)
Figure 5 Backward reasoning from events and context to analysis of causes is a much more constrained process thanprediction of events through human actions in context. (From Hollnagel, 1993. Copyright 1993 with permission fromAcademic Press, Elsevier.)
In cognitive task analysis (CTA), the interest is indetermining how the human conceptualizes tasks, recog-nizes critical information and patterns of cues, assessessituations, makes discriminations, and uses strategiesfor solving problems, forming judgments, and makingdecisions. Successful application of CTA for enhancingsystem performance will depend on a concurrent under-standing of the cognitive processes underlying humanperformance in the work domain and the constraintson cognitive processing that the work domain imposes(Vicente, 1999). In developing new systems, meet-ing this objective may require multiple, coordinatedapproaches. As Potter et al. (1998) have noted: “No oneapproach can capture the richness required for a com-prehensive, insightful CTA” (p. 395).
As with TA, many different CTA techniques arepresently available (Hollnagel, 2003). TA and CTA,however, should not be viewed as mutually exclusiveenterprises—in fact, the case could be made that TAmethods that incorporate CTA represent “good” taskanalyses. With respect to the prediction of errors,generally TA should be capable of uncovering answersto the following questions: What kinds of actions bypeople are capable of resulting, by one’s definition, inerrors? What are the possible consequences of theseerrors? What kinds of barriers do these errors and theirconsequences call for?
Even when applied at relatively superficial levels, TAtechniques are well suited for identifying mismatchesbetween demands imposed by the work context and the
human’s capabilities for meeting these demands. At thislevel of analysis, windows of opportunity for error couldstill be readily exposed that, in and of themselves, cansuggest countermeasures capable of reducing risk poten-tial. For example, these analyses may determine thatthere is insufficient time to input information accuratelyinto a computer-based documentation system; that thedesign of displays is likely to evoke control responsesthat are contraindicated; or that sources of informationon which high-risk decisions are based contain incom-plete or ambiguous information. This coarser approachto predicting errors or error-inducing conditions thatderives from analyzing demand-capability mismatchescan also highlight contextual and cognitive considera-tions that can form the basis for a more focused appli-cation of TA or CTA techniques.
In a type of TA known as a hierarchical task analysis(HTA), if the human–system interactions or operationsunderlying a goal cannot be usefully described orexamined, then the goal is reexamined in terms ofits subordinate goals and their accompanying plans—aprocess referred to as “redescription” (Shepherd, 2001).Table 6 depicts a portion of an HTA that was developedfor analyzing the task of filling a storage tank withchlorine from a tank truck. The primary purpose of thisHTA was to identify potential human errors that couldcontribute to a major flammable release resulting eitherfrom a spill during unloading of the truck or from a tankrupture. From this relatively simple HTA, identifying

756 DESIGN FOR HEALTH, SAFETY, AND COMFORT
Table 6 Part of a Hierarchical Task AnalysisAssociated with Filling a Chlorine Tanker
0. Fill tanker with chlorine.Plan: Do tasks 1–5 in order.
1. Park tanker and check documents (not analyzed).2. Prepare tanker for filling.
Plan: Do 2.1 or 2.2 in any order, then do 2.3–2.5 inorder.2.1 Verify tanker is empty.
Plan: Do in order:2.1.1 Open test valve.2.1.2 Test for Cl2.2.1.3 Close test valve.
2.2 Check weight of tanker.2.3 Enter tanker target weight.2.4 Prepare fill line.
Plan: Do in order:2.4.1 Vent and purge line.2.4.2 Ensure main Cl2 valve is closed.
2.5 Connect main Cl2 fill line.3. Initiate and monitor tanker filling operation.
Plan: Do in order:3.1 Initiate filling operation.
Plan: Do in order:3.1.1 Open supply line valves.3.1.2 Ensure tanker is filling with chlorine.
3.2 Monitor tanker-filling operation.Plan: Do 3.2.1, do 3.2.2 every 20 min;on initial weight alarm, do 3.2.3 and 3.2.4;on final weight alarm, do 3.2.5 and 3.2.6.3.2.1 Remain within earshot while tanker is
filling.3.2.2 Check tanker while filling.3.2.3 Attend tanker during last filling of 2 or
3 tons.3.2.4 Cancel initial weight alarm and remain
at controls.3.2.5 Cancel final weight alarm.3.2.6 Close supply valve A when target
weight is reached.4. Terminate filling and release tanker.
4.1 Stop filling operation.Plan: Do in order:4.1.1 Close supply valve B.4.1.2 Clear lines.4.1.3 Close tanker valve.
4.2 Disconnect tanker.Plan: Repeat 4.2.1 five times, then do4.2.2–4.2.4 in order.4.2.1 Vent and purge lines.4.2.2 Remove instrument air from valves.4.2.3 Secure blocking device on valves.4.2.4 Break tanker connections.
4.3 Store hoses.4.4 Secure tanker.
Plan: Do in order:4.4.1 Check valves for leakage.4.4.2 Secure log-in nuts.4.4.3 Close and secure dome.
4.5 Secure panel (not analyzed).5. Document and report (not analyzed).
Source: CCPS (1994). Copyright 1994 by the AmericanInstitute of Chemical Engineers. Reproduced by permis-sion of AIChE.
external error modes is a relatively straightforwardmatter.
For example, consider steps 2.3, 3.2.2, 4.1.2, and4.2.1 in Table 6. Referring to the error classificationscheme in Table 5, the manifestation of errors relatedto each of these actions would occur at the procedureexecution stage (stage 8) of information processing:
• For step 2.3 (enter tanker target weight), it wouldbe 8.20: Wrong information obtained, whichwould lead to entering an incorrect weight.
• For step 3.2.2 (check tanker while filling), itwould be 8.9: Check omitted.
• For step 4.1.3 (close tanker valve), it would be8.18: Action omitted.
• For step 4.2.1 (vent and purge lines), it would be8.2: Operation incomplete.
Tabular formats are often used to accompany suchstepwise task descriptions, allowing for the inclusion ofa variety of complimentary assessments. For example,for each task step of a HTA, one column could beassigned to address the possible kinds of performancefailures that could arise from these actions; additionalcolumns could be used to document possible causes andconsequences of these failures; and still other columnscould be directed at error reduction recommendations,which could be further categorized into error mitigationor elimination strategies that resort to procedures,training, or hardware/software (CCPS, 1994) or the useof cognitive error detection strategies (Section 2.4.5)
The taxonomy shown in Table 5 can also be linkedto more underlying psychological mechanisms. Thiswould enable errors with identical or similar externalmanifestations to be distinguished and thus add con-siderable depth to the understanding of potential errorspredicted from the TA. An example of such a schemeis the human error identification in systems technique(HEIST), which classifies external error modes accord-ing to the eight stages of human information processinglisted in Table 5. The first column in a HEIST tableconsists of a code whose initial letter(s) refers to one ofthese eight stages. The next letter in the code refers toone of six general PSFs (Section 2.3): time (T), interface(I), training/experience/familiarity (E), procedures (P),task organization (O), and task complexity (C). Thesecodes can then be linked to external error modes basedon various underlying psychological error mechanisms(PEMs). Many of these mechanisms are consistent withthe failure modes in Reason’s error taxonomy (Table 4).
Table 7 presents an extract from a HEIST tablecontaining a sample of items related to the first two ofthe eight stages of human information processing listedin Table 5: activation/detection (corresponding to codesbeginning with “A”) and observation/data collection(corresponding to codes beginning with “O”). Moredetailed explanations of some of the PEMs listed inthe HEIST table are presented in Table 8. A completeHEIST table and the corresponding listing of PEMs canbe found in Kirwan (1994).
The human reliability analysis method known asCREAM (Section 4.10) developed by Hollnagel (1998)

Tab
le7
So
me
Item
sfr
om
HE
IST
Tab
leC
orr
esp
ond
ing
toFi
rst
Tw
oS
tag
esin
Tab
le5
Sys
tem
Cau
se/P
sych
olog
ical
Cod
eE
rror
Iden
tifier
Pro
mp
tE
xter
nalE
rror
Mod
eE
rror
Mec
hani
smE
rror
Red
uctio
nG
uid
elin
es
AT
Doe
sth
esi
gnal
occu
rat
the
app
rop
riate
time?
Cou
ldit
be
del
ayed
?
Act
ion
omitt
edor
per
form
edei
ther
too
early
orto
ola
te
Sig
nal-
timin
gd
efici
ency
,fai
lure
ofp
rosp
ectiv
em
emor
y
Alte
rsy
stem
confi
gura
tion
top
rese
ntsi
gnal
app
rop
riate
ly;r
epea
tsi
gnal
until
actio
nha
soc
curr
ed.
AI
Isth
esi
gnal
stro
ngan
din
ap
rom
inen
tlo
catio
n?C
ould
the
sign
alb
eco
nfus
edw
ithan
othe
r?
Act
ion
omitt
edor
per
form
edto
ola
teor
wro
ngac
tp
erfo
rmed
Sig
nald
etec
tion
failu
reP
riorit
ize
sign
als;
pla
cesi
gnal
sin
prim
ary
loca
tion;
use
div
erse
sign
als;
use
mul
tiple
-sig
nalc
odin
g;gi
vetr
aini
ngin
sign
alp
riorit
ies;
incr
ease
sign
alin
tens
ity.
AE
Doe
sth
eop
erat
orun
der
stan
dth
esi
gnifi
canc
eof
the
sign
al?
Act
ion
omitt
edor
per
form
edto
ola
teIn
adeq
uate
men
tal
mod
elTr
aini
ngan
dp
roce
dur
essh
ould
be
amen
ded
toen
sure
that
sign
ifica
nce
isun
der
stoo
d.
AO
Will
the
oper
ator
have
ave
ryhi
ghor
low
wor
kloa
d?
Act
ion
omitt
edor
per
form
edei
ther
too
late
orto
oea
rly
Lap
seof
mem
ory,
othe
rm
emor
yfa
ilure
,si
gnal
det
ectio
nfa
ilure
Imp
rove
task
and
crew
orga
niza
tion;
use
are
curr
ing
sign
al;c
onsi
der
auto
mat
ion;
utili
zefle
xib
lecr
ewin
g;en
hanc
esi
gnal
salie
nce.
AC
Isth
esi
gnal
inco
nflic
tw
ithth
ecu
rren
td
iagn
ostic
min
dse
t?A
ctio
nom
itted
orw
rong
act
per
form
edC
onfir
mat
ion
bia
s,si
gnal
igno
red
Pro
ced
ures
shou
ldem
pha
size
dis
confi
rmin
gas
wel
las
confi
rmat
ory
sign
als;
carr
you
tp
rob
lem
-sol
ving
trai
ning
and
team
trai
ning
;im
ple
men
tau
tom
atio
n.O
TC
ould
the
info
rmat
ion
orch
eck
occu
rat
the
wro
ngtim
e?Fa
ilure
toac
tor
actio
np
erfo
rmed
too
late
orto
oea
rlyor
wro
ngac
tp
erfo
rmed
Inad
equa
tem
enta
lm
odel
/inex
per
ienc
e/cr
ewco
ord
inat
ion
failu
re
Pro
ced
ure
and
trai
ning
shou
ldsp
ecify
the
prio
rity
and
timin
gof
chec
ks;p
rese
ntke
yin
form
atio
nce
ntra
lly;
utili
zetr
end
dis
pla
ysan
dp
red
icto
rd
isp
lays
ifp
ossi
ble
;im
ple
men
tte
amtr
aini
ng.
OI
Are
any
info
rmat
ion
sour
ces
amb
iguo
us?
Act
ion
omitt
edor
per
form
edto
ola
teor
too
early
orw
rong
act
per
form
ed
Mis
inte
rpre
tatio
n,m
ista
kes
alte
rnat
ives
Use
task
-bas
edd
isp
lays
;des
ign
sym
pto
m-b
ased
dia
gnos
ticai
ds;
utili
zed
iver
sein
form
atio
nso
urce
s;en
sure
clar
ityof
info
rmat
ion
dis
pla
yed
;util
ize
alar
mco
nditi
onin
g.O
EC
ould
the
oper
ator
inte
rrog
ate
too
man
yin
form
atio
nso
urce
sfo
rto
olo
ng?
Act
ion
omitt
edor
per
form
edto
ola
teTh
emat
icva
gab
ond
ing,
risk
reco
gniti
onfa
ilure
,ina
deq
uate
men
talm
odel
Pro
vid
etr
aini
ngin
faul
td
iagn
osis
;put
pro
ced
ural
emp
hasi
son
req
uire
dd
ata
colle
ctio
ntim
efr
ames
;im
ple
men
thi
gh-l
evel
ind
icat
ors
(ala
rms)
ofsy
stem
inte
grity
det
erio
ratio
n.O
PC
ould
the
oper
ator
forg
eton
eor
mor
eite
ms
inth
ep
roce
dur
es?
Act
ion
omitt
edor
per
form
edei
ther
too
early
orto
ola
teor
wro
ngac
tp
erfo
rmed
Forg
etis
olat
edac
t,sl
ipof
mem
ory,
pla
ce-l
osin
ger
ror
Ens
ure
aner
gono
mic
pro
ced
ure
des
ign;
utili
zetic
k-of
fshe
ets,
pla
ceke
epin
gai
ds,
etc.
;pro
vid
ete
amtr
aini
ngto
emp
hasi
zech
ecki
ngb
yot
her
team
mem
ber
(s).
OO
Cou
ldin
form
atio
nco
llect
edfa
ilto
be
tran
smitt
edef
fect
ivel
yac
ross
shift
-han
dov
erb
ound
arie
s?
Failu
reto
act
orac
tion
isw
rong
orp
erfo
rmed
too
late
orto
oea
rlyor
aner
ror
ofq
ualit
y
Cre
wco
ord
inat
ion
failu
reD
evel
opro
bus
tsh
ift-h
and
over
pro
ced
ures
;tra
inin
g;p
rovi
de
team
trai
ning
acro
sssh
iftb
ound
arie
s;d
evel
opro
bus
tan
dau
dita
ble
dat
a-re
cord
ing
syst
ems
(logs
).O
CD
oes
the
scen
ario
invo
lve
mul
tiple
even
ts,t
hus
caus
ing
ahi
ghle
velo
fcom
ple
xity
ora
high
wor
kloa
d?
Failu
reto
act
orw
rong
actio
np
erfo
rmed
orac
tion
per
form
edei
ther
too
early
orto
ola
te
Cog
nitiv
eov
erlo
adP
rovi
de
emer
genc
yre
spon
setr
aini
ng;u
sefle
xib
lecr
ewin
gst
rate
gies
;dev
elop
emer
genc
yop
erat
ing
pro
ced
ures
able
tod
ealw
ithm
ultip
letr
ansi
ents
;ge
nera
ted
ecis
ion/
dia
gnos
ticsu
pp
ort
faci
litie
s.
Sou
rce:
Ad
apte
dfr
omK
irwan
(199
4).
757

758 DESIGN FOR HEALTH, SAFETY, AND COMFORT
Table 8 A Sample of Psychological Error Mechanism Descriptions for Some Items in Table 7 andRecommendations for Their Remediation
Vigilance failure: lapse of attention. Ergonomic design of interface to allow provision of effective attention-gainingmeasures; supervision and checking; task-organization optimization, so that the operators are not inactive for longperiods and are not isolated.
Cognitive/stimulus overload: too many signals present for the operator to cope with. Prioritization of signals (e.g., high-,medium-, and low-level alarms); overview displays; decision support systems; simplification of signals; flowchartprocedures; simulator training; automation.
Stereotype fixation: operator fails to realize that situation has deviated from norm. Training and procedural emphasis onrange of possible symptoms/causes; fault–symptom matrix as a job aid; decision support system; shift technicaladvisor/supervision.
Signal discrimination failure: operator fails to realize that the signal is different. Improved ergonomics in the interfacedesign; enhanced training and procedural support in the area of signal differentiation; supervision checking.
Confirmation bias: operator only selects data that confirm given hypothesis and ignores other disconfirming data sources.Problem-solving training; team training; shift technical advisor (diverse, highly qualified operator who can ‘‘stand back’’and consider alternative diagnoses), functional procedures: high-level information displays; simulator training.
Thematic vagabonding: operator flits from datum to datum, never actually collating it meaningfully. Problem-solvingtraining; team training; simulator training; functional procedure specification for decision-timing requirements;high-level alarms for system integrity degradation.
Encystment: operator focuses exclusively on only one data source. Problem-solving training; team training (includingtraining in the need to question decisions and in the ability of the team leader(s) to take constructive criticism);high-level information displays; simulator training; high-level alarms for system integrity degradation.
Source Adapted from Kirwan (1994).
has, at its core, a method for qualitative performanceprediction that is highly dependent on TA. Fundamen-tal to this approach is the distinction referred to inSection 2.3 between phenotypes (Section 3.1), whichare the external error modes, and genotypes, which arethe possible “causes” of these error modes. Hollnagelpresents a large number of tables of genotypes; withineach of these tables, the genotype is further resolvedinto “general consequents,” which are, in turn, catego-rized into “specific consequents.” When a general orspecific consequent from one genotype can influence theconsequents of one or more other genotypes, these ini-tial consequents are considered antecedents. Ultimately,these influences can give rise to chains of antecedent-consequent links. Table 9 lists the consequents associ-ated with the person-related genotype “observation,” thetechnology-related genotype “equipment failure,” andthe organizational/environment-related genotype “com-munication.”
One problem that can arise using this scheme is thecombinatorial explosion of error prediction paths. Holl-nagel argues that this potentially large solution spacecan be logically constrained if the context is sufficientlywell known. Toward this end, he suggests using a rel-atively small set of common performance conditions(CPCs), which he believes contain the general deter-minants of performance, in order to produce a generalcontext description (Table 10). Although these CPCs areintended to have minimal overlap, they are not consid-ered to be mutually independent.
Using this scheme, the process of human perfor-mance or error prediction occurs as follows. First, ananalysis of the operator control tasks using TA, as wellas analysis of organizational and technical system con-siderations, is performed. Next, using the CPCs, the con-text is described. The CPCs serve to “prime” the variousclassification groups (e.g., Table 9), enabling the more
logical or probable antecedent-consequent links, as wellas the more likely error modes (Section 3.1), to be spec-ified. The third step consists of specifying the initiatingevents. These are usually actions humans perform atthe “sharp end” (Section 1.1) and are consistent withhuman actions that are of interest in probabilistic riskassessments (Section 4.1).
The fourth step uses the phenotype–genotype classi-fication scheme to generate propagation paths that leadthrough the various “causes” of the sharp end’s externalerror mode. The CPCs are used to constrain the prop-agation paths by allowing the analyst to consider onlythose consequents that are consistent with the situation;otherwise, the nonhierarchical ordering of the genotypeclassification groups can produce an excessive numberof steps. Phenotypes will always be categorized as con-sequents as they are the endpoints of the paths.
More recently, an approach to human performanceprediction has been proposed that consists of an inte-gration of a number of human factors and system safetyhazard analysis techniques (Sharit, 2008). The start-ing point of this methodology is a TA. The results ofthe TA become the “human components” of a failuremodes and effects analysis (FMEA), a hazard evalua-tion technique (Kumamoto and Henley, 1996) that inits conventional implementation requires specifying thefailure modes for each system component, assembly, orsubsystem as well as the consequences and causes ofthese failure modes. The mapping from the steps of theTA to the possible human performance failures modesessentially results in a “human” FMEA (HFMEA). Thisprocess is aided by a classification system in the formof a checklist that considers four broad categories ofbehavior: perceptual processes (searching for and receiv-ing information and identifying objects, actions, andevents); mediational processes (information processing

HUMAN ERROR AND HUMAN RELIABILITY ANALYSIS 759
Table 9 General and Specific Consequents of Three Genotypes
Person-Related Genotype: ‘‘Observation’’
General Consequent Specific Consequent Definition/Explanation
Observation missed Overlook cue/signal A signal or an event that should have been the start of an action(sequence) is missed.
Overlook measurement A measurement or some information is missed, usually during asequence of actions.
False observation False reaction A response is given to an incorrect stimulus or event, e.g., starting todrive when the light changes to red.
False recognition An event or some information is incorrectly recognized or mistaken forsomething else.
Wrong identification Mistaken cue A signal or a cue is misunderstood as something else. Unlike in a‘‘false reaction,’’ it does not immediately lead to an action.
Partial identification The identification of an event or some information is incomplete, e.g.,as in jumping to a conclusion.
Incorrect identification The identification of an event/information is incorrect but, unlike in a‘‘false recognition,’’ is a more deliberate process.
Technology-Related Genotype: ‘‘Equipment Failure’’
Equipment failure Actuator stick/slip An actuator or control either cannot be moved or moves too easily.Blocking Something obstructs or is in the way of an action.Release Uncontrolled release of matter or energy that causes other equipment
to fail.Speed up/slow down The speed of the process (e.g., a flow) changes significantly.No indicators An equipment failure occurs without a clear signature.
Software fault Performance slowdown The performance of the system slows down. This can in particular becritical for command and control.
Information delays There are delays in the transmission of information, hence in theefficiency of communication, both within the system and betweensystems.
Command queues Commands or actions are not being carried out because the system isunstable, but are (presumably) stacked.
Information not available Information is not available due to software or other problems.
Organization-Related Genotype: ‘‘Communication’’
Communication failure Message not received The message or the transmission of information did not reach thereceiver. This could be due to incorrect address or failure ofcommunication channels.
Message misunderstood The message was received, but it was misunderstood. Themisunderstanding is, however, not deliberate.
Missing information No information Information is not being given when it was needed or requested, e.g.,missing feedback.
Incorrect information The information being given is incorrect or incomplete.Misunderstanding There is a misunderstanding between sender and receiver about the
purpose, form, or structure of the communication.
Source: Adapted from Hollnagel (1998) by permission of Elsevier.
and problem solving/decision making); communicationprocesses; and motor execution processes.
A well-known disadvantage of FMEAs is their em-phasis on single-point failures (e.g., a valve failingopen), which increases the likelihood of failing toaccount for adverse system outcomes deriving from mul-tiple coexisting hazards or failures (U.S. Department ofHealth and Human Services, 1998). This problem isovercome in the proposed methodology by combiningthe HFMEA with the hazard and operability (HAZOP)
analysis method (CCPS, 1992), a hazard analysis tech-nique that, through creative brainstorming, can enablefurther insight into possible human–system failures.HAZOP uses a very systematic and thorough approachto analyze points of a process or operation, referred to as“study nodes” or “process sections,” by applying, at eachpoint of the process being analyzed, guide words (suchas “no,” “more,” “high,” “reverse,” “as well as,” and“other than”) to parameters (such as “flow,” “pressure,”“temperature,” and “operation”) in order to generate

760 DESIGN FOR HEALTH, SAFETY, AND COMFORT
Table 10 Common Performance Conditions
Expected EffectLevel (Typical ‘‘Values’’ On Performance
CPC Name Description They Can Take On) Reliability
Adequacy oforganization
The quality of the roles and responsibilities ofteam members, additional support,communication systems, safety managementsystem, instructions and guidelines, role ofexternal agencies, etc.
Very efficientEfficientInefficientDeficient
ImprovedNot significantReducedReduced
Workingconditions
The nature of the physical working conditions suchas ambient lighting, glare on screens, noisefrom alarms, interruptions from the task, etc.
AdvantageousCompatibleIncompatible
ImprovedNot significantReduced
Adequacy ofMMI andoperationalsupport
The man–machine Interface in general, includingthe information available on displays,workstations, and operational support providedby decision aids.
SupportiveAdequateTolerableInappropriate
ImprovedNot significantNot significantReduced
Availability ofprocedures/plans
Procedures and plans include operating andemergency procedures, familiar patterns ofresponse heuristics, routines, etc.
AppropriateAcceptableInappropriate
ImprovedNot significantReduced
Number ofsimultaneousgoals
The number of tasks a person is required topursue/attend to at the same time (i.e.,evaluating the effects of actions, sampling newinformation, assessing multiple goals).
Fewer than capacityMatching current capacityMore than capacity
Not significantNot significantReduced
Available time The time available to carry out a task; correspondsto how well the task execution is synchronizedto the process dynamics.
AdequateTemporarily inadequateContinuously inadequate
ImprovedNot significantReduced
Time of day(circadianrhythm)
The time of day/night describes the time at whichthe task is carried out, in particular whether ornot the person is adjusted to the current time(circadian rhythm).
Daytime (adjusted)Nighttime (unadjusted)
Not significantReduced
Adequacy oftraining andexperience
The level and quality of training provided tooperators as familiarization to new technology,refreshing old skills, and also the level ofoperational experience.
Adequate, high experienceAdequate, limited experienceInadequate
ImprovedNot significantReduced
Crewcollaborationquality
The quality of the collaboration between crewmembers, including the overlap between theofficial and unofficial structure, the level of trust,and the general and social climate among crewmembers.
Very efficientEfficientInefficientDeficient
ImprovedNot significantNot significantReduced
Source: Adapted from Hollnagel (1998) by permission of Elsevier.
deviations (such as “no flow” or “high temperature”) thatrepresent departures from the design intention. The keyto integrating HAZOP with HFMEA is to derive “guidewords” and “parameters” that are applicable to the TA.
The proposed methodology also incorporates twoadditional checklists: One that aids analysts in iden-tifying relevant contextual factors and a second thatprovides a detailed listing of human tendencies andlimitations. Using the first aid, the objective is to assem-ble, through some form of representation (e.g., throughan unconstrained network approach as discussed inSection 2.3), various realistic scenarios that character-ize the conditions under which the human performs theactivities identified in the TA. Using the second aid,the analytical team would then need to determine whichhuman tendencies or limitations are relevant to the con-texts under examination and how these tendencies couldresult in errors or behaviors that undermine system per-formance.
Other brainstorming methods, such as what-if anal-ysis, are suggested for analyzing dependencies, such asthe impact of human performance failures upon other(impending) human behaviors, and the effects on thesystem of multiple human failures that may or may notbe coupled. Inherent in the methodology is the consider-ation of barriers that can prevent or mitigate the adverseconsequences of the human performance failures or thatcan promote new previously unforeseen risks.
4 HUMAN RELIABILITY ANALYSIS
4.1 Probabilistic Risk Assessment
Two sets of tools that analysts often resort to for assuringthe safety of systems with hazard potential are (1) tra-ditional safety analysis techniques (CCPS, 1992) suchas FMEA (Section 3.2), which utilize primarily qual-itative methods, and (2) quantitative risk assessment
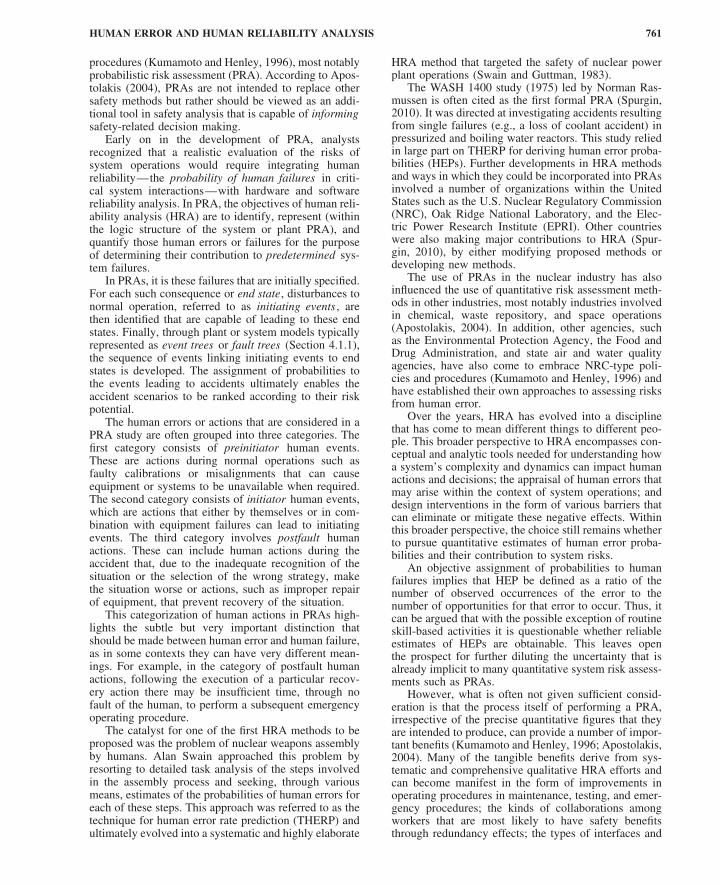
HUMAN ERROR AND HUMAN RELIABILITY ANALYSIS 761
procedures (Kumamoto and Henley, 1996), most notablyprobabilistic risk assessment (PRA). According to Apos-tolakis (2004), PRAs are not intended to replace othersafety methods but rather should be viewed as an addi-tional tool in safety analysis that is capable of informingsafety-related decision making.
Early on in the development of PRA, analystsrecognized that a realistic evaluation of the risks ofsystem operations would require integrating humanreliability—the probability of human failures in criti-cal system interactions—with hardware and softwarereliability analysis. In PRA, the objectives of human reli-ability analysis (HRA) are to identify, represent (withinthe logic structure of the system or plant PRA), andquantify those human errors or failures for the purposeof determining their contribution to predetermined sys-tem failures.
In PRAs, it is these failures that are initially specified.For each such consequence or end state, disturbances tonormal operation, referred to as initiating events , arethen identified that are capable of leading to these endstates. Finally, through plant or system models typicallyrepresented as event trees or fault trees (Section 4.1.1),the sequence of events linking initiating events to endstates is developed. The assignment of probabilities tothe events leading to accidents ultimately enables theaccident scenarios to be ranked according to their riskpotential.
The human errors or actions that are considered in aPRA study are often grouped into three categories. Thefirst category consists of preinitiator human events.These are actions during normal operations such asfaulty calibrations or misalignments that can causeequipment or systems to be unavailable when required.The second category consists of initiator human events,which are actions that either by themselves or in com-bination with equipment failures can lead to initiatingevents. The third category involves postfault humanactions. These can include human actions during theaccident that, due to the inadequate recognition of thesituation or the selection of the wrong strategy, makethe situation worse or actions, such as improper repairof equipment, that prevent recovery of the situation.
This categorization of human actions in PRAs high-lights the subtle but very important distinction thatshould be made between human error and human failure,as in some contexts they can have very different mean-ings. For example, in the category of postfault humanactions, following the execution of a particular recov-ery action there may be insufficient time, through nofault of the human, to perform a subsequent emergencyoperating procedure.
The catalyst for one of the first HRA methods to beproposed was the problem of nuclear weapons assemblyby humans. Alan Swain approached this problem byresorting to detailed task analysis of the steps involvedin the assembly process and seeking, through variousmeans, estimates of the probabilities of human errors foreach of these steps. This approach was referred to as thetechnique for human error rate prediction (THERP) andultimately evolved into a systematic and highly elaborate
HRA method that targeted the safety of nuclear powerplant operations (Swain and Guttman, 1983).
The WASH 1400 study (1975) led by Norman Ras-mussen is often cited as the first formal PRA (Spurgin,2010). It was directed at investigating accidents resultingfrom single failures (e.g., a loss of coolant accident) inpressurized and boiling water reactors. This study reliedin large part on THERP for deriving human error proba-bilities (HEPs). Further developments in HRA methodsand ways in which they could be incorporated into PRAsinvolved a number of organizations within the UnitedStates such as the U.S. Nuclear Regulatory Commission(NRC), Oak Ridge National Laboratory, and the Elec-tric Power Research Institute (EPRI). Other countrieswere also making major contributions to HRA (Spur-gin, 2010), by either modifying proposed methods ordeveloping new methods.
The use of PRAs in the nuclear industry has alsoinfluenced the use of quantitative risk assessment meth-ods in other industries, most notably industries involvedin chemical, waste repository, and space operations(Apostolakis, 2004). In addition, other agencies, suchas the Environmental Protection Agency, the Food andDrug Administration, and state air and water qualityagencies, have also come to embrace NRC-type poli-cies and procedures (Kumamoto and Henley, 1996) andhave established their own approaches to assessing risksfrom human error.
Over the years, HRA has evolved into a disciplinethat has come to mean different things to different peo-ple. This broader perspective to HRA encompasses con-ceptual and analytic tools needed for understanding howa system’s complexity and dynamics can impact humanactions and decisions; the appraisal of human errors thatmay arise within the context of system operations; anddesign interventions in the form of various barriers thatcan eliminate or mitigate these negative effects. Withinthis broader perspective, the choice still remains whetherto pursue quantitative estimates of human error proba-bilities and their contribution to system risks.
An objective assignment of probabilities to humanfailures implies that HEP be defined as a ratio of thenumber of observed occurrences of the error to thenumber of opportunities for that error to occur. Thus, itcan be argued that with the possible exception of routineskill-based activities it is questionable whether reliableestimates of HEPs are obtainable. This leaves openthe prospect for further diluting the uncertainty that isalready implicit to many quantitative system risk assess-ments such as PRAs.
However, what is often not given sufficient consid-eration is that the process itself of performing a PRA,irrespective of the precise quantitative figures that theyare intended to produce, can provide a number of impor-tant benefits (Kumamoto and Henley, 1996; Apostolakis,2004). Many of the tangible benefits derive from sys-tematic and comprehensive qualitative HRA efforts andcan become manifest in the form of improvements inoperating procedures in maintenance, testing, and emer-gency procedures; the kinds of collaborations amongworkers that are most likely to have safety benefitsthrough redundancy effects; the types of interfaces and

762 DESIGN FOR HEALTH, SAFETY, AND COMFORT
aiding devices that are most likely to improve efficiencyduring normal operations and response capabilities dur-ing emergencies; and clearer identification of areas thatwould benefit from training, especially in the human’sability to detect, diagnose, and respond to incidents.
Benefits of PRAs of a less tangible nature includeimproved plant or system knowledge among design,engineering, and operations personnel regarding over-all plant design and operations, especially in relationto the complex interactions between subsystems. PRAsalso provide a common understanding of issues, thusfacilitating communication among various stakeholdergroups. Finally, by virtue of their emphasis on quantify-ing uncertainty, PRAs can better expose the boundariesof expert knowledge concerning particular issues andthereby inform decisions regarding needed research indiverse disciplines ranging from physical phenomena tothe behavioral and social sciences.
4.1.1 Fault Trees and Event Trees
The two primary hazard analysis techniques that havebecome associated with PRAs are fault tree (FT) anal-ysis and event tree (ET) analysis. These techniques canbe applied to larger scale system events, for example, asa plant model in a PRA that might include human tasks,or to specified human tasks in order to analyze thesetasks in terms of their more elemental task components.The starting point for each of these methods is anundesirable event (e.g., an undesirable system event oran undesirable human task event), whose identificationoften relies on other hazard analysis techniques (CCPS,1992) or methods based on expert judgment.
An ET corresponds to an inductive analysis thatseeks to determine how this undesirable event canpropagate into an accident. These trees are thus capableof depicting the various sequences of events that canunfold following the initiating event as well as the risksassociated with each of these sequences. Figure 6 depictsa simplified event tree for a loss-of-coolant accident-initiating event in a typical nuclear power plant(Kumamoto and Henley, 1996). The initiating event is acoolant pipe break having a probability (or frequency ofoccurrence per time period) of PA. The event tree depictsthe alternative courses of events that might follow.First, the availability of electric power is considered,followed by the next-in-line system, which is the emer-gency core-cooling system, whose failure results in themeltdown of fuel and varying amounts of nuclear fissionproduct release depending on the containment integrity.
Figure 7 depicts an ET for an offshore emergencyshutdown scenario in a chemical processing scenario.Because it is the sequence of human actions in responseto an initiating event that is being addressed, this typeof ET is often referred to an operator action event tree(OAET). In both cases, each branch represents eithersuccess (the upper branch) or failure (represented inthe OAET as an HEP) in achieving the required actionsspecified along the top. The probability of each end stateon the right is the product of the failure/error or successprobabilities of each branch leading to that end state, andthe overall probability of any specified failure end stateis the sum of the probabilities of the corresponding indi-vidual failure end states. In the OAET, the dashed linesindicate paths through which recovery from previouserrors can occur.
A
Pipebreak
Initiatingevent
Fails
Fails
Fails
Fails
Fails
Fails
Succeeds
Succeeds
Succeeds
Succeeds
Succeeds
Succeeds
PA
PB
PC1
PD1
PE1
PE 2
PD 2
PD 2 = 1 – PD 2
Electricpower ECCS
Fissionproductremoval
Containmentintegrity
Probability State
Very smallrelease
Smallrelease
Smallrelease
Mediumrelease
Largerelease
Very largerelease
Very largerelease
B C D E
PC1 = 1 – PC1
PD1 = 1 – PD1
PE1 = 1 – PE1PAPBPC1PD1PE1
PAPBPC1PD1PE1
PAPBPC1PD2
PAPBPC1PD2
PAPB
PAPBPC1PD1PE2
PAPBPC1PD1PE2
PE2 = 1 – PE2
PB = 1 – PB
Figure 6 Simple event tree for a loss-of-coolant accident with two operator actions and two safety systems. (FromKumamoto and Henley, 1996. Copyright © 2004 by IEEE.)
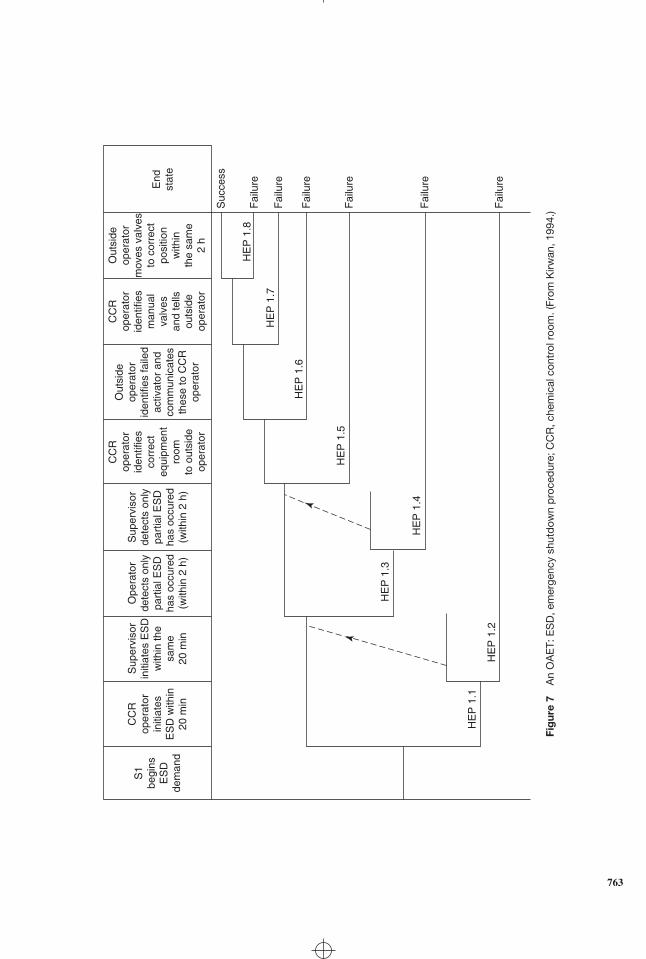
S1
begi
nsE
SD
dem
and
CC
Rop
erat
orin
itiat
esE
SD
with
in20
min
Sup
ervi
sor
initi
ates
ES
Dw
ithin
the
sam
e20
min
Ope
rato
rde
tect
s on
lypa
rtia
l ES
Dha
s oc
cure
d(w
ithin
2 h
)
Sup
ervi
sor
dete
cts
only
part
ial E
SD
has
occu
red
(with
in 2
h)
CC
Rop
erat
orid
entif
ies
corr
ect
equi
pmen
tro
omto
out
side
oper
ator
Out
side
oper
ator
iden
tifie
s fa
iled
activ
ator
and
com
mun
icat
esth
ese
to C
CR
oper
ator
CC
Rop
erat
orid
entif
ies
man
ual
valv
esan
d te
llsou
tsid
eop
erat
or
Out
side
oper
ator
mov
es v
alve
sto
cor
rect
posi
tion
with
inth
e sa
me
2 h
End
stat
e
Suc
cess
Fai
lure
HE
P 1
.8
HE
P 1
.7
HE
P 1
.6
HE
P 1
.5
HE
P 1
.3
HE
P 1
.2
HE
P 1
.1
HE
P 1
.4
Fai
lure
Fai
lure
Fai
lure
Fai
lure
Fai
lure
Fig
ure
7A
nO
AE
T:E
SD
,em
erge
ncy
shut
dow
np
roce
dur
e;C
CR
,che
mic
alco
ntro
lroo
m.(
From
Kirw
an,1
994.
)
763
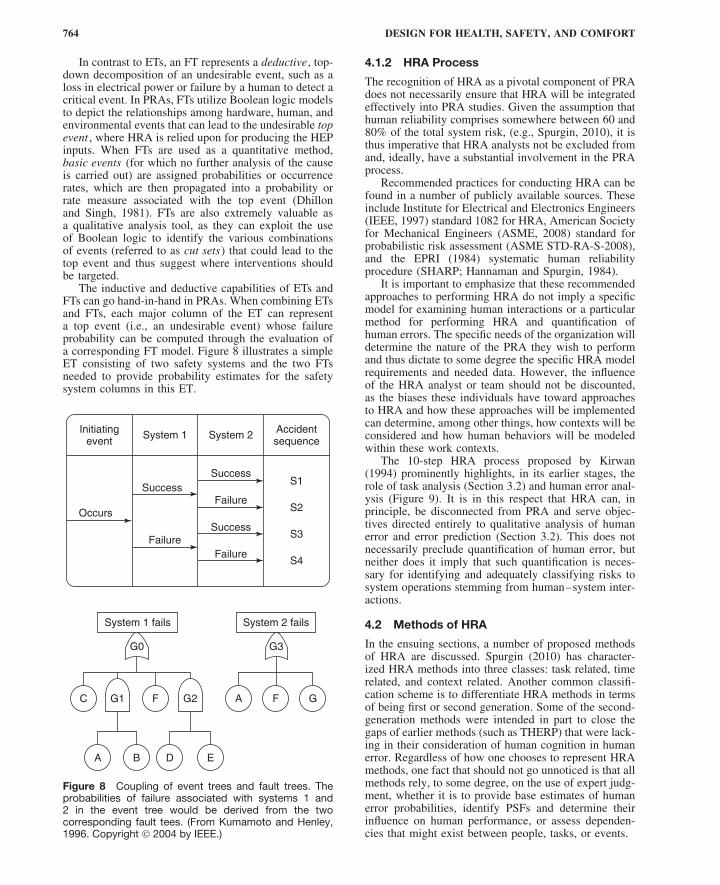
764 DESIGN FOR HEALTH, SAFETY, AND COMFORT
In contrast to ETs, an FT represents a deductive, top-down decomposition of an undesirable event, such as aloss in electrical power or failure by a human to detect acritical event. In PRAs, FTs utilize Boolean logic modelsto depict the relationships among hardware, human, andenvironmental events that can lead to the undesirable topevent , where HRA is relied upon for producing the HEPinputs. When FTs are used as a quantitative method,basic events (for which no further analysis of the causeis carried out) are assigned probabilities or occurrencerates, which are then propagated into a probability orrate measure associated with the top event (Dhillonand Singh, 1981). FTs are also extremely valuable asa qualitative analysis tool, as they can exploit the useof Boolean logic to identify the various combinationsof events (referred to as cut sets) that could lead to thetop event and thus suggest where interventions shouldbe targeted.
The inductive and deductive capabilities of ETs andFTs can go hand-in-hand in PRAs. When combining ETsand FTs, each major column of the ET can representa top event (i.e., an undesirable event) whose failureprobability can be computed through the evaluation ofa corresponding FT model. Figure 8 illustrates a simpleET consisting of two safety systems and the two FTsneeded to provide probability estimates for the safetysystem columns in this ET.
Initiatingevent
System 1 System 2 Accidentsequence
S1Success
Success
Occurs
System 1 fails System 2 fails
G0 G3
G1
A B D E
G2 A F GC F
Failure
Success
FailureFailure
S2
S3
S4
Figure 8 Coupling of event trees and fault trees. Theprobabilities of failure associated with systems 1 and2 in the event tree would be derived from the twocorresponding fault tees. (From Kumamoto and Henley,1996. Copyright © 2004 by IEEE.)
4.1.2 HRA Process
The recognition of HRA as a pivotal component of PRAdoes not necessarily ensure that HRA will be integratedeffectively into PRA studies. Given the assumption thathuman reliability comprises somewhere between 60 and80% of the total system risk, (e.g., Spurgin, 2010), it isthus imperative that HRA analysts not be excluded fromand, ideally, have a substantial involvement in the PRAprocess.
Recommended practices for conducting HRA can befound in a number of publicly available sources. Theseinclude Institute for Electrical and Electronics Engineers(IEEE, 1997) standard 1082 for HRA, American Societyfor Mechanical Engineers (ASME, 2008) standard forprobabilistic risk assessment (ASME STD-RA-S-2008),and the EPRI (1984) systematic human reliabilityprocedure (SHARP; Hannaman and Spurgin, 1984).
It is important to emphasize that these recommendedapproaches to performing HRA do not imply a specificmodel for examining human interactions or a particularmethod for performing HRA and quantification ofhuman errors. The specific needs of the organization willdetermine the nature of the PRA they wish to performand thus dictate to some degree the specific HRA modelrequirements and needed data. However, the influenceof the HRA analyst or team should not be discounted,as the biases these individuals have toward approachesto HRA and how these approaches will be implementedcan determine, among other things, how contexts will beconsidered and how human behaviors will be modeledwithin these work contexts.
The 10-step HRA process proposed by Kirwan(1994) prominently highlights, in its earlier stages, therole of task analysis (Section 3.2) and human error anal-ysis (Figure 9). It is in this respect that HRA can, inprinciple, be disconnected from PRA and serve objec-tives directed entirely to qualitative analysis of humanerror and error prediction (Section 3.2). This does notnecessarily preclude quantification of human error, butneither does it imply that such quantification is neces-sary for identifying and adequately classifying risks tosystem operations stemming from human–system inter-actions.
4.2 Methods of HRA
In the ensuing sections, a number of proposed methodsof HRA are discussed. Spurgin (2010) has character-ized HRA methods into three classes: task related, timerelated, and context related. Another common classifi-cation scheme is to differentiate HRA methods in termsof being first or second generation. Some of the second-generation methods were intended in part to close thegaps of earlier methods (such as THERP) that were lack-ing in their consideration of human cognition in humanerror. Regardless of how one chooses to represent HRAmethods, one fact that should not go unnoticed is that allmethods rely, to some degree, on the use of expert judg-ment, whether it is to provide base estimates of humanerror probabilities, identify PSFs and determine theirinfluence on human performance, or assess dependen-cies that might exist between people, tasks, or events.

HUMAN ERROR AND HUMAN RELIABILITY ANALYSIS 765
Problemdefinition
Taskanalysis
Humanerror
analysis
Representation
ScreeningInsignificant
errorsnot studied
further
Factors influencing
performanceand errorcauses or
mechanisms
Errorreduction
Improvingperformance
Erroravoidance
Isscreeningrequired
?
Quantification
Impactassessment
Humanreliability
acceptablyhigh?
Qualityassurance
Documentation
No
Yes
No
Yes
1
2
3
4
6 8
7
9
10
5
Figure 9 The HRA process. (From Kirwan, 1994.)
Below, a sample of HRA methods is considered,beginning with THERP, which is still the most widelyknown method. Their discussion will hopefully under-score not only the historical unveiling of needs that moti-vated the development of alternative HRA methods butalso the challenges that this discipline continually faces.
The coverage of these methods will be, by necessity,highly variable as there are many HRA methods thatcould potentially be considered. In no way is the degree
of detail accorded to any HRA method intended toreflect the perceived importance of the method. Also,a number of highly respected methods are not coveredat all, which, if anything, points to the challengeof doing this topic justice in a limited space. Thesemethods include a technique for human event analysis(ATHEANA; Forester et al., 2007) and Method d′Evaluation de la Realisation des Missions Operateurpour la Surete (MERMOS; Pesme et al., 2007).
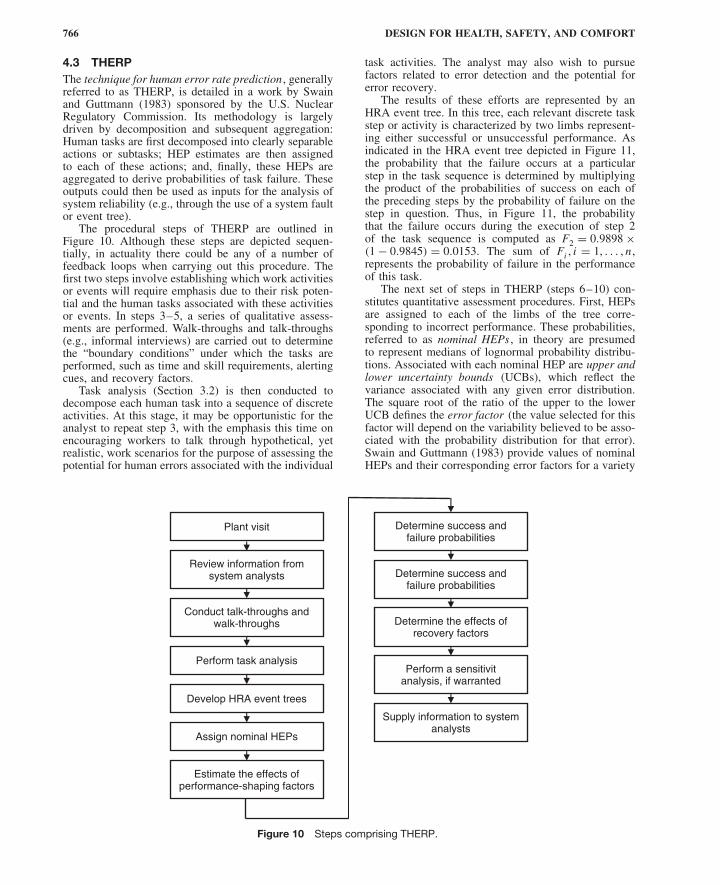
766 DESIGN FOR HEALTH, SAFETY, AND COMFORT
4.3 THERPThe technique for human error rate prediction , generallyreferred to as THERP, is detailed in a work by Swainand Guttmann (1983) sponsored by the U.S. NuclearRegulatory Commission. Its methodology is largelydriven by decomposition and subsequent aggregation:Human tasks are first decomposed into clearly separableactions or subtasks; HEP estimates are then assignedto each of these actions; and, finally, these HEPs areaggregated to derive probabilities of task failure. Theseoutputs could then be used as inputs for the analysis ofsystem reliability (e.g., through the use of a system faultor event tree).
The procedural steps of THERP are outlined inFigure 10. Although these steps are depicted sequen-tially, in actuality there could be any of a number offeedback loops when carrying out this procedure. Thefirst two steps involve establishing which work activitiesor events will require emphasis due to their risk poten-tial and the human tasks associated with these activitiesor events. In steps 3–5, a series of qualitative assess-ments are performed. Walk-throughs and talk-throughs(e.g., informal interviews) are carried out to determinethe “boundary conditions” under which the tasks areperformed, such as time and skill requirements, alertingcues, and recovery factors.
Task analysis (Section 3.2) is then conducted todecompose each human task into a sequence of discreteactivities. At this stage, it may be opportunistic for theanalyst to repeat step 3, with the emphasis this time onencouraging workers to talk through hypothetical, yetrealistic, work scenarios for the purpose of assessing thepotential for human errors associated with the individual
task activities. The analyst may also wish to pursuefactors related to error detection and the potential forerror recovery.
The results of these efforts are represented by anHRA event tree. In this tree, each relevant discrete taskstep or activity is characterized by two limbs represent-ing either successful or unsuccessful performance. Asindicated in the HRA event tree depicted in Figure 11,the probability that the failure occurs at a particularstep in the task sequence is determined by multiplyingthe product of the probabilities of success on each ofthe preceding steps by the probability of failure on thestep in question. Thus, in Figure 11, the probabilitythat the failure occurs during the execution of step 2of the task sequence is computed as F2 = 0.9898 ×(1 − 0.9845) = 0.0153. The sum of Fi , i = 1, . . . , n ,represents the probability of failure in the performanceof this task.
The next set of steps in THERP (steps 6–10) con-stitutes quantitative assessment procedures. First, HEPsare assigned to each of the limbs of the tree corre-sponding to incorrect performance. These probabilities,referred to as nominal HEPs , in theory are presumedto represent medians of lognormal probability distribu-tions. Associated with each nominal HEP are upper andlower uncertainty bounds (UCBs), which reflect thevariance associated with any given error distribution.The square root of the ratio of the upper to the lowerUCB defines the error factor (the value selected for thisfactor will depend on the variability believed to be asso-ciated with the probability distribution for that error).Swain and Guttmann (1983) provide values of nominalHEPs and their corresponding error factors for a variety
Plant visit
Review information fromsystem analysts
Conduct talk-throughs andwalk-throughs
Perform task analysis
Develop HRA event trees
Determine success andfailure probabilities
Determine the effects ofrecovery factors
Perform a sensitivitanalysis, if warranted
Supply information to systemanalysts
Determine success andfailure probabilities
Assign nominal HEPs
Estimate the effects ofperformance-shaping factors
Figure 10 Steps comprising THERP.

HUMAN ERROR AND HUMAN RELIABILITY ANALYSIS 767
Figure 11 HRA event tree corresponding to a nuclear power control room task that includes one recovery factor. (FromKumamoto and Henley, 1996. Copyright © 2004 by IEEE.)

768 DESIGN FOR HEALTH, SAFETY, AND COMFORT
of nuclear power plant tasks. Naturally, as technologiesevolve and procedures alter, the HEP values providedin such tables become less reliable.
For some tasks the nominal HEPs that are providedrefer to joint HEPs because it is the performance ofa team rather than that of an individual worker that isbeing evaluated. Generally, the absence of existing harddata from the operations of interest will require thatnominal HEPs be derived from other sources, whichinclude (1) expert judgment elicited through techniquessuch as direct numerical estimation or paired compar-isons (Swain and Guttmann, 1983; Kirwan, 1994); (2)simulators (Gertman and Blackman, 1994); and (3) datafrom jobs similar in psychological content to theoperations of interest.
To account for more specific individual, environmen-tal, and task-related influences on performance, nominalHEPs are subjected to a series of refinements. First,nominal HEPs are modified based on the influence ofPSFs, resulting in basic HEPs (BHEPs). In some cases,guidelines are provided in tables indicating the directionand extent of influence of particular PSFs on nominalHEPs. For example, adjustments that are to be made innominal HEPs due to the influence of the PSF of stressare provided as a function of the characteristics of thetask and the degree of worker experience.
Next, a nonlinear dependency model is incorpo-rated which considers positive dependencies that existbetween adjacent limbs of the tree, resulting in condi-tional HEPs (CHEPs). In a positive dependency model,failure on a subtask increases the probability of failureon the following subtask, and successful performance ofa subtask decreases the probability of failure in perform-ing the subsequent task element. Instances of negativedependence can be accounted for but require the discre-tion of the analyst. In the case of positive dependence,THERP provides equations for modifying BHEPs toCHEPs based on the extent to which the analyst believesdependencies exist. Five levels of dependency are con-sidered in THERP: zero dependence, low dependence,medium dependence, high dependence, and completedependence.
For example, assume the BHEP for task step B is10−2 and a high dependence exists between task stepsA and B. The CHEP of B given failure on step A wouldbe given by the following equation for high depen-dence: CHEP = (1 + BHEP)/2 ∼ 0.50. Correspondingequations are given for computing CHEP under low-and medium-dependency conditions. For zero depen-dence the CHEP reduces to the BHEP (10−2 in theexample involving step B) and for complete dependencethe CHEP would be 1 (failure on the prior task stepassures failure on the subsequent step).
At this point, success and failure probabilities arecomputed for the entire task. Various approaches tothese computations can be taken. The most straight-forward approach is to multiply the individual CHEPsassociated with each path on the tree leading to failure,sum these individual failure probabilities to arrive at theprobability of failure for the total task, and then assignUCBs to this probability. More complex approachesto these computations take into account the variability
associated with the combinations of events comprisingthe probability tree (Swain and Guttmann, 1983).
The final steps of THERP consider the ways inwhich errors can be recovered and the kinds of designinterventions that can have the greatest impact on tasksuccess probability. Common recovery factors includethe presence of annunciators that can alert the operatorto the occurrence of an error, co-workers potentiallycapable of catching or discovering (in time) a fellowworker’s errors, and various types of scheduled walk-through inspections. As with conventional ETs, theserecovery paths can easily be represented in HRAevent trees (Figure 11). In the case of annunciators orinspectors, the relevant failure limb is extended into twoadditional limbs: one failure limb and one success limb.The probability that the human responds successfully tothe annunciator or that the inspector spots the operator’serror is then fed back into the success path of the originaltree. In the case of recovery by fellow team members,BHEPs are modified to CHEPs by considering thedegree of dependency between the operator and one ormore fellow workers who are in a position to notice theerror. The effects of recovery factors can be determinedby repeating the computations for total task failure.
The analyst can also choose to perform sensitivityanalysis . One approach to sensitivity analysis is to iden-tify the most probable errors on the tree, propose designmodifications corresponding to those task elements, esti-mate the degree to which the corresponding HEPs wouldbecome reduced by virtue of these modifications, andevaluate the effect of these design interventions on thecomputation of the total task failure probability. Thefinal step in THERP is to incorporate the results ofthe HRA into system risk assessments such as PRAs.
4.4 HEART and NARA
The human error assessment and reduction technique(HEART) proposed by Williams (1988) was an HRAmethod that was directed at assessing tasks of a moreholistic nature based on the assumption that humanreliability is dependent upon the generic nature of thetask to be performed. Thus the method was relativelyeasy to apply as, in comparison to THERP, it wasnot constrained to quantify large numbers of elementalsubtasks.
In its emphasis on more holistically appraising thereliability of human task performance, HEART definesa limited set of “generic” tasks (GTs) describing nuclearpower plant (NPP) activities from which the analystcan select from. Nominal HEPs (50th percentile) alongwith lower (5th percentile) and upper (90th percentile)bounds to these estimates are assigned to each of thesetasks. For example, one of the generic tasks consideredby HEART, together with its corresponding nominalHEP and associated lower and upper bounds is: “Shiftor restore systems to a new or original state on asingle attempt with supervision or procedures” (0.26;0.14–0.42).
Although HEART, as in THERP, uses PSFs, referredto as error-producing conditions (EPCs), to modifyHEPs, it applies a different approach to this process. In
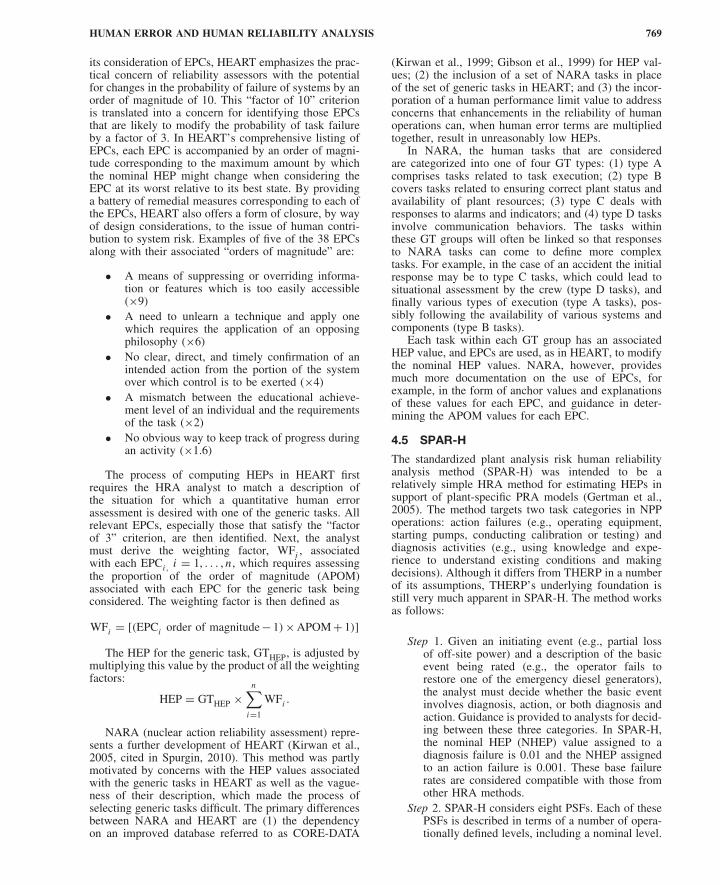
HUMAN ERROR AND HUMAN RELIABILITY ANALYSIS 769
its consideration of EPCs, HEART emphasizes the prac-tical concern of reliability assessors with the potentialfor changes in the probability of failure of systems by anorder of magnitude of 10. This “factor of 10” criterionis translated into a concern for identifying those EPCsthat are likely to modify the probability of task failureby a factor of 3. In HEART’s comprehensive listing ofEPCs, each EPC is accompanied by an order of magni-tude corresponding to the maximum amount by whichthe nominal HEP might change when considering theEPC at its worst relative to its best state. By providinga battery of remedial measures corresponding to each ofthe EPCs, HEART also offers a form of closure, by wayof design considerations, to the issue of human contri-bution to system risk. Examples of five of the 38 EPCsalong with their associated “orders of magnitude” are:
• A means of suppressing or overriding informa-tion or features which is too easily accessible(×9)
• A need to unlearn a technique and apply onewhich requires the application of an opposingphilosophy (×6)
• No clear, direct, and timely confirmation of anintended action from the portion of the systemover which control is to be exerted (×4)
• A mismatch between the educational achieve-ment level of an individual and the requirementsof the task (×2)
• No obvious way to keep track of progress duringan activity (×1.6)
The process of computing HEPs in HEART firstrequires the HRA analyst to match a description ofthe situation for which a quantitative human errorassessment is desired with one of the generic tasks. Allrelevant EPCs, especially those that satisfy the “factorof 3” criterion, are then identified. Next, the analystmust derive the weighting factor, WFi , associatedwith each EPCi , i = 1, . . . , n , which requires assessingthe proportion of the order of magnitude (APOM)associated with each EPC for the generic task beingconsidered. The weighting factor is then defined as
WFi = [(EPCi order of magnitude − 1) × APOM + 1)]
The HEP for the generic task, GTHEP, is adjusted bymultiplying this value by the product of all the weightingfactors:
HEP = GTHEP ×n∑
i=1
WFi .
NARA (nuclear action reliability assessment) repre-sents a further development of HEART (Kirwan et al.,2005, cited in Spurgin, 2010). This method was partlymotivated by concerns with the HEP values associatedwith the generic tasks in HEART as well as the vague-ness of their description, which made the process ofselecting generic tasks difficult. The primary differencesbetween NARA and HEART are (1) the dependencyon an improved database referred to as CORE-DATA
(Kirwan et al., 1999; Gibson et al., 1999) for HEP val-ues; (2) the inclusion of a set of NARA tasks in placeof the set of generic tasks in HEART; and (3) the incor-poration of a human performance limit value to addressconcerns that enhancements in the reliability of humanoperations can, when human error terms are multipliedtogether, result in unreasonably low HEPs.
In NARA, the human tasks that are consideredare categorized into one of four GT types: (1) type Acomprises tasks related to task execution; (2) type Bcovers tasks related to ensuring correct plant status andavailability of plant resources; (3) type C deals withresponses to alarms and indicators; and (4) type D tasksinvolve communication behaviors. The tasks withinthese GT groups will often be linked so that responsesto NARA tasks can come to define more complextasks. For example, in the case of an accident the initialresponse may be to type C tasks, which could lead tosituational assessment by the crew (type D tasks), andfinally various types of execution (type A tasks), pos-sibly following the availability of various systems andcomponents (type B tasks).
Each task within each GT group has an associatedHEP value, and EPCs are used, as in HEART, to modifythe nominal HEP values. NARA, however, providesmuch more documentation on the use of EPCs, forexample, in the form of anchor values and explanationsof these values for each EPC, and guidance in deter-mining the APOM values for each EPC.
4.5 SPAR-H
The standardized plant analysis risk human reliabilityanalysis method (SPAR-H) was intended to be arelatively simple HRA method for estimating HEPs insupport of plant-specific PRA models (Gertman et al.,2005). The method targets two task categories in NPPoperations: action failures (e.g., operating equipment,starting pumps, conducting calibration or testing) anddiagnosis activities (e.g., using knowledge and expe-rience to understand existing conditions and makingdecisions). Although it differs from THERP in a numberof its assumptions, THERP’s underlying foundation isstill very much apparent in SPAR-H. The method worksas follows:
Step 1. Given an initiating event (e.g., partial lossof off-site power) and a description of the basicevent being rated (e.g., the operator fails torestore one of the emergency diesel generators),the analyst must decide whether the basic eventinvolves diagnosis, action, or both diagnosis andaction. Guidance is provided to analysts for decid-ing between these three categories. In SPAR-H,the nominal HEP (NHEP) value assigned to adiagnosis failure is 0.01 and the NHEP assignedto an action failure is 0.001. These base failurerates are considered compatible with those fromother HRA methods.
Step 2. SPAR-H considers eight PSFs. Each of thesePSFs is described in terms of a number of opera-tionally defined levels, including a nominal level.

770 DESIGN FOR HEALTH, SAFETY, AND COMFORT
Associated with each of these levels is a corre-sponding multiplier that determines the extent ofthe negative or positive effect the PSF has onthe HEP. For some of the PSFs, the definitionsof the levels depend on whether an action or adiagnosis is being considered. The eight PSFs areavailable time; stress/stressors; complexity; expe-rience/training; procedures; ergonomics/human-machine interface; fitness for duty; and workprocesses. Some of these PSFs in and of them-selves encompass a broad array of factors. Forexample, the PSF “complexity,” which refers tohow difficult the task is to perform in the givencontext, considers both task and environment-related factors. Task factors include requirementsfor a large number of actions, a large amountof communication, high degree of memoriza-tion, transitioning between multiple procedures,and mental calculations. The environment-relatedfactors include the presence of multiple faults,misleading indicators, a large number of distrac-tions, symptoms of one fault masking those ofanother, and ill-defined system interdependencies.It is important to note that in some schemes thesecould represent separate PSFs.
To illustrate how levels are operationally de-fined for a PSF, the four levels associated withthe “procedures” PSF for an action task are:• Not available: The procedure needed for the
task in the event is not available.• Task instructions, sections, or other needed
information are not contained in the proce-dure.
• Available, but poor: A procedure is availablebut it contains wrong, inadequate, ambiguous,or other poor information.
• Nominal: Procedures are available andenhance performance.
In addition, all PSFs have an insufficient in-formation level, which the analyst selects if thereis insufficient information to enable a choice fromamong the other alternatives. The assignment oflevels denotes ratings of PSFs that translate intomultipliers that increase the nominal HEP (i.e.,negative ratings) or decrease the nominal HEP(i.e., positive ratings). The idea that a PSF couldreduce the nominal HEP is a departure fromHRA methods such as THERP, but some otherHRA methods also allow for this possibility (e.g.,CREAM, Section 4.9).
Step 3. Although the eight PSFs are clearly non-orthogonal, with complex relationships assumedto exist between several of the PSFs, SPAR-Htreats these influencing factors as if they weremutually independent. Consequently, to helpprevent the analyst from “double counting” whenassigning values to the PSFs for the purpose ofmodifying the nominal task HEP, SPAR-H pro-vides a 64-cell table that contains the presumeddegree of correlation among the PSFs based onqualitative rankings of low, medium, or high.
To obtain a composite PSF value, the rat-ings of the eight PSFs are multiplied by oneanother, regardless of whether the PSF influenceis positive or negative. The HEP is then com-puted as the product of the composite PSF(PSFcomposite) and the NHEP. Because of theindependence assumption and the values (>1)that negative PSF ratings can assume, whenthree or more PSFs are assigned negative rank-ings, there is a relatively high probability thatthe resultant HEP would exceed 1.0. In mostHRAs, the HEP is simply rounded down to1.0. To decrease the possibility for HEP valuesexceeding 1.0, SPAR-H uses the following for-mula for adjusting the nominal HEP in order tocompute the HEP, where NHEP equals 0.01 fordiagnosis tasks and 0.001 for action tasks:
HEP =NHEP × PSFcomposite
NHEP × (PSFcomposite − 1
) + 1
As an example, assume a diagnosis activity (ata nuclear power plant) is required and a reviewof the operating event revealed that the followingPSF parameters were found to have influencedthe crew’s diagnosis of “loss of inventory”:Procedures were misleading; displays were notupdated in accordance with requirements; andthe event was complex due to the existence ofmultiple simultaneous faults in other parts of theplant. Assuming these were the only influencescontributing to the event, the assignment of thePSF levels and associated multipliers would be:
PSF Status Multiplier
Procedures Misleading ×10Ergonomics Poor ×20Complexity Moderately complex ×2
The PSF composite score would be 10 ×20 × 2 = 400. Without an adjustment on theNHEP, the HEP would be computed as NHEP ×PSFcomposite = HEP = 4.0. Use of the adjustmentfactor produces
HEP = 0.01 × 400
0.01 × (400 − 1) + 1= 0.81
The adjustment factor can also be appliedwhen a number of positive influences of PSFsare present. In this case, the multiplication factorsassociated with the “positive” levels of the PSFswould be less than 1.0. However, the SPAR-HPSFs are negatively skewed, so that they have arelatively larger range of influence for negativeas compared to positive influences.
Step 4. In cases where a series of activities are per-formed, it is possible that failure on one activity(A) can influence the probability of error on thesubsequent activity (B). In THERP, a depen-dency model consisting of five levels of depen-dency ranging from no dependency to completedependency is used to account for such situations

HUMAN ERROR AND HUMAN RELIABILITY ANALYSIS 771
(Section 4.3). SPAR-H also uses these depen-dency levels. In addition, SPAR-H makes use ofa number of factors that can promote dependencybetween errors in activities performed in series(such as whether the crew is the same or differentor whether the current task is being performedclose in time to the prior task) to construct adependency matrix. This matrix yields 16 depen-dency rules that map, correspondingly, to the fourlevels where some degree of dependency exists;a 17th rule is used to account for the case of nodependency. The modifications to nominal HEPsresulting from these levels of dependency followthe same procedure as in THERP.
Step 5. SPAR-H deals with the concept of uncertaintyregarding the HEP estimate, which is the basisfor producing lower and upper bounds on theerror, very differently than THERP. WhereasTHERP assumes HEPs derive from a lognormalprobability distribution and uses error factors toderive the lower (5th percentile) and upper (95thpercentile) bounds on the error estimate basedon this distribution, SPAR-H does not assume alognormal distribution of HEPs nor does it useerror factors.
Instead, SPAR-H uses a “constrained nonin-formative prior” (CNI) distribution, where theconstraint is that the prior distribution (i.e.,“starting-point” distribution) has a user-specifiedmean (which is the product of the compositePSFs and the nominal HEP). The reasons forusing this distribution are (1) it takes the formof a beta distribution for probability-type events,which is a distribution that has the flexibility tomimic normal, lognormal, and other types of dis-tributions; (2) unlike THERP, it does not requireuncertainty parameter information such as a stan-dard deviation; and (3) it can produce small val-ues at the lower end of the HEP distribution(e.g., <1 × 10⁻⁶) but will more properly repre-sent expected error probability at the upper end.
Once the mean HEP is known (i.e., the productof the composite PSFs and the nominal HEP), thestarting-point CNI distribution can be transformedto an approximate distribution that is based onthe beta distribution. This requires deriving twoparameters: α and β. Tables can be used to obtainvalues of α for a given value of the mean (whichis the HEP), and then this value of α togetherwith the mean can be used to compute β usingthe formula α(1 − HEP)/HEP. Once values of αand β are known, various mathematical analysispackages can be used to compute the 5th, 95th,or any percentile desired for the HEP.
Step 6. To ensure analyst consistency in using thismethod, SPAR-H provides designated worksheetsto guide the analyst through the entire processrequired to generate the HEP.
4.6 Time-Related HRA ModelsHRA models based on time–reliability curves, some-times referred to as time–reliability correlations (TRCs),
are concerned with the time it takes for a crew to respondto an emergency or accident. The most well-known TRCwas the human cognitive reliability (HCR) model (Han-naman et al., 1984) that was sponsored by EPRI basedon data obtained from prior simulator studies.
Let P (t) denote the nonresponse probability by acrew to a problem within a given time window t , wheret is estimated based on analysis of the event sequencefollowing the stimulus. According to the HCR model,this probability can be estimated using a three-parameterWeibull distribution function, a type of distributionapplied in equipment reliability models, of the form
Pt = e
[−
{(t/T1/2) − B
A
}C]
where T 1/2 is the estimated median time to complete theaction(s) and A, B , and C are coefficients associatedor “correlated” with the level of cognitive processingrequired by the crew. Specifically, their values, follow-ing Rasmussen’s SRK model (Section 2.2.4), depend onwhether task performance is occurring at the skill-, rule-,or knowledge-based level.
The variable t /T 1/2 represents “normalized time,”which controls for contributions to crew response timesthat are unrelated to human activities (Figure 12).Obtaining this normalized time requires defining a“nominal” median response time, T n
1/2, which is thetime corresponding to a probability of 0.5 that thecrew successfully carries out the required task(s) undernominal conditions. Nominal median response times aretypically derived from simulator data and talk-throughswith operating crews. The actual (estimated) medianresponse time T 1/2 is computed from the nominalmedian response time T n
1/2 by
T1/2 = (1 + K1)(1 + K2)(1 + K3)Tn1/2
where K 1, K 2, and K 3 are coefficients whose valuesdepend on PSFs. The HCR model thus assumes thatPSFs impact the median response time rather than affectthe type of cognitive processing, so that the relationshipsbetween the three types of curves remain preserved. Thederivation of the estimated median response time fromthe nominal median response time is illustrated in thefollowing example taken from Kumamoto and Henley(1996, p. 492).
Consider the task of detecting that a failure of anautomatic plant shutdown system has occurred. Thenominal median response time is 10 s. Assume aver-age operator experience (K1 = 0.00) under potentialemergency conditions (K2 = 0.28) with a good oper-ator/plant interface in place (K3 = 0.00). The actualmedian response time is then estimated to be
T1/2 = (1 + 0.00)(1 + 0.28)(1 + 0.00)(10) = 12.8 s
Continuing with this example, assume that the initi-ating event was loss of feedwater to the heat exchangerthat cools a reactor and, due to the failure of the auto-matic plant shutdown system, manual plant shutdownby the crew is called for. Suppose the crew must

772 DESIGN FOR HEALTH, SAFETY, AND COMFORT
Figure 12 HCR model curves. (From Kumamoto and Henley, 1996. Copyright © 2004 by IEEE.)
complete the plant shutdown within 79 s from the startof the initiating event. This time window encompassesnot only the time to detect the event, for which the nom-inal median response time was 10 s, but also diagnosisof and response to the event.
For this example, assume the nature of the instrumen-tation enables easy diagnosis by control room person-nel of the loss-of-feedwater accident and the automaticshutdown system failure, resulting in a nominal mediandiagnosis time of 15 s. Also, assume errors due to slips(e.g., unintentional activation of an incorrect control)for this procedure are judged to be negligible giventhe operator–system interface design, so that the nomi-nal median response time can be considered to be 0 s.The total nominal median response time for the shut-down procedure would then be 10 s + 15 s = 25 s and,using the K values above, would result in an actualmedian response time T1/2 = 1.28 × 25 s = 32 s. Withthe level of performance assumed to be at the skill-basedlevel, the corresponding parameter values in the HCRmodel are A = 0.407, B = 0.7, and C = 1.2, resultingin a probability that the crew successfully responds tothis initiating event within the 79-s window of
P [t ≤ 79] = e
[−
((79/32) − 0.7
0.407
)1.2]
= 0.0029
With K2 = 0 (i.e., an optimal stress level), thenonresponse probability would be reduced to 0.00017per demand for manual shutdown.
The HCR model can also be used to obtain estimatesof human or crew failures for more complex operations.Continuing with the example above, the analyst mayassume successful plant shutdown occurs but may nowbe interested in assessing the risks associated with acci-dent recovery, which requires removing heat from thereactor before damage to the reactor is incurred. Sup-pose there are two options (see below) for coping withthe loss of feedwater accident and three different strate-gies for combining these two options (Kumamoto andHenley, 1996). The different strategies may not onlyhave different time windows but may also involve dif-ferent levels of cognitive processing as well as distinc-tive auxiliary human operations. These operations wouldhave associated error probabilities whose values wouldneed to be combined with the results from the HCRmodel to provide total probabilities of failure for anygiven strategy.
For example, one strategy, the “anticipatory” strat-egy, assumes that the crew has concluded that recov-ery of feedwater through the secondary heat removalsystem (option 1) is not feasible and decide to estab-lish “feed-and-bleed” (option 2), which involves man-ually opening pressure-operated relief valves (PORVs)and activation of high-pressure injection (HPI) pumpsto exhaust heat to the reactor containment housing.There is a 60-min time window available for estab-lishing the feed-and-bleed operation before damage tothe core occurs. Because this operation requires 1 min,the effective time window is reduced to 59 min. If one
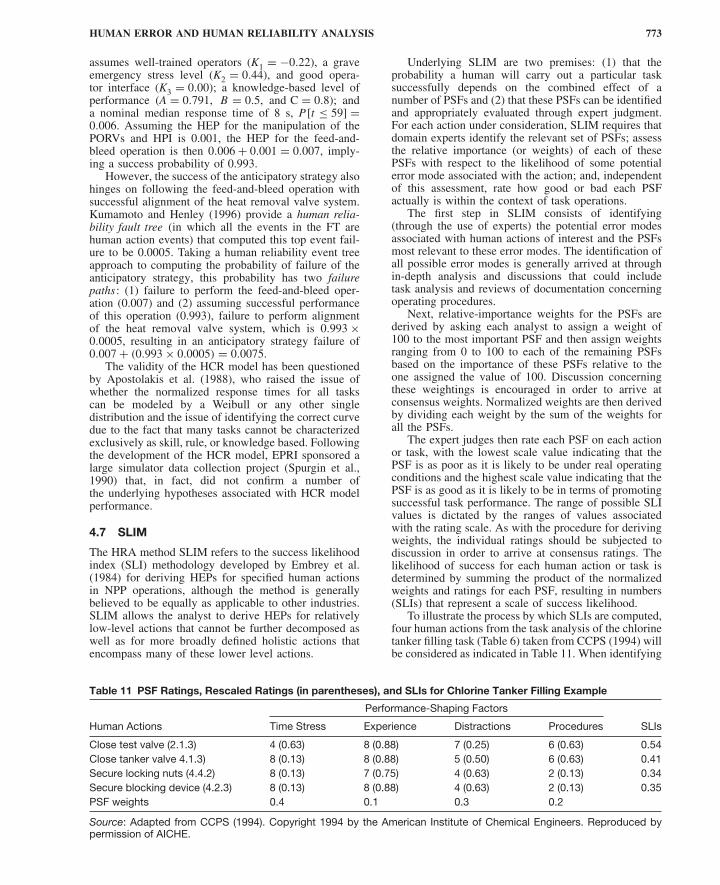
HUMAN ERROR AND HUMAN RELIABILITY ANALYSIS 773
assumes well-trained operators (K1 = −0.22), a graveemergency stress level (K2 = 0.44), and good opera-tor interface (K3 = 0.00); a knowledge-based level ofperformance (A = 0.791, B = 0.5, and C = 0.8); anda nominal median response time of 8 s, P [t ≤ 59] =0.006. Assuming the HEP for the manipulation of thePORVs and HPI is 0.001, the HEP for the feed-and-bleed operation is then 0.006 + 0.001 = 0.007, imply-ing a success probability of 0.993.
However, the success of the anticipatory strategy alsohinges on following the feed-and-bleed operation withsuccessful alignment of the heat removal valve system.Kumamoto and Henley (1996) provide a human relia-bility fault tree (in which all the events in the FT arehuman action events) that computed this top event fail-ure to be 0.0005. Taking a human reliability event treeapproach to computing the probability of failure of theanticipatory strategy, this probability has two failurepaths: (1) failure to perform the feed-and-bleed oper-ation (0.007) and (2) assuming successful performanceof this operation (0.993), failure to perform alignmentof the heat removal valve system, which is 0.993 ×0.0005, resulting in an anticipatory strategy failure of0.007 + (0.993 × 0.0005) = 0.0075.
The validity of the HCR model has been questionedby Apostolakis et al. (1988), who raised the issue ofwhether the normalized response times for all taskscan be modeled by a Weibull or any other singledistribution and the issue of identifying the correct curvedue to the fact that many tasks cannot be characterizedexclusively as skill, rule, or knowledge based. Followingthe development of the HCR model, EPRI sponsored alarge simulator data collection project (Spurgin et al.,1990) that, in fact, did not confirm a number ofthe underlying hypotheses associated with HCR modelperformance.
4.7 SLIM
The HRA method SLIM refers to the success likelihoodindex (SLI) methodology developed by Embrey et al.(1984) for deriving HEPs for specified human actionsin NPP operations, although the method is generallybelieved to be equally as applicable to other industries.SLIM allows the analyst to derive HEPs for relativelylow-level actions that cannot be further decomposed aswell as for more broadly defined holistic actions thatencompass many of these lower level actions.
Underlying SLIM are two premises: (1) that theprobability a human will carry out a particular tasksuccessfully depends on the combined effect of anumber of PSFs and (2) that these PSFs can be identifiedand appropriately evaluated through expert judgment.For each action under consideration, SLIM requires thatdomain experts identify the relevant set of PSFs; assessthe relative importance (or weights) of each of thesePSFs with respect to the likelihood of some potentialerror mode associated with the action; and, independentof this assessment, rate how good or bad each PSFactually is within the context of task operations.
The first step in SLIM consists of identifying(through the use of experts) the potential error modesassociated with human actions of interest and the PSFsmost relevant to these error modes. The identification ofall possible error modes is generally arrived at throughin-depth analysis and discussions that could includetask analysis and reviews of documentation concerningoperating procedures.
Next, relative-importance weights for the PSFs arederived by asking each analyst to assign a weight of100 to the most important PSF and then assign weightsranging from 0 to 100 to each of the remaining PSFsbased on the importance of these PSFs relative to theone assigned the value of 100. Discussion concerningthese weightings is encouraged in order to arrive atconsensus weights. Normalized weights are then derivedby dividing each weight by the sum of the weights forall the PSFs.
The expert judges then rate each PSF on each actionor task, with the lowest scale value indicating that thePSF is as poor as it is likely to be under real operatingconditions and the highest scale value indicating that thePSF is as good as it is likely to be in terms of promotingsuccessful task performance. The range of possible SLIvalues is dictated by the ranges of values associatedwith the rating scale. As with the procedure for derivingweights, the individual ratings should be subjected todiscussion in order to arrive at consensus ratings. Thelikelihood of success for each human action or task isdetermined by summing the product of the normalizedweights and ratings for each PSF, resulting in numbers(SLIs) that represent a scale of success likelihood.
To illustrate the process by which SLIs are computed,four human actions from the task analysis of the chlorinetanker filling task (Table 6) taken from CCPS (1994) willbe considered as indicated in Table 11. When identifying
Table 11 PSF Ratings, Rescaled Ratings (in parentheses), and SLIs for Chlorine Tanker Filling Example
Performance-Shaping Factors
Human Actions Time Stress Experience Distractions Procedures SLIs
Close test valve (2.1.3) 4 (0.63) 8 (0.88) 7 (0.25) 6 (0.63) 0.54Close tanker valve 4.1.3) 8 (0.13) 8 (0.88) 5 (0.50) 6 (0.63) 0.41Secure locking nuts (4.4.2) 8 (0.13) 7 (0.75) 4 (0.63) 2 (0.13) 0.34Secure blocking device (4.2.3) 8 (0.13) 8 (0.88) 4 (0.63) 2 (0.13) 0.35PSF weights 0.4 0.1 0.3 0.2
Source: Adapted from CCPS (1994). Copyright 1994 by the American Institute of Chemical Engineers. Reproduced bypermission of AICHE.

774 DESIGN FOR HEALTH, SAFETY, AND COMFORT
tasks or actions that will be subjected to analysis bySLIM, it is constructive to group activities that are likelyto be influenced by the same PSFs, which is considereda legitimate assumption for this set of tasks.
In this example, the main PSFs which determine thelikelihood of error are assumed to be time stress, level ofoperator experience, level of distractions, and quality ofprocedures. The consensus normalized weights arrivedat for these four PSFs are 0.4, 0.1, 0.3, and 0.2, implyingthat for these tasks time stress is most influential andexperience level has the least influence on errors.
Each task is then rated on each PSF. A numericalscale from 1 to 9 will be used, where 1 and 9 representeither best or worst conditions. For the PSFs timestress and distractions, ratings of 9 would represent highlevels of stress and distractions and imply an increasedlikelihood of errors; ratings of 1 would be ideal forthese PSFs. In contrast, high ratings for experience andprocedures would imply decreased likelihood errors; inthe case of these two PSFs, ratings of 1 would representworst-case conditions. The ratings assigned to each ofthe four activities are given in Table 11.
To calculate the SLIs, the data in Table 11 arerescaled to take into account the fact that the ideal point(IP) is at different ends of the rating scale for someof the PSFs (either 1 or 9). Rescaling will also serveto convert the range of ratings from 1–9 to 0–1. Theformula used to convert the original ratings to rescaledratings is
1 − ABS (R − IP)
8
where ABS represents the absolute value operator, R =original rating, and IP is the ideal value for the PSFbeing considered. When the rating is either 1 or 9,this formula converts the original rating to 0.0 or1.0, as appropriate. The rescaled ratings are shownin parentheses next to the original ratings. Finally, anadditive model is assumed whereby the SLI for eachtask j in Table 11 is calculated using the expression
SLIj =4∑
i=1
4∑j=1
Rij PSFwi
where PSFwj is the weight assigned to the i th PSF andRij is the rescaled rating of the j th task on the i th PSF.
The SLIs represent a measure of the likelihood thatthe task operations will succeed or fail relative to oneanother and are useful in their own right. For example,if the actions under consideration represent alternativemodes of response in an emergency scenario, theanalyst may be interested in determining which types ofresponses are least or most likely to succeed. However,for the purpose of conducting PRAs, SLIM convertsthe SLIs to HEPs.
Converting the SLI scale to an HEP scale requiressome form of calibration process. In practice, if a largenumber of tasks in the set being evaluated have knownprobabilities of error, for example, from internal orindustrywide incident data, then the regression equationresulting from the best fitting regression line betweenthe SLI values and their corresponding HEPs can be
used to compute HEPs for other operations in the groupfor which HEPs are not available. Typically, data setsthat enable an empirical relationship between SLIs andHEPs to be computed are not available, requiring theassumption of some form of mathematical relationship.One such assumption is the following loglinear relation-ship (where logs to base 10 are used) between HEPsand SLIs:
log [HEP] = a × SLI + b
where a and b are constants. This assumption is partlybased on experimental evidence that has indicated aloglinear relationship between factors affecting perfor-mance on maintenance tasks and actual performance onthose tasks (CCPS, 1994).
To compute the constants in this equation, at leasttwo tasks with known SLIs and HEPs must be availablein the set of tasks being evaluated. Continuing with thechlorine tanker filling example, assume evidence wasavailable for arriving at the following HEP estimatesfor two of the four tasks being evaluated:
• Probability of test valve being left open: 1 ×10⁻⁴
• Probability of locking nuts not being secured:1 × 10⁻²
The substitution of these HEP values and theircorresponding SLIs into the loglinear equation producesthe calibration equation
log [HEP] = −2.303 × SLI + 3.166
from which the HEPs for the remaining two tasks in theset can be derived:
• Probability of not closing tanker valve: 1.8 ×10⁻³
• Probability of not securing blocking device:7.5 × 10⁻³
As in THERP, the impact of design interventions canbe examined through sensitivity analysis. However, inSLIM, the sensitivity analyses that are performed arebased on evaluating the effects of the interventions onPSFs, which result in new SLIs and ultimately newHEPs that can be compared to previous values. In thisway, what-if analyses can be used to explore potentialdesign modifications for the purpose of determiningwhich resource allocation strategies provide the greatestreductions in risk potential.
In the absence of HEP data, the calibration valueswould have to be generated by expert judgment. Inthese cases, for each task, each expert can be askedto make absolute judgments of the probability of failureassociated with two boundary conditions correspondingto situations where the PSFs are as good and as bad asthey could credibly be under real operating conditions.These judgments are facilitated through the use of alogarithmic probability scale and are assigned values of100 and 0, respectively. The SLI computed for a giventask is then used to interpolate between these lower
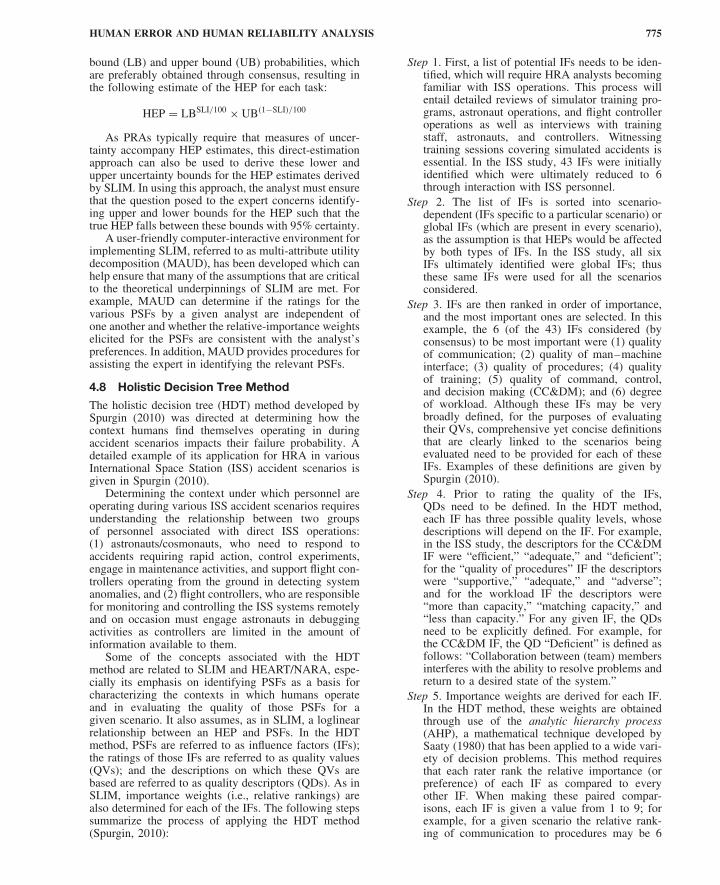
HUMAN ERROR AND HUMAN RELIABILITY ANALYSIS 775
bound (LB) and upper bound (UB) probabilities, whichare preferably obtained through consensus, resulting inthe following estimate of the HEP for each task:
HEP = LBSLI/100 × UB(1−SLI)/100
As PRAs typically require that measures of uncer-tainty accompany HEP estimates, this direct-estimationapproach can also be used to derive these lower andupper uncertainty bounds for the HEP estimates derivedby SLIM. In using this approach, the analyst must ensurethat the question posed to the expert concerns identify-ing upper and lower bounds for the HEP such that thetrue HEP falls between these bounds with 95% certainty.
A user-friendly computer-interactive environment forimplementing SLIM, referred to as multi-attribute utilitydecomposition (MAUD), has been developed which canhelp ensure that many of the assumptions that are criticalto the theoretical underpinnings of SLIM are met. Forexample, MAUD can determine if the ratings for thevarious PSFs by a given analyst are independent ofone another and whether the relative-importance weightselicited for the PSFs are consistent with the analyst’spreferences. In addition, MAUD provides procedures forassisting the expert in identifying the relevant PSFs.
4.8 Holistic Decision Tree Method
The holistic decision tree (HDT) method developed bySpurgin (2010) was directed at determining how thecontext humans find themselves operating in duringaccident scenarios impacts their failure probability. Adetailed example of its application for HRA in variousInternational Space Station (ISS) accident scenarios isgiven in Spurgin (2010).
Determining the context under which personnel areoperating during various ISS accident scenarios requiresunderstanding the relationship between two groupsof personnel associated with direct ISS operations:(1) astronauts/cosmonauts, who need to respond toaccidents requiring rapid action, control experiments,engage in maintenance activities, and support flight con-trollers operating from the ground in detecting systemanomalies, and (2) flight controllers, who are responsiblefor monitoring and controlling the ISS systems remotelyand on occasion must engage astronauts in debuggingactivities as controllers are limited in the amount ofinformation available to them.
Some of the concepts associated with the HDTmethod are related to SLIM and HEART/NARA, espe-cially its emphasis on identifying PSFs as a basis forcharacterizing the contexts in which humans operateand in evaluating the quality of those PSFs for agiven scenario. It also assumes, as in SLIM, a loglinearrelationship between an HEP and PSFs. In the HDTmethod, PSFs are referred to as influence factors (IFs);the ratings of those IFs are referred to as quality values(QVs); and the descriptions on which these QVs arebased are referred to as quality descriptors (QDs). As inSLIM, importance weights (i.e., relative rankings) arealso determined for each of the IFs. The following stepssummarize the process of applying the HDT method(Spurgin, 2010):
Step 1. First, a list of potential IFs needs to be iden-tified, which will require HRA analysts becomingfamiliar with ISS operations. This process willentail detailed reviews of simulator training pro-grams, astronaut operations, and flight controlleroperations as well as interviews with trainingstaff, astronauts, and controllers. Witnessingtraining sessions covering simulated accidents isessential. In the ISS study, 43 IFs were initiallyidentified which were ultimately reduced to 6through interaction with ISS personnel.
Step 2. The list of IFs is sorted into scenario-dependent (IFs specific to a particular scenario) orglobal IFs (which are present in every scenario),as the assumption is that HEPs would be affectedby both types of IFs. In the ISS study, all sixIFs ultimately identified were global IFs; thusthese same IFs were used for all the scenariosconsidered.
Step 3. IFs are then ranked in order of importance,and the most important ones are selected. In thisexample, the 6 (of the 43) IFs considered (byconsensus) to be most important were (1) qualityof communication; (2) quality of man–machineinterface; (3) quality of procedures; (4) qualityof training; (5) quality of command, control,and decision making (CC&DM); and (6) degreeof workload. Although these IFs may be verybroadly defined, for the purposes of evaluatingtheir QVs, comprehensive yet concise definitionsthat are clearly linked to the scenarios beingevaluated need to be provided for each of theseIFs. Examples of these definitions are given bySpurgin (2010).
Step 4. Prior to rating the quality of the IFs,QDs need to be defined. In the HDT method,each IF has three possible quality levels, whosedescriptions will depend on the IF. For example,in the ISS study, the descriptors for the CC&DMIF were “efficient,” “adequate,” and “deficient”;for the “quality of procedures” IF the descriptorswere “supportive,” “adequate,” and “adverse”;and for the workload IF the descriptors were“more than capacity,” “matching capacity,” and“less than capacity.” For any given IF, the QDsneed to be explicitly defined. For example, forthe CC&DM IF, the QD “Deficient” is defined asfollows: “Collaboration between (team) membersinterferes with the ability to resolve problems andreturn to a desired state of the system.”
Step 5. Importance weights are derived for each IF.In the HDT method, these weights are obtainedthrough use of the analytic hierarchy process(AHP), a mathematical technique developed bySaaty (1980) that has been applied to a wide vari-ety of decision problems. This method requiresthat each rater rank the relative importance (orpreference) of each IF as compared to everyother IF. When making these paired compar-isons, each IF is given a value from 1 to 9; forexample, for a given scenario the relative rank-ing of communication to procedures may be 6

776 DESIGN FOR HEALTH, SAFETY, AND COMFORT
to 3. The AHP method is amenable to aggregat-ing paired-comparison data from groups of ratersand provides estimates of the variability associ-ated with each IF weight that is derived. Amongits other advantages are its ability to quantify (andthus ensure) consistency in human judgments;provide empirical results in the absence of sta-tistical assumptions regarding the distribution ofhuman judgments; and its relative ease of admin-istration. In the ISS study, importance weightswere derived for five different scenarios for whichhuman performance failure probabilities wereof interest: docking, fire, coolant leak, loss ofCC&DM, and extravehicular activity (astronautsworking in space suits outside the ISS).
Step 6. Upper and lower anchor values for thescenario HEP are determined. The upper anchorvalue may often be assumed to be 1.0, whichimplies that if all IFs that impact human perfor-mance are as poor as possible, it is almostcertain that humans will fail. The lower anchor istypically subject to greater variability; thus, eachscenario is likely to be assigned a different distri-bution for the lower anchor value. Spurgin (2010)notes that for most scenarios the 5th percentile ofthis anchor is set at 10−4 and the 95th percentileis set at 10−3; however, for more severe cases,these lower and upper bounds can be set to 10−2
and 1.0, respectively.Step 7. Using the QDs, each IF is rated for each
scenario. In rating each IF, a QV of 1, 3, or 9is assigned, where 1 represents a “good” qualitydescription, 3 represents a “fair” quality descrip-tion, and 9 represents a “poor” quality descrip-tion. Thus a factor of 3 was used to representordinal-scale transitions from good to fair andfrom fair to poor.
Step 8. At this point, a decision tree (DT) can beconstructed that, for a given scenario, capturesthe IFs, the importance weights of these IFs, andthe three QVs assigned to these IFs. For the sixIFs in this example there are a total number of36 = 729 different paths through this tree, andeach path will result in a unique HEP for that sce-nario. To determine the HEP for a given scenario,the pathway corresponding to the set of QVs thatwere assigned is located.
Step 9. The distribution of HEP values for thedifferent pathways in the DT is derived. Forexample, consider the portion of the HDTdepicted in Figure 13 for a coolant loop leak sce-nario. The HEPs in the end branches of this treeare computed with the aid of a Microsoft Excelspreadsheet based on the relationship between theIF importance weights, the QVs, and the anchorvalues. The program provides the ability forquantifying the variance in each IF importanceweight and the variances in the lower bound andupper bound anchor values. In Figure 13, the low(anchor) HEP is at the top end branch; increas-ingly higher values occur as one descends the
tree. In the HDT method, as in SLIM, the log ofHEP as a function of IFs is computed, from whichHEP values are readily calculated. The HDTmethod uses the upper and lower HEP anchor val-ues as a basis for deriving HEPs, with the preciseexpressions used as follows:
ln(HEPi ) = ln(HEPl ) + ln
(HEPh
HEPl
)[Si − Sl
Sh − Sl
]
Si =n∑
j=1
(QVj )Ij
wheren∑
j=1
Ij = 1
In these expressions, HEPi is the human errorprobability of the i th pathway through the HDT;HEPl is the low HEP anchor value; HEPh isthe high HEP anchor value; Sl is the lowestpossible value of Si (which equals 1 in thecurrent formulation of QVs for IFs); Sh is thehighest possible value of Si (which equals 9 inthe current formulation of QVs for IFs); QVjis the quality descriptor value (1, 3, or 9 in thecurrent formulation) corresponding to the j th IF;and Ij is the importance weight of the j th IF.
Overall, the HDT method, like SLIM, is a veryflexible method that can be easily adapted to manydifferent types of applications. Also, like SLIM, theimpact of changes to influencing factors, which reflectschanges in the contexts in which humans operate, canbe easily explored and used to assess cost–benefittrade-offs associated with proposed design interventions.However, like SLIM, its success depends on the rigorand skill employed in collecting relevant informationregarding operations and the impact of contextual factorson these operations and on generating and managingexpert judgments from qualified personnel.
4.9 CREAM
The HRA method known as CREAM (cognitive reli-ability and error analysis method) was developed byHollnagel (1998). CREAM distinguishes between twomethods: a basic method and an extended method . Bothmethods result in estimates of the probability of per-forming an action (either a task as a whole or a segmentof a task) incorrectly; in the basic method this estimateis referred to as a general action failure probability andin the extended method this estimate is referred to as aspecific action failure probability.
Prior to presenting the basic method, an additionalconcept that is fundamental to CREAM needs tobe introduced, namely, the notion of control mode.Hollnagel (1998) has suggested four control modes thatare considered important for performance prediction:scrambled control, opportunistic control, tactical control,and strategic control. These different levels of controlare influenced by the context as perceived by the person

HUMAN ERROR AND HUMAN RELIABILITY ANALYSIS 777
Comm
unica
tions
Proce
dure
sTra
ining
Man
–mac
hine
Wor
kload
Comm
and,
cont
rol
Weig
hted
sum
sHEP
Result
&de
cision
mak
ing
inter
face
IF weights ====>
Enter
HDT for ISS PRA Scenario
1 1 1 1
3
9
1
1
3
9
1
3
9
1
3
3
9
9
1
3
3
9
1
3
9
9 1
1 1
3
9
1
0.19 0.21 0.16 0.17 0.13 0.14
1.00E+00 4.04E-04
IF 1 (Com) IF 2 (Proc) IF 3 (Trng) IF 4 (MMI) IF 5 (Work)G139
139
139
139
139
Rating==>
The order of IF in the tree does not matter in this model becauseusing path-dependent factors.
GoodFairPoor
Indicates input cell
Low HEP anchorHigh HEP anchor
The IF weight sum to unity. They are used as weighting factors onThe quality factors are a factor that measures the increase or decreA quality factor larger than 1 indicates an increase in HEP.Model is normalized such that if all influence factors are “good,” thenHEP is achieved, and if all influence factors are “poor,” then the maxiHEP is achieved.
Legendlow= Low HEP anchorhigh=lowws=highws=
High HEP anchorLowest weighted sumHighest weighted sum
Mark scenario 2 in ORMark scenario 3 in GRMark scenario 4 in GRMark scenario 5 in BLI
4.04E-041.00E+00
F F F F
Coolant loop leak3
Quality factors
1.28E+00 4.90E-042.12E+00 8.73E-041.26E+00 4.83E-041.54E+00 5.86E-042.83E+00 1.04E-032.04E+00 8.26E-042.32E+00 1.00E-033.16E+00 1.79E-031.34E+00 5.10E-041.62E+00 6.19E-042.46E+00 1.10E-031.60E+00 6.10E-041.88E+00 7.40E-042.72E+00 1.32E-032.38E+00 1.04E-032.66E+00 1.27E-033.50E+00 2.26E-032.36E+00 1.03E-032.64E+00 1.25E-033.48E+00 2.23E-032.62E+00 1.23E-032.90E+00 1.49E-033.74E+00 2.67E-033.40E+00 2.11E-033.68E+00 2.56E-034.52E+00 4.56E-031.32E+00 5.03E-041.60E+00 6.10E-04
1.58E+00 6.02E-041.86E+00 7.30E-042.70E+00 1.30E-032.36E+00 1.03E-032.64E+00 1.25E-033.48E+00 2.23E-03
2.78E+00 1.38E-031.92E+00 7.61E-042.20E+00 9.23E-043.04E+00 1.65E-032.70E+00 1.30E-032.98E+00 1.58E-033.82E+00 2.82E-032.68E+00 1.28E-032.96E+00 1.56E-033.80E+00 2.78E-032.94E+00 1.54E-033.22E+00 1.86E-034.06E+00 3.32E-033.72E+00 2.63E-034.00E+00 3.19E-034.84E+00 5.69E-032.28E+00 9.75E-042.56E+00 1.18E-03
1.66E+00 6.36E-041.94E+00 7.71E-04
2.44E+00 1.09E-03
3913913913913913913913913913913913913913913913913913
13
9
Figure 13 Representation of a portion of a holistic decision tree for a coolant loop leak scenario. (From Spurgin, 2010.Copyright 2010 with permission from Taylor & Francis, 2010.)
(e.g., the person’s knowledge and experience concerningdependencies between actions) and by expectationsabout how the situation is going to develop. Thedistinctions between these four control modes are brieflydescribed as follows:
• Scrambled Control . In this mode, there islittle or no thinking involved in choosing whatto do; human actions are thus unpredictableor haphazard. This usually occurs when taskdemands are excessive, the situation is unfamiliar
and changes in unexpected ways, and there is aloss of situation awareness.
• Opportunistic Control . The person’s next actionis based on the salient features of the currentcontext as opposed to more stable intentions orgoals. There is little planning or anticipation.
• Tactical Control . The person’s performance isbased on planning and is thus driven to someextent by rules or procedures. The planning,however, is limited in scope.
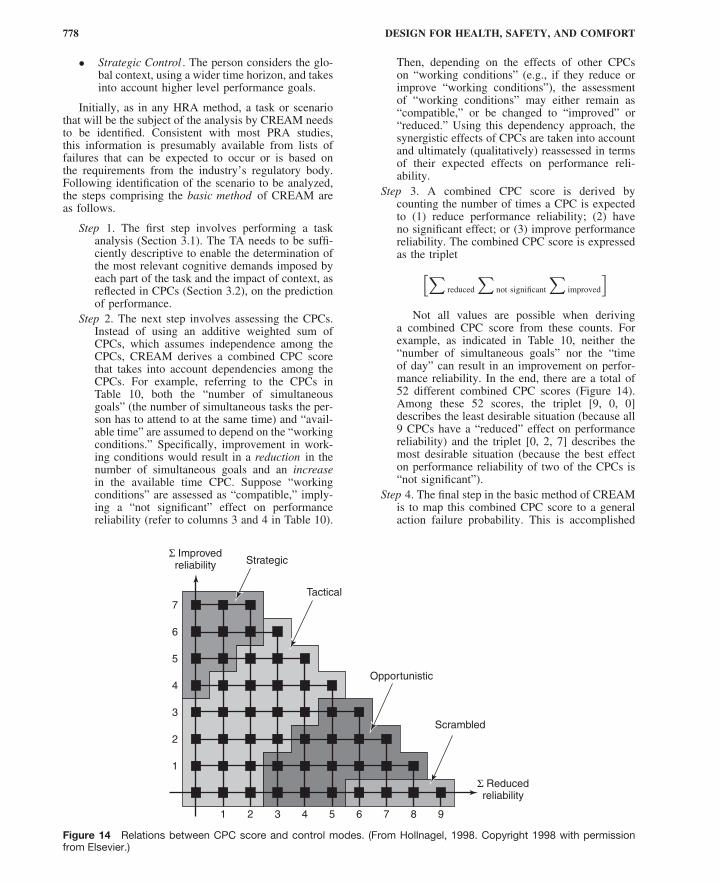
778 DESIGN FOR HEALTH, SAFETY, AND COMFORT
• Strategic Control . The person considers the glo-bal context, using a wider time horizon, and takesinto account higher level performance goals.
Initially, as in any HRA method, a task or scenariothat will be the subject of the analysis by CREAM needsto be identified. Consistent with most PRA studies,this information is presumably available from lists offailures that can be expected to occur or is based onthe requirements from the industry’s regulatory body.Following identification of the scenario to be analyzed,the steps comprising the basic method of CREAM areas follows.
Step 1. The first step involves performing a taskanalysis (Section 3.1). The TA needs to be suffi-ciently descriptive to enable the determination ofthe most relevant cognitive demands imposed byeach part of the task and the impact of context, asreflected in CPCs (Section 3.2), on the predictionof performance.
Step 2. The next step involves assessing the CPCs.Instead of using an additive weighted sum ofCPCs, which assumes independence among theCPCs, CREAM derives a combined CPC scorethat takes into account dependencies among theCPCs. For example, referring to the CPCs inTable 10, both the “number of simultaneousgoals” (the number of simultaneous tasks the per-son has to attend to at the same time) and “avail-able time” are assumed to depend on the “workingconditions.” Specifically, improvement in work-ing conditions would result in a reduction in thenumber of simultaneous goals and an increasein the available time CPC. Suppose “workingconditions” are assessed as “compatible,” imply-ing a “not significant” effect on performancereliability (refer to columns 3 and 4 in Table 10).
Then, depending on the effects of other CPCson “working conditions” (e.g., if they reduce orimprove “working conditions”), the assessmentof “working conditions” may either remain as“compatible,” or be changed to “improved” or“reduced.” Using this dependency approach, thesynergistic effects of CPCs are taken into accountand ultimately (qualitatively) reassessed in termsof their expected effects on performance reli-ability.
Step 3. A combined CPC score is derived bycounting the number of times a CPC is expectedto (1) reduce performance reliability; (2) haveno significant effect; or (3) improve performancereliability. The combined CPC score is expressedas the triplet[∑
reduced
∑not significant
∑improved
]Not all values are possible when deriving
a combined CPC score from these counts. Forexample, as indicated in Table 10, neither the“number of simultaneous goals” nor the “timeof day” can result in an improvement on perfor-mance reliability. In the end, there are a total of52 different combined CPC scores (Figure 14).Among these 52 scores, the triplet [9, 0, 0]describes the least desirable situation (because all9 CPCs have a “reduced” effect on performancereliability) and the triplet [0, 2, 7] describes themost desirable situation (because the best effecton performance reliability of two of the CPCs is“not significant”).
Step 4. The final step in the basic method of CREAMis to map this combined CPC score to a generalaction failure probability. This is accomplished
7
Σ Improvedreliability
Σ Reducedreliability
Strategic
Tactical
Opportunistic
Scrambled
6
5
4
3
2
1
1 2 3 4 5 6 7 8 9
Figure 14 Relations between CPC score and control modes. (From Hollnagel, 1998. Copyright 1998 with permissionfrom Elsevier.)
HUMAN ERROR AND HUMAN RELIABILITY ANALYSIS 779
by invoking the concept of “control mode” andcreating a plot (Figure 14) that serves a functionsimilar to that of the risk assessment matrix , atool used to conduct subjective risk assessmentsin hazard analysis (U.S. Department of Defense,1993). Depending on the region within the plotwhere 1 of the 52 values of the combinedCPC score falls, the human is assumed to beperforming in one of the four control modes.For example, the scrambled control mode isrepresented by the four cases where
∑improved =
0 and∑
reduced = >5.While there may be a number of different
ways to map the four control modes to corre-sponding human reliability intervals, Hollnagel(1998) offers one particular set of such intervals.For example, for the strategic control mode,the interval comprising the probability (p) of anaction failure is [0.5E-5 < p < 1.0E-2], whereasfor the scrambled control mode this intervalwould be [1.0E-1 < p < 1.0E-0], implying thepossibility for a probability of failure as highas 1.0.
CREAM’s extended method , like its basic method,is also centered on the principle that actions occur ina context. However, it offers the additional refinementof producing specific action failure probabilities. Thus,different actions or task segments that may fall into thesame control mode region would, in principle, have dif-ferent failure probabilities. The extended method sharesa number of the same features as the basic method,in particular the initial emphasis on task analysis andthe evaluation of CPCs. However, to generate morespecific action failure probabilities, it incorporates thefollowing layers of refinements:
Step 1. The first step is to characterize the task seg-ments or steps of the overall task in terms of thecognitive activities they involve. The goal is todetermine if the task depends on a specific setof cognitive activities, where the following listof cognitive activities is considered: coordinate,communicate, compare, diagnose, evaluate, exe-cute, identify, maintain, monitor, observe, plan,record, regulate, scan, and verify. The methodrecognizes that this list of cognitive activitiesis not necessarily complete or correct. It alsoacknowledges the important role that judgmentplays in selecting one or more of these cognitiveactivities to characterize a task step and recom-mends documenting the reasons for these assign-ments.
Step 2. A cognitive demands profile is then cre-ated by mapping each of the cognitive activitiesinto four broad cognitive functions. These fourfunctions are observation, interpretation, plan-ning, and execution (which correspond to thethree stages of information processing depictedin Figure 2). For example, the cognitive activity“evaluation” is described in terms of the cognitivefunctions “interpretation” and “planning”; thecognitive activity “coordinate” refers to the cog-nitive functions “planning” and “execution”; and
the cognitive activity “monitor” refers to the cog-nitive functions “observation” and “interpreta-tion.” Although some cognitive activities (e.g.,“diagnose” and “evaluate”) may both refer tothe same cognitive functions (“interpretation” and“planning”), they are considered distinct becausethey refer to different task activities during per-formance. For example, during diagnosis, theemphasis may be on reasoning whereas duringevaluation the emphasis may be on assessing asituation through an inspection operation.
Following the description of each cognitiveactivity in terms of its associated cognitivefunctions, a cognitive demands profile can beconstructed by counting the number of times eachof the four cognitive functions occurs. This can bedone for each of the task segments or for the taskas a whole. A cognitive demands profile plot canthen be generated, for example, by listing eachtask segment on the x axis, and the correspond-ing relative percentages to which each of thecognitive functions is demanded by that segment.
Step 3. Once a profile of cognitive functions associ-ated with the task segments has been constructed,the next step is to identify the likely failuresassociated with each of these four cognitive func-tions. In principle, the basis for determining thesefailures should derive from the complete list ofphenotypes (Section 3.1) and genotypes (e.g.,Table 9), but for practical purposes, a subset ofthis list can be used. Thus, for each of the fourcognitive functions, a number of potential failuresare considered. For example, for the cognitivefunction “observation,” three observation errorsare taken into account: observation of wrongobject, wrong identification made, and observa-tion not made. Similarly, a subset of interpreta-tion (3), planning (2), and execution (5) errorsare considered corresponding to the other threecognitive functions, resulting in a total of13 types of cognitive function failures .
Clearly, if a different set of cognitive func-tions is identified for use in this HRA model, thena set of cognitive function failures correspond-ing to those cognitive functions would need tobe selected. In any case, given the knowledge ofthe task and of the CPCs under which the taskis being performed, for each task segment theanalyst must assess the likely failures that canoccur. Note that the distribution of cognitive func-tion failures for each task segment may look verydifferent than the cognitive demands profile dis-tribution, largely because of the impact that per-formance conditions (i.e., context) are believedto be having. Thus, a task segment may havea larger percentage of cognitive functions asso-ciated with observation than interpretation, butfollowing the assessment of cognitive functionfailures may show a larger number of inter-pretation failures.
Step 4. Following the assignment of likely cognitivefunction failures to each task segment, thenext step involves computing a cognitive failure
780 DESIGN FOR HEALTH, SAFETY, AND COMFORT
probability for each type of error that can occur.These cognitive failure probabilities (CFPs) areanalogous to HEPs. Using a variety of differentsources, including Swain and Guttmann (1983)and Gertman and Blackman (1994), nominalvalues as well as corresponding lower (0.05) andupper (0.95) bounds are assigned to these CFPs.For example, for the observation error “wrongidentification made,” the nominal CFP given is7.0E-2, and the corresponding lower and upperbound estimates are [2.0E-2, 1.7E-2].
Step 5. Next, the effects of CPCs on the nomi-nal CFPs are assessed. The computation of theCPC score that was part of the basic method ofCREAM is used to determine which of the fourcontrol modes is governing performance of thetask segment or task. The nominal CFP is thenadjusted based on weighting factors associatedwith each of these control modes. For the scram-bled, opportunistic, tactical, and strategic controlmodes, the four corresponding weighting fac-tors that are specified are [2.3E + 01, 7.5E + 00,1.9E + 00, 9.4E-01]. These adjustments imply,for example, multiplying the CFP value by 23 ifthe control mode is determined to be “scrambled”and multiplying the CFP by 0.94 if the controlmode is determined to be “strategic.”
Step 6. If the analyst wishes to reduce the uncertaintyassociated with adjusting nominal CFPs based onthe control mode that is governing performance,a more complex approach can be used. Thisapproach requires that couplings between the nineCPCs and the four cognitive functions (observa-tion, interpretation, planning, and execution) beestablished by assigning, to each CPC, a “weak,”medium, or “strong” influence on each cogni-tive function. These influences are inherent tothe CPCs. For example, the CPC “availability ofprocedures” would be expected to have a stronginfluence on the cognitive function “planning,”as planning what to do would depend on whatalternatives are available, which are presumablydescribed in the procedures. However, this CPCwould be expected to have a weak influence on“interpretation” (presumably because proceduresdo not provide such elaboration). Using similarlogic, the CPC “working conditions” would beexpected to have a weak influence on “planning”but a medium influence on “observation.”
The nominal CFPs and their correspondinglower and upper bounds are then adjusted byweighting factors that are derived as follows.First, the CPC table (Table 10) is consultedto determine whether each CPC is expected tohave an effect on performance reliability (if theeffect is assessed to be “not significant,” then theweighting factor is 1, implying no modificationof the nominal CFP). If the CPC is expected tohave an effect on performance reliability, thenthe couplings that were established between theCPCs and the four cognitive functions are usedto moderate those effects accordingly; in the
case where the coupling between a CPC and acognitive function was deemed “weak,” then aweight of 1 is assigned.
Ultimately, based on various sources ofknowledge, weighting factors are assigned to eachof the four cognitive functions for each CPClevel, and these weights are used to adjust theoriginal nominal CFPs of the 13 types of fail-ures that were classified according to the type ofcognitive function required. For example, for theerror type “wrong identification,” which is oneof the three error types classified under the cog-nitive function “Observation,” consider the CPC“working conditions.” Further, consider the threelevels of this CPC: advantageous, compatible,and incompatible. For the cognitive function“observation,” the weighting factors that wouldbe used to adjust the nominal CFP for the“wrong identification” error type, which is 7.0E-2, are 0.8, 1.0, and 2.0, respectively. Thus, ifthe CPC is indeed evaluated to be advanta-geous, the nominal CFP would be adjusted downfrom 0.07 to 0.8 × 7.0E-2 = 0.056, whereas ifthe CPC is evaluated to be incompatible, theCFP would be adjusted up to 2 × 7.0E-2 = 0.14.The lower and upper bounds would be adjustedaccordingly. No adjustment would be madeif the CPC is evaluated to be compatible.
Step 7. Continuing with the example above, in real-ity, the other eight CPCs could also have aneffect on the cognitive function of “observation”and thus on the “wrong identification” observa-tion error. Referring to Table 10, assume theevaluations of the nine CPCs, from top to bot-tom, were as follows: inefficient, compatible, tol-erable, inappropriate, matching current capacity,adequate, daytime, inadequate, and efficient. Thecorresponding weighting factors would be [1.0,1.0, 1.0, 2.0, 1.0, 0.5, 1.0, 2.0, 1.0]. The totaleffect of the influence from the CPCs for this errortype is determined by multiplying all the weights,which results in a value of 2.0. The nominal CFPof 7.0E-2 would then be multiplied by 2, result-ing in an overall adjusted CFP of 14.0E-2 = 0.14.If a task is comprised of a number of task seg-ments, the one or more errors that could occurin each segment would be determined in thesame way.
Step 8. The final step in the extended method ofCREAM involves incorporation of the adjustedCFPs into a PRA. This requires providing a singlequantitative estimate of human error for the task.If the method was applied to an entire task, theresulting CFP would be used. However, if themethod was applied to a number of task segmentscomprising a task, for example, a sequence of tasksteps that could be described through a HTA, thenthe task CFP required for input to the PRA wouldbe based on the component CFPs.
In a fault tree representation of the HTA,if a task requires that a number of componentsubsteps all be performed correctly, then any

HUMAN ERROR AND HUMAN RELIABILITY ANALYSIS 781
substep performed incorrectly would lead tofailure; under these disjunctive (i.e., logical OR)conditions, the error probability for the stepcan be taken as the maximum of the individualsubstep CFPs. If, however, a task step requiresonly one of a number of component substepsto be performed correctly for the task step to besuccessful, then only if all the substeps are per-formed incorrectly would the task step fail; underthese conjunctive (i.e., logical AND) conditions,the error probability for the step can be taken asthe product of the individual substep CFPs.
4.10 HRA Methods: Concluding Remarks
4.10.1 Benchmarking HRA Methods
There are a number of ways in which HRA methods canbe evaluated and compared—that is, “benchmarked.”In a recent article, lessons learned from benchmarkingstudies involving a variety of other types of methods,as well as issues associated with HRA benchmarkingstudies, were reviewed for the purpose of ensuring thatimportant considerations were accounted for in planningfuture HRA benchmarking studies (Boring et al., 2010).
Validation in HRA benchmarking studies is oftenbased on some objective performance measure, suchas the probability of human error, against which thecorresponding estimates of the HRA methods can becompared. However, even such comparisons can beproblematic as different HRA methods may have differ-ent degrees of fit to the task or scenario chosen for analy-sis. Emphasis thus also needs to be given to the diversityof “product” areas—the different kinds of tasks, sce-narios, or ways in which the HRA method can analyzea situation—for which these methods are best suited inorder to more fully evaluate their capabilities.
In addition to the focus on end-state probabilitiesgenerated by the different methods, evaluations inbenchmarking studies should also be directed at thequalitative processes that led to those probabilities,including assumptions underlying the method, how PSFsare used, how tasks or scenarios are decomposed,and how dependencies are considered. Comparisons ofHRA methods based on other qualitative considerations(e.g., the degree of HRA expertise needed or resourcesrequired to use the method), while inherently subjective,can still reveal strengths and weaknesses that can greatlyinfluence the appropriateness of an HRA method for aparticular problem (Bell and Holyroyd, 2009).
The inconsistency among analysts in how scenariosor tasks are decomposed for analysis is a particularconcern in HRA benchmarking studies and may bepartially accountable for low interrater reliability inHEP calculations among analysts using the same HRAmethod (Boring et al., 2010). Benchmarking studies thuscould benefit from frameworks for comparing qualitativeaspects of the analysis as well as from uncertaintyinformation (in the form of lower and upper uncertaintybounds on HEPs) to allow comparisons of the range ofthe HEPs computed.
In Kirwan’s (1996) quantitative validation study ofthree HRA methods, 10 different analysts assessed each
of the methods for 30 human error scenarios derivedfrom the CORE database (Sections 4.4 and 4.10.3).Although a generally strong degree of consistency wasfound between methods and across analysts, no onemethod was sufficiently comprehensive or flexible tocover a wide range of human performance scenarios,despite the exclusion of scenarios requiring knowledge-based performance (Section 2.2.4) or diagnostic tasksperformed by operating crews. Comparing HRA meth-ods on such tasks and on scenarios in domains other thannuclear power remains a challenge for HRA benchmark-ing studies (Boring et al., 2010).
4.10.2 Issue of Dependencies
A challenging problem for all HRAs is the identificationof dependencies in human–system interactions andcomputing their effects on performance failures. Spurgin(2010) discusses the use of the beta factor as a meansfor accounting for dependencies, where
P [B|A] = βP [B]
In this expression, P [B|A] is the probability ofB given that activity A has occurred, P [B] is theprobability of activity B independent of A, and β is thedependency factor. One method for determining β inHRA studies is by using an event tree (ET) to model theinfluence of dependencies in any particular sequenceof human activities that might occur in an accidentscenario. In such an ET, the columns would correspondto the various types of dependency variables that wouldbe considered to impact activity B following activity A.
Examples of such dependency variables are cognitiveconnections between tasks, time available for actions tobe taken, relationships among various crew membersand support staff, and work stress due to workload.Each of these variables may have a number of discretelevels; for example, the time available variable may beclassified as long, medium, and short, with the branchleading through a short amount of time resulting ina much larger beta factor. The various paths throughdependency ETs would correspond to qualitativelydifferent sets of dependency influences. Accordingly,the end branches of these paths would be designated bydifferent beta values, with higher beta values resultingin increased HEPs associated with activity B.
The relationships between the levels of these inputdependency variables and the designated end-branchdependence levels are, however, assumed to be basedon expert judgment. To reduce the uncertainty associatedwith experts providing direct judgments on the depen-dence levels, a dependence assessment method based onfuzzy logic has been proposed (Podofillini et al., 2010).
Using the same five levels of dependency as THERP,this approach assigns a number of different linguisticlabels to dependency input variables (e.g., none, low,medium, high, very high) that can span ranges of valuesthat can overlap with one another and, through anexpert elicitation process, also provides anchor pointsto represent prototype conditions of the input variablesfor particular tasks. Judgments on these input variablescan be given as point values on or between anchors or as

782 DESIGN FOR HEALTH, SAFETY, AND COMFORT
an interval range of values. These judgments are thenassigned degrees of membership in fuzzy sets (basedon trapezoidal membership functions), which representthe degrees to which the judgments match each of thelinguistic labels. The expert’s knowledge is representedas a set of rules by which the relationship betweendifferent values of the input variables and output(dependency level) variables is characterized. The fuzzylogic procedure used in this approach provides differentdegrees of activation of these rules and ultimately thedegrees of belief in terms of the possibility for thedifferent dependency levels (the output fuzzy set). ForPRAs, a “defuzzification” procedure would be neededto convert this output set to probability values.
Generally, HRA analysts are free to select or modifywhatever guidelines, such as those offered in Swain andGuttman (1983), and procedures to model dependencies.Handling dependencies remains, not unlike other aspectsof HRA methods, as much art as science.
4.10.3 Deriving HEP Estimates
A fundamental issue that is troubling for many HRAmethods, especially those that are based on assigningHEP values to tasks or elemental task activities, is thederivation of such HEP estimates. Ideally, HEP datashould derive from the relevant operating experience orat least from similar industrial experiences. However,as Kirwan (1994) notes, there are a number of problemsassociated with collecting this type of quantitative HEPdata. For example, many workers will be reluctant toreport errors due to the threat of reprisals. Also, errorsthat do not lead to a violation of a company’s technicalspecifications or that are recovered almost immediatelywill probably not be reported. In addition, data on errorsassociated with very low probability events, as in theexecution of recovery procedures following an accident,may not be sufficiently available to produce reliableestimates and thus often require simulator studies fortheir generation.
Another problem is that error reports are usuallyconfined to the observable manifestations of an error(the external error modes). Without knowledge of theunderlying cognitive processes or psychological mecha-nisms, errors that are in fact dissimilar (Table 1) may beaggregated. This would not only corrupt the HEP databut could also compromise error reduction strategies.
Kirwan (1999) has reported on the construction ofan HEP database in the United Kingdom referred toas CORE-DATA (computerized operator reliability anderror database) for supporting HRA activities (in fact,as was noted in Section 4.4, the HRA method NARArelies on this database). While CORE-DATA currentlycontains a large number of HEPs, its long-term objec-tive was to apply its data to new industrial contextsthrough the development of extrapolation rules. Otherlarge-scale projects intended for obtaining HEP datain support of HRA are the human error repository andanalysis project sponsored by the U.S. Nuclear Regula-tory Commission (Halbert et al., 2006) for establishingempirical relationships between contextual factors andhuman performance failures and the International HRAEmpirical Study that is being performed by a group of
international organizations jointly with the Organisationfor Economic Co-operation and Development HaldenReactor Project (Lois et al., 2008), in which simulatordata are being used to validate the predictions of HRAmethods (Boring et al., 2010).
In HRA, what seems undeniable is that muchdepends on the use of expert judgment, whether itis to identify relevant human interactions; provide alower, nominal, or upper bound estimate of a humanfailure probability; identify contextual factors such ascommon performance conditions that could influenceperformance in a given scenario; generate importanceweights and quality ratings for those factors; resolvethe effects of dependencies among human activities andfactors defining work contexts; or provide guidance onhow to extrapolate human error data to new contexts.Ultimately, some form of expert judgment remains theunderlying critical aspect governing all HRA methods.
5 MANAGING HUMAN ERROR
This Section is confined to a few select topics thathave important implications for human error and itsmanagement. Specifically, this Section overviews someissues related to designer error, the role of automationin human error, human error in maintenance operations,and the use of incident-reporting systems.
5.1 Designer ErrorDesigner errors generally arise from two sources: inade-quate or incorrect knowledge about the application area(i.e., a failure for designers to anticipate important sce-narios) and the inability to anticipate how the productwill influence user performance (i.e., insufficient under-standing by designers). The vulnerability of designersto these sources of performance failure is not surpris-ing when one considers that designers’ conceptualiza-tions typically are nothing more than initial hypothesesconcerning the collaborative relationship between theirtechnological products and human users. Accordingly,their beliefs regarding this relationship need to be grad-ually shaped by data that are based on actual humaninteraction with these technologies, including the trans-formations in work experiences that these interactionsproduce (Dekker, 2005).
Although designers have a reasonable numberof choices available to them that can translate intodifferent technical, social, and emotional experiencesfor users, like users they themselves are under the influ-ence of sociocultural (Evan and Manion, 2002) andorganizational factors. For example, the reward structureof the organization, an emphasis on rapid completion ofprojects, and the insulation of designers from the conse-quences of their design decisions can induce designersto give less consideration to factors related to easeof operation and even safety (Perrow, 1983).
According to Perrow (1999), a major deficiency inthe design process is the inability of both designers andmanagers to appreciate human fallibility by failing totake into account relevant information that could besupplied by human factors and ergonomics specialists.While this concern is given serious consideration in

HUMAN ERROR AND HUMAN RELIABILITY ANALYSIS 783
user-centered design practices (Nielsen, 1995), in somehighly technical systems, where designers may still beviewing their products as closed systems governed byperfect logic, this issue may still exist.
5.1.1 User Adaptation to New Technologies
Much of our core human factors knowledge concerninghuman adaptation to new technology in complex sys-tems has been derived from experiences in the nuclearpower and aviation industries. These industries wereforced to address the consequences of imposing on theirworkers major transformations in the way that systemdata were presented. In nuclear power control rooms,the banks of hardwired displays were replaced by one ora few computer-based display screens, and in cockpitsthe analog single-function single displays were replacedby sophisticated software-driven electronic integrateddisplays.
These changes drastically altered the human’svisual–spatial landscape and offered a wide variety ofschemes for representing, integrating, and customizingdata. For those experienced operators who were used tohaving the entire “data world” available to them at aglance, the mental models and strategies that they haddeveloped and relied on were not likely to be as success-ful when applied to these newly designed environmentsand perhaps even predisposed them to committing errorsto a greater extent than their less experienced counter-parts.
In complex work domains such as health care thatrequire the human to cope with a potentially enormousnumber of different task contexts, anticipating the user’sadaptation to new technology can become so difficultfor designers that they themselves, like the practitionerswho will use their products, can be expected toresort to the tendency to minimize cognitive effort(Section 2.2.5). Instead of designing systems withoperational contexts in mind, one cognitively less taxingsolution is to identify and make available all possibleinformation that the user may require, but to place theburden on the user to search for, extract, or configure theinformation as the situation demands.
These designer strategies are often manifest astechnological mediums that exhibit the keyhole property ,whereby the size of the available “viewports” is verysmall relative to the number of data displays thatpotentially could be examined (Woods and Watts, 1997).Unfortunately, this approach to design makes it morelikely that the user can “get lost in the large space ofpossibilities” and makes it difficult to find the right dataat the right time as activities change and unfold.
An example of this problem was demonstrated in astudy by Cook and Woods (1996) that examined adapt-ing to new technology in the domain of cardiac anesthe-sia. In this study, physiological monitoring equipmentdedicated to cardiothoracic surgery was upgraded to acomputer system that integrated the functions of fourdevices onto a single display. By virtue of the keyholeproperty, the new technology created new interfacemanagement tasks to contend with that derived, in part,from the need to access highly interrelated data serially.New interface management tasks also included the need
to declutter displays periodically to avoid obscuringdata channels that required monitoring. This require-ment resulted from collapsing into a single device thedata world that was previously made available througha multi-instrument configuration.
To cope with these potentially overloading situations,physicians were observed to tailor both the computer-based system (system tailoring) and their own cognitivestrategies (task tailoring). For example, to tailor theirtasks, they planned their interactions with the deviceto coincide with self-paced periods of low criticalityand developed stereotypical routines to avoid gettinglost in the complex menu structures rather than riskexploiting the system’s flexibility. In the face of circum-stances incompatible with task-tailoring strategies, thephysicians had no choice but to confront the complex-ity of the device, thus diverting information-processingresources from the patient management function (Cookand Woods, 1996).
This irony of automation , whereby the burden ofinteracting with the technology tends to occur duringthose situations when the human can least afford todivert attentional resources, is also found in aviation.For example, automation in cockpits can potentiallyreduce workload by allowing complete flight paths tobe programmed through keyboards. Changes in the flightpath, however, require that pilots divert their attentionto the numerous keystrokes that need to be input to thekeyboard, and these changes tend to occur during takeoffor descent—the phases of flight containing the highestrisk and that can least accommodate increases in pilotworkload (Strauch, 2002).
Task tailoring reflects a fundamental human adaptiveprocess. Thus, humans should be expected to shape newtechnology to bridge gaps in their knowledge of thetechnology and fulfill task demands. The concern withtask tailoring is that it can create new cognitive bur-dens, especially when the human is most vulnerable todemands on attention, and mask the real effects of tech-nology change in terms of its capability for providingnew opportunities for human error (Dekker, 2005).
The provision of such new windows of opportunityfor error was illustrated in a study by Cao andTaylor (2004) on the effects of introducing a remoterobotic surgical system for laparoscopic surgery oncommunication among the operating room (OR) teammembers. In their study, communication was analyzedusing a framework referred to as common ground ,which represents a person’s knowledge or assumptionsabout what other people in the communication settingknow (Clark and Schaefer, 1989). The introduction ofnew technology into the OR provides numerous waysin which common ground, and thus patient safety, canbecome compromised. For example, roles may change,people become less familiar with their roles, the pro-cedures for using the new technology are less familiar,and expectations for responses from communicationpartners become more uncertain. Misunderstandingscan propagate through team members in unpredictableways, ultimately leading to new forms of errors.
In this case, what these researchers found was thatthe physical barrier necessitated by the introduction of

784 DESIGN FOR HEALTH, SAFETY, AND COMFORT
the surgical robot had an unanticipated effect on thework context (Section 2.4). For example, the surgeon,now removed from the surgical site, had to rely almostexclusively on video images from this remote site.Consequently, instead of receiving a full range ofsensory information from the visual, auditory, haptic,and olfactory senses, the surgeon had to contend with a“restricted field of view and limited depth informationfrom a frequently poor vantage point” (Cao and Taylor,2004, p. 310). These changes potentially overloadthe surgeon’s visual system and also create moreopportunities for decision-making errors due to gaps inthe information that is being received (Section 2.2.3).Moreover, in addition to the need for obtaininginformation on patient status and the progress of theprocedure, the surgeon has to cope with information-processing demands deriving from the need to accessinformation about the status of the robotic manipulator.Ensuring effective coordination of the robotic surgicalprocedure actually entailed that the surgeon verballydistribute more information to the OR team membersthan with conventional laparoscopic surgery.
Overall, the communication patterns were foundto be haphazard, which increased the team member’suncertainty concerning what information and wheninformation should be distributed or requested. This hasthe potential for increasing human error resulting frommiscommunication or lack of communication. Cao andTaylor suggested training to attain common ground,possibly through the use of rules or an information visu-alization system that could facilitate the developmentof a shared mental model among the team members(Stout et al., 1999).
5.2 Automation and Human Error
Innovations in technology will always occur and willbring with them new ways of performing tasks and doingwork. Whether the technology completely eliminatesthe need for the human to perform a task or resultsin new ways of performing tasks through automation ofselective task functions, the human’s tasks will probablybecome reconfigured (Chapter 59). As demonstrated inthe previous section, the human is especially vulnerablewhen adapting to new technology. During this period,knowledge concerning the technology and the impactit may have when integrated into task activities isrelatively unsophisticated, and biases from previouswork routines are still influential.
5.2.1 Levels of Automation
Automating tasks or system functions by replacing thehuman’s sensing, planning, decision-making, or manualcontrol activities with computer-based technology oftenrequires making allocation of function decisions—thatis, deciding which functions to assign to the human andwhich to delegate to automatic control (Sharit, 1997).Because these decisions can have an impact on thepropensity for human error, the level of automation to beincorporated into the system needs to be carefully con-sidered (Parasuraman et al., 2000; Kaber and Endsley,
2004). Higher levels of automation imply that automa-tion will assume greater autonomy in decision makingand control.
The primary concern with technology-centered sys-tems is that they deprive themselves of the potentialbenefits that can be gained by virtue of the human beingactively involved in system operations. These benefitscan derive from the human’s ability to anticipate, searchfor, and discern relevant data based on the current con-text; make generalizations and inferences based on pastexperience; and modify activities based on changingconstraints. Determining the optimal level of automa-tion, however, is a daunting task for the designer. Whilelevels of automation somewhere between the lowest andhighest levels may be the most effective way to exploitthe combined capabilities of both the automation andthe human, identifying an ideal level of automation iscomplicated by the need to also account for the con-sequences of human error and system failures (Morayet al., 2000).
In view of evidence that unreliable “decision automa-tion” (e.g., automation that has provided imperfectadvice) can more adversely impact human performancethan unreliable “information automation” (e.g., automa-tion that provides incorrect status information), it hasbeen suggested, particularly in systems with high-riskpotential, that the level of automation associated withdecision automation be set to allow for human input intothe decision-making process (Parasuraman and Wick-ens, 2008). This can be accomplished, for example,by allowing for the automation of information analysis(an activity that, like decision making, places demandson working memory) but allocating to the human theresponsibility for the generation of the values associ-ated with the different courses of action (Sections 2.2.1and 2.2.3). The reduced vulnerability of human per-formance to unreliable information automation as com-pared to unreliable decision automation may lie in thefact that the “data world” (i.e., the raw input data) isstill potentially available to the human under informa-tion automation.
5.2.2 Intent Errors in Use of Automation
In characterizing usage of automation, a distinctionhas been made between appraisal errors and intenterrors (Beck et al, 2002) as a basis for disuse andmisuse of automation (Parasuraman and Riley, 1997).Appraisal errors refer to errors that occur when theperceived utilities of the automated and nonautomatedalternatives are inconsistent with the actual utilities ofthese options. In contrast, intent errors occur when thehuman intentionally chooses the option that lowers thelikelihood of task success, despite knowledge of whetherthe automated or nonautomated alternative is more likelyto produce the more favorable outcome. An intent errorof particular interest is when humans refuse to use anautomated device that they know would increase thelikelihood of a successful outcome. For example, ahuman supervisory controller may choose to manuallyschedule a sequence of machining operations in place ofusing a scheduling aid that has proven utility for thosedecision-making scenarios.

HUMAN ERROR AND HUMAN RELIABILITY ANALYSIS 785
One explanation for this type of intent error is theperception of the automation as a competitor or threat;this phenomenon is known as the John Henry effect .The hypothesis that personal investment in unaided(i.e., nonautomated) performance would increase thelikelihood of the John Henry effect was tested by Becket al. (2009) in an experimental study that manipulatedboth the participant’s degree of personal investment andthe reliability of the automated device in a target detec-tion task. The findings supported the hypothesis thatwhen the automation was more reliable than the humanhigh personal investment would lead to its increaseddisuse, and when the automation was less reliable thanthe human it would lead to its lower misuse, relative tothose participants with less personal involvement.
John Henry effects can be expressed in many ways.For example, an experienced worker who feels threat-ened by newly introduced automation may convinceother co-workers not to use the device, in effect creatinga recalcitrant work culture (Section 6). Some strategiesfor countering John Henry effects include demonstratingto workers the advantages of using the aid in particularscenarios and construing the automation as a partner orcollaborator rather than as an adversary.
5.2.3 Automation and Loss of Skill
Well-designed automation can lead to a number ofindirect benefits related to human performance. Forexample, automation in manufacturing operations thatoffloads the operator from many control tasks enablesthe human controller to focus on the generation ofstrategies for improving system performance. Recklessdesign strategies, however, that automate functionsbased solely on technical feasibility can often leadto a number of problems (Bainbridge, 1987). Forinstance, manual and cognitive skills that are nolonger used due to the presence of automation willdeteriorate, jeopardizing the system during times whenhuman intervention is required. Situations requiringrapid diagnosis that rely on the human having availableor being able to rapidly construct an appropriatemental model will thus impose higher working memorydemands on humans who are no longer activelyinvolved in system operations. The human may alsoneed to allocate significant attention to monitoring theautomation, which is a task humans do not perform well.
These problems are due largely to the capability forautomation to insulate the human from the process andare best handled through training that emphasizes amplehands-on simulation exercises encompassing varied sce-narios. The important lesson learned is that “disinvolve-ment can create more work rather than less, and producea greater error potential” (Dekker, 2005, p. 165). Thistenet was highlighted in a recent article concerningerrors involving air traffic controllers and pilots thathave led to a sudden increase in near collisions of air-liners (Wall Street Journal , 2010). In some cases, pilotshad to make last-second changes in direction follow-ing warnings by cockpit alarms of an impending crash.Although collision warning systems have, together withother advances in cockpit safety equipment, contributedto the decrease in major airline crashes over the last
decade, as stated by U.S. Transportation DepartmentInspector General Mary Schiavo, one consequence ofthe availability of these systems, which essentially con-stitute a type of symbolic barrier system (Table 3), is that“it’s easy for pilots to lose their edge.” As was discussedin Section 2.4, the perception of these barrier systems byhumans can alter the context in ways that can increasethe human’s predisposition for performance failures.
5.2.4 Mode Errors and Automation Surprises
Automation can be “clumsy” for the human to interactwith, making it difficult to program, monitor, or verify,especially during periods of high workload. A possibleconsequence of clumsy automation is that it “tunes outsmall errors and creates opportunities for larger ones”(Weiner, 1985) by virtue of its complex connections toand control of important systems.
Automation has also been associated with modeerrors , a type of mistake in which the human acts basedon the assumption that the system is in a particularmode of operation (either because the available datasupport this premise or because the human instructedthe system to adopt that mode), when in fact it isin a different mode. In these situations, unanticipatedconsequences may result if the system remains capableof accommodating the human’s actions.
Generally, when the logic governing the automationis complex and not fully understood by the human, theactions taken by automatic systems may appear confus-ing. In these situations, the human’s tendency for partialmatching and biased assessments (Section 2.2) couldlead to the use of an inappropriate rule for explainingthe behavior of the system—a mistake that, in the faceof properly functioning automation, could have adverseconsequences. These forms of human–automation inter-action have been examined in detail in flight deck oper-ations in the cockpit and have been termed automationsurprises (Woods et al., 1997).
Training that allows the human to explore the variousfunctions of the automation under a wide range ofsystem or device states can help reduce some of theseproblems. However, it is also essential that designerswork with users of automation to ensure that the useris informed about what the automation is doing and thebasis for why it is doing it. In the past, slips and mistakesby flight crews tended to be errors of commission.With automation, errors of omission have become morecommon, whereby problems are not perceived andcorrective interventions are not made in a timely fashion.
5.2.5 Mistrust of and Overrelianceon Automation
When the performance of automatic systems or subsys-tems is perceived to be unreliable or uncertain, mis-trust of automation can develop (Lee and Moray, 1994;Rasmussen et al., 1994). As Lee and See (2004) havepointed out, many parallels exist between the trust thatwe gain in other people and the trust we acquire in com-plex technology, and as in our interactions with otherpeople, we tend to rely on automation we trust and rejectautomation we do not trust.

786 DESIGN FOR HEALTH, SAFETY, AND COMFORT
Mistrust of automation can provide new opportuni-ties for errors, as when the human decides to assumemanual control of a system or decision-making respon-sibilities that may be ill-advised under the prevailingconditions. Mistrust of automation can also lead to itsdisuse, which impedes the development of knowledgeconcerning the system’s capabilities and thus furtherincreases the tendency for mistrust and human error. Tohelp promote appropriate trust in automation, Lee andSee suggest that the algorithms governing the automa-tion be made more transparent to the user; that theinterface provide information regarding the capabilitiesof the automation in a format that is easily understand-able; and that training address the varieties of situationsthat can affect the capabilities of the automation.
Harboring high trust in imperfect automation couldalso lead to human performance failures as a result ofthe complacency that could arise from overreliance onautomation . A particularly dangerous situation is whenthe automation encounters inputs or situations unantic-ipated in its design but which the human believes theautomation was programmed to handle.
In situations involving monitoring informationsources for critical state changes, overreliance on theautomation to perform these functions could lead tothe human diverting resources of attention to otherconcurrent tasks. One way to counter such overrelianceon automation is through adaptive automation (Sharit,1997; Parasuraman and Wickens, 2008), which returnsthe automated task to human control when the (adaptive)automated system detects phases when human workloadis low. Such a reallocation strategy, when implementedsporadically, could also serve to refresh and thusreinforce the human’s mental model of automated taskbehavior.
System-driven adaptation, however, whether it is ini-tiated for the purpose of countering complacency dur-ing low-workload phases or for off-loading the humanduring high-workload phases, adds an element of unpre-dictability to the overall human–system interactive pro-cess. The alternative solution of shifting the control ofthe adaptive process to the human may, on the otherhand, impose an excessive decision-making load. Notsurprisingly, implementing effective adaptive automa-tion designs in complex work domains remains a chal-lenging area.
5.3 Human Error in Maintenance
To function effectively, almost all systems require main-tenance. Frequent scheduled (i.e., preventive) mainte-nance, however, can be costly, and organizations oftenseek to balance these costs against the risks of equip-ment failures. Lost in this equation, however, is a pos-sible “irony of maintenance”—an increased frequencyin scheduled maintenance may actually increase systemrisk by providing more opportunities for human inter-action with the system (Reason, 1997). This increase inrisk is more likely if assembly rather than disassemblyoperations are called for, as the comparatively fewerconstraints associated with assembly operations makethese activities much more susceptible to various errors,
such as identifying the wrong component, applying inap-propriate force, or omitting an assembly step (Lehto andBuck, 2008).
Maintenance environments are notorious for break-downs in communication, often in the form of implicitassumptions or ambiguity in instructions that go uncon-firmed (Reason and Hobbs, 2003). When operationsextend over shifts and involve unfamiliar people, thesebreakdowns in communication can propagate into catas-trophic accidents, as was the case in the explosionaboard the Piper Alpha oil and gas platform in the NorthSea (Reason and Hobbs, 2003) and the crash of ValueJetflight 592 (Strauch, 2002).
Incoming shift workers are particularly vulnerableto errors following the commencement of their taskactivities, especially if maintenance personnel in theoutgoing shift fail to brief incoming shift workers ade-quately concerning the operational context about to beconfronted (Sharit, 1998). In these cases, incoming shiftworkers may be placed in the difficult position of need-ing to invest considerable attention almost immediatelyin order to avoid an incident or accident.
Many preventive maintenance activities initiallyinvolve searching for flaws prior to applying correctiveprocedures, and these search processes are often subjectto various expectancies that could lead to errors. Forexample, if faults or flaws are seldom encountered,the likelihood of missing such targets will increase; ifthey are encountered frequently, properly functioningequipment may be disassembled. Maintenance workersare also often required to work in restricted spaces thatare error inducing by virtue of the physical and cognitiveconstraints that these work conditions can impose(Reynolds-Mozrall et al., 2000).
Flawed partnerships between maintenance workersand troubleshooting equipment can also give rise toerrors. As with other types of aiding devices, trou-bleshooting aids can compensate for human limitationsand extend human capabilities when designed appro-priately. However, these devices are often opaque andmay be misused or disregarded (Parasuraman and Riley,1997). For instance, if the logic underlying the softwareof an expert troubleshooting system is inaccessible, theuser may not trust the recommendations or explanationsgiven by the device (Section 5.2) and therefore choosenot to replace a component that the device has identifiedas faulty.
Errors resulting from interruptions are particularlyprevalent in maintenance environments. Interruptionsdue to the need to assist a co-worker or following thediscovery that the work procedure called for the wrongtool or equipment generally require the worker to leavethe scene of operations. In these kinds of situations, themost likely type of error is an omission. In fact, memorylapses probably constitute the most common errorsin maintenance, suggesting the need for incorporatinggood reminders (Reason, 1997). Reason and Hobbs(2003) emphasize the need for mental readiness andmental rehearsal as ways that maintenance workerscan inoculate themselves against errors that could arisefrom interruptions, time pressure, communication, andunfamiliar situations that may arise.

HUMAN ERROR AND HUMAN RELIABILITY ANALYSIS 787
Written work procedures are pervasive in main-tenance operations, and numerous problems with thedesign of these procedures may exist that can predisposetheir users to errors (Drury, 1998). Violations of theseprocedures are also relatively common, and managementhas been known to consider such violations as causesand contributors of adverse events. This belief, however,is both simplistic and unrealistic, and may be partly dueto the fact that work procedures are generally based onnormative models of work operations. The actual con-texts under which real work takes place are often verydifferent from those that the designers of the procedureshave envisioned or were willing to acknowledge. Tothe followers of the procedures, who must negotiatetheir tasks while being subjected to limited resources,conflicting goals, and pressures from various sources,the cognitive process of transforming procedures intoactions is likely to expose incomplete and ambiguousspecifications that, at best, appear only loosely relatedto the actual circumstances (Dekker, 2005).
A worker’s ability to adapt (and thereby violate)these procedures successfully may, in fact, be lauded bymanagement and garner respect from fellow workers.However, if these violations happen to become linkedto accidents, management would most likely refute theirknowledge or tacit approval of these informal activitiesand retreat steadfastly to the official doctrine—thatsafety will be compromised if workers do not followprocedures. Dekker suggests that organizations monitor(Section 5.4) and understand the basis for the gapsbetween procedures and practice and develop ways ofsupporting the cognitive skill of applying proceduressuccessfully across different situations by enhancingworkers’ judgments of when and how to adapt.
5.4 Incident-Reporting Systems
Information systems such as incident-reporting systems(IRSs) can allow extensive data to be collected on inci-dents, accidents, and human errors. Incidents compriseevents that are not often easy to define. They mayinclude actions, including human errors, responsible forthe creation of hazardous conditions. They may alsoinclude near misses , which are sometimes referred toas close calls.
Capturing information on near misses is particularlyadvantageous as, depending on the work domain, nearmisses may occur hundreds of times more often thanadverse events. The contexts surrounding near misses,however, should be similar to and thus highly predictiveof accidents. The reporting of near misses, especially inthe form of short event descriptions or detailed anecdotalreports, could then provide a potentially rich set of datathat could be used as a basis for proactive interventions.
The role of management is critical to the successfuldevelopment and implementation of an IRS (CCPS,1994). Management not only allocates the resourcesfor developing and maintaining the system but canalso influence the formation of work cultures that maybe resistive to the deployment of IRSs. In particular,organizations that have instituted “blame cultures”(Reason, 1997) are unlikely to advocate IRSs thatemphasize underlying causes of errors, and workers in
these organizations are unlikely to volunteer informationto these systems.
Often, the data that is collected or its interpretationwill reflect management’s attitudes concerning humanerror causation. The adoption of a system-based per-spective on human error would imply the need for aninformation system that emphasizes the collection ofdata on possible causal factors, including organizationaland management policies responsible for creating thelatent conditions for errors. A system-based perspectiveon human error is also conducive to a dynamic approachto data collection: If the methodology is proving inad-equate in accounting for or anticipating human error, itwill probably be modified.
Worker acceptance of an IRS that relies on voluntaryreporting entails that the organization meet three require-ments: exact a minimal use of blame; ensure freedomfrom the threat of reprisals; and provide feedback indi-cating that the system is being used to affect positivechanges that can benefit all stakeholders. Accordingly,workers would probably not report the occurrence ofaccidental damage to an unforgiving management andwould discontinue voluntarily offering information onnear misses if insights gained from intervention strate-gies are not shared (CCPS, 1994). It is therefore essen-tial that reporters of information perceive IRSs as errormanagement or learning tools and not as disciplinaryinstruments.
In addition to these fundamental requirements, twoother issues need to be considered. First, consistentwith user-centered design principles (Nielsen, 1995),potential users of the system should be involved in itsdesign and implementation. Second, effective trainingis critical to the system’s usefulness and usability.When human errors, near misses, or incidents occur,the people who are responsible for their reporting andinvestigation need to be capable of addressing in detailall considerations related to human fallibility, context,and barriers that affect the incident. Thus, training maybe required for recognizing that an incident has in factoccurred and for providing full descriptions of the event.
Analysts also would need training, specifically, onapplying the system’s tools, including the use of anymodeling frameworks for analyzing causality of humanerror, and on interpreting the results of these applicationtools. They would also need training on generating sum-mary reports and recommendations and on making mod-ifications to the system’s database and inferential toolsif the input data imply the need for such adjustments.
Data for input into IRSs can be of two types: quanti-tative data, which are more readily coded and classified,and qualitative data in the form of free-text descriptions.Kjellen (2000) has specified the basic requirements fora safety information system in terms of data collection,distribution and presentation of information, and overallinformation system attributes. To meet data collectionrequirements, the input data need to be reliable (i.e.,if the analysis were to be repeated, it should producesimilar results) and accurate and provide adequatecoverage (e.g., on organizational and human factorsissues) needed for exercising efficient control.

788 DESIGN FOR HEALTH, SAFETY, AND COMFORT
Foremost in the distribution and presentation ofinformation is the need for relevant information.Relevance will depend on how the system will be used.For example, if the objective is to analyze statisticson accidents in order to assess trends, a limited set ofdata on each accident or near miss would be sufficientand the nature of these data can often be specified inadvance. However, suppose that the user is interested inquerying the system regarding the degree to which newtechnology and communication issues have been jointfactors in incidents involving errors of omission. In thiscase, the relevance will be decided by the coverage.Generally, the inability to derive satisfactory answers tospecific questions will signal the need for modificationsof the system.
5.4.1 Aviation Safety Reporting System
The Aviation Safety Reporting System (ASRS) wasdeveloped in 1976 by the Federal Aviation Adminis-tration (FAA) in conjunction with NASA. Many signifi-cant improvements in aviation practices have since beenattributed to the ASRS, and these improvements havelargely accounted for the promotion and developmentof IRSs in other work domains, most notably, the healthcare industry, which has been struggling with what hasbeen termed an epidemic of adverse events stemmingfrom medical errors (Kohn et al., 1999).
The ASRS’s mission is threefold: to identify defi-ciencies and discrepancies in the National Aviation Sys-tem (NAS); to support policy formulation and planningfor the NAS; and to collect human performance data andstrengthen research in the aviation domain. All pilots, airtraffic controllers, flight attendants, mechanics, groundpersonnel, and other personnel associated with aviationoperations can submit confidential reports if they havebeen involved in or observed any incident or situationthat could have a potential effect on aviation safety. TheASRS database can be queried by accessing its Internetsite (http://asrs.arc.nasa.gov).
ASRS reports are processed in two stages by groupsof analysts composed of experienced pilots and airtraffic controllers. In the first stage, each report is readby at least two analysts who identify incidents and situ-ations requiring immediate attention. Alerting messagesare then drafted and sent to the appropriate group. Inthe second stage, analysts classify the reports and assesscauses of the incident. Their analyses and the informa-tion contained in the reports are then incorporated intothe ASRS database. The database consists of the narra-tives submitted by each reporter and coded informationthat is used for information retrieval and statisticalanalysis procedures.
Several provisions exist for disseminating ASRS out-puts. These include alerting messages that are sent outin response to immediate and hazardous situations; theCALLBACK safety bulletin, which is a monthly publi-cation containing excerpts of incident report narrativesand added comments; and the ASRS Directline, whichis published to meet the needs of airline operators andflight crews. In addition, in response to database searchrequests, ASRS staff communicates with the FAA andthe National Transportation Safety Board (NTSB) on
an institutional level in support of various tasks, suchas accident investigations, and conducts and publishesresearch related primarily to human performance issues.
5.4.2 Some Issues with IRSs
Some IRSs, by virtue of their inability to cope withthe vast number of incidents in their databases, haveapparently become “victims of their own success”(Johnson, 2002). The FAA’s ASRS and the Food andDrug Administration’s MedWatch Reporting System(designed to gather data on regulated, marketed med-ical products, including prescription drugs, specializednutritional products, and medical devices) both containenormous numbers of incidents. Because their databasetechnologies were not designed to manage this magni-tude of data, users who query these systems are havingtrouble extracting useful information and often fail toidentify important cases.
This is particularly true of the many IRSs that rely onrelational database technology. In these systems, eachincident is stored as a record, and incident identifiers areused to link similar records in response to user queries.Relational database techniques, however, do not adaptwell to changes in either the nature of incident reportingor the models of incident causation.
Another concern is that different organizations inthe same industry tend to classify events differently,which reduces the benefits of drawing on the experiencesof IRSs across different organizations. It can also beextremely difficult for people who were not involved inthe coding and classification process to develop appro-priate queries (Johnson, 2002).
Problems with IRSs can also arise when largenumbers of reports on minor incidents are stored.These database systems may then begin to drift towardreporting information on quasi-incidents and precursorsof quasi-incidents, which may not necessarily providethe IRS with increased predictive capability. As statedby Amalberti (2001), “ The result is a bloated and costlyreporting system with not necessarily better predictabil-ity, but where everything can be found; this system ischronically diverted from its true calling (safety) to serveliterary or technical causes. When a specific point needsto be proved, it is (always) possible to find confirmingelements in these extra-large databases” (p. 113).
A much more fundamental problem with IRSs is thedifficulty in assuring anonymity to reporters of informa-tion, especially in smaller organizations. Although mostIRSs are confidential, anonymity is more conduciveto obtaining disclosures of incidents. Unfortunately,anonymity precludes the possibility for follow-up inter-views, which are often necessary for clarifying reportedinformation (Reason, 1997).
Being able to follow up interviews, however, doesnot always resolve problems contained in reports. Gapsin time between the submission of a report and the elic-itation of additional contextual information can result inimportant details being forgotten or confused, especiallyif one considers the many forms of bias that can affecteyewitness testimony (Johnson, 2002). Biases that canaffect reporters of incidents can also affect the teams ofpeople (i.e., analysts) that large-scale IRSs often employ

HUMAN ERROR AND HUMAN RELIABILITY ANALYSIS 789
to analyze and classify the reports. For example, there isevidence that persons who have received previous train-ing in human factors are more likely to diagnose humanfactors issues in incident reports than persons who havenot received this type of training (Lekberg, 1997).
IRSs that employ classification schemes for inci-dents that are based on detailed taxonomies can alsogenerate confusion, and thus variability, among ana-lysts. Difficulty in discriminating between the variousterms in the taxonomy may result in low recall systems,whereby some analysts fail to identify potentially similarincidents. Generally, limitations in analysts’ abilities tointerpret causal events reduce the capability for organi-zations to draw important conclusions from incidents,whereas analyst bias can lead to organizations usingIRSs for supporting existing preconceptions concerninghuman error and safety.
The FAA’s Aviation Safety Action Program (ASAP),a voluntary carrier-specific safety program that grewout of the success of the FAA’s ASRS (Section 5.4.1),exemplifies the challenges in developing a classifica-tion scheme capable of identifying underlying causesof errors. In this program, pilots can submit short textdescriptions of incidents that occurred during line oper-ations. Although extracting diagnostic information fromASAP’s text narratives can be an arduous task, it couldbe greatly facilitated if pilots were able to classify causalcontributors of incidents when filing these reports. Bakerand Krokos (2007) detail the development of such aclassification system, referred to as ACCERS (AviationCausal Contributors for Event Reporting Systems), in aseries of studies involving pilots who were used to bothestablish as well as validate this system’s taxonomicstructure. An initial set of about 300 causal contributorswere ultimately transformed into a hierarchical taxon-omy consisting of seven causal categories (e.g., policiesor procedures, human error, human factors, and organi-zational factors) and 73 causal factors that were assignedto one of these seven categories (e.g., conflicting policiesand procedures, misapplication of flight controls, profi-ciency/overreliance on automation, and airline’s safetyculture).
Despite results which suggested that ACCERS rea-sonably satisfied three important evaluation criteriain taxonomy development—internal validity, externalvalidity, and perceived usefulness—a number of prob-lems existed that highlight the confusion that taxonomiescan bring about. For example, pilots had difficulty dif-ferentiating between the human error and human factorscategories, possibly due to confounding the error “out-come” with the “performance itself.” Also, interrateragreement was relatively low, especially at the factorlevel (i.e., selecting factor-level causal contributors tothe incident in the ASAP report), suggesting the needfor training to ensure greater consistency in appraisingthe meaning of the causal factors.
Issues associated with error or incident reportingcan also be highly work-domain specific. For example,the presumed considerable underreporting of medicalincidents and accidents in the health care industry islikely to be due to a number of relatively unique barriersto reporting that this industry faces (Holden and Karsh,
2007). One issue is that many medical providers, byvirtue of the nature of their work, may not be willingto invest the effort in documenting incidents or filingreports. Even electronic IRSs that may make it seemrelatively easy to document errors or incidents (e.g.,through drop-down menus) may still demand that thereporter collect or otherwise track down supportiveinformation, which may require leaving one’s work areaat the risk of a patient’s safety.
Many medical providers may not even be awareof the existence of a medical IRS. For example, theymay not have been present when these systems wereintroduced or when training on them was given or weresomehow not informed of their existence. The existenceor persistence of any of these kinds of situations issymptomatic of managerial failure to provide adequatecommitment to the reporting system. Another consider-ation is the transient nature of many complex medicalenvironments. For example, some medical residents orpart-time nurses, for reasons related to fear or distrustof physicians in higher positions of authority or becausethey do not perceive themselves as stakeholders in theorganization, may not feel as compelled to file incidentreports. Many medical providers, including nursesand technicians, may not even have an understandingof what constitutes an “error” or “incident” and mayrequire training to educate them on the wide rangeof situations that should be reported and, dependingon the IRS, how these situations should be classified.More generally, blame cultures are likely to be moreprevalent in medical environments, where a fear ofreprimand, being held liable, or the stigma associatedwith admissions of negligence or fallibility (Holden andKarsh, 2007) is still well established in many workers.In fact, in some electronic IRSs the wording of the dis-claimer regarding the nature of protection the reportingsystem provides the worker may be sufficient reason forsome workers not to use the system.
Finally, a very different type of concern arises whenIRSs are used as a basis for quantitative human errorapplications. In these situations, the voluntary nature ofthe reporting may invalidate the data that are used forderiving estimates of human error probabilities (Thomasand Helmreich, 2002). From a probabilistic risk assess-ment (Section 4) and risk management perspective,this issue can undermine decisions regarding allocatingresources for resolving human errors: Which errors doyou attempt to remediate if it is unclear how often theerrors are occurring?
5.4.3 Establishing Resiliency through IRSs
A kind of information that would be advantageous tocatalog but that is extremely challenging to capture bythe current state-of-the-art in incident reporting concernsthe various adaptations by an organization’s constituentsto the external pressures and conflicting goals to whichthey are continuously subjected (Dekker, 2005). Insteadof the more salient events that signal reporting in con-ventional IRSs, these adaptations, as might occur whena worker confronts increasingly scarce resources whileunder pressure to meet higher production standards,

790 DESIGN FOR HEALTH, SAFETY, AND COMFORT
can give rise to potentially risky conditions—a processthat can be characterized as drifting into failure.
If the adaptive responses by the worker to thesedemands gradually become absorbed into the organiza-tion’s definition of normal work operations, work con-texts that may be linked to system failures are unlikelyto be reported and thus remain concealed. The intricate,incremental, and transparent nature of the adaptive pro-cesses underlying these drifts may be manifest at variouslevels of an organization. Left unchecked, the aggre-gation of these drifts seals an organization’s fate byeffectively excluding the possibility for proactive riskmanagement solutions. In the case of the accident inBhopal (Casey, 1993), these drifts were personified atall levels of the responsible organization.
Although reporting systems such as IRSs can, in the-ory, monitor and detect these types of drifts into failure,to do so these systems may need to be driven by newmodels of organizational dynamics and armed with newlevels of intelligence. Overall, devising, managing, andeffectively utilizing a reporting system capable of cap-turing an organization’s adaptive capacity relative to thedynamic challenges to that capacity is consistent withthe goal of creating a resilient organization (Dekker,2005, 2006).
Presently, however, we have few models or frame-works to guide this process. To establish resiliency, thistype of reporting enterprise would need to be capa-ble of identifying the kinds of disruptions to its goalsthat can be absorbed without fundamental breakdownsin its performance or structure; when and how closelythe system appears to be operating near its performanceboundary; details related to the behavior of the systemwhen it nears such a boundary; the types of organiza-tional contexts, including management policies, that canresolve various challenges to system stability such asdealing with changing priorities, allocating responsibil-ity to automation, or pressure to trade off productionwith safety concerns; and how adaptive responses byworkers to these challenges, in turn, influence manage-ment policies and strategies (Woods, 2006). Getting therelevant data underlying these issues, let alone deter-mining how this data should be exploited, remains achallenging problem.
Finally, while the focus in safety has largely been onmodels of failure, reflecting attempts to “confirm” ourtheories about how human error and failure events canresult in accidents, in contrast we have little understand-ing of how normal work leads to stable system perfor-mance. This knowledge is prerequisite for determininghow drifts become established and the kinds of systeminstability they can produce, especially when such driftsare built on a succession of incremental departures frompreviously established norms.
Identifying such drifts is further complicated by thereality that such incremental departures by one or moreworkers in response to system demands may producesimultaneous adaptive incremental responses by manyother system constituents, including suppliers, man-agers, and even regulators, which can mask the initialbehavioral departures. Collectively, these challenges areencapsulated by Dekker (2006) as follows: “a true model
of drift may be out of reach altogether since it may befundamentally immeasurable” (p. 85).
6 ORGANIZATIONAL CULTUREAND RESILIENCE
There are numerous factors with regard to the culture ofan organization that are relevant to the topics of humanerror, risk, and safety. For example, Strauch (2002) iden-tified two factors that he considered cultural antecedentsto erroneous performance in organizations: identificationwith the group and acceptance of authority. In Hofst-ede’s (1991) analysis of the influence of company cul-tures on behaviors among individuals, these factors weretermed individualism–collectivism (the extent to whichpeople identify with the group) and power distance (theextent to which people accept authority).
Whereas individually oriented people place personalgoals ahead of organizational goals, collectivist-orientedpersons tend to identify with the company (or workgroup), so that more of the responsibility for errors thatthey commit would be deflected onto the company.These distinctions thus may underlie attitudes thatcould affect the degree to which workers mentallyprepare themselves for potential errors.
Power distance refers to the differences in powerthat employees perceive between themselves andsubordinates and superiors. In cultures with high powerdistance, subordinates are less likely to point out orcomment to others about errors committed by superiorsas compared to workers in company cultures with lowpower distance. Cultures in which workers tend to deferto authority can also suppress the organization’s capa-bility for learning. For example, workers may be lesswilling to make suggestions that can improve trainingprograms or operational procedures (Section 5.4).
Hofstede identified a third cultural factor, calleduncertainty avoidance, which refers to the willingnessor ability to deal with uncertainty; this factor also hasimplications for human error. For example, workersin cultures that are low in uncertainty avoidance areprobably more likely to invoke performance at theknowledge-based level (Section 2.2.4) in response tonovel or unanticipated situations for which rules are notavailable.
Another distinction related to organizational culture,especially in reference to industries engaged in high-riskoperations, is whether an organization can be considereda high-reliability organization (HRO). Attributes gener-ally associated with HROs include anticipating errorsand encouraging safety at the expense of production;having effective error-reporting mechanisms withoutfear of reprisals; and maintaining channels of commu-nication across all levels of the company’s operations(Rochlin et al., 1987; Roberts, 1990; Bierly and Spender,1995; Weick et al., 1999). In contrast, questionable hir-ing practices, poor economic incentives, inflexible andoutmoded training programs, the absence of IRSs andmeaningful accident investigation mechanisms, manage-rial instability, and the promotion of atmospheres that

HUMAN ERROR AND HUMAN RELIABILITY ANALYSIS 791
discourage communication between superiors and sub-ordinates represent attributes reflective of poor organi-zational cultures.
Through policies that prescribe a proactive safetyculture, the mindset of HROs makes it possible to avertmany basic human and system performance failures thatplague numerous organizations. For example, HROstypically have policies in place that serve to ensure thatvarious groups of workers interface with one another;relevant information, tools, and other specialized re-sources are available when needed; and problems donot arise due to inadequate staffing.
It can be argued that the attributes that often definean HRO also promote resiliency (Section 5.4.3). Orga-nizations with “fortress mentalities” that lack a “cultureof conscious inquiry” are antithetical to HROs; suchorganizations are more likely to miss potential risks thatare unfolding and less likely to identify critical infor-mation needed to cope with the complexity that thesesituations carry (Westrum, 2006).
Building on work by Reason (1997) and Reason et al.(1998), Wreathall (2006) has identified the followingseven organizational cultural themes which characterizethe processes by which organizations become resilientin terms of both safety and production:
• Top-Level Commitment . Top-level managementis attuned to human performance concernsand provides continuous and extensive follow-through to actions that address these concerns.
• Just Culture. As emphasized in Section 5.4, theperceived absence of a just culture will lessen thewillingness of workers to report problems, ulti-mately diminishing the effectiveness of proactiverisk management strategies.
• Learning Culture. Section 5.4 also alluded to theimportance of well-designed and well-managedIRSs as a basis for enabling an organization tolearn. However, this theme also encompassesthe need to shed or otherwise avoid culturalattributes that can suppress organizational learn-ing. An example of such an attribute is whatCook and Woods (2006) refer to as “distancingthrough differencing,” whereby an organizationmay discount or distance itself from incidentsor accidents that occur in other organizationswith similar operations through various rational-izations that impede the possibility for learning.
• Awareness . This theme emphasizes the ongoingability to extract insights from data gatheredthrough reporting systems that can be used togauge and rethink risk management models.
• Preparedness . This theme reflects a mindset ofan organization that is continually anticipatingmechanisms of failure (including human perfor-mance failures) and problems (including howimprovements and other changes might inducenew paths to failure), even when there has notbeen a recent history of accidents, and preparesfor these potential problems (e.g., by ensuringthe availability of needed resources for seriousanomalous events).
• Flexibility . Organizations that embrace a learn-ing culture are more likely to accord their super-visors with the flexibility to make adaptiveresponses in the face of routine and major crisesthat involve making difficult trade-off decisions.
• Opacity . The “open” culture that characterizesHROs, which allows interactions of individualsat all levels and encourages cross-monitoring andthe open articulation of safety concerns withoutreprisals, provides such organizations with thebuffering capacity to move toward safety bound-aries without jeopardizing the safety or produc-tivity of its operations.
To these themes one should add the willingness ofmanagement to temporarily relax the efficiency goal forthe safety goal when circumstances dictate the need fordoing so (Sheridan, 2008). Such circumstances appearedto be apparent in the case of the Deepwater Horizonaccident (Section 6.2).
In Section 2.2.5, a number of common rules peo-ple apply were offered to exemplify the manifestationof the concept of the efficiency–thoroughness trade-off(ETTO) proposed by Hollnagel (2004). The manifesta-tion of ETTO rules at the organizational level providesyet another basis upon which company cultures can bedistinguished in terms of their propensity for induc-ing performance failures. Hollnagel (2004) offers thefollowing examples of ETTO rules at the level of theorganization:
• Negative Reporting . This rule drives organi-zations to report only deviations from normalstates; the organization’s “cognitive effort” isminimized by interpreting a lack of informationas a confirmation that everything is safe.
• Reduction of Uncertainty . Overall physical andcognitive resources are saved through elimina-tion of independent checks.
• Management Double Standards . This is person-ified in the classic situation whereby efficiency,in the form of meeting deadlines and productiv-ity, is “pushed,” often tacitly, on its workers, atthe expense of the thoroughness that would beneeded to ensure the safety standards that theorganization purportedly, in its official doctrine,covets.
Another telltale sign that an organization’s culturemay be lacking in resilience, especially in its ability tobalance the pressures of production with concerns forsafety, resides in the nature of its maintenance opera-tions. This was apparent in the crash of ValueJet flight592 into the Florida Everglades in 1996 just minutesafter takeoff. The crash occurred following an intensefire in the airplane’s cargo compartment that made itsway into the cabin and overcame the crew (Strauch,2002). Unexpended and unprotected canisters of oxygengenerators, which can inadvertently generate oxygenand heat and consequently ignite adjacent materials, hadsomehow managed to become placed onto the aircraft.

792 DESIGN FOR HEALTH, SAFETY, AND COMFORT
Although most of the errors that were uncoveredby the investigation were associated with maintenancetechnicians at SabreTech—the maintenance facilitycontracted by ValueJet to overhaul several of itsaircraft—these errors were attributed to practices atSabreTech that reflected organizational failures. Forexample, although the work cards (which specified therequired steps for performing maintenance tasks) indi-cated either disabling the canisters with locking caps orexpending them, these procedures were not carried out.Contributing to the failure to carry out these procedureswas the unavailability of the locking caps needed tosecure the unexpended oxygen generators. In addition,maintenance workers incorrectly tagged the canisters.Instead of applying red tags, which would have cor-rectly identified the removed canisters as condemned orrejected components (the canisters were in fact expired),they applied green tags, which signified the need for fur-ther repairs or testing. Workers in shipping and receiv-ing, who were ultimately responsible for placing the can-isters on the airplane, thus assumed the canisters were tobe retained. Had the correctly colored tags been attachedto the components, these personnel would likely haverealized that the canisters were of no value andthus were not to be returned to the airline.
There was also a lack of communication acrossshifts concerning the hazards associated with the oxy-gen generators, which was facilitated by the absenceof procedures for briefing incoming and outgoing shiftworkers concerning hazardous materials and for trackingtasks performed during shifts. Deficiencies in trainingwere also cited as a contributory cause of the accident.Although SabreTech provided instruction on variouspolicies and procedures (e.g., involving inspection andhazardous material handling), contractor personnel, whocomprised the majority of the company’s technicianswho worked on the canisters, received no training.
The finding that the majority of the technicians thatremoved oxygen canisters from ValueJet airplanes aspart of the overhaul of these aircraft were not SabreTechpersonnel is particularly relevant to this discussion asthis work arrangement can easily produce an inade-quately informed organizational culture. It is also notsurprising that management would be insensitive to theimplications of outsourcing on worker communicationand task performance, and focus instead on the costreduction benefits. As Peters and Peters (2006) note:“Outsourcing can be a brain drain, a quality systemnightmare, and an error producer unless rigorously andappropriately managed” (p. 152).
Finally, any discussion on organizational culture,especially within the context of risk management,would be remiss not to include the idea of a safetyculture (Reason, 1997; Vicente, 2004; Glendon et al.,2006). A number of the elements required for theemergence of a safety culture within an organizationhave already been discussed with regard to IRSs(Section 5.4). Reason cautions, however, that having allthe necessary ingredients of a safety culture does notnecessarily establish a safety culture, and the perceptionby an organization that it has achieved a respectable orfirst-rate safety culture is almost a sure sign that they
are mistaken. This warning is consistent with one of thetenets of resiliency: as stated by Paries (2006), “the coreof a good safety culture is a self-defeating prophecy.”
6.1 Columbia Accident
The physical cause of the Columbia space shuttle acci-dent in 2003 was a breach in the thermal protection sys-tem on the leading edge of Columbia’s left wing about82 s after the launch. This breach was caused by a pieceof insulating foam that separated from the external tankin an area where the orbiter attaches to the external tank.However, the Columbia Accident Investigation Board’s(2003) report stated that “NASA’s organizational cul-ture had as much to do with this accident as foam did,”that “only significant structural changes to NASA’sorganizational culture will enable it to succeed,” andthat NASA’s current organization “has not demonstratedthe characteristics of a learning organization” (p. 12).
To some extent NASA’s culture was shaped bycompromises with political administrations that wererequired to gain approval for the space shuttle program.These compromises imposed competing budgetary andmission requirements that resulted in a “remarkablycapable and resilient vehicle,” but one that was “lessthan optimal for manned flights” and “that never metany of its original requirements for reliability, cost, easeof turnaround, maintainability, or, regrettably, safety”(p. 11).
The organizational failures are almost too numerousto document: unwillingness to trade off scheduling andproduction pressures for safety; shifting managementsystems and a lack of integrated management acrossprogram elements; reliance on past success as a basisfor engineering practice rather than on dependable engi-neering data and rigorous testing; the existence of orga-nizational barriers that compromised communication ofcritical safety information and discouraged differencesof opinion; and the emergence of an informal commandand decision-making apparatus that operated outside theorganization’s norms. According to the Columbia Acci-dent Investigation Board, deficiencies in communica-tion, both up and down the shuttle program’s hierarchy,were a foundation for the Columbia accident.
These failures were largely responsible for missedopportunities, blocked or ineffective communication,and flawed analysis by management during Columbia’sfinal flight that hindered the possibility of a challengingbut conceivable rescue of the crew by launchingAtlantis , another space shuttle craft, to rendezvous withColumbia . The accident investigation board concluded:“Some Space Shuttle Program managers failed to fulfillthe implicit contract to do whatever is possible toensure the safety of the crew. In fact, their managementtechniques unknowingly imposed barriers that kept atbay both engineering concerns and dissenting views,and ultimately helped create ‘blind spots’ that preventedthem from seeing the danger the foam strike posed”(p. 170). Essentially, the position adopted by managersconcerning whether the debris strike created a safety-of-flight issue placed the burden on engineers to prove thatthe system was unsafe.

HUMAN ERROR AND HUMAN RELIABILITY ANALYSIS 793
Numerous deficiencies were also found with theProblem Reporting and Corrective Action database, acritical information system that provided data on anynonconformances. In addition to being too time con-suming and cumbersome, it was also incomplete. Forexample, only foam strikes that were considered in-flightanomalies were added to this database, which maskedthe extent of this problem.
What is particularly disturbing was the failure ofthe shuttle program to detect the foam trend andappreciate the danger that it presented. Shuttle managersdiscarded warning signs from previous foam strikesand normalized their occurrences. In so doing, theydesensitized the program to the dangers of foam strikesand compromised the flight readiness process. Althoughmany workers at NASA knew of the problem, in theabsence of an effective mechanism for communicatingthese “incidents” (Section 5.4), proactive approachesfor identifying and mitigating risks were unlikely to bein place. In particular, a proactive perspective to riskidentification and management could have resulted in abetter understanding of the risk of thermal protectiondamage from foam strikes; tests being performed onthe resilience of the reinforced carbon–carbon panels;and either the elimination of external tank foam lossor its mitigation through the use of redundant layers ofprotection.
6.2 Deepwater Horizon Accident
On April 20, 2010, an explosion occurred on the Deep-water Horizon, a massive oil exploration rig locatedabout 50 miles south of the Louisiana coast in the Gulfof Mexico. The rig was owned by the drilling companyTransocean, the world’s largest offshore drilling contrac-tor, and leased to the energy company British Petroleum(BP). This accident resulted from a blowout—an uncon-trolled or sudden release of oil or natural gases—ofan oil well located about a mile below the surface ofthe sea. The explosion and ensuing inferno resulted in11 deaths and at least 17 injuries.
The rig sank to the bottom of the sea and inthe process ruptured the pipes that carried oil to thesurface, ultimately leading to the worst oil spill in U.S.(and probably world) history and causing significanteconomic and environmental damage to the Gulf region.Because the pressure at the well site is more than a tonper square inch, recovery from the failure needed to beperformed remotely. At the conclusion of the writingof this chapter, which occurred on the 80th day of theoil spill, BP had finally appeared, following a seriesof highly publicized failed attempts, to successfully capthe leak streaming from the blown well. The evidenceaccumulated by this time seemed to indicate that it was acomplex combination of factors that led to this accident.
In these rigs the first line of defense is the blowoutpreventer (BOP), a stack of equipment about 40 ft highthat contains hydraulic valves designed to automaticallyseal the wellhead during an emergency. However, work-ers on the Deepwater Horizon were not able to activatethis equipment. The failure of the fail-safe BOP has gar-nered a tremendous amount of attention as it represents
the ultimate (and single) defense against onrushing oiland gas when an oil rig loses control of a well.
The key device in the BOP is the blind shear ram. Inthe event of a blowout, the blind shear ram utilizes twoblades to slice through the drill pipe and seal the well.However, if one of the small shuttle valves leading tothe blind shear ram becomes jammed or leaks, the ram’sblades may not budge, and there is evidence that therewas leakage of hydraulic fluid in one or more of theshuttle valves when the crew on the rig activated theblind shear ram (New York Times , 2010a).
This vulnerability to the fail-safe system was knownwithin the oil industry and prompted offshore drillers,including Transocean, to add a layer of redundancy byequipping their BOPs with two blind shear rams. Infact, at the time of the Deepwater Horizon accident11 of Transocean’s 14 rigs in the Gulf had two blindshear rams, as did every (other) oil rig under contractwith BP (New York Times , 2010a). However, neitherTransocean nor BP appeared to take the necessary stepsto outfit Deepwater Horizon’s BOP with two blind shearrams. Transocean stated that it was BP’s responsibility,based on various factors such as water depth and seismicdata, for deciding on the BOP. BP’s position was thatboth companies needed to be involved in making sucha determination, as the decision entailed considerationof contractor preferences and operator requirements.
The problem with assuring the reliability of thesedevices appears to extend across the entire oil industryand includes the whole process by which federallymandated tests on BOPs are run and evaluated. Onestudy that examined the performance of blind shear ramsin BOPs on 14 new rigs found that 7 had not even beenchecked to determine if their shear rams would functionin deep water, and of the remaining 7 only 3 were foundto be capable of shearing pipe at their maximum ratedwater depths. Yet, despite this lack of preparedness inthe last line of defense against a blowout, and even asthe oil industry moves into deeper water, BP and otheroil companies financed a study in early 2010 aimed atarguing against conducting BOP pressure tests every 14days in favor of having these tests performed every 35days, which would result in an estimated annual savingsof $193 million in lost productivity (New York Times ,2010a).
Irrespective of whether these required governmenttests indeed provide reasonable guarantees of safety,the federal Minerals Management Services (MMS),which at the time served under the U.S. Department ofthe Interior, issued permits to drill in deepwater withoutassurances that these companies’ BOPs could shearpipe and seal a well at depths of 5000 ft. These regu-latory shortcomings, which came to light following theDeepwater Horizon accident, led Ken Salazar, Secretaryof the Interior, to announce plans for the reorganizationof the MMS “by separating safety oversight from thedivision that collects royalties from oil and gas compa-nies” (New York Times , 2010b). (The MMS has sincebeen renamed Bureau of Ocean Energy Management,Regulation and Enforcement.)
There were also a number of indicators in themonths and weeks prior to the Deepwater Horizon

794 DESIGN FOR HEALTH, SAFETY, AND COMFORT
accident that the risks of drilling might exceedacceptable risk boundaries. The crew of the DeepwaterHorizon encountered difficulty maintaining control ofthe well against “kicks” (sudden releases of surging gas)and had problems with stuck drilling pipes and brokentools, costing BP millions of dollars in rig rental feesas they fell behind schedule. Immediately before theexplosion there were warning signs that a blowout wasimpending, based on preliminary evidence of equipmentreadings suggesting that gas was bubbling into thewell (New York Times , 2010c). In fact, in the monthbefore the explosion BP officials conceded to federalregulators that there were issues controlling the well,and on at least three occasions BP records indicatedthat the BOP was leaking fluid, which limits its abilityto operate effectively. Although regulators (the MMS)were informed by BP officials of these struggles withwell control, they ultimately conceded to a requestto delay their federally mandated BOP test, which issupposed to occur every two weeks, until problemswere resolved. When the BOP was tested again, it wastested at a pressure level 35% below the levels used onthe device before the delay and continued to be testedat this lower pressure level until the explosion.
In April, prior to the accident, according to testimonyat hearings concerning the accident and documentsmade available to investigators (New York Times 2010a,2010b), BP took what many industry experts felt werehighly questionable shortcuts in preparing to seal the oilwell, including using a type of casing that was the riskier(but more cost-effective in the long term) of two options.With this option, if the cement around the casing pipedoes not seal properly, high-pressure gases could leak allthe way to the wellhead, where only a single seal wouldserve as a barrier. In fact, hours before the explosion,gases were found to be leaking through the cement thathad been set by an oil services contractor (New YorkTimes , 2010d).
BP has blamed the various companies involved inthe sealing operation, including Transocean’s oil rigworkers, who BP claimed did not pump sufficient waterto fully replace the thick buffer liquid between the waterand the mud. This buffer liquid may have clogged thepipe that was used for the critical negative pressure testsneeded to determine if the well was properly sealed. Theresulting (and satisfying) pressure test reading of zeromay have reflected a false assumption error arising fromthe failure to consider a side effect—in this case, thatthe reading was due to the pipe being plugged and notdue to the absence of pressure in the well. Following themisinterpretation of these pressure tests, the rig workersbegan replacing drilling mud in the pipe to the seabedwith water. The blowout and ensuing explosion occurredabout 2 h later (New York Times , 2010a).
Because BP had hoped to use the Deepwater Hori-zon to drill in another field by March 8, there may havebeen incentives for them to proceed quickly, tradingoff thoroughness for efficiency (Section 6). By theday of the accident, BP was 43 days behind schedule,and based on the cost of $533,000 per day that BPwas paying to lease the rig, this delay had incurred asubstantial financial cost. However, accusations during
hearings that many of the decisions by BP officialswere intended to save BP money and time at the risk ofcatastrophe were denied by BP’s chief executive officer(CEO), Tony Hayward, who repeatedly defended manyof these decisions in testimony to the U.S. House ofRepresentatives Energy and Commerce committee byindicating that they were approved by the MMS.
The changes in safety culture at BP that presumablycame about under the leadership of Tony Hayward(who was appointed CEO in 2007), though laudatory,appeared to address mostly lower level system issues,such as exhorting workers to grasp banisters (NewYork Times , 2010e). BP’s safety culture at the largersystem level was apparently already set in placeunder Hayward’s predecessor, John Browne, who hada reputation for pursuing potentially lucrative andtechnologically riskier ventures. Along the way therewas BP’s oil refinery explosion in Texas City, Texas,in 2005 in which 15 people died and 170 were injured.Organizational and safety deficiencies at all levels of BPwere deemed the cause of the accident; subsequently,OSHA found more than 300 safety violations, resultingin a then record of $21 million in fines. OSHAinspectors revisited the plant in 2009 and discoveredmore than 700 safety violations and proposed an $87.4million fine, mostly because of failures to correct pastfailures. A year after the Texas City explosion, BP wasresponsible for the worst spill on Alaska’s North Slope,where oil leaked from a network of pipelines.
BP’s near sinking of its offshore Thunder Horseplatform was caused by a check valve that had beeninstalled backward. Following costly repairs to fix thedamage to that rig, more significant welding problemswere discovered in the form of cracks and breaks in thepipes comprising the underwater manifold that connectsnumerous wells and helps carry oil back to the platform.It turns out that the construction of this productionplatform was severely rushed and, once at sea, hundredsof employees worked to complete it under severe timeconstraints while living in cramped chaotic conditionsin temporary encampments aboard ships. Overall, thishistory of near misses, accidents, and problems did notappear to translate into lessons learned in the case of theDeepwater Horizon.
The label “organizational error” has sometimes beenapplied to companies that have experienced highlyadverse or catastrophic outcomes that are linked to riskydecisions influenced by financial incentives, schedulingsetbacks, or other pressures. While some may object tothis label, in reality this type of “error” is similar to thatwhich might be committed by, for example, a physicianwho chooses to process more patients at the risk ofincreased carelessness in identifying and assessingcritical patient information. With organizational error,however, it is group dynamics that play an importantrole, which can lead to flawed assessments of systemvulnerabilities as these assessments can be easilybiased by higher order goals such as the need formeeting deadlines (Haines, 2008). These assessmentsare also susceptible to behaviors such as coercion andintimidation that can prevail in group decision-makingscenarios (Lehto and Buck, 2008).
HUMAN ERROR AND HUMAN RELIABILITY ANALYSIS 795
As the many factors potentially related to the Deep-water Horizon accident are further examined for theirauthenticity and more details come to light, which deci-sions and incidents, or combinations thereof, that mayhave led to the accident will likely continue to bescrutinized. Lax federal regulation, pressure from share-holders, and the technological challenges of deepwaterdrilling will surely form the core of factors that played arole, but so will the role of the safety culture. The federalgovernment may also need to rethink its strategies. Therecent decision by the administration to open up morechallenging offshore areas to drilling in the interest ofincreasing domestic oil production provides the incen-tive for aggressive oil companies to pursue riskier opera-tions using “ultra-deep” platforms far more sophisticatedthan the Deepwater Horizon. Such government policies,however, put everyone at risk if there is no simultaneouseffort to ensure appropriate regulatory oversight.
7 FINAL REMARKS
Human error remains a vast and intriguing topic. Someof the relatively recent interest in understanding andeven predicting human error has been motivated bythe possibility of finding its markings in the brain.For example, evidence from neuroimaging studies haslinked an error negativity , an event-related brain poten-tial, to the detection by individuals of action slips, errorsof choice, and other errors (Nieuwenhuis et al., 2001;Holroyd and Coles, 2002), possibly signifying the exis-tence of a neurophysiological basis for a preconsciousaction-monitoring system.
However, suggestions that these kinds of findingsmay offer possibilities for predicting human errors inreal-time operations (Parasuraman, 2003) are probablyoverstated. Event-related brain potentials may provideinsight into attentional preparedness and awareness ofresponse conflicts, but the complex interplay of factorsresponsible for human error (Section 2.1) takes thesediscoveries out of contention as explanatory devices formost meaningful types of errors. Moreover, the practicalutility of such findings is highly questionable given thecomplexity, and thus uncertainty associated with theactual environmental conditions in which humans oper-ate as well as the uncertainty inherent in psychophys-iological measures and their subsequent analyses(Cummings, 2010).
Often, one hears of the need for eliminating humanerror. This goal, however, is not always desirable.The realization that errors have been committed canplay a critical role in human adaptability, creativity,and the manifestation of expertise. The elimination ofhuman error is also inconceivable if only because humanfallibility will always exist. Even if our attention andmemory capabilities could be vastly extended, eitherthrough normal evolutionary processes or technologicaltampering, the probable effect would be the design andproduction of new and more complex systems that, inturn, would lead to more complex human activities withnew and unanticipated opportunities for human error.
In no way, however, should such suppositions deterthe goals of human error prediction, assessment, andreduction, especially in complex high-risk systems. Asa start, system hardware and software need to be mademore reliable; better partnerships between humans andautomation need to be established; barriers that areeffective in providing detection and absorption of errorswithout adversely affecting contextual and cognitiveconstraints need to be put in place; and IRSs that enableorganizations to learn and anticipate, especially whenerrors become less frequent and thus deprive analystswith the opportunity for preparing and coping with theireffects, need to become more ubiquitous.
Organizations also need to consider the adoptionof strategies and processes for implementing featuresthat have come to be associated with high-reliabilityorganizations (Section 6). In particular, emphasis needsto be given to the development of cultures of reliabilitythat anticipate and plan for unexpected events, tryto monitor and understand the gap between workprocedures and practice (Dekker, 2005), and place valuein organizational learning.
The qualitative role of HRA in PRAs (Section 4) alsoneeds to be strengthened. It is not hard to imagine a thirdgeneration of approaches to HRA that focuses more onways of analyzing human performance in varying con-texts and can more effectively assess the contribution ofa wide variety of human–system interactive behaviorsto the creation of hazardous conditions and system risks.These advances in HRA would depend on continueddevelopments in methods for describing work contextsand determining the perceptions and assessments thatworkers might make in response to these contexts.
Where relevant, these methods also need to beintegrated into the conceptual, development, and testingstages of the product and system design process. Thiswould enable designers to become better informed aboutthe potential effects of design decisions, thus bridgingthe gap between the knowledge and intentions of thedesigner and the needs and goals of the user.
Problems associated with performance failures inwork operations have traditionally been “dumped”on training departments. Instead of using training tocompensate for these problems, it should be given aproactive role through the use of methods that emphasizemanagement of task activities under uncertainty andtime constraints and the development of cognitivestrategies for error detection (Kontogiannis and Malakis,2009); give consideration to the kinds of cues that arenecessary for developing situation awareness (Endsleyet al., 2003) and for interpreting common-cause andcommon-mode system failures; and utilize simulationto provide workers with extensive exposure to a widevariety of contexts. By including provisions in trainingfor imparting mental preparedness, people will be betterable to anticipate the anomalies they might encounterand thus the errors they might make (Reason and Hobbs,2003).
However, perhaps the greatest challenge in reducinghuman error is managing these error management pro-cesses (Reason and Hobbs, 2003)—defense strategiesneed to be aggregated coherently (Amalberti, 2001). Too

796 DESIGN FOR HEALTH, SAFETY, AND COMFORT
often these types of error reduction enterprises, innova-tive as they may be, remain isolated or hidden from eachother.
REFERENCES
Alloy, L. B., and Tabachnik, N. (1984), “Assessment of Covari-ation by Humans and by Animals: The Joint Influence ofPrior Expectations and Current Situational Information,”Psychological Review , Vol. 91, pp. 112–149.
Amalberti, R. (2001), “The Paradoxes of Almost TotallySafe Transportation System,” Safety Science, Vol. 3,pp. 109–126.
American Society for Mechanical Engineers (ASME) (2008),“Standard for Level 1/Large Early Release FrequencyProbabilistic Risk Assessment for Nuclear Power PlantApplications,” RA-S-2008, ASME, New York.
Apostolakis, G. E. (2004), “How Useful Is Quantitative RiskAssessment?” Risk Analysis , Vol. 24, pp. 515–520.
Apostolakis, G. E., Bier, V. M., and Mosleh, A. (1988),“A Critique of Recent Models for Human Error RateAssessment,” Reliability Engineering and System Safety ,Vol. 22, pp. 201–217.
Bainbridge, L. (1987), “Ironies of Automation,” in NewTechnology and Human Error , J. Rasmussen, K. Duncan,and J. Leplat, Eds., Wiley, New York, pp. 273–276.
Baker, D. P., and Krokos, K. J. (2007), “Development andValidation of Aviation Causal Contributors for ErrorReporting Systems (ACCERS)”, Human Factors , Vol. 49,pp. 185–199.
Beck, H. P., Dzindolet, M. T., and Pierce, L. G. (2002),“Applying a Decision-Making Model to UnderstandMisuse, Disuse, and Appropriate Automation Use,” inAdvances in Human Factors and Cognitive Engineering:Automation , Vol. 2, E. Salas, Ed., JAI, Amsterdam,pp. 37–78.
Beck, H. P., Bates McKinney, J., Dzindolet, M. T., and Pierce,L. G. (2009), “Effects of Human-Machine Competition onIntent Errors in a Target Detection Task,” Human Factors ,Vol. 51, pp. 477–486.
Bell, J., and Holyroyd, J. (2009), “Review of Human ReliabilityAssessment Methods,” RR679, Health and Safety Exec-utive, Bootle, UK., available on http://www.hse.gov.uk/research/rrhtm/rr679.htm
Bierly, P. E., and Spender, J. C. (1995), “Culture and HighReliability Organizations: The Case of the Nuclear Sub-marine,” Journal of Management , Vol. 21, pp. 639–656.
Boring, R. L., Hendrickson, S. M. L., Forester, J. A., Tran,T. Q., and Lois, E. (2010), “Issues in Benchmark-ing Human Reliability Analysis Methods: A Litera-ture Review,” Reliability Engineering and System Safety ,Vol. 95, pp. 591–605.
Cao, C. G. L., and Milgram, P. (2000), “Disorientation inMinimal Access Surgery: A Case Study,” in Proceedingsof the IEA 2000/HFES 2000 Congress , Vol. 4, HumanFactors and Ergonomics Society, Santa Monica, CA,pp. 169–172.
Cao, C. G. L., and Taylor, H. (2004), “Effects of NewTechnology on the Operating Room Team,” in Work withComputing Systems, 2004 , H. M. Khalid, M. G. Helander,and A. W. Yeo, Eds., Damai Sciences, Kuala Lumpur,Malaysia, pp. 309–312.
Casey, S. (1993), Set Phasers on Stun and Other True Talesof Design, Technology, and Human Error , Aegean ParkPress, Santa Barbara, CA.
Casey, S. (2006), The Atomic Chef and Other True Talesof Design, Technology, and Human Error , Aegean ParkPress, Santa Barbara, CA.
Center for Chemical Process Safety (CCPS) (1992), Guide-lines for Hazard Evaluation Procedures, with WorkedExamples , 2nd ed., CCPS, American Institute of Chemi-cal Engineers, New York.
Center for Chemical Process Safety (CCPS) (1994), Guidelinesfor Preventing Human Error in Process Safety , CCPS,American Institute of Chemical Engineers, New York.
Christoffersen, K., and Woods, D. D. (1999), “How ComplexHuman–Machine Systems Fail: Putting ‘Human Error’in Context,” in The Occupational Ergonomics Handbook ,W. Karwowski and W. S. Marras, Eds., CRC Press, BocaRaton, FL, pp. 585–600.
Clark, H. H., and Schaefer, E. F. (1989), “Contributing toDiscourse,” Cognitive Science, Vol. 13, pp. 259–294.
Clemens, R. (1996), Making Hard Decisions , Duxbury, PacificGrove, CA.
Columbia Accident Investigation Board (2003), Report Vol-ume 1 , U.S. Government Printing Office, Washington,DC.
Cook, R. I., and Woods, D. D. (1996), “Adapting to NewTechnology in the Operating Room,” Human Factors ,Vol. 38, pp. 593–611.
Cook, R. I., and Woods, D. D. (2006), “Distancing through Dif-ferencing: An Obstacle to Organizational Learning Fol-lowing Accidents,” in Resilience Engineering: Conceptsand Precepts , E. Hollnagel, D. D. Woods, and N. Leve-son, Eds., Ashgate, Aldershot, England, pp. 329–338.
Cook, R. I., Render, M., and Woods, D. D. (2000), “Gaps inthe Continuity of Care and Progress on Patient Safety,”British Medical Journal , Vol. 320, pp. 791–794.
Cullen, D. J., Bates, D. W., Small, S. D., Cooper, J. B.,Nemeskal, A. R., and Leape, L. L. (1995), “The IncidentReporting System Does Not Detect Adverse Drug Events:A Problem for Quality Improvement,” Joint CommissionJournal on Quality Improvement , Vol. 21, pp. 541–548.
Cummings, M. L. (2010), “Technological Impedances toAugmented Cognition,” Ergonomics in Design , Vol. 18,pp. 25–27.
Czaja, S. J., and Sharit, J., Eds. (2009), Aging and Work:Issues and Implications in a Changing Landscape, JohnsHopkins University Press, Baltimore, MD.
Dekker, S. W. A. (2001), “The Disembodiment of Data in theAnalysis of Human Factors Accidents,” Human Factorsand Aerospace Safety , Vol. 1, pp. 39–58.
Dekker, S. W. A. (2005), Ten Questions about Human Error: ANew View of Human Factors and System Safety , LawrenceErlbaum Associates, Mahwah, NJ.
Dekker, S. (2006), “Resilience Engineering: Chronicling theEmergence of Confused Consensus,” in Resilience Engi-neering: Concepts and Precepts , E. Hollnagel, D. D.Woods, and N. Leveson, Eds., Ashgate, Aldershot, Eng-land, pp. 77–92.
Dervin, B. (1998), “Sense-Making Theory and Practice: AnOverview of User Interests in Knowledge Seekingand Use,” Journal of Knowledge Management , Vol. 2,pp. 36–46.
Dey, A. K. (2001), “Understanding and Using Context,”Personal and Ubiquitous Computing , Vol. 5, pp. 4–7.

HUMAN ERROR AND HUMAN RELIABILITY ANALYSIS 797
Dhillon, B. S., and Singh, C. (1981), Engineering Reliability:New Technologies and Applications , Wiley, New York.
Drury, C. G. (1998), “Human Factors in Aviation Mainte-nance,” in Handbook of Aviation Human Factors , D. J.Garland, J. A. Wise, and V. D. Hopkin, Eds., LawrenceErlbaum Associates, Mahwah, NJ, pp. 591–606.
Embrey, D. E., Humphreys, P., Rosa, E. A., Kirwan, B., andRea, K. (1984), SLIM–MAUD: An Approach to Assess-ing Human Error Probabilities Using Structured ExpertJudgment , NUREG/CR-3518, U.S. Nuclear RegulatoryCommission, Washington, DC.
Endsley, M. R. (1995), “Toward a Theory of Situation Aware-ness,” Human Factors , Vol. 37, pp. 32–64.
Endsley, M. R., Bolte, B., and Jones, D. G. (2003), Designingfor Situation Awareness: An Approach to User-CentredDesign , CRC Press, Boca Raton, FL.
Electric Power Research Institute (EPRI) (1992), “Approachto the Analysis of Operator Actions in Probabilistic RiskAssessment,” TR-100259, EPRI, Palo Alto, CA.
Evan, W. M., and Manion, M. (2002), Minding the Machines:Preventing Technological Disasters , Prentice-Hall, UpperSaddle River, NJ.
Fischhoff, B. (1975), “Hindsight–Foresight: The Effect ofOutcome Knowledge on Judgment under Uncertainty,”Journal of Experimental Psychology: Human Perceptionand Performance, Vol. 1, pp. 278–299.
Forester, T., Kolaczkowski, A., Cooper, S., Bley, D., and Lois,E. (2007), ATHEANA User’s Guide, NUREG-1880, U.S.Nuclear Regulatory Commission, Washington, DC.
Fraser, J. M., Smith, P. J., and Smith, J. W. (1992), “A Cat-alog of Errors,” International Journal of Man–MachineSystems , Vol. 37, pp. 265–307.
Gertman, D. I., and Blackman, H. S. (1994), Human Reliabilityand Safety Analysis Data Handbook , Wiley, New York.
Gertman, D. I., Blackman, H. S., Marble, J. L., Byers, J. C.,and Smith, C. L. (2005), The SPAR-H Human ReliabilityAnalysis Method , NUREG/CR-68:INL/EXT-05-00509,U.S. Nuclear Regulatory Commission, Washington, DC.
Glendon, A. I., Clarke, S. G., and McKenna, E. F. (2006),Human Safety and Risk Management , 2nd ed., CRC Press,Boca Raton, FL.
Grosjean, V., and Terrier, P. (1999), “Temporal Awareness: Piv-otal in Performance?” Ergonomics , Vol. 42, pp. 443–456.
Haines, Y. Y. (2008), “Systems-Based Risk Analysis,” inGlobal Catastrophic Risks , N. Bostrom and M. M.Cirkovic, Eds., Oxford University Press, New York.
Halbert, B., Boring, R., Gertman, D., Dudenboeffer, D.,Whaley, A., Marble, J., Joe, J., and Lois, E. (2006),“Human Event Repository and Analysis (HERA) System,Overview,” NUREG/CR-6903, Vol. I, U.S. NuclearRegulatory Commission, Washington, DC.
Hannaman, G. W., and Spurgin, A. J. (1984), “SystematicHuman Action Reliability Procedure,” EPRI NP-3583,Electric Power Research Institute, Palo Alto, CA.
Hannaman, G. W., Spurgin, A. J., and Lukic, Y. D. (1984),“Human Cognitive Reliability Model for PRA Analysis,”Draft Report NUS-4531, EPRI Project RP2170-3, ElectricPower Research Institute, Palo Alto, CA.
Helander, M. G. (1997), “The Human Factors Profession,” inHandbook of Human Factors and Ergonomics , 2nd ed.,G. Salvendy, Ed., Wiley, New York, pp. 3–16.
Hofstede, G. (1991), Cultures and Organizations: Software ofthe Mind , McGraw-Hill, New York.
Holden, R. J., and Karsh, B. (2007), “A Review of MedicalError Reporting System Design Considerations and aProposed Cross-Level Systems Research Framework,”Human Factors , Vol. 49, pp. 257–276.
Hollnagel, E. (1993), Human Reliability Analysis: Context andControl , Academic, London.
Hollnagel, E. (1998), Cognitive Reliability and Error AnalysisMethod , Elsevier Science, New York.
Hollnagel, E., Ed. (2003), Handbook of Cognitive Task Design ,Lawrence Erlbaum Associates, Mahwah, NJ.
Hollnagel, E. (2004), Barriers and Accident Prevention , Ash-gate, Aldershot, England.
Holroyd, C. B., and Coles, M. G. H. (2002), “The NeuralBasis of Human Error Processing: Reinforcement Learn-ing, Dopamine, and the Error-Related Negativity,” Psy-chological Review , Vol. 109, pp. 679–709.
Institute of Electrical and Electronics Engineers (IEEE) (1997),“Guide for Incorporating Human Action ReliabilityAnalysis for Nuclear Power Generating Stations,” IEEEStandard 1082, IEEE, Piscataway, NJ.
Johnson, C. (2002), “Software Tools to Support IncidentReporting in Safety-Critical Systems,” Safety Science,Vol. 40, pp. 765–780.
Johnson, W. G. (1980), MORT Safety Assurance Systems ,Marcel Dekker, New York.
Kaber, D. B., and Endsley, M. R. (2004), “The Effects of Levelof Automation and Adaptive Automation on HumanPerformance, Situation Awareness and Workload in aDynamic Control Task,” Theoretical Issues in ErgonomicsScience, Vol. 4, pp. 113–153.
Kaye, K. (1999), “Automated Flying Harbors Hidden Perils,”South Florida Sun-Sentinel , September 27.
Kirwan, B. (1994), A Guide to Practical Human ReliabilityAssessment , Taylor & Francis, London.
Kirwan, B. (1997), “The Validation of Three Human Relia-bility Quantification Techniques—THERP, HEART, andJHEDI: Part II—Results of Validation Exercise,” AppliedErgonomics , Vol. 28, pp. 27–39.
Kirwan, B. (1999), “Some Developments in Human Reliabil-ity Assessment,” in The Occupational Ergonomics Hand-book , W. Karwowski and W. S. Marras, Eds., CRC Press,Boca Raton, FL, pp. 643–666.
Kirwan, B., and Ainsworth, L. K. (1992), Guide to TaskAnalysis , Taylor & Francis, London.
Kjellen, U. (2000), Prevention of Accidents through ExperienceFeedback , Taylor & Francis, London.
Knox, N. W., and Eicher, R. W. (1983), MORT User’s Manual ,Department of Energy, 76/45-4, EG&G Idaho, IdahoFalls, ID.
Kohn, L. T., Corrigan, J. M., and Donaldson, M. S., Eds.(1999), To Err Is Human: Building a Safer Health System ,National Academy Press, Washington, DC.
Kontogiannis, T., and Lucas, D. (1990), “Operator Performanceunder High Stress: An Evaluation of Modes, CaseStudies and Countermeasures,” Report No. R90/03,prepared for the Nuclear Power Engineering Test Center,Tokyo, Human Reliability Associates, Dalton, Wigan,Lancashire, UK.
Kontogiannis, T., and Malakis, S. (2009), “A ProactiveApproach to Human Error Detection and Identification inAviation and Air Traffic Control,” Safety Science, Vol. 47,pp. 693–706.

798 DESIGN FOR HEALTH, SAFETY, AND COMFORT
Koppel, R., Metlay, J. P., Cohen, A., Abaluck, B., Localio,A. R., Kimmel, S., and Strom, B. L. (2005), “Roleof Computerized Physician Order Entry Systems inFacilitating Medication Errors,” Journal of the AmericanMedical Association , Vol. 293, pp. 1197–1203.
Kumamoto, H., and Henley, E. J. (1996), Probabilistic RiskAssessment and Management for Engineers and Scien-tists , 2nd ed., IEEE Press, Piscataway, NJ.
Leape, L. L., Brennan, T. A., Laird, N. M., Lawthers, A. G.,Localio, A. R., Barnes, B. A., Hebert, L., Newhouse, J. P.,Weiler, P. C., and Hiatt, H. H. (1991), “The Nature ofAdverse Events in Hospitalized Patients: Results fromthe Harvard Medical Practice Study II,” New EnglandJournal of Medicine, Vol. 324, pp. 377–384.
Lee, J. D., and Moray, N. (1994), “Trust, Self-Confidence,and Operators’ Adaptation to Automation,” Interna-tional Journal of Human–Computer Studies , Vol. 40,pp. 153–184.
Lee, J. D., and See, K. A. (2004), “Trust in Automation:Designing for Appropriate Reliance,” Human Factors ,Vol. 46, pp. 50–80.
Lehto, M. R., and Buck, J. R. (2008), Introduction to HumanFactors and Ergonomics for Engineers , Taylor & Francis,New York.
Lehto, M. R., and Nah, F. (1997), “Decision-Making Modelsand Decision Support,” in Handbook of Human Factorsand Ergonomics , 3rd ed., G. Salvendy, Ed., Wiley,New York, pp. 191–242.
Lekberg, A. (1997), “Different Approaches to Accident Inves-tigation: How the Analyst Makes the Difference,” inProceedings of the 15th International Systems Safety Con-ference, B. Moriarty, Ed., International Systems SafetySociety, Sterling, VA, pp. 178–193.
Leveson, N. G. (2002), A New Approach to System Safety Engi-neering , Aeronautics and Astronautics, MassachusettsInstitute of Technology, Cambridge, MA.
Levy, J., Gopher, D., and Donchin, Y. (2002), “An Analy-sis of Work Activity in the Operating Room: Apply-ing Psychological Theory to Lower the Likelihood ofHuman Error,” in Proceedings of the Human Factorsand Ergonomics Society 46th Annual Meeting , HumanFactors and Ergonomics Society, Santa Monica, CA,pp. 1457–1461.
Lois, E., Dang, V. N., Forester, J., Broberg, H., Massaiu, S.,Hildebrandt, M., Braarud, P. O., Parry, G., Julius, J., Bor-ing, R.L., Manisto, I., and Bye, A. (2009), “InternationalHRA Empirical Study—Phase I Report, NUREG/IA-0216”, Vol 1, U.S. Nuclear Regulatory Commission,Washington, DC.
Luczak, H. (1997), “Task Analysis,” in Handbook of HumanFactors and Ergonomics , 2nd ed., G. Salvendy, Ed.,Wiley, New York, pp. 340–416.
Moray, N., Inagaki, T., and Itoh, M. (2000), “AdaptiveAutomation, Trust, and Self-Confidence in Fault Man-agement of Time-Critical Tasks,” Journal of ExperimentalPsychology: Applied , Vol. 6, pp. 44–58.
New York Times (2010a), “Regulators Failed to AddressRisks in Oil Rig Fail-Safe Device,” available:www.nytimes.com, accessed July 21, 2010.
New York Times (2010b), “U.S. Said to Allow Drilling withoutNeeded Permits,” available: www.nytimes.com, accessedMay 14, 2010.
New York Times (2010c), “Documents Show Early Worriesabout Safety of Rig,” available: www.nytimes.com,accessed May 30, 2010.
New York Times (2010d), “BP Used Riskier Method to SealOil Well before Blast,” available: www.nytimes.com,accessed May 27, 2010.
New York Times (2010e), “In BP’s Record, a History of Bold-ness and Costly Blunders,” available: www.nytimes.com,accessed July 13, 2010.
Nickerson, R. S. (1998), “Confirmation Bias: A UbiquitousPhenomenon in Many Guises,” Review of General Psy-chology , Vol. 2, pp. 175–220.
Nickerson, R. S. (2004), Cognition and Chance: The Psy-chology of Probabilistic Reasoning , Lawrence ErlbaumAssociates, Mahwah, NJ.
Nielsen, J. (1995), Usability Engineering , Academic, SanDiego, CA.
Nieuwenhuis, S. N., Ridderinkhof, K. R., Blom, J., Band,G. P. H., and Kok, A. (2001), “Error Related BrainPotentials Are Differentially Related to Awareness ofResponse Errors: Evidence from an Antisaccade Task,”Psychophysiology , Vol. 38, pp. 752–760.
Norman, D. A. (1981), “Categorization of Action Slips,”Psychological Review , Vol. 88, pp. 1–15.
Parasuraman, R. (2003), “Neuroergonomics: Research andPractice,” Theoretical Issues in Ergonomics Science,Vol. 4, pp. 5–20.
Parasuraman, R., and Riley, V. (1997), “Humans and Automa-tion: Use, Misuse, Disuse, and Abuse,” Human Factors ,Vol. 39, pp. 230–253.
Parasuraman, R., and Wickens, C. D. (2008), “Humans: StillVital After All These Years,” Human Factors , Vol. 50,511–520.
Parasuraman, R., Sheridan, T. B., and Wickens, C. D. (2000),“A Model for Types and Levels of Human Interactionwith Automation,” IEEE Transactions on Systems Man,and Cybernetics, Part A: Systems and Humans , Vol. 30,pp. 276–297.
Paries, J. (2006), “Complexity, Emergence, Resilience . . . ,” inResilience Engineering: Concepts and Precepts , E. Holl-nagel, D. D. Woods, and N. Leveson, Eds., Ashgate,Aldershot, England, pp. 43–53.
Pedersen, O. M. (1985), Human Risk Contributions in ProcessIndustry: Guides for Their Pre-Identification in Well-Structured Activities and for Post Incident Analysis , RisøNational Laboratory, Roskilde, Denmark.
Perrow, C. (1983), “The Organizational Context of HumanFactors Engineering,” Administrative Science Quarterly ,Vol. 27, pp. 521–541.
Perrow, C. (1999), Normal Accidents: Living with High-RiskTechnologies , Princeton University Press, Princeton, NJ.
Pesme, H., LeBot, P., and Meyer, P. (2007), “A PracticalApproach of the MERMOS Method. Little Stories toExplore Human Reliability Assessment,” IEEE/HPRCTConference, Monterey, CA.
Peters, G. A., and Peters, B. J. (2006), Human Error: Causesand Control , Taylor & Francis, Boca Raton, FL.
Peterson, C. R., and Beach, L. R. (1967), “Man as an IntuitiveStatistician,” Psychological Bulletin , Vol. 68, pp. 29–46.
Phillips, L. D., Embrey, D. E., Humphreys, P., and Selby,D. L. (1990), “A Sociotechnical Approach to AssessingHuman Reliability,” in Influence Diagrams, Belief Netsand Decision Making: Their Influence on Safety andReliability , R. M. Oliver and J. A. Smith, Eds., Wiley,New York.
Podofillini, L., Dang, V., Zio, E., Baraldi, P., and Librizzi,M. (2010), “Using Expert Models in Human Reliability

HUMAN ERROR AND HUMAN RELIABILITY ANALYSIS 799
Analysis—A Dependence Assessment Method Based onFuzzy Logic”, Risk Analysis , Vol. 30, pp. 1277–1297.
Potter, S. S., Roth, E. M., Woods, D. D., and Elm, W. C. (1998),“A Framework for Integrating Cognitive Task Analysisinto the System Development Process,” in Proceedings ofthe Human Factors and Ergonomics Society 42nd AnnualMeeting , Human Factors and Ergonomics Society, SantaMonica, CA, pp. 395–399.
Rasmussen, J. (1982), “Human Errors: A Taxonomy forDescribing Human Malfunction in Industrial Instal-lations,” Journal of Occupational Accidents , Vol. 4,pp. 311–333.
Rasmussen, J. (1986), Information Processing and Human–Machine Interaction: An Approach to Cognitive Engineer-ing , Elsevier, New York.
Rasmussen, J., Pejterson, A. M., and Goodstein, L. P. (1994),Cognitive Systems Engineering , Wiley, New York.
Reason, J. (1990), Human Error , Cambridge University Press,New York.
Reason, J. (1997), Managing the Risks of OrganizationalAccidents , Ashgate, Aldershot, Hampshire, England.
Reason, J., and Hobbs, A. (2003), Managing MaintenanceError: A Practical Guide, Ashgate, Aldershot, Hamp-shire, England.
Reason, J. T., Parker, D., and Lawton, R. (1998), “Organiza-tional Controls and Safety: The Varieties of Rule-RelatedBehaviour,” Journal of Occupational and OrganizationalPsychology , Vol. 71, pp. 289–304.
Reynolds-Mozrall, J., Drury, C. G., Sharit, J., and Cerny, F.(2000), “The Effects of Whole-Body Restriction on TaskPerformance,” Ergonomics , Vol. 43, pp. 1805–1823.
Roberts, K. H. (1990), “Some Characteristics of One Typeof High Reliability Organization,” Organization Science,Vol. 1, pp. 160–176.
Rochlin, G., La Porte, T. D., and Roberts, K. H. (1987), “TheSelf-Designing High Reliability Organization: AircraftCarrier Flight Operations at Sea,” Naval War CollegeReview , Vol. 40, pp. 76–90.
Rouse, W. B., and Rouse, S. (1983), “Analysis and Classifi-cation of Human Error,” IEEE Transactions on Systems,Man, and Cybernetics , Vol. SMC-13, pp. 539–549.
Rumelhart, D. E., and McClelland, J. L., Eds. (1986), ParallelDistributed Processing: Explorations in the Microstruc-ture of Cognition , Vol. 1, Foundations , MIT Press, Cam-bridge, MA.
Saaty, T. L. (1980), The Analytic Hierarchy Process , McGraw-Hill, New York.
Senders, J. W., and Moray, N. P. (1991), Human Error:Cause, Prediction, and Reduction , Lawrence ErlbaumAssociates, Mahwah, NJ.
Sharit, J. (1997), “Allocation of Functions,” in Handbook ofHuman Factors and Ergonomics , 2nd ed., G. Salvendy,Ed., Wiley, New York, pp. 301–339.
Sharit, J. (1998), “Applying Human and System ReliabilityAnalysis to the Design and Analysis of Written Pro-cedures in High-Risk Industries,” Human Factors andErgonomics in Manufacturing , Vol. 8, pp. 265–281.
Sharit, J. (2003), “Perspectives on Computer Aiding in Cogni-tive Work Domains: Toward Predictions of Effectivenessand Use,” Ergonomics , Vol. 46, pp. 126–140.
Shepherd, A. (2001), Hierarchical Task Analysis , Taylor &Francis, London.
Sheridan, T. B. (2008), “Risk, Human Error, and SystemResilience: Fundamental Ideas,” Human Factors , Vol. 50,pp. 418–426.
Simon, H. A. (1966), Models of Man: Social and Rational ,Wiley, New York.
Spurgin, A. J. (2010), Human Reliability Assessment : Theoryand Practice, CRC Press, Boca Raton, FL.
Spurgin, A. J., Moieni, P., Gaddy, C. D., Parry, G., Oris,D. D., Spurgin, J. P., Joksimovich, V., Gaver, D. P.,and Hannaman, G. W. (1990), “Operator ReliabilityExperiments Using Power Plant Simulators (NP-6937),”Electric Power Research Institute, Palo Alto, CA.
Stout, R. M., Cannon-Bowers, J. A., Salas, E., and Milanovich,D. M. (1999), “Planning, Shared Mental Models, andCoordinated Performance: An Empirical Link Is Estab-lished,” Human Factors , Vol. 41, pp. 61–71.
Strauch, B. (2002), Investigating Human Error: Incidents,Accidents, and Complex Systems , Ashgate, Aldershot,Hampshire, England.
Swain, A. D., and Guttmann, H. E. (1983), Handbook of HumanReliability Analysis with Emphasis on Nuclear PowerPlant Applications , NUREG/CR-1278, U.S. Nuclear Reg-ulatory Commission, Washington, DC.
Thomas, E. J., and Helmreich, R. L. (2002), “Will AirlineSafety Models Work in Medicine?” in Medical Error:What Do We Know? What Do We Do? M. M. Rosenthaland K. M. Sutcliffe, Eds., Jossey-Bass, San Francisco,pp. 217–234.
Trost, W. A., and Nertney, R. J. (1985), MORT User’s Manual ,Department of Energy, 76/45-29, EG&G Idaho, IdahoFalls, ID.
Tversky, A., and Kahneman, D. (1974), “Judgment underUncertainty: Heuristics and Biases,” Science, Vol. 185,pp. 1124–1131.
U.S. Department of Defense (DoD) (1993), “System SafetyProgram Requirements,” MIL-STD-882C, DoD, Wash-ington, D.C.
Vicente, K. J. (1999), Cognitive Work Analysis: TowardSafe, Productive, and Healthy Computer-Based Work ,Lawrence Erlbaum Associates, Mahwah, NJ.
Vicente, K. J. (2004), The Human Factor: Revolutionizing theWay People Live with Technology , Routledge, New York.
Wall Street Journal (2010), “Near Collisions Raise Alarms onAir Safety,” July 8, Associated Press.
Walsh, B. (2010), “The Meaning of the Mess,” TIMEMagazine, May 17, pp. 29–35.
Weick, K. E., Sutcliffe, K. M., and Obstfeld, D. (1999), “Orga-nizing for High Reliability: Processes of Collective Mind-fulness,” Research in Organizational Behavior , Vol. 21,pp. 13–81.
Weiner, E. L. (1985), “Beyond the Sterile Cockpit,” HumanFactors , Vol. 27, pp. 75–90.
Westrum, R. (2006), “A Typology of Resilience Situations,” inResilience Engineering: Concepts and Precepts , E. Holl-nagel, D. D. Woods, and N. Leveson, Eds., Ashgate,Aldershot, England, pp. 55–65.
Wickens, C. D. (1984), “Processing Resources in Attention,”in Varieties of Attention , R. Parasuraman and R. Davies,Eds., Academic, New York, pp. 63–101.
Wickens, C. D., Liu, Y., Becker, S. E. G., and Lee, J. D. (2004),An Introduction to Human Factors Engineering , 2nd ed.,Prentice-Hall, Upper Saddle River, NJ.
Wilde, G. J. S. (1982), “The Theory of Risk Homeostasis:Implications for Safety and Health,” Risk Analysis , Vol. 2,pp. 209–225.
Williams, J. C. (1988), “A Data-Based Method for Assessingand Reducing Human Error to Improve Operational

800 DESIGN FOR HEALTH, SAFETY, AND COMFORT
Performance,” in Proceedings of IEEE Fourth Conferenceon Human Factors in Power Plants , E. W. Hagen, Ed.,IEEE, Piscataway, NJ, pp. 436–450.
Woods, D. D. (1984), “Some Results on Operator Performancein Emergency Events,” Institute of Chemical EngineersSymposium Series , Vol. 90, pp. 21–31.
Woods, D. D. (2006), “Essential Characteristics of Resilience,”in Resilience Engineering: Concepts and Precepts ,E. Hollnagel, D. D. Woods, and N. Leveson, Eds., Ash-gate, Aldershot, England, pp. 21–34.
Woods, D. D., and Hollnagel, E. (2005), Joint CognitiveSystems: Foundations of Cognitive Systems Engineering ,Taylor & Francis, Boca Raton, FL.
Woods, D. D., and Watts, J. C. (1997), “How Not toNavigate through Too Many Displays,” in Handbookof Human–Computer Interaction , 2nd ed., M. Helander,T. K. Landauer, and P. Prabhu, Eds., Elsevier Science,New York, pp. 617–650.
Woods, D. D., Sarter, N. B., and Billings, C. E. (1997),“Automation Surprises,” in Handbook of Human Factorsand Ergonomics , 2nd ed., G. Salvendy, Ed., Wiley,New York, pp. 1926–1943.
Wreathall, J. (2006), “Properties of Resilient Organizations: AnInitial View,” in Resilience Engineering: Concepts andPrecepts , E. Hollnagel, D. D. Woods, and N. Leveson,Eds., Ashgate, Aldershot, England, pp. 275–285.