handbook of atmospheric science || chemical evolution of the atmosphere
TRANSCRIPT

Part 1
Principles of Atmospheric Science
Handbook of Atmospheric Science: Principles and ApplicationsEdited by C.N. Hewitt, Andrea V. Jackson
Copyright © 2003 by Blackwell Publishing Ltd
1.1 INTRODUCTION
This chapter is concerned with how the planetEarth comes to have an atmosphere, and how thatatmosphere has been modified by chemical, physi-cal, and biological processes to move toward itspresent-day composition. The story begins withthe “Big Bang” in which the universe was created,and we leave it some hundreds of millions of yearsbefore present (BP). Other chapters of this bookdiscuss more recent changes in composition, espe-cially in connection with climate. As we approachour own era, within a million years or so, the recordof atmospheric composition and climate becomesricher and more detailed.
Particularly fruitful sources of informationhave proved to be the examination of cores of rockdrilled deep into the ocean floors and cores ob-tained from the ice sheets covering Greenland andthe Antarctic. Analysis has been conducted on icecore samples from Greenland and from somemountain glaciers, as well as from Antarctica. Vir-tually no melting of snow occurs even in the sum-mer, so that each year a new layer of snow is addedto the ice caps and compressed into solid ice. As thesnow falls, it scavenges aerosols from the atmos-phere, and these aerosols are trapped together withbubbles of air in the ice. Chemical or biologicalalteration to the trapped material is not expected,so that a core taken from the ice provides a strati-graphic record of the atmosphere with a high de-gree of resolution and stability. A limitation in thetime-span of the record is ultimately imposed by
the compression and resulting horizontal flow ofthe lowest layers of ice under the weight of newerice deposited on top. Nevertheless, the oldest reliable samples date back to 250kyrBP in coresfrom Greenland and 500kyrBP in cores fromAntarctica. The cores are up to 2500m long. Com-position and behavior of the atmosphere hundredsof thousands of years ago can thus be discussedwith comparative certainty. That is a luxury thatwe are denied. All information about atmosphericcomposition in this period must perforce be ob-tained by inference —for example, from geologicalor paleontological evidence. Nevertheless, someclear principles emerge, and it is worth statingthose at the outset to act as a guide to what willfollow.
The first main point is that the Earth and itsneighbors Venus and Mars must have early lost anyprimordial atmosphere with which they mighthave been born. Instead, a secondary atmospherewas formed from volatile materials trapped withinthe solid body when it was formed, or brought inlater by impacting solar-system debris (comets andmeteors). Life on Earth has had an enormous effectin bringing about subsequent changes to the com-position of our own atmosphere, especially interms of the relative abundances of CO2, N2, andO2. Carbon dioxide, which is present at less than0.04% in our atmosphere, makes up more than95% of the atmospheres of Venus and Mars. Con-versely, the N2 and O2 that make up the bulk of ouratmosphere are only minor components of theother two atmospheres. Yet it is likely that all
1 Chemical Evolution of the Atmosphere
RICHARD P. WAYNE
Handbook of Atmospheric Science: Principles and ApplicationsEdited by C.N. Hewitt, Andrea V. Jackson
Copyright © 2003 by Blackwell Publishing Ltd

4 richard p. wayne
three planets acquired initially similar secondaryatmospheres: biological or biologically mediatedprocesses have modified our atmosphere. A linkmust therefore be sought between the evolution oflife and the evolution of the Earth’s atmosphere.What is more, we shall see later that the oxygenmay have a critical role to play in protecting organ-isms on land from destructive ultraviolet radiationfrom the Sun. Molecular oxygen itself and its at-mospheric product ozone (O3) are the only knownabsorbers of such radiation in the contemporaryatmosphere. There is thus a further link betweenlife and the atmosphere.
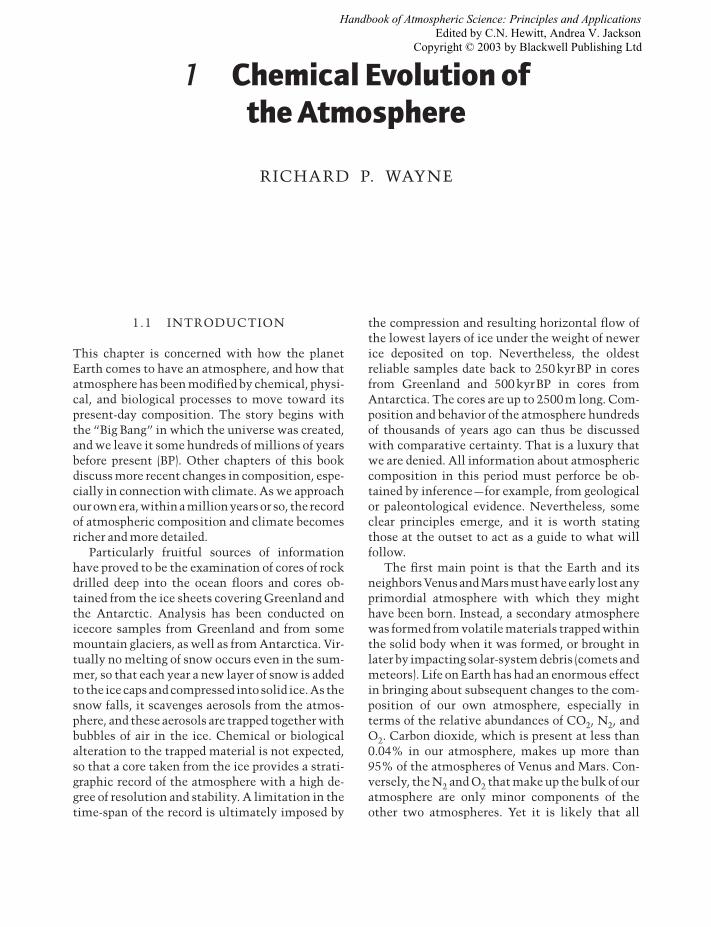
Figure 1.1 provides a clear illustration of someof the statements just made. The pie charts showthe fractional amounts of CO2, N2, O2, and Ar(where they are large enough to be seen) in the atmospheres of Earth, Venus, and Mars. The left-hand column shows present-day compositions.The Earth’s atmosphere immediately stands out asdifferent from that of its inner and outer neighborsin the solar system. The right-hand column showsa composition for Earth “reconstructed” as thoughlife were not present (Morrison & Owen 1996).Mars, being a small planet with relatively lowgravitational attraction, has undergone much lossof its atmosphere as a result of erosion by impacts(Ahrens 1993; Newman et al. 1999) and by escape.The right-hand diagram for Mars gives the compo-sition “reconstructed” as though these losses hadnot occurred. Venus has probably not lost substan-tial amounts of any of the gases under discussion;the pie chart for the present day is thus repeated onthe right hand. There is now a remarkable similar-ity between the three charts, indicating that the as-sumptions about the effects of life on Earth and ofloss from Mars really can explain an evolution ofthe atmospheres from the same starting composi-tions to what is found at the present day. Further-more, although the total pressures on the threeplanets are now very different, as indicated on thefigure, the “reconstructed” (Morrison & Owen1996) pressures are much more closely similar.The remaining differences might well come aboutbecause of the differences in sizes of the planetsand in their positions in the solar system. It istherefore time to trace the development of the
atmospheres from the creation of the solar system,first of all to the compositions suggested by theright-hand column of the figure.
1.2 CREATION OF THE PLANETSAND THEIR EARLIEST
ATMOSPHERES
Hydrogen and helium were present in the universealmost immediately after the “Big Bang,” some10–20GyrBP (current best estimates, based onHubble space-telescope data, are 12Gyr). Nuclearfusion transformed these elements into heavierones such as carbon, nitrogen, oxygen, magne-sium, silicon, and iron. Elements of atomicnumber higher than that of iron are formed insupernova explosions that scatter materialthrough the galaxies as tiny dust grains 1–1000 nmin diameter and probably composed mainly ofgraphite, H2O ice, and iron and magnesium sili-cates. Dust and gas in the universe (Frayer &Brown 1997) are concentrated in the arms of spiralgalaxies in which new stars, such as our Sun, areformed (Brush 1990; Bachiller et al. 1997; Lunine1997). Radiodating of meteorites and lunar sam-ples provides ample evidence that the solar systemwas formed 4.6 ¥ 109 years ago (Cameron 1988).Accretion of the primitive gases and dusts lies be-hind virtually all models for the origin of the solarsystem. In some regions, temperatures are lowenough to permit crystallization of the metalsilicates, but not of the ices of volatile elementssuch as H, C, or N. According to what has now be-come the standard model (Wetherill 1990), planetsgrow by agglomeration of rocky “planetesimals,”with diameters of up to a few kilometers, that formin the solar nebula. “Planetary embryos,” largerbodies of the size of the Moon or Mercury, withmasses of 1022–1023 kg, grow where the planetesi-mals are sufficiently closely packed to allow colli-sions between them. The largest of these bodiescould form in ~105 yr. The growth of planets thesize of Earth or Venus would require the merger ofabout 100 of these bodies. Completion of theprocess is estimated to occur on a time scale ofabout 107–108 yr, much longer than that thought

Chemical Evolution 5
Venus: present dayP = 93 atm
Earth: present dayP = 1 atm
Mars: present dayP = 0.006 atm
Mars: adjusted for erosion and escapeP = 7.5 atm
Earth: effects of life removedP = 70 atm
Venus: present day, for comparisonP = 93 atm
CO2 0.953CO2 0.98
N2 0.027
N2 0.781
N2 0.019
N2 0.035N2 0.035
N2 0.02
(O2 0.0013)
(CO2 0.00035) O2 0.209
CO2 0.98
CO2 0.965CO2 0.965
Ar 0.016(Ar 2 ¥ 10–5)
(Ar 1.9 ¥ 10–4)
(Ar 7 ¥ 10–5) (Ar 7 ¥ 10–5)
Ar 0.0093
Fig. 1.1 Abundances of gases in the atmospheres of Venus, Earth, and Mars. The pie charts show the fractionalabundances of the dominant gases, while those of other key components are shown in parentheses. The right-hand setof charts show what would happen on Earth if the effects of life were removed, and on Mars if the atmosphere wereadjusted for loss by erosion and escape. (Data for contemporary atmospheres are taken from Wayne 2000, who cites theoriginal references, while the reconstructions are reported by Morrison & Owen 1996, p. 347.)

6 richard p. wayne
likely (�3 ¥ 106 yr) for the loss of the gaseous solarnebula. The most significant variant of the stan-dard model is one in which the loss of the nebulargas occurred after the formation of the planets. De-tailed accounts of the origin of the elements and ofthe planets and their atmospheres can be found inarticles and books by Lewis and Prinn (1984),Atreya et al. (1989), Cox (1989, 1995), Pepin (1989),Javoy (1997, 1998), Lewis (1997), and Yung and De-More (1999), among others.
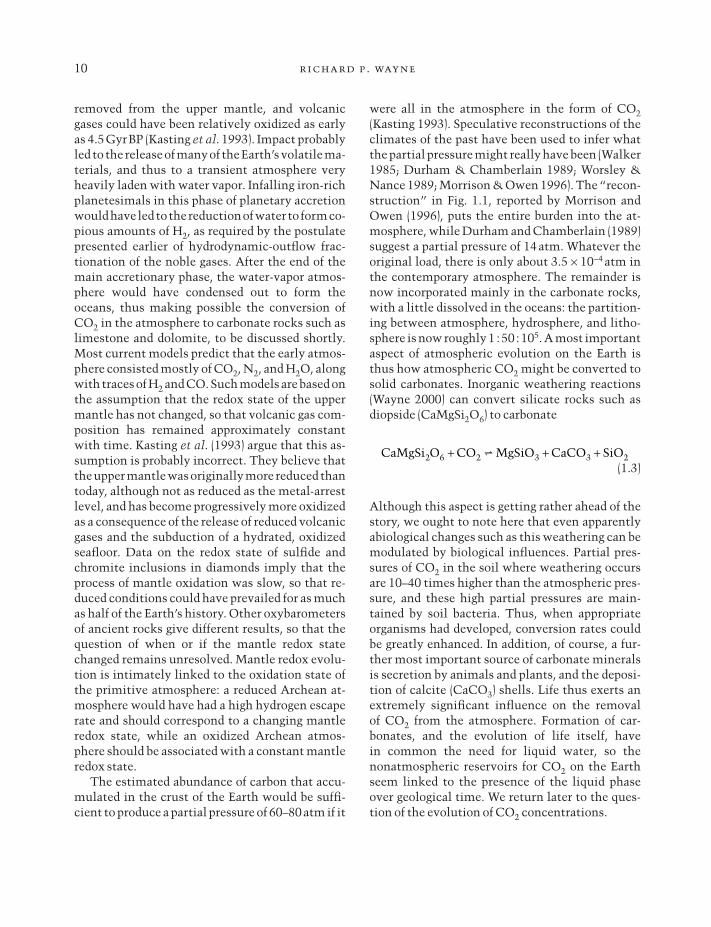
Four possible mechanisms could account forthe existence of atmospheres on Venus, Earth, andMars (Cameron 1983). These mechanisms can bebroadly classified as (i) capture of gases from theprimitive solar nebula; (ii) capture of some of thesolar wind; (iii) collision with volatile-rich cometsand asteroids; and (iv) release (“outgassing”) ofvolatile materials trapped together with the dustgrains and planetesimals as the planets accreted(Wanke & Dreibus 1988; Wetherill 1990). Onepointer to the origins of the atmospheres of theinner planets comes from the noble gases present(Pollack & Black 1982; Lupton 1983; Pepin 1989,1991, 1992; Zhang & Zindler 1989; Atreya et al.1995; Farley & Neroda 1998; Kamijo et al. 1998;Tolstikhin & Marty 1998), because chemical inert-ness prevents loss to surface rocks, and, except inthe case of helium, they cannot readily escape(Hunten 1990) to space (but see the next para-graph). Figure 1.2 shows the patterns of abun-dances of the noble gases and carbon on the inner planets and in the Sun; to give a clearer view, the abundances are normalized to those of
(nonvolatile) silicon on the planet and in the Sun.Table 1.1 provides more detailed data for isotopesof neon and argon. Two types of noble gas can bedistinguished: primordial and radiogenic. Primor-dial isotopes such as 20Ne, 36Ar, 38Ar, 84Kr, and132Xe were present in the solar system from thetime of its creation. Radiogenic isotopes, however,have built up from the decay of radioactive nuc-leides: 40Ar from the decay of 40K, and 4He from the decay of 232Th, 235U, and 238U. It is clear from
Mass of element
12 20 36 84 130XeKrArNeC
0
–2
–4
–6
–8
–10
–12
–14
Log
[ato
ms/
Si ato
m]
[ato
ms/
Si ato
m]
{
{
Solar
Clchondrites
Venus
Earth
Mars
Fig. 1.2 Abundances of noble gases and carbon in theatmospheres of Venus, Earth, and Mars, and in CIchondrites. The abundances are subject to a doublenormalization: first, they are given as the atomic ratio tothe abundance of Si on the body of interest, and thenthat ratio is divided by the ratio appropriate to the Sun.(Data from Hunten 1993, with permission fromAmerican Association for the Advancement of Science.)
Table 1.1 Abundance of noble gases. (Compiled from data given by Pepin 1989.) Pepin quotes errors and indicates theuncertainties in measurements and interpretations. Argon isotope ratios are taken from Pollack and Black (1982).
kg per kg of object Number ratios
Object 20Ne 36Ar 36Ar/12C 36Ar/38Ar 40Ar/36Ar 20Ne/22Ne
Sun 2.2 ¥ 10-3 9.0 ¥ 10-5 2.3 ¥ 10-2 5.6 <1.0 13.7
CI* 2.9 ¥ 10-10 1.3 ¥ 10-9 3.4 ¥ 10-8 5.3 — 8.9
Venus 2.9 ¥ 10-10 2.5 ¥ 10-9 9.7 ¥ 10-5 5.6 1.0 11.8
Earth 1.0 ¥ 10-11 3.5 ¥ 10-11 2.3 ¥ 10-6 5.3 296 9.8
Mars 4.4 ¥ 10-14 2.2 ¥ 10-13 1.9 ¥ 10-5 4.1 2840 10.1
*CI, carbonaceous chondrites, a class of meteorite.

Chemical Evolution 7
the entries in the table that the relatively sizable(about 1%) concentrations of Ar shown in Fig. 1.1for the present-day atmospheres of Earth and Marsare composed almost entirely of the radiogenic40Ar isotope.
In comparison with solar abundances, on amass per unit mass basis, the Earth’s atmosphere isdepleted of 36Ar by a factor of more than two mil-lion, while for 20Ne the depletion is 220 million.The depletions are even more strongly emphasizedby Fig. 1.2, in which the normalization allows forthe enormous solar masses of hydrogen andhelium. On Earth, 20Ne and 36Ar are depleted by afactor of nearly 1011 and 109, respectively, on thismeasure, but for carbon, much of which is boundup in involatile compounds, the depletion by a fac-tor of 105 is much less. Evidence of this kind istaken as clear proof that Earth has lost almost allits primordial atmosphere, if such an atmosphereexisted at all, and that the present atmosphere hasbeen acquired later. It was once supposed that thedepletion of noble gases would be even moremarked for the hotter planet Venus, but that Mars,having formed in a cooler part of the solar system,might have retained more of its primordial compo-nents. The Viking mission (1976) dispelled thatidea for Mars, as can be seen in Table 1.1. Naturalisotopes of argon and neon are even more deficienton Mars than on Earth, and the radiogenic isotopesrelatively more important. Pioneer–Venus (1978)showed that the Mars results were not a freak, butthat there was a real tendency for there to begreater abundances of the noble gases in the atmos-pheres of the planets closer to the Sun. Table 1.1shows that the abundance of 20Ne relative to 36Aris comparable on the three planets (in the range 0.1to 0.3), but much less than the solar ratio (about25). The planets’ patterns of abundances of thenoble gases seen in Fig. 1.2 are very obviously dif-ferent from the Sun’s; on the other hand, the plane-tary atmospheres show similar patterns, but againdemonstrate the decreasing primordial gas residueon the planets at greater distances from the Sun.The depletions relative to solar abundances aregreatest for the lightest elements. Carbon is muchless depleted on the planets than are the noblegases.
The atmospheres of Venus, Earth, and Mars arethus clearly shown not to be primordial remnants.One remaining question, however, is why the pat-terns of rare gas abundances are so different on theplanets compared with the solar abundances.There is apparently some discrimination in favorof the higher mass elements on the planets. What ismore, there is also a strong hint of mass discrimi-nation even between isotopes, as in the case of the20Ne/22Ne ratios (Table 1.1), where the planetaryratios are distinctly smaller than the solar ones.Has there, after all, been escape of the noble gasesfrom the planets that has favored the retention ofthe heavier elements and the heavier isotopes?Shizgal and Arkos (1996) have reviewed the ways inwhich gases escape from the atmospheres ofVenus, Earth, and Mars. Ordinary thermal (Jeans)escape does not appear to be able to explain the observations. Planetary atmospheres can be erod-ed by impacts with bolides (Ahrens 1993; Newmanet al. 1999). Another highly plausible idea (Hunten1993; Pepin 1997) is that a rapid hydrodynamicoutflow (or blowoff) of a light gas can drag with itquantities of a heavier gas. The rate of such aprocess depends (in a negative sense) linearly onthe mass of the heavier gas, rather than exponen-tially as in thermal escape. Suitable driver gasesmight be H or H2, but there is no certainty that therequired driver flow ever existed. One possibilityinvolves photodissociation of water vapor byshort-wavelength ultraviolet light. Young stars(the “T-Tauri” stars), which resemble the Sun atthe age of a few million years, emit 103–104 times asmuch ultraviolet radiation as the present Sun(Canuto et al. 1982, 1983b; Zahnle and Walker1982), so that the Sun could have provided suffi-cient energy at the appropriate period. Further-more, there may well have been much water vaporin the atmosphere at the same time, as we discussat the end of the present section.
Hypotheses (i) and (ii) presented above argue forgravitational capture and retention by the planetsafter their formation either of gases of the primor-dial solar nebula or of the solar wind that hasflowed over them during their lifetimes. Thedifferences in ratios of noble gases between the Sun and the planets are evidence against these

8 richard p. wayne
mechanisms. Substantial numbers of small bodieshave impacted with the planets of the inner solarsystem over the planetary lifetimes, and thecomet–asteroid hypothesis (iii) proposes that at-mospheres were brought to the planets as a resultof such impacts (Deming 1999). However, Venusand Earth have a roughly equal chance of encoun-tering comets and asteroids, yet Earth has nearlytwo orders of magnitude less 36Ar on a mass formass basis than Venus, thus suggesting that thecomet–asteroid hypothesis cannot account for asubstantial proportion of the present-day atmos-pheres (but see later). The remaining hypothesis(iv), which is that volatile materials were incorpo-rated into the planet as it accreted, thus seems themost probable. If the planetesimals that formedthe planets contained small amounts (perhaps afraction 10-4 by mass) of volatile materials, thengases could be released from within the planet as itheated up (as a result of the accretion process itself,of impacts of infalling bodies on the unprotectedsurface, and of decay of short-lived radioactive ele-ments). Minerals containing bound H2O woulddissociate, and physically trapped componentswould become degassed (Pepin 1987; Zahnle et al.1988; Tajika 1998). One explanation for the largeexcess of nonradiogenic noble gases on Venus com-pared to Earth could be that the planetesimals thatformed Venus were exposed to an intense solarwind that was absorbed before it reached the part ofthe solar system where Earth (or Mars) formed. Inthis context, it is interesting that the pattern ofnoble-gas abundances for Venus (Fig. 1.2) shows ahint of a solar modification of the Earth’s pattern;too much emphasis should not be given to this ob-servation, however, since it hinges on a disputedabundance for 84Kr.
An objection to the accretion hypothesis (iv)arises because of one of the most satisfactory theo-ries (Benz et al. 1986, 1987) on the origin of theEarth–Moon system, according to which a body ofnearly the size of Mars collided with the proto-Earth to melt both the impactor and most of theEarth’s mantle. This very early catastrophic eventwould necessarily mean that almost all the waterand other moderately volatile compounds thataccreted with the Earth would have been lost to
space. In these circumstances, a variant of thecomet–asteroid hypothesis has received renewedsupport. The gaseous components of present-daymeteorites are of interest because they may reflectthe composition of the primitive materials out ofwhich the planets accreted, as well as providing anindicator of the materials present in the solar sys-tem that are available for impact degassing (as re-quired by the comet–asteroid hypothesis). For thisreason, gas composition data for one importantclass of meteorite are presented in Table 1.1. Thestriking similarity in the 20Ne/36Ar ratios for theCI chondrites and the planetary atmospheres hasprompted speculation that there may have been asingle type of parent gas reservoir, with the presentsmall spread of abundances determined by evolu-tionary processes. One group of models (Javoy1998) based on this idea envisages volatile-richplanetesimals accreting relatively late to form a“veneer,” resembling the composition of carbona-ceous chondritic meteorites, on the planetary sur-face, although the details of the true origin of theveneer are not firmly established (Lewis and Prinn1984). However, the measured isotopic ratios posesevere constraints on a single type of volatile massdistribution. The ratio of 20Ne/22Ne is significant-ly higher in the Venusian than the terrestrial at-mosphere (and than the ratio for CI chondrites), asshown in Table 1.1, and the ratio of 36Ar/38Ar onMars is anomalously low compared with thatfound on other bodies of the solar system. It seems,then, that the similar elemental but disparate iso-topic compositions cannot be a result of accretionof planetesimals with constant inventories ofvolatile species, at least if the compositions wereto resemble those of present-day meteorites. Theexplanation of the similarities, as well as thedifferences, of atmospheric composition musttherefore be a coincidental result of the fraction-ation and mixing processes that operated, bothbefore and after accretion. Escape of early solar-composition atmospheres from planetesimals andplanets is currently thought to be the most likelymechanism that could have achieved the requisitefractionation. Whatever the detailed processesturn out to be, it is clear that the new atmosphericmeasurements obtained by the planetary missions

Chemical Evolution 9
have provided the basis for reasonable specu-lation about the origins of the planets and theiratmospheres.
The way in which the inner planets heated upafter they had accreted has a bearing on the compo-sition of the earliest atmospheres if the atmos-pheres were primarily outgassed (Tajika 1998)from the planets themselves (hypothesis iii). If therate of accretion was sufficient that melting occurred as the planet was forming, then, at leaston Earth, iron could migrate to the core, leaving an iron-free silicate mantle in an inhomoge-neous process (Walker 1976). The alternative, thehomogeneous accretion model, proposes that the heating and differentiation of the Earth tookplace after the accretion itself. At present, the inhomogeneous model is more widely acceptedthan the homogeneous model. The importance forthe atmosphere is that the presence or absence ofiron in the mantle would determine the oxidationstate and composition of the volatiles that out-gassed (Levine 1985). With iron present, reducedcompounds such as CH4, NH3, and H2 wouldbe expected, whereas with outgassing through amantle that was already differentiated, or from aveneer, the probable species would be H2O, CO2,and N2.
Regardless of which gases were initially re-leased, it does not seem likely that the reducedgases could survive for long in the early atmos-phere. Molecular hydrogen, like helium, is able toescape the gravitational attraction of the Earth(Hunten 1990) and this process could account forthe loss of almost all H2 as long as there wereadequate heat sources in the upper atmosphere(Walker 1982). Photochemical processes are likelyto transform both NH3 and CH4, the primary stepsbeing
(1.1)
(1.2)
In addition, OH radicals would be formed photo-chemically if any H2O were present in the atmos-phere, and both NH3 and CH4 are attacked by OH(to yield NH2 and CH3). The lifetime of NH3against photolysis is very short (Kuhn & Atreya
CH CH H nm4 2 2 145+ Æ + £hn , l
NH NH H nm3 2 230+ Æ + £hn , l
1979), ranging from less than a day to a few years,depending on the assumed mixing ratio. Above analtitude of about 100km, the lifetime of CH4against photolysis is also only a few days (Levine etal. 1982), but other gases (particularly H2O) shieldCH4 from photodissociation at lower altitudes. Reaction with OH is then the major loss processfor CH4, and lifetimes even for trace quantities ofCH4 are estimated (Levine et al. 1982) to be about50 years. Thus, in the absence of a continuoussource of the gases, the abundances of these re-duced species must have been low. Rocks from aslong ago as 3.8 ¥ 109 years (from Isua, in WestGreenland) consist of highly metamorphosed sedi-ments that show that abundant CH4 was not pres-ent when they were formed. Sagan and Chyba(1997), on the other hand, argue that atmosphericmethane could have been kept at relatively highconcentrations, either as a result of a recyclingprocess or, after life had been established, by theformation of the gas by methanogenic microorgan-isms. These workers pursue the argument further,by suggesting that CH4 photochemistry couldhave led to the formation of a high-altitude ab-sorbing layer of organic solid aerosol that in turn could have protected NH3 from rapid photolysis.While this view is not widely accepted, it must be considered as a possibility, especially as it hasimplications for both greenhouse heating and the intensities of ultraviolet radiation reaching the surface of the Earth. Both these topics aretouched on again later in this chapter (Sections 1.6and 1.8).
1.3 THE EARTH’S ATMOSPHEREBEFORE LIFE BEGAN
Section 1.2 outlines the principles that are thoughtto have applied to the acquisition of primitivesecondary atmospheres by Venus, Earth, and Mars.For Earth, the most likely scenario, according toKasting (1993), is that it formed relatively rapidly(over a period of 107–108 yr), that its interior washot initially as a result of a large number of impactevents, and that the core was probably formed asthe planet accreted. Metallic iron could have been
10 richard p. wayne
removed from the upper mantle, and volcanicgases could have been relatively oxidized as earlyas 4.5GyrBP (Kasting et al. 1993). Impact probablyled to the release of many of the Earth’s volatile ma-terials, and thus to a transient atmosphere veryheavily laden with water vapor. Infalling iron-richplanetesimals in this phase of planetary accretionwould have led to the reduction of water to form co-pious amounts of H2, as required by the postulatepresented earlier of hydrodynamic-outflow frac-tionation of the noble gases. After the end of themain accretionary phase, the water-vapor atmos-phere would have condensed out to form theoceans, thus making possible the conversion ofCO2 in the atmosphere to carbonate rocks such aslimestone and dolomite, to be discussed shortly.Most current models predict that the early atmos-phere consisted mostly of CO2, N2, and H2O, alongwith traces of H2 and CO. Such models are based onthe assumption that the redox state of the uppermantle has not changed, so that volcanic gas com-position has remained approximately constantwith time. Kasting et al. (1993) argue that this as-sumption is probably incorrect. They believe thatthe upper mantle was originally more reduced thantoday, although not as reduced as the metal-arrestlevel, and has become progressively more oxidizedas a consequence of the release of reduced volcanicgases and the subduction of a hydrated, oxidizedseafloor. Data on the redox state of sulfide andchromite inclusions in diamonds imply that theprocess of mantle oxidation was slow, so that re-duced conditions could have prevailed for as muchas half of the Earth’s history. Other oxybarometersof ancient rocks give different results, so that thequestion of when or if the mantle redox statechanged remains unresolved. Mantle redox evolu-tion is intimately linked to the oxidation state ofthe primitive atmosphere: a reduced Archean at-mosphere would have had a high hydrogen escaperate and should correspond to a changing mantleredox state, while an oxidized Archean atmos-phere should be associated with a constant mantleredox state.
The estimated abundance of carbon that accu-mulated in the crust of the Earth would be suffi-cient to produce a partial pressure of 60–80atm if it
were all in the atmosphere in the form of CO2(Kasting 1993). Speculative reconstructions of theclimates of the past have been used to infer whatthe partial pressure might really have been (Walker1985; Durham & Chamberlain 1989; Worsley &Nance 1989; Morrison & Owen 1996). The “recon-struction” in Fig. 1.1, reported by Morrison andOwen (1996), puts the entire burden into the at-mosphere, while Durham and Chamberlain (1989)suggest a partial pressure of 14atm. Whatever theoriginal load, there is only about 3.5 ¥ 10-4 atm inthe contemporary atmosphere. The remainder isnow incorporated mainly in the carbonate rocks,with a little dissolved in the oceans: the partition-ing between atmosphere, hydrosphere, and litho-sphere is now roughly 1 :50 :105. A most importantaspect of atmospheric evolution on the Earth isthus how atmospheric CO2 might be converted tosolid carbonates. Inorganic weathering reactions(Wayne 2000) can convert silicate rocks such asdiopside (CaMgSi2O6) to carbonate
(1.3)
Although this aspect is getting rather ahead of thestory, we ought to note here that even apparentlyabiological changes such as this weathering can bemodulated by biological influences. Partial pres-sures of CO2 in the soil where weathering occursare 10–40 times higher than the atmospheric pres-sure, and these high partial pressures are main-tained by soil bacteria. Thus, when appropriateorganisms had developed, conversion rates couldbe greatly enhanced. In addition, of course, a fur-ther most important source of carbonate mineralsis secretion by animals and plants, and the deposi-tion of calcite (CaCO3) shells. Life thus exerts anextremely significant influence on the removal of CO2 from the atmosphere. Formation of car-bonates, and the evolution of life itself, have in common the need for liquid water, so the nonatmospheric reservoirs for CO2 on the Earthseem linked to the presence of the liquid phaseover geological time. We return later to the ques-tion of the evolution of CO2 concentrations.
CaMgSi O CO MgSiO CaCO SiO2 3 26 2 3+ + +∫

Chemical Evolution 11
1.4 COMPARISON OF VENUS,EARTH, AND MARS
The composition and the chemical and physicalbehavior of the atmospheres of Venus (Schubert &Covey 1981; Krasnopolsky 1986; Yung & DeMore1999) and Mars (McElroy et al. 1977; Krasnopolsky1986; Yung and DeMore 1999) provide furtherevidence about the evolution of our own atmos-phere. Comparisons (Dreibus & Wanke 1987;Prinn & Fegley 1987; Kasting 1988; Durham &Chamberlain 1989; Hunten 1993) of the three at-mospheres, in particular, show how the emergenceof life on Earth modified our atmosphere dramati-cally from the atmospheres of our two planetaryneighbors.
We have already seen how the compositionsand surface pressures of the atmospheres of thethree planets differ markedly (Fig. 1.1). The surfacetemperatures are also very different: 732, 288, and223K, for Venus, Earth, and Mars respectively.
The temperatures can be interpreted in terms of the atmospheric compositions and pressures.Carbon dioxide and water vapor are both “green-house” gases. That is, they trap infrared radiationthat would otherwise escape to space, and raise thetemperature at the surface of the planet (Goody &Yung 1989; Wayne 2000). An estimate can be madeof the temperatures that would be experienced onthe planets without any atmosphere at all. A sim-ple radiative equilibrium calculation, taking intoaccount differing reflectivities of the planets,would suggest values of 227, 256, and 217K, some505, 32, and 6K less than found, listed in the orderVenus, Earth, Mars.
Because of its relative closeness to the Sun,Venus may have suffered from a “runaway green-house effect” in which a positive feedback processultimately led to vaporization of all surface water(Pollack 1969; Kasting 1988). Water vapor makes asizable contribution to atmospheric heating. Sincevapor pressures rapidly increase with increasingtemperature, thus further increasing trapping,there exists a mechanism for positive feedback inthe greenhouse effect. Evaporation from a plane-tary surface will proceed either until the atmos-phere is saturated with water or until all the
available water has evaporated. What happens onany particular planet will depend on the startingtemperature in the absence of radiation trapping,since that will decide whether the vapor ever be-comes saturated at the temperatures reached. OnMars and the Earth, the additional heating due toliberation of water vapor is not sufficient to pre-vent the vapor reaching saturation as ice or liquid.However, on Venus there comes a critical vaporpressure (~10mbar) when the rate of heating beginsto increase dramatically: that vapor pressure isnever reached at the lower temperatures on Earthor Mars. As a result, the P–T curve for the atmos-pheric water vapor increases more slowly thanthat for the vapor–liquid phase-equilibrium curve.Condensation never occurs on Venus, and addi-tional burdens of H2O serve to increase thetemperature even further. Certainly this positivefeedback mechanism would explain why there isno surface water on Venus at the present day. Largeamounts of water vapor could have been the domi-nant species in the early Venusian atmosphere, butphotodissociation and escape of hydrogen to spacewould have removed most of the H2O to leave therather dry atmosphere now found (Hunten 1990,1993). Venus contains quantities of carbon and nitrogen similar to those on Earth, but hydrogen is deficient. Water abundance on Venus is about 42kgm-2 compared with 2.7 ¥ 106 kgm-2 onEarth. There is certainly no liquid water on thesurface of Venus today, and the mixing ratio forwater in the atmosphere is probably not more than 2 ¥ 10-4.
Most mechanisms identified as potentiallyimportant for escape of hydrogen from Venusdiscriminate strongly against loss of deuterium,because of the large escape velocity (10.3kms-1)from that planet. Enrichment of deuterium mighttherefore be expected if Venus had originally pos-sessed a water-rich atmosphere. Several pieces of evidence support deuterium enrichment, al-though they are not unequivocal. The ion massspectrometer on Pioneer–Venus detected a signalat m/e = 2 from the upper atmosphere that can beattributed to D+, and interpretation of the intensi-ty data would require D/H in the bulk atmosphereof ~10-2. Mass peaks at m/e = 18.01 and 19.01

12 richard p. wayne
obtained in the lower atmosphere (below 63km)with the large-probe neutral mass spectrometermay be caused by H2O and HDO (although the m/e= 19 ion could be H3O
+). If HDO is the source of the heavier ion, then D/H on Venus is (1.6 ± 0.2) ¥10-2, in agreement with the upper-atmospheric iondata. On Earth, D/H ~1.6 ¥ 10-4 overall (and per-haps twice that value in the upper atmosphere, ac-cording to Spacelab 1 observations), so that thedeuterium enrichment on Venus is 50–100, imply-ing large quantities of water in the early history of the planet. This enrichment factor is the maximum that could arise, as we shall show shortly.
Outgassing might be expected to release materials with oxidation states similar to those for terrestrial volcanic gases ([CO]/[CO2] ~ 10-2;[H2]/[H2O] ~ 10-2). However, at high Venusiantemperatures, the gas-phase equilibrium
(1.4)
and reactions such as
(1.5)
at the planetary surface would have increased theH2 content relative to H2O. Molecular hydrogenwould thus have been the dominant gas in theearly upper atmosphere of Venus.
Supersonic hydrodynamic outflow, powered bysolar ultraviolet heating, would have resulted inthe loss of H2 to space. Interestingly, this flowwould have entrained HD, thus sweeping deute-rium away, until the mixing ratio of H2 droppedbelow ~2 ¥ 10-2. Only after this limit was passedwould deuterium enrichment begin, regardless ofhow much water was originally present. Hydro-gen, in the form of water, is now present at amixing ratio of ~2 ¥ 10-4, according to the Veneraspectrophotometer data for 54km altitude. Deute-rium enrichment is thus limited to a factor of ~100,in accordance with the apparent measured value.The escape rate calculated for loss of H2 wouldhave exhausted the equivalent of the Earth’soceans in about 280 million years.
2 3FeO H O Fe O H2 2 2+ Æ +
CO H O CO H2 2 2+ +∫
As the Venusian atmosphere progressed towardits contemporary water vapor content, additionalhydrogen loss processes probably began to operate.Translationally “hot” hydrogen atoms can escapeif their velocities exceed 10.3kms-1, and can begenerated on Venus by elastic collision between“hot” O* and ambient H
(1.6)
A source of O* on Venus is dissociative recombina-tion of molecular oxygen ions, which can provide239kJmol-1 excess translational energy, corre-sponding to a velocity of ~5.5kms-1. Approxi-mately 15% of collisions between H possessingthermal velocities (at 300K) and O* will produceH* in reaction (1.6) with speeds in excess of the10.3kms-1 escape velocity. Mariner 5 Lyman-a (Hresonance) airglow observations showed that thereis an H-atom component with an effective temper-ature of 1000K in addition to the atoms that arethermally equilibrated at 300K. Escape via thiscollisional mechanism could have reduced thehydrogen content from 2% to the contemporary0.02% in about 4.2Gyr. Probably both hydro-dynamic and ionic-collisional mechanisms oper-ated at the higher hydrogen abundances, with thehydrodynamic loss becoming less important as thewater vapor content approached its present level.Whatever the detailed mechanism, the deuteriumenhancement suggests that Venus was once muchmoister than it is now. The contemporary D/Hratio does not provide evidence for the loss of several oceans’ worth of water, although detailedmodels of escape of hydrogen suggest that largequantities of water might once have been present.Massive loss of hydrogen from water brings with it the problem of disposal of the oxygen. It may bethat the oxygen escaped to space along with the hydrogen; alternatively, oxidation of surface material would provide a plausible sink if the sur-face were molten. Another problem concerns thepresent-day escape of hydrogen from the atmos-phere of Venus. Calculations put the time taken to exhaust hydrogen from the atmosphere at thecontemporary escape rate at between 500 and 1500Myr.
O H O H* *+ Æ +

Chemical Evolution 13
The longer time is perhaps compatible with agradual depletion of water over the life of the plan-et, but if the shorter time is correct, then the impli-cation is that water is being replenished as fast as itescapes. Such replenishment could be provided byoutgassing from the planetary interior (and possi-bly by cometary impacts). Mixing ratios for watervapor drop by a factor of about five between 10kmaltitude and the surface, suggesting that there is alarge flux of water from the atmosphere into thesurface, which could nearly balance a relativelylarge flux of juvenile water from the interior. Sub-stantial oxidation of the surface would be expectedwith large water fluxes through it, and some re-sults (e.g. from Venera 13) indicate the presence ofFe(III) minerals that are consistent with a relative-ly highly oxidized surface.
Mars presents a sharp contrast. Surface chan-neling features suggest strongly that there wasonce liquid water on the surface. There seems to beno liquid water now, but there is water vapor in theatmosphere and clouds are observed. The polarcaps (and much of the winter hemisphere) arecovered with water ice, and the winter polar capprobably contains solid CO2 as well. The escapevelocity for relatively small Mars is less than one-half (and the energy required for escape thus lessthan one-quarter) of that for either of the two largerplanets. A large proportion of the outgassed speciescan therefore have been lost from the Martianatmosphere.
Mariner airglow data showed exceptionallylarge scale-heights in the upper atmosphere ofMars of oxygen (at mixing ratios of 5 to 10 ¥ 10-3)and hydrogen (at an almost constant concentrationof 3 ¥ 104 atomcm-3), indicating clearly that theseatomic species are escaping the gravitational fieldof the planet at the present day. The exobase lies at~230km on Mars. Although temperatures are rela-tively low (~320K), thermal escape of hydrogen ispossible because of the small value of g, and henceescape velocity, on Mars (~5kms-1). Escape fluxesof about 1.2 ¥ 108 atomcm-2 s-1 of hydrogen arepredicted for the measured concentration of 3 ¥104 atomcm-3. That any hydrogen remains in theexosphere therefore implies the existence of anequivalent source, presumably dissociation of a
hydrogen-bearing molecule such as H2O, that iscurrently operating in the Martian atmosphere.The four H atoms are liberated through the inter-mediacy of ionic processes. Furthermore, O-atomescape also involves ions, and the rates of oxygenand hydrogen escape processes are self-regulatingto be equivalent to loss of H2O. Indeed, ionicprocesses are capable of forming not just H and Oatoms, but C and N atoms as well, that possessmore than the Martian escape velocity. Theseprocesses are all “dissociative recombinations” ofthe type
(1.7)
in which the ionization energy of the AB moleculeis released to both break the A–B bond and driveapart the newly formed fragments.
On Mars, escape of the 14N isotope is slightlyfaster than that of 15N because of the lower mass(McElroy et al. 1977). With the atmosphere as thereservoir of nitrogen, the N2 remaining will havebecome slowly richer in 15N over the life of theplanet. In comparison with nitrogen on Earth,where neither isotope escapes, the Martian 15N isenriched by a factor of 1.6. It follows that Marsonce had ten or more times as much nitrogen in itsatmosphere as it has now. Continuous degassing ofnitrogen from the planet’s interior would tend tosustain the original isotopic ratio, so that the ob-served enrichment favors an evolutionary modelin which Mars acquired its nitrogen atmosphereearly in its history, with relatively little degassingin later epochs. By way of contrast to the nitrogenisotopes, the Martian 16O/18O ratio is almostexactly the same as that for Earth, and 18O has beenenriched by less than 5%. Yet Mars is losing Oatoms at present at the rate of 6 ¥ 107 atomss-1 forevery square centimeter of surface. Lack of 18O en-richment implies a source of “new” oxygen, in areservoir holding at least 4.5 ¥ 1025 atomscm-2,presumably in the form of H2O, since the escape ofhydrogen and oxygen from Mars is constrained to have a 2 :1 stoichiometry. There is, however, apparently an enrichment of D over H by a factor of about five over the terrestrial value. If D/H forjuvenile water on Mars is the same as that for the Earth, the observed enhancement must be
AB A B+ + Æ +e

14 richard p. wayne
explained by a divergent history of atmosphericevolution on the two planets. Several steps in theescape of hydrogen favor loss of H over loss of D,but, even so, the observed enrichments can only beattained if some of the (D-enriched) atmosphericwater can exchange back with the condensedphase. Model calculations, based on the assump-tion that D/H in primordial Martian H2O is thesame as the terrestrial value, imply an initial reser-voir of hydrogen equivalent to a layer of waterabout 3.6m thick, most of which has escaped, toleave a present-day residue that is 0.2m thick. Thecalculations assume, amongst other things, thatthe escape rate has remained constant over geolog-ical time. Nevertheless, the required exchangeablesurface layer thickness is almost two orders ofmagnitude less than geological inventories ofsubsurface water, so that the postulated loss is not unreasonable. Presumably, the much weakerfractionation between 18O and 16O compared withthat between D and H has prevented a measurableenhancement of the heavier oxygen isotope evenin the presence of exchange with a modest surfacereservoir.
Water on Earth is particularly interesting. Geological evidence (Worsley & Nance 1989) sug-gests that the waters of the ocean have neithercompletely frozen nor completely evaporated forat least the past 3.5 ¥ 109 years. Yet the infrared luminosity of the Sun has increased substantiallyover that period (Gilliland 1989; Sagan & Chyba1997), leading to the so-called “faint young Sunparadox” to which we return in Section 1.6 when we examine CO2 concentrations in moredetail. Thermostatic control seems to have beenexerted by a reduction of the concentration ofgreenhouse gases in the Earth’s atmosphere, proba-bly effected directly or indirectly by the biota. Suchcontrol is, of course, looked at closely by the propo-nents of the Gaia hypothesis (Section 1.5). In theabsence of water on Venus, carbonate rocks haveprobably never been formed, and most of the car-bon dioxide remains in the atmosphere. The totalburden of CO2 is not much different on the Earthfrom that on Venus; it is just the distribution be-tween reservoirs that differs. The total amounts ofatmospheric nitrogen in the atmospheres of Venus
and the Earth are not dissimilar, either, if the totalpressures of the atmospheres are taken into account. The much greater solubility of nitratescompared with carbonates means that much lessnitrogen than CO2 has been deposited as solid minerals on the Earth, and the atmosphericamounts are closer to those released by outgassing.Some CO2 on Mars may be stored as solid at thewinter poles, but the atmosphere also seems tohave undergone much more physical evolutionover geological time than the atmospheres ofVenus or Earth as a result of the relatively small es-cape velocity.
1.5 LIFE AND THE EARTH’SATMOSPHERE
Our atmosphere appears not to obey the laws ofphysics and chemistry: it is a disequilibrium mix-ture of chemical species (Lovelock 1979; Wayne2000). Indeed, the atmosphere is like a low-temperature combustion system, and it contains a variety of easily oxidizable substances, such asH2, CH4, CO, H2S, and hundreds of other minorconstituents in the presence of molecular oxygen.Even the nitrogen and oxygen, the major com-ponents of the atmosphere, are not in thermo-dynamic equilibrium.
The key to the apparently anomalous composi-tion of the atmosphere is the existence of livingorganisms: the biota bring about the entropy reduction by utilizing solar energy. Photosynthe-sis, as we shall see in Section 1.7, is the only mech-anism that can account for the relative abundanceof oxygen in our atmosphere. Other biologicalprocesses, most often microbiological, releasemany fully or partially reduced compounds to theatmosphere. Within the atmosphere itself, photo-chemical transformations convert the substancesreleased biologically, so that photochemistry playsa central part in maintaining the disequilibrium ofthe atmospheric gases. It is highly instructive toexamine what the probable composition of our atmosphere would be like if life were not present.The present-day and “reconstructed” atmos-pheres for the Earth displayed in Fig. 1.1 provide

Chemical Evolution 15
the comparison for CO2, N2, and O2. Figure 1.3 il-lustrates the differences in more detail: it gives themixing ratios for several gases actually found inour atmosphere, and those that might be expectedif life were absent. Bearing in mind that the scale ofthis diagram is logarithmic, the enormous influ-ence of the biota is immediately evident. Oxygenconcentrations are at least one thousand timessmaller than they are in the contemporary atmos-phere (they are probably much lower again, asdiscussed in Section 1.7). The reduced compoundssuch as CH4 and H2 are virtually absent, and theonly readily oxidizable species is CO, which onthis view is more abundant in the absence of life(low O2) than in its presence.
Earth’s atmosphere has a composition that is influenced by the biota, as just outlined. Con-versely, atmospheric composition is of evidentimportance for the biota. Feedbacks of this kindare frequently found in atmospheric chemistry.The composition, temperature, and pressure of theatmosphere can each be modulated in response to
biological activity, and these atmospheric parame-ters themselves have consequences for that activ-ity. Temperature, for example, is determined in part by the “greenhouse” heating afforded byatmospheric CO2; the partial pressure of CO2 inthe atmosphere is strongly dependent on photo-synthetic activity (short term) and chemicalweathering of silicate rocks (long term), which arethemselves sensitive to temperature.
It is observations of these feedbacks that haveled Lovelock and coworkers (Lovelock & Margulis1974; Lovelock 1979, 1988, 1989; Volk 1998) totheir “Gaia hypothesis.” They see the interactionbetween life and the atmosphere as so intense thatthe atmosphere can be regarded as an extension of the biosphere: although the atmosphere is notliving, it is a construction maintained by thebiosphere. The Gaia hypothesis postulates that theclimate and chemical composition of the Earth’ssurface and its atmosphere arc kept at an optimumby and for the biosphere. Naturally, this idea does not receive universal acceptance, and many
Fraction
N2
O2
CO2
CH4
NH3
HCI
N2O
H2
CO
Life presentLife absent
1 110–2
10–2
10–4
10–4
10–6
10–6
10–8
10–8
Fig. 1.3 Life’s influence on Earth’s atmosphere. The diagram shows, on a logarithmic scale, the mixing ratios for themajor gases and some significant trace species found in our atmosphere in the presence of life and those expected in itsabsence. (From IGBP 1992, adapted from Margulis & Lovelock 1974.)

16 richard p. wayne
workers have argued (Kirchner 1989) that the closelinks between atmosphere, oceans, and biospheredo not necessarily imply the existence of an adap-tive control system. Nevertheless, the concept ofGaia forms an interesting framework for the dis-cussion of the evolution of the atmosphere, theevolution of life, and the possible relationship between them.
Life is unlikely to have originated, or at leastpersisted, on Earth immediately after the main accretionary phase had ended (Kasting 1993). Sig-nificant numbers of impactors as large as 100kmin diameter continued to hit the Earth during theperiod of “heavy bombardment” which lastedfrom 4.5 to 3.8GyrBP, and, until 3.8GyrBP, the up-permost layers of the ocean would probably havebeen vaporized repeatedly by the impacts (Sleep etal. 1989). Sterilization of the planet would there-fore have precluded the survival of life on Earth,even if it had appeared any earlier (Oberbeck & Fogelman 1989). Nevertheless, by 3.5GyrBP lifewas almost certainly extant (Schopf 1983, 1999;Schopf & Packer 1987; Oró et al. 1990; Kasting1993). There is ample morphological evidence that documents the existence of microbiota in sediments that have not been metamorphosed(Oró et al. 1990). According to Schopf (1999), theoldest fossils meeting the criteria for dating authenticity are from 3.465GyrBP, and were foundin the Apex chert of northwestern Australia. Theyconsist of 11 types of prokaryotic threadlike organ-isms, and include several types of cyanobacteriathat produce and consume oxygen. The extraordi-nary conclusion is that these most ancient of iden-tified fossils are of organisms that were alreadysurprisingly advanced, and they certainly suggestthat life was established well before their forma-tion. Circumstantial support for the evidence isgiven by several discoveries of stromatolites fromthe same period: these organo-sedimentary struc-tures are similar to mats produced by present-daycyanobacteria, and microbial communities seemto have played an active role in their formation(Margulis et al. 1980; Schopf 1999). There is evenindirect evidence (Schopf 1983) that life existed 3.8GyrBP, although supposed microfossils from
the Isua sedimentary deposits of this date mayhave nonbiological origins, and carbon-isotope indicators of biological activity in the same deposit may have been affected by metamorphicprocesses (Oró et al. 1990). Notwithstanding thesereservations, Mojzsis and coworkers (Mojzsis et al.1996, 1997; Eiler et al. 1997; Nutman et al. 1997)argue that their ion-microprobe measurements of carbon isotopes are indeed consistent withgraphitic microdomains of bio-organic origin. Theoldest samples come again from Isua in WestGreenland (3.8Gyr old) and from the neighboringisland of Akilia (3.85Gyr old: the oldest sedimentsyet documented). Holland (1997) has provided auseful critique of the use of geochemical data ofthis kind in tracing the evidence for life on Earth sofar back. However, it does seem possible that therecord of life on Earth may extend back more than3.85Gyr.
Because the origin of life must have dependedon the prior existence of organic species, there haslong been intense interest in the possible conver-sion of atmospheric gases to simple organic mole-cules. Among the early experiments, those ofMiller (1953) aroused much interest, because itwas shown that simulated lightning dischargespassed through mixtures of methane and ammoniaproduced a wide range of organic compounds thatincluded amino acids. The less reducing earlyatmosphere now thought probable (N2, CO2, andH2O, together with traces of volcanic H2 and CO:see first paragraph of Section 1.3) has more recently been shown to yield a variety of organiccompounds when subject to ultraviolet irradia-tion, although the more reducing atmospheresgenerate a greater variety of compounds in largeryield (Oró et al. 1990). Bar-Nun and Chang (1983)found that continuous irradiation at l = 184.9nmof mixtures of CO and H2O gave CO2 and H2 as themajor products, and smaller quantities of CH3OH,HCHO, and CH4. Some C2 molecules (C2H5OH,CH3CHO, and C2H6) were also observed. Wen etal. (1989) have analyzed these experiments interms of a photochemical kinetic scheme, and thesimulated abundances of most of the products arein surprisingly good accord with the experimental

Chemical Evolution 17
findings. The main steps in the main pathway in-volve photolysis of water
(1.8)
followed by termolecular addition of atomic hy-drogen to CO to yield the formyl radical (HCO),which is then the precursor of the more complexorganic molecules. Photolysis of carbon dioxide
(1.9)
is a continuous source of CO. Wen et al. (1989)have employed their scheme to predict photo-chemical production rates of the organic mole-cules in the prebiotic atmosphere to show thatsubstantial quantities of organic material could beformed in this way.
As just noted, synthesis of organic compoundsis less efficient in an environment dominated byN2 rather than by NH3. Brandes et al. (1998) havedemonstrated the mineral-catalyzed reduction ofN2 to NH3 at temperatures and pressures typical ofcrustal and oceanic hydrothermal conditions, andthey speculate that, even though the prebioticatmosphere was present predominantly as N2,exchange with a mineral-catalyzed oceanic sourcemight have provided substantial amounts of NH3 to the atmosphere. Another, rather unusual,mechanism for the fixation of nitrogen in the early atmosphere has been proposed by Navarro-Gonzalez et al. (1998). Lightning discharges insideexplosive volcanic clouds are estimated, on thebasis of experimental laboratory simulations, tohave produced as much as 109–1010 kgyr-1 of nitricoxide (NO) at 4GyrBP.
Methane seems an unavoidable requirement inany atmospheric source of prebiotic compounds.The CH4 formed in the photolysis of the CO—CO—H2O system could have supplemented thatoutgassed from the Earth. As explained at the endof Section 1.2, CH4 is unstable against photolysisand, especially, attack by OH radicals (Levine et al.1982; Levine 1985). However, the radical productsof photolysis and attack (CH2 and CH3) can them-selves participate in processes that yield more
CO CO O2 + Æ +hn
H O H OH2 + Æ +hn
complex organic species. Zahnle (1986) haspointed out an especially interesting reaction forCH2 in the prebiotic atmosphere. Atomic nitrogenmust have been abundant in the anaerobic middleatmosphere as a result of the occurrence of severalprocesses involving photodissociation and photo-ionization. Nitrogen atoms react rapidly with(triplet) CH2 to form hydrogen cyanide
(1.10)
thus opening up new vistas in organic chemistry.The chemistry of HCN in the contemporaryatmosphere is not yet completely understood(Cicerone & Zellner 1983), but it seems that themolecule is relatively unreactive. Addition of OHand reaction of the adduct with O2 presumablyleads to complete oxidation in an oxygen-richatmosphere. Photolysis of HCN
(1.11)
is followed in an oxygen atmosphere by reaction of CN with atomic or molecular oxygen and loss of the C—N bond. However, the CN radical ispartially protected in a more reducing atmos-phere because hydrogen abstraction regeneratesHCN. Under these circumstances, reactions such as
(1.12)
(1.13)
offer routes to other interesting nitrogen-containing organic species. One of the most fasci-nating aspects of these speculations is the way inwhich they parallel our understanding of thechemistry of Titan’s atmosphere (Wayne 2000),where organic photochemical aerosols and hazesare formed in an atmosphere consisting mainly ofmolecular nitrogen.
The possibility that atmospheric CH4 fluxeswere sufficient to permit occurrence of the chem-istry described has recently received encourage-ment from suggestions that there was a significant
CN C H HCCCN2 2+ Æ
CN HCN C N2 2+ Æ
HCN H CN+ Æ +hn
N CH HCN H+ Æ +32

18 richard p. wayne
extraterrestrial source of CO in the period of theEarth’s history earlier than 3.8 ¥ 109 yrBP. Kasting(1990) has estimated the effects of incomingcomets and carbonaceous asteroids, whose rate of impact would have been high early on. Thesebolides bring in CO-ice and/or organic carbon thatcan be oxidized to CO in the impact plume. The el-emental iron in ordinary chondritic impactorscould further enhance CO by reducing CO2. Nitricoxide (NO) is likely to be formed in a high-temperature reaction between N2 and CO2, andthis gas also indirectly increases the [CO] to [CO2]ratio. A photochemical model shows that, for atotal atmospheric pressure of roughly 2 atm, the[CO] to [CO2] ratio might even have exceededunity at times more than 4.0 ¥ 109 years BP.
Comets, invoked here as a source of CO, andother extraterrestrial sources have, of course, longbeen looked on as potential carriers of organic mol-ecules to the Earth (Chyba et al. 1990; Shimoyama1997; Irvine 1998), and even of life (Whittet 1997).This alternative view finds its most extreme expression in the suggestions of Hoyle andWickramasinghe, who propose that interstellarmolecules accumulated within the heads ofcomets as explained, for example, by Hoyle (1982)and by Wickramasinghe and Hoyle (1998). Chemi-cal evolution occurring a few hundred metersbelow the cometary surface is seen as progressingas far as biopolymers and microorganisms. Hoyleand Wickramasinghe even contend that some pastand present epidemics were initiated by the virus-es and bacteria falling to Earth in cometary dust(Hoyle & Wickramasinghe 1977, 1983). However,there seem to be perfectly plausible ways in whichorganic molecules can be formed from the precur-sors already present in the atmosphere, and thereare doubts about the survivability of amino acidsand nucleobases subject to the pyrolytic condi-tions to which they would be exposed (Basiuk &Douda 1999). The stages between the appearanceof the organic molecules on Earth and the appear-ance of life cannot concern us here, however fasci-nating those steps might be (Maurel & Decout1999). An excellent review of the facts and specula-tions about the origin of life is provided by Orgel (1998). Our immediate interest here is the
evolution of life after it appeared, and the influencethat it had on our atmosphere.
1.6 CARBON DIOXIDE IN EARTH’SATMOSPHERE
Both the geochemical record and the persistence oflife itself indicate that the oceans can never haveeither frozen or boiled in their entirety (Sagan andMullen 1972; Owen et al. 1979; Kasting et al. 1988;Nutman et al. 1997). Mean surface temperatureshave probably never departed from the range of5–50°C, and may have been highest at very earlyperiods. But this conclusion leads to a riddle! Stan-dard stellar evolutionary models predict that at 4.5GyrBP the Sun’s luminosity was lower than itis today by 25–30 per cent, as mentioned earlier(Gilliland 1989). We should note before proceedingfurther that speculative new models of solarphysics have led to suggestions that the Sun mayhave lost mass as it evolved. A larger initial massand luminosity would then result in larger radia-tive fluxes at the Earth’s surface than predicted bythe “standard” Sun model. The validity of such amodel has not, however, been established. On theother hand, the standard model of evolution ofsolar intensity has created the “faint young Sunparadox,” mentioned earlier, because it translatesinto a decrease of the Earth’s effective temperatureby 8%, low enough to keep sea-water frozen for ~2Gyr, if the atmosphere possessed its present-daycomposition and structure. The paradox may beonly illusory if atmospheric behavior was different3–4Gyr ago from what it is today. Explanationsproposed include changes in albedo or increases in the greenhouse efficiency. Sagan and Chyba(1997), for example, argue that NH3 concentra-tions might have been much higher than usuallybelieved (see final paragraph of Section 1.2 and thediscussion of mineral-catalyzed NH3 formation in Section 1.5), and that this gas could havecontributed to radiation trapping. Alterations inclouds could exert a negative-feedback, stabiliz-ing, effect, since lower temperatures would meandecreased cloud cover and reduced reflection awayof solar radiation (Rossow et al. 1982). Water vapor

Chemical Evolution 19
makes the largest contribution to the greenhouseeffect in the contemporary atmosphere, but it isunlikely to be the agent of long-term temperaturecontrol. Its relatively high freezing and boilingpoints render its blanketing effect prone to unsta-ble positive feedbacks by increasing ice and snowalbedo at low temperatures (further reducing tem-perature), but by increasing water vapor content at high temperatures (yet further increasing thegreenhouse effect). Whatever greenhouse gas orother mechanism kept the Earth warm, it musthave been smoothly reduced to avoid exceedingthe high-temperature limit for life. Carbon dioxideseems the most likely greenhouse gas to have ex-erted thermostatic control of our climate (Kasting1993). Negative feedback mechanisms can be iden-tified for this gas. Nonbiological control mightinclude acceleration of the weathering of silicateminerals to carbonate deposits in response toincreased temperatures. However, as discussed inSection 1.3, present-day weathering is biologicallydetermined, and the biota both sense and amplifytemperature changes. This feedback regulation ofclimate is seen by its proponents as evidence insupport of the Gaia hypothesis (Section 1.5). Thebiota both increase the partial pressure of CO2 insoils and generate humic acids. Each of theseeffects increases the rate of weathering, and thus of CO2 loss.
Temperatures were likely to be higher in thevery early history of the Earth than at present, per-haps by as much as 60°C as a global mean (Kasting1993). Nevertheless, firm evidence exists forglaciations around 2.5–2.3GyrBP, and again atabout 0.8GyrBP: according to some reports (Younget al. 1998) the earliest glaciation may even bedated back to ~2.9GyrBP. Figure 1.4 shows oneback-projection of the history of atmospheric CO2concentrations using this kind of information(Kasting 1993). A radiative–convective climatemodel was employed in the calculations, in whichradiation trapping was brought about by CO2 andby H2O (with a temperature-dependent vapor pres-sure). The constraint on the model was that it wasrequired to maintain the Earth’s mean surface tem-perature at 5–20°C at all times, and the entiresurface kept at >0°C (ice free) at all times except
during the glaciations at 2.5 and 0.8Gyr. Unfortu-nately, the probability zone (indicated by the shading) is rather wide, and encompasses concen-tration ranges of more than a factor of 100 at worst,and the zone narrows only as we approach, withina few hundred million years, the present day. Theconcentration soon after the formation of theEarth must have been >0.1atm, or 300PAL (pres-ent atmospheric level) to maintain a mean surfacetemperature in excess of freezing point, but mayhave been as high as the 70atm (2 ¥ 105 PAL)suggested by Fig. 1.1. Such concentrations seemreasonable if we accept that in the Earth’sprebiological atmosphere CO2 was a major compo-nent, as it is on Venus or Mars today. Althoughthese calculations assume a constant cloud andsurface albedo throughout, similar results are
Time before present (Gyr)
Ocean-covered Earth
Huronian glaciation(5–20°C)
30% lower solar fluxbut maintaining >0°C
TerrestrialC3 photosynthesis
Late Precambianglaciation(5–20°C)
4.5 3.5 2.5 1.5 0.5
1
10
102
103
104
CO
2 c
once
ntr
ati
on (
PAL)
Fig. 1.4 Evolution of atmospheric carbon dioxideconcentrations, given relative to the PresentAtmospheric Level (PAL). The concentrations areestimated using a radiative–convective climate modelto keep the Earth’s temperatures within the limitsmarked on the diagram, and explained in the text. More[CO2] than at present is needed early on to compensatefor a Sun whose infrared intensity had not yet built up toits full intensity. The shading represents the range ofconcentrations permitted by the various indicatorsdiscussed. (Adapted with permission from Kasting 1993.Copyright American Association for the Advancementof Science.)

20 richard p. wayne
obtained using models that allow for changes incloud albedo consequential on changes in temper-ature. Rye et al. (1995) have examined the weather-ing of paleosols (ancient soils: these were 2.75–2.2Gyr old) in an attempt to assess atmospheric CO2levels. Iron lost from the tops of the sample profileswas precipitated lower down as silicate mineralsrather than carbonate, indicating that [CO2] wasroughly 100PAL at 2.75–2.2GyrBP, just in themiddle of the range shown in Fig. 1.4 for thatperiod.
The model results just described assume thatCO2 and H2O were the only important greenhousegases present in the atmosphere. This is, indeed,likely to have been the case in the prebiotic atmos-phere, as discussed earlier. After life appeared onthe planet, gases like NH3 and CH4 could havebeen generated by several microbiological pro-cesses, and trapped additional radiation. If sub-stantial quantities of these gases were present,then CO2 concentrations might have been lowerthan those represented in Fig. 1.4 (Kasting 1993).However, this effect would be limited to the periodbefore 2GyrBP, because after then concentrationsof NH3 and CH4 would be expected to drop dra-matically in response to the oxygen that thenbecame abundant in the atmosphere. Such oxygenchanges are the subject of the next section.
1.7 THE RISE OF OXYGENCONCENTRATIONS
Oxygen concentrations can only have increasedfrom their prebiotic levels to their present-daylevels through photosynthetic generation of themolecule. The growth in atmospheric [O2] is thusclearly linked to the evolution of life on the planet,and in this section we attempt to summarize theevidence that can be used to infer [O2] at particularperiods in the past.
In the absence of life, O2 could have beenformed only by inorganic photochemistry. Photo-lysis of water vapor to form OH and H (reaction 1.8)and of CO2 to form CO and O (reaction 1.9) are themain primary steps, and secondary chemistry canlead to the formation of free O2
(1.14)
(1.15)
(1.16)
In each case, the final stage is the combination of oxygen atoms in reaction 1.16. Two importantlimitations are placed on the amount of oxygenthat can be produced. It has long been recognizedthat H2O and CO2 are photolysed by ultraviolet radiation in a spectral region that is absorbed by O2 (say at l £ 240nm for H2O, and l £ 230nm forCO2). “Shadowing” by the O2 thus self-regulatesphotolysis at some concentration. Secondly,photolyses of H2O vapor or CO2 do not, on theirown, constitute net sources of O2. Reactions 1.8and 1.14–1.16 have the effect of converting twoH2O molecules to one O2 molecule and four Hatoms. Only if atomic hydrogen is lost by exos-pheric escape is there a gain in O2, because other-wise H2O is re-formed. Addition of CO2 photolysis(reaction 1.9) to the scheme does not alter thisconclusion, since the CO product interacts rapidlywith OH
(1.17)
Water-vapor photolysis now follows a new route that involves the reaction sequence 3 ¥ (1.8) + 1 ¥ (1.9), 1 ¥ (1.17), 1 ¥ (1.14), and the netresult is
(1.18)
However, the outcome is still that for every O2molecule formed, four H atoms must be lost. Escape is thus the crucial event, and the rate is determined by the transport of all hydrogenspecies through lower levels of the atmosphere tothe exosphere. Loss of O2, for example by reactionwith crustal or oceanic Fe2+, or with volcanic H2,competes with production, and so further limitsthe amount of free O2 that can build up without the help of photosynthesis.
2H O CO 2O 4H2 H O CO2 2+( ) + +( ) Æ +3 2h hn n
CO OH CO H2+ Æ +
O O M O M2+ + Æ +
O OH O H2+ Æ +
OH OH O H O2+ Æ +

Chemical Evolution 21
Considerable difficulties arise in giving quanti-tative expression to the prebiological formation of oxygen because of uncertainties in the concen-trations of precursor molecules (H2O and CO2),temperatures, and solar ultraviolet intensities.Concentrations of CO2 might have been muchgreater before the gas was converted to carbonatedeposits, and water-vapor levels would have beenelevated had surface and atmospheric tempera-tures been higher than they are now. Young stars(the “T-Tauri” stars), which resemble the Sun atthe age of a few million years, emit 103 to 104 timesas much ultraviolet radiation as the present Sun. If enhanced solar ultraviolet intensity was avail-able during the prebiological evolutionary periodof our atmosphere, then the rates of photolysis of H2O and CO2 are greatly enhanced, and becomea significant source of O2, especially if [CO2]is high. Photochemical models developed forinterpretation of the modern atmosphere can beadapted for the paleoatmosphere by incorporatingappropriate source terms, temperature profiles,and boundary conditions. Such models suggest(Levine 1985) that prebiological O2 at the surfacewould have been limited to about 2.5 ¥ 10-14 of thepresent atmospheric level (PAL) had both [CO2]and solar ultraviolet intensities been at their current values. With 100 times more CO2, and 300 times more ultraviolet radiation from theyoung Sun, the surface [O2] calculated is ~5 ¥10-9 PAL. The geological record provides some fur-ther information about oxygen concentrations.The simultaneous existence of oxidized iron and reduced uranium deposits in early rocks (>2.2Gyrold) requires [O2] to be more than 5 ¥ 10-12 PAL, but less than 10-3 PAL; the values accommodatedboth by the model and by geochemistry thus seem to be roughly in the range 5 ¥ 10-12 to5 ¥ 10-9 PAL.
Prebiological oxygen concentrations in thepaleoatmosphere are of importance in two waysconnected with the emergence of life. Organicmolecules are susceptible to thermal oxidationand photooxidation, and are unlikely to haveaccumulated in large quantities in an oxidizingatmosphere. Living organisms can developmechanisms that protect against oxidative
degradation, but they are still photochemically sensitive to radiation at l £ 290nm. Life-formsknown to us depend on an ultraviolet screen pro-vided by atmospheric oxygen and its photochemi-cal derivative, ozone, because DNA and nucleicacids are readily destroyed. Biological evolutiontherefore seems to have proceeded in parallel withthe changes in our atmosphere from an oxygen-deficient to an oxygen-rich one. We return to thistheme in Section 1.8.
It is worth noting that, although the tiny pre-biological concentrations of oxygen preclude theexistence of a useful oxygen and ozone shieldagainst ultraviolet radiation, the low concentra-tions were probably essential in the early stages ofthe synthesis of complex organic molecules thatbecame the basis of life. Organic molecules are sus-ceptible to thermal oxidation and photooxidation,and could not have accumulated in large quan-tities in a strongly oxidizing atmosphere. Livingorganisms are known to develop mechanisms andstructures that protect against oxidative degrada-tion, and so are able to survive in atmospheres con-taining large amounts of oxygen. At about 1% ofPAL, organisms can derive energy from glucose byrespiration rather than by anaerobic fermentation,and they gain an energy advantage of a factor of 16.However, the fact remains that oxygen is toxic,and organisms have to trade off the energy advan-tage against the need to protect themselves fromthe oxidant.
Photosynthesis is now the dominant source ofO2 in the atmosphere. For the purposes of the pres-ent discussion, this complex and fascinating pieceof chemistry can be represented by the simplifiedequation
(1.19)
The essence of the process is the use of photo-chemical energy to split water and thus to reduceCO2 to carbohydrate, shown here as (CH2O)n. Iso-tope experiments show that photosyntheticallyproduced O2 comes exclusively from the H2O andnot from the CO2. According to one estimate(Wayne 2000), photosynthesis releases 400 ¥1012 kg of oxygen annually at present. Since the
n n mh nnCO H O CH O O2 2 22 + + Æ ( ) +n

22 richard p. wayne
atmosphere contains about 1.2 ¥ 1018 kg of O2,the oxygen must cycle through the biosphere inroughly 3000 years.
It is important to realize that substantial con-centrations of oxygen can build up in the atmos-phere only if the carbohydrate formed in thephotosynthetic process is removed from contactwith the atmospheric oxygen by some form of bur-ial. Without such burial, spontaneous oxidationwould rapidly reverse the changes brought aboutby photosynthesis. In the contemporary atmos-phere, marine organic sediment deposition buriesabout 0.12 ¥ 1012 kgyr-1 of carbon, and so releasesabout 0.32 ¥ 1012 kgyr-1 of O2. At that rate, atmos-pheric oxygen could therefore double in concentra-tion in about 4 ¥ 106 years. There are balancingprocesses, including geological weathering (e.g. of elemental carbon to CO2, sulfide rocks to sulfate, and iron(II) rocks to iron(III)) and oxida-tion of reduced volcanic gases (e.g. H2 and CO).Nevertheless, marked variations in atmosphericO2 are likely to have occurred over geological time,and such changes are a central theme of thissurvey.
The rise in [O2] from its prebiotic levels hasgenerally been linked to the geological time scaleeither on the basis of the stratigraphic record (see,for example, Fleet 1998; Lecuyer & Ricard 1999;Rasmussen & Buick 1999) of oxidized and reducedmineral deposits (including information about iso-tope ratios) or from fossil evidence combined withestimates of the oxygen requirements of ancientorganisms. Evolution of the climate system(Walker 1990) is likely to have influenced the com-position and mineralogy of sedimentary rocks. InSection 1.5, we saw that attempts had been made(Walker 1985; Durham & Chamberlain 1989;Worsley & Nance 1989) to use paleoclimatologicalevidence to suggest the history of [CO2] in theEarth’s atmosphere. It has become increasingly ap-parent (Kasting 1987) that changes in atmospheric[O2] and [CO2] must be studied alongside eachother, and that it is necessary to have a reliableestimate of past [CO2] in order to correctly inferpast values of [O2].
As suggested in Section 1.5, living organismshave been present on our planet from a very early
stage, and perhaps from as long ago as 3.85GyrBP.From that time on, there has thus been a potentialphotosynthetic source of O2 which could lead to anincrease of atmospheric concentrations over theirvery low prebiotic levels. Cloud (1972, 1983) notedthat redbeds, which contain some iron in thehigher oxidation state, III, are absent before roughly 2GyrBP, and that reduced minerals, suchas uraninite, were generally formed before thisdate. Banded-iron formations (BIFs), which con-tain iron (II) rather than iron (III), were also formedonly up until about 1.85GyrBP. An anoxic deepocean is apparently required for the deposition ofBIFs in order that iron can be transported over largedistances as iron (II). Much evidence has now accu-mulated to confirm that there was a large change inatmospheric O2 level just before 2GyrBP (Hollandet al. 1989; Holland & Beukes 1990). Karhu andHolland (1996) have examined the isotopic compo-sition of carbon in carbon sediments deposited be-tween 2.6 and 1.6GyrBP. There is a large excursionin the amount of the 13C isotope between 2.22 and2.06GyrBP, which was probably related to an ab-normally high rate of organic carbon deposition,and thus of O2 production. There is thus clearevidence that atmospheric O2 concentrations in-creased very significantly over this time period. A number of investigators have used chemicalprofiles of paleosols to reconstruct the evolution ofatmospheric oxygen levels in the Earth’s early his-tory. Rye and Holland (1998) have provided a criti-cal review of the data. Part of the problem lies inthe identification of authentic paleosol material,but where the evidence seems firm, the profilessuggest a dramatic change in atmospheric oxygenconcentrations during the period 2.2 to 2.0GyrBP.Every true paleosol older than 2.44Gyr sufferedsignificant loss of iron during weathering, indicat-ing that the atmospheric pressure of O2 was at � 5 ¥ 10-4 atm (2.5 ¥ 10-3 PAL) before that date.Indeed, iron loss from paleosol of age 2.245–2.203Gyr is consistent with a partial pressure of <4 ¥10-3 PAL. Nevertheless, the presence of redbeds,containing some Fe(III), immediately overlyingthese paleosols suggests that by about 2.2GyrBPthere was a substantial (but unquantified) amountof O2 present in the atmosphere. Iron loss is

Chemical Evolution 23
negligible in paleosols aged 2.2–2.0Gyr and in allyounger samples.
The evidence just presented does suggeststrongly that O2 increased rather rapidly at around2GyrBP. Rye and Holland (1998) even suggest thatthe concentration had reached as much as 0.15PAL some time between 2.2 and 2.0GyrBP, al-though other studies would put the level nearer0.01PAL. Kasting (1993) explains the arguments interms of his “three-stage–three-box” model (itselfa simplification of an earlier suggestion of Walkeret al. (1983), who proposed a four-stage model). Fig-ure 1.5 shows the outline of the model. The threeboxes are the atmosphere, the surface ocean, andthe deep ocean, and the separate stages of themodel correspond to one after the other of thesecompartments becoming oxidized or oxidizing,rather than being reducing. Stage I has all threecompartments reducing (anoxic), with the possi-ble exception of some regions of the surface oceanwhere oxygen production might be especiallyfavorable. By stage II, the upper two boxes were
oxidizing, but the deep ocean remained anoxic.This arrangement accommodates a temporal over-lap between BIF and redbed formation. Finally, instage III, all parts of the oceans and atmospherecontained abundant free oxygen, as at present.Mass-balance considerations show that O2 con-centrations during stage II were �0.03PAL, sinceotherwise O2 conveyed to the deep ocean wouldhave been lost more rapidly than it was producedin the upper levels. An oxic deep ocean in stage IIIimplies an atmospheric O2 concentration ≥2 ¥10-3 PAL in order to compensate for the influx ofreductants from hydrothermal vents. Anoxic bot-tom waters may have persisted until well after thedeposition of BIFs ceased (Canfield 1998) 1.85GyrBP, if sulfide rather than oxygen removed iron fromdeep-ocean water, and the aerobic deep-ocean maynot have developed until 1.0–0.54GyrBP. Anotherline of evidence involves geologically stable bio-marker molecules that can act as “molecular fos-sils.” Biomarker lipids discovered in northwesternAustralia have been shown (Brocks et al. 1999) tobe almost certainly contemporaneous with the 2.7Gyr old shales in which they are found, andthus provide fairly secure evidence for the pres-ence of life. Some of the compounds are formedonly by cyanobacteria (“blue-green algae”). Photo-synthetic bacterial cells of this kind initiallychanged the atmosphere from its oxygen contentof <10-8 PAL toward much higher concentrations.The earliest cells lacked a nucleus, and are classi-fied as prokaryotic; bacteria fall into this category,and can operate anaerobically. Larger cells that are almost certainly eukaryotic, or possessing a nucleus, are found in the fossil record. Vellai and Vida (1999) discuss the difference betweenprokaryotic and eukaryotic cells, and the origin of the eukaryotes. It was formerly thought thateukaryotic organisms first appeared about 1.4GyrBP. However, Han and Runnegar (1992) proposethat the discovery of the corkscrew-shaped organ-ism Grypania puts the fossil record of eukaryoticcells back to 2.1GyrBP. Furthermore, theAustralian biomarkers include compounds mostplausibly formed from eukaryotic membranes, sothat these more complex cells may already havebeen present by 2.7GyrBP. The importance of this
I Reducing II Oxidizing III Aerobic
AtmosphereR
AtmosphereO
AtmosphereO
Surfaceocean
R
Surfaceocean
O
Surfaceocean
O
O
Deepocean
R
Deepocean
R
Deepocean
O
Time
Fig. 1.5 The “three-stage–three-box” model used torepresent the increase in oxygen concentrations in the Earth’s atmosphere. The three boxes are for theatmosphere, the surface ocean, and the deep ocean: Rshows that the conditions were reducing, and O thatthey were oxidizing. There may have been oxygen-rich“oases” in the surface ocean during stage I. (Adaptedwith permission from Kasting 1993. CopyrightAmerican Association for the Advancement of Science.)

24 richard p. wayne
finding for the interpretation of atmospheric evo-lution is that almost all eukaryotic cells requirelarge quantities of oxygen (�0.01PAL) to function(Runnegar 1991). Cell division is preceded by aclustering and splitting of the chromosomes with-in the nucleus (mitosis), a process dependent onthe protein actomyosin, which cannot form in theabsence of oxygen. According to Kasting (1993),[O2] ~ 0.01PAL is below the upper limit for stage IIof his model. It is even conceivable that such con-centrations could have arisen during stage I, be-cause the possibility exists of localized oxygenoases containing as much as 0.08PAL. The argu-ment is, then, that the presence of the very earlyeukaryotic cells does not necessarily imply thatthe atmosphere contained abundant (>0.01PAL)free oxygen much before 2GyrBP.
The data admittedly permit alternative inter-pretations, but accepting the general approachadopted by Kasting (1993) leads to an evolutionarypicture for O2 such as that shown in Fig. 1.6. Thisillustration is in the same form as that in Fig. 1.4,and once again suffers from very wide probabilityranges. On the figure are mapped out the several
mineralogical and biological markers that placeconstraints on the oxygen concentrations, and thethree stages of Kasting’s model are also indicated.One of the outstanding questions about the inter-pretation that we have adopted is the reason for the apparently sudden change in atmospheric O2concentrations at about 2GyrBP. Kasting (1993)reviews the evidence, and cites the originalliterature. Perhaps the transition from stage I tostage II in the model came about when the reducedand lower oxidation state mineral sinks on the sur-face had finally been almost all consumed. Or perhaps the transition in O2 concentrationsreflects a time when the net rate of photosyntheticproduction of O2 became greater than the rate ofoxygen consumption in reaction with volcanic H2and other reduced gases. A reduction in volcanicoutgassing or an increased rate of carbon burial asthe continental shelf area expanded are both possi-ble explanations. These two scenarios would eachbe accompanied by a changing 13C/12C isotopicratio. Until 1992, it was generally believed that theratio remained constant over the critical period, inapparent conflict with either of the hypotheses. Inthat year, however, DesMarais et al. (1992) foundthat the isotope ratio in certain marine kerogensincreased in two distinct steps, between 2.5–2.0GyrBP and 1.1–0.8GyrBP. The first of these increases might thus be linked to an increase incarbon burial rates and a concomitant increase inatmospheric oxygen levels at about 2GyrBP, in accordance with the evidence already presented.Of course, the data do not reveal whether the rise inatmospheric O2 was brought about by an increasedcarbon burial rate, or whether it caused it (Kasting1993). Measurements of the 15N/14N ratio yieldbroadly similar results (Beaumont & Robert 1999).The 13C/12C isotope ratio certainly increased moresubstantially in the period 600–550MyrBP, andthe effect has been ascribed (Derry et al. 1992) to amarked rise in the rate of carbon burial. At leastsome of the additional burial would have been accompanied by an increase in atmospheric oxy-gen concentrations, which is represented in thelower bound of the area of Fig. 1.6.
One important biological indicator at the“transition stage” for O2 at 2GyrBP is the
I II III
AbundantPhytoplankton
Redbeds??
Stage III lower limit
3.5 2.5 1.5 0.5
Time before present (Gyr)
10–12
10–4
10–3
10–2
10–1
1
O2 c
once
ntr
ati
on (
PA
L)
UraniniteSurvival
Grypania
Kuruman BIFStage II
upper limit
Charcoal
Dickinsonia
BIFs
Fig. 1.6 The proposed timing for the three stages of Fig.1.5. Various indicators of concentration are marked onthe figure, and discussed in the text. The dashed verticalline indicates a possible earlier (2.4GyrBP) onset forstage II than is usually accepted. (Adapted withpermission from Kasting 1993. Copyright AmericanAssociation for the Advancement of Science.)

Chemical Evolution 25
appearance of enlarged thick-walled cells on fila-ments of cyanobacteria found as fossils. The signif-icance of this observation is that cell structureswere developing in response to the need to protectthe organisms against the quantities of O2 by thenappearing in the atmosphere. As the atmosphericoxygen reached about 10-2 PAL, a revolution oc-curred, because eukaryotic cells, and then animaland plant life, emerged. Respiration and large-scalephotosynthesis became of importance, enoughfree oxygen became available for the fibrous pro-tein collagen to be formed, and the scene was setfor the appearance of metazoans, or multicelledspecies. About 550 million years ago, the Cam-brian period opened. According to earlier ideas,this period heralded an “evolutionary explosion.”In many ways, the real significance of the Cam-brian period is that the first animals with clear ex-ternal skeletons are preserved as fossils whoseidentity has been recognized for centuries, whileremains of earlier life forms had not yet been dis-covered or understood. Metazoan fossils from thepreceding 120 million years, the “Ediacarian”period, are now known. Many of these are fromspecies resembling jellyfish. Such organisms canabsorb their oxygen through the external surfacesat concentrations of about 7% of PAL. A reason-able estimate for when this level of oxygen wasreached in the atmosphere can thus be set at about670MyrBP. The relatively impervious surface cov-erings of the Cambrian metazoans suggest that 120million years later the oxygen concentration was approaching 10-1 PAL. Following the opening ofthe Cambrian, the complexity of life is known to have multiplied rapidly and the foundations for all modern phyla were laid. “Advanced” lifeforms (i.e. nonmicroscopic) were found ashore bythe Silurian age (420MyrBP), and by the EarlyDevonian, only 30Myr later, great forests hadappeared. Soon afterwards, amphibian vertebratesventured onto dry land.
There is a further aspect of the rise of oxygenconcentrations that will serve as an introductionto the next section. One view that will be pre-sented is that ozone formed from oxygen in the atmosphere acts, together with the O2 itself, as a screen for biologically damaging ultraviolet
radiation. Until the atmospheric attenuation of ultraviolet intensity became sufficient, photo-synthetic organisms such as the eukaryotic phytoplankton would not have been present in theoceans, and the rates of both carbon burial and oxy-gen generation would have been less than they areat present. The atmospheric shield would have become effective for oceanic organisms with [O2]in the range 0.01–0.1PAL (Kasting 1987). Theseconcentrations correspond with the most rapidrate of rise in the lower bound of [O2] shown in Fig.1.6 (and, for that matter, in the upper bound). Itseems, therefore, that a part of this inquiry into therise of O2 concentrations should include an exami-nation of possible ways in which organisms couldbe protected from the adverse effects of exposure toultraviolet radiation.
1.8 PROTECTION OF LIFE FROMULTRAVIOLET RADIATION
The macromolecules, such as proteins and nucleicacids, that are characteristic of living cells aredamaged by radiation of wavelength shorter thanabout 290nm. Ozone in the atmosphere has beenseen by many as the key species in reducing mid-ultraviolet intensities to a level at which life cansurvive on the surface of the planet. One outstand-ing feature of the properties of ozone is the rela-tionship between its absorption spectrum and theprotection of living systems from the full intensityof solar ultraviolet radiation. Major components of the atmosphere, especially O2, filter out solar ultraviolet with wavelengths <230nm; at thatwavelength, only about one part in 1016 of the intensity of an overhead sun would be transmittedthrough the molecular oxygen. But at wavelengthslonger than ~230nm, the only species in the pres-ent-day atmosphere capable of attenuating theSun’s radiation is ozone. Ozone has an unusuallystrong absorption just at the critical wavelengths(230–290nm), so that it is an effective filter despiteits relatively small concentration. For example, atl = 250nm less than one part in 1030 of the incident(overhead) solar radiation penetrates the ozonelayer.

26 richard p. wayne
Ozone is formed in the atmosphere from molec-ular oxygen, the necessary energy being suppliedby the absorption of solar ultraviolet radiation.The oxygen in the Earth’s contemporary atmos-phere is largely biological in origin, and ozone,needed as an ultraviolet filter to protect life, is it-self dependent on the atmospheric oxygen. Theselinks further emphasize the special nature ofEarth’s atmosphere. Actually, the interactions areeven more subtle than we have suggested. Ab-solute concentrations, and, indeed, the heightdistribution of ozone, depend on a competitionbetween production and loss. Loss of ozone is regu-lated by chemistry involving some of the othertrace gases of the atmosphere, such as the oxides of nitrogen, which are themselves at least partly of biological origin. Biological processes thusinfluence both the generation and destruction ofozone.
The starting point for many discussions ofozone concentrations in the paleoatmosphere isthe work of Berkner and Marshall (1965). Theseworkers suggested that life was able to evolve inresponse to increasing protection from solar ultra-violet radiation as the atmospheric ozone shielddeveloped. In its original form, the thesis pro-pounded that life would initially develop in stag-nant pools where liquid water of 10m depth ormore would be able to filter out the damagingradiation. At this stage, life in the oceans would beunlikely since organisms would be brought tooclose to the surface to survive. As the atmosphericcontent of oxygen, and thus of protective ozone, increased, life could migrate from the safety of thepools and lakes to the oceans and, finally, to dryland. Accompanying these changes would be agreatly enhanced photosynthetic and, indeed, evo-lutionary activity. Marine biota certainly seem tohave paved the way, in terms of modification of theatmosphere, for the evolution of the terrestrialbiota (Raven 1997). At one time, the opening of theCambrian period was thought to be characterizedby an “explosion” of evolution, and it was anattractive idea that the dawn of the Cambrian waslinked to the attainment in the atmosphere of anadequate ozone shield. However, as the discussionof Section 1.5 will have made clear, life was
abundant long before the Cambrian, and much ofthe reasoning for the evolutionary explosion was aresult of earlier fossils not being recognized forwhat they were. All the same, complexity and diversity did increase rapidly after the opening ofthe Cambrian, and the possibility cannot be dis-counted that increased mobility following suf-ficient protection might have been responsible.
A major question attached to the interpretationjust presented is whether the biological evolution-ary events were linked causally to the atmosphericchanges that undoubtedly occurred. If they were,then some kind of feedback mechanism may havebeen in operation, since the atmospheric evolutionwas certainly mediated by the biota. Resolution ofthis question will require further information: inthe first place, it is necessary to put the time-history of growth of O2 and O3 in the atmosphereon a firmer footing than it seems to be at present.What we can do is to use atmospheric photochem-ical models to calculate the ozone concentrationsthat accompanied smaller O2 levels in the early atmosphere. Figure 1.7 shows the results of onesuch calculation, in which the full chemistry ofcatalytic cycles (Levine 1982) was incorporated.
20
40
Ozone concentration (molecule cm–3)
103
10–4 10–3 10–2 10–1 1:[O2](PAL)
105 107 109 1011
Alt
itude
(km
)
Fig. 1.7 Vertical distribution of ozone for different totalatmospheric oxygen contents ranging from 10-4 to1PAL. The model used to obtain these results includesnitrogen, hydrogen, carbon, and chlorine chemistry; andallowance is made for ozone loss at the planetarysurface. (Copyright Richard P. Wayne, 1985, 1991, 2000.Reprinted from Chemistry of Atmospheres: AnIntroduction to the Chemistry of the Atmospheres ofEarth, the Planets and Their Satellites, by Richard P.Wayne (3rd edition, 2000) by permission of OxfordUniversity Press.)
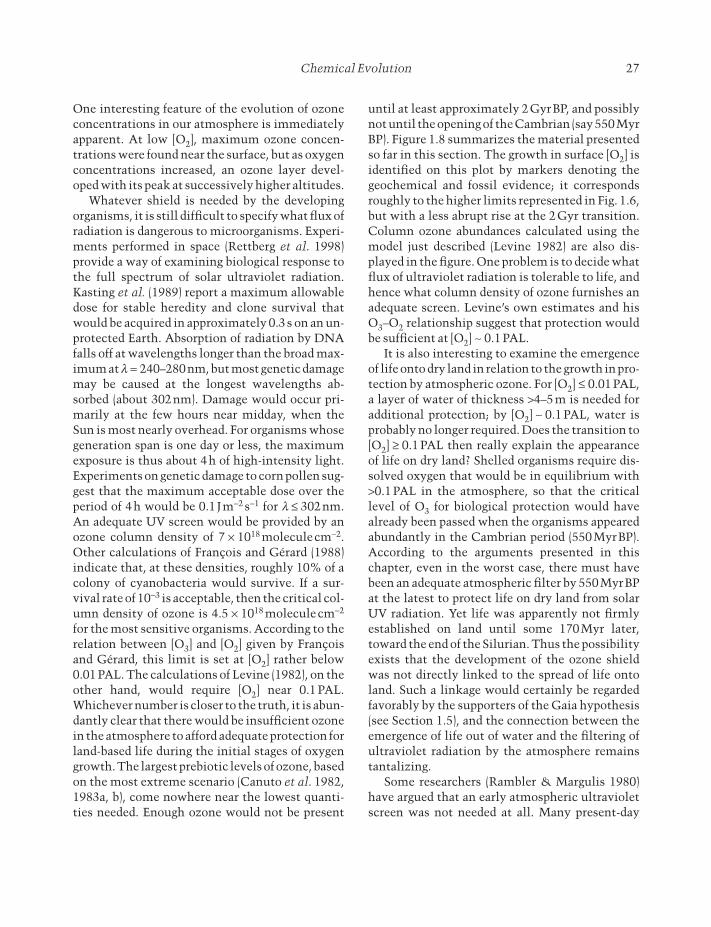
Chemical Evolution 27
One interesting feature of the evolution of ozoneconcentrations in our atmosphere is immediatelyapparent. At low [O2], maximum ozone concen-trations were found near the surface, but as oxygenconcentrations increased, an ozone layer devel-oped with its peak at successively higher altitudes.
Whatever shield is needed by the developingorganisms, it is still difficult to specify what flux ofradiation is dangerous to microorganisms. Experi-ments performed in space (Rettberg et al. 1998)provide a way of examining biological response tothe full spectrum of solar ultraviolet radiation.Kasting et al. (1989) report a maximum allowabledose for stable heredity and clone survival thatwould be acquired in approximately 0.3s on an un-protected Earth. Absorption of radiation by DNAfalls off at wavelengths longer than the broad max-imum at l = 240–280nm, but most genetic damagemay be caused at the longest wavelengths ab-sorbed (about 302nm). Damage would occur pri-marily at the few hours near midday, when the Sun is most nearly overhead. For organisms whosegeneration span is one day or less, the maximumexposure is thus about 4h of high-intensity light.Experiments on genetic damage to corn pollen sug-gest that the maximum acceptable dose over theperiod of 4h would be 0.1 Jm-2 s-1 for l £ 302nm.An adequate UV screen would be provided by anozone column density of 7 ¥ 1018 moleculecm-2.Other calculations of François and Gérard (1988)indicate that, at these densities, roughly 10% of acolony of cyanobacteria would survive. If a sur-vival rate of 10-3 is acceptable, then the critical col-umn density of ozone is 4.5 ¥ 1018 moleculecm-2
for the most sensitive organisms. According to therelation between [O3] and [O2] given by Françoisand Gérard, this limit is set at [O2] rather below0.01PAL. The calculations of Levine (1982), on theother hand, would require [O2] near 0.1PAL.Whichever number is closer to the truth, it is abun-dantly clear that there would be insufficient ozonein the atmosphere to afford adequate protection forland-based life during the initial stages of oxygengrowth. The largest prebiotic levels of ozone, basedon the most extreme scenario (Canuto et al. 1982,1983a, b), come nowhere near the lowest quanti-ties needed. Enough ozone would not be present
until at least approximately 2GyrBP, and possiblynot until the opening of the Cambrian (say 550MyrBP). Figure 1.8 summarizes the material presentedso far in this section. The growth in surface [O2] isidentified on this plot by markers denoting thegeochemical and fossil evidence; it correspondsroughly to the higher limits represented in Fig. 1.6,but with a less abrupt rise at the 2Gyr transition.Column ozone abundances calculated using themodel just described (Levine 1982) are also dis-played in the figure. One problem is to decide whatflux of ultraviolet radiation is tolerable to life, andhence what column density of ozone furnishes anadequate screen. Levine’s own estimates and hisO3–O2 relationship suggest that protection wouldbe sufficient at [O2] ~ 0.1PAL.
It is also interesting to examine the emergenceof life onto dry land in relation to the growth in pro-tection by atmospheric ozone. For [O2] £ 0.01PAL,a layer of water of thickness >4–5m is needed foradditional protection; by [O2] ~ 0.1PAL, water isprobably no longer required. Does the transition to[O2] ≥ 0.1PAL then really explain the appearanceof life on dry land? Shelled organisms require dis-solved oxygen that would be in equilibrium with>0.1PAL in the atmosphere, so that the criticallevel of O3 for biological protection would havealready been passed when the organisms appearedabundantly in the Cambrian period (550MyrBP).According to the arguments presented in thischapter, even in the worst case, there must havebeen an adequate atmospheric filter by 550MyrBPat the latest to protect life on dry land from solarUV radiation. Yet life was apparently not firmlyestablished on land until some 170Myr later, toward the end of the Silurian. Thus the possibilityexists that the development of the ozone shieldwas not directly linked to the spread of life ontoland. Such a linkage would certainly be regardedfavorably by the supporters of the Gaia hypothesis(see Section 1.5), and the connection between theemergence of life out of water and the filtering ofultraviolet radiation by the atmosphere remainstantalizing.
Some researchers (Rambler & Margulis 1980)have argued that an early atmospheric ultravioletscreen was not needed at all. Many present-day

28 richard p. wayne
bacteria seem rather resistant to ultraviolet sterili-zation techniques, and it is known that otherorganisms can protect themselves by producingcoatings that absorb in the ultraviolet. However,such sophisticated defense mechanisms wereunlikely to be available to the simplest early cells.Perhaps we must look to the cyanobacteria thatcan protect themselves by forming covering mats(Schopf 1999), or to protection by prebiotic organicpolymers and inorganic absorbers in the oceans(Cleaves & Miller 1998). Lovelock (1988) has pro-posed that an atmospheric screen could have beenafforded by a hydrocarbon-particle smog, initiatedby photolysis of CH4, well before 2.5GyrBP, and
far earlier than the ozone screen is generallythought to have developed (although Towe (1990,1996), for example, has argued for an ozone screenby this period). This idea of a hydrocarbon aerosolscreen has subsequently been taken up again bySagan and Chyba (1997), as discussed at the end of Section 1.2. Yet another suggestion originatedwith Kasting et al. (1989), who proposed that SO2and H2S, released as volcanic gases, could be pho-tolyzed to yield oligomers of sulfur (especially S8)within the atmosphere, and that these particlescould absorb and scatter solar ultraviolet radiationto an extent adequate for the survival of life on theplanetary surface.
Fig. 1.8 Evolution of ozone (dashed line) on Earth in responses to the changes in oxygen levels. The oxygenconcentration (continuous line) follows similar trends to those shown in Fig. 1.6, with a rather less abrupt increase at~2GyrBP. Various geological and biological indicators of O2 concentration shown on the diagram are discussed in thetext. (Copyright Richard P. Wayne, 1985, 1991, 2000. Reprinted from Chemistry of Atmospheres: An Introduction tothe Chemistry of the Atmospheres of Earth, the Planets and Their Satellites, by Richard P. Wayne (3rd edition, 2000)by permission of Oxford University Press.)
Old
est
sedim
enta
ry r
ock
s
Gro
und lev
el o
xygen
conce
ntr
ati
on o
r ozo
ne
colu
mn
abundance
as
fract
ion o
f pre
sent
atm
osp
her
ic lev
el
Stro
mato
lites
46
00
40
00
30
00
20
00
100
0
80
0
60
0
40
0
30
0
20
0
100
Cya
nobact
eria E
uka
ryoti
cce
lls
Oxygen
Ozone
Soft
-bodie
dm
etazo
ans
Shel
ly m
etazo
ans
Land p
lants Land a
nim
als
Mam
mals
Flow
erin
gpla
nts
Cre
tace
ous
Jura
ssic
Tria
ssic
Perm
ian
Carb
onif
erous
Dev
onia
n
Geological period
Early civilization ~ 0.005 Myr.
Millions of years before present
Precambrian era
[O2] < 5 ¥ 10–9
PALbefore life
10–4
10–3
10–2
10–1
1
Emergence of Man ~ 5 Myr.
Extinction of dinosaurs ~ 65 Myr.
Silu
rian
Ord
ovic
ian
Cam
bri
an
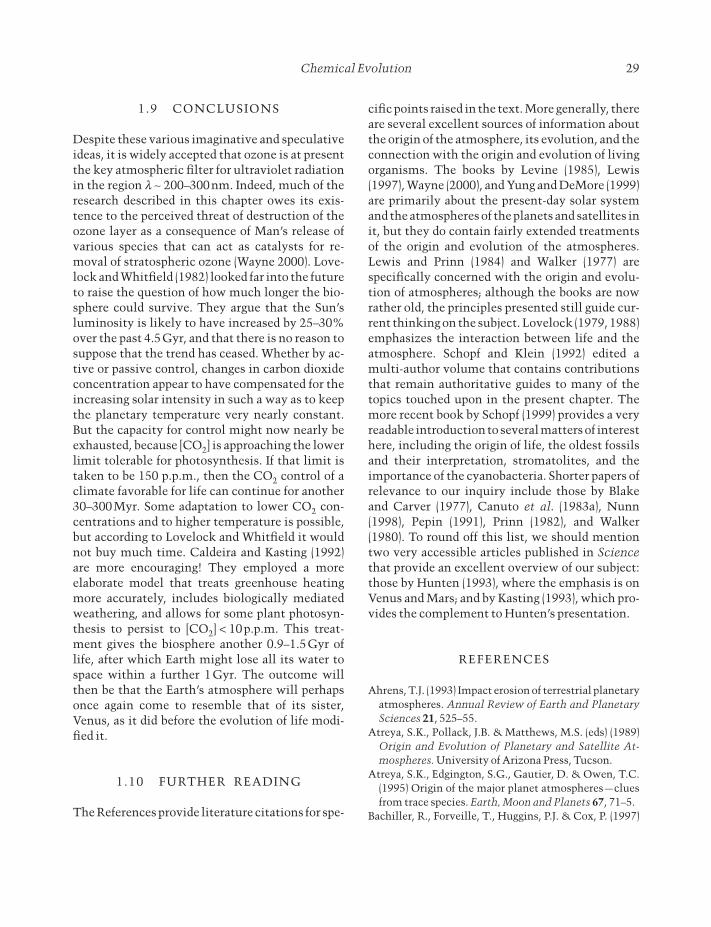
Chemical Evolution 29
1.9 CONCLUSIONS
Despite these various imaginative and speculativeideas, it is widely accepted that ozone is at presentthe key atmospheric filter for ultraviolet radiationin the region l ~ 200–300nm. Indeed, much of theresearch described in this chapter owes its exis-tence to the perceived threat of destruction of theozone layer as a consequence of Man’s release ofvarious species that can act as catalysts for re-moval of stratospheric ozone (Wayne 2000). Love-lock and Whitfield (1982) looked far into the futureto raise the question of how much longer the bio-sphere could survive. They argue that the Sun’sluminosity is likely to have increased by 25–30%over the past 4.5Gyr, and that there is no reason tosuppose that the trend has ceased. Whether by ac-tive or passive control, changes in carbon dioxideconcentration appear to have compensated for theincreasing solar intensity in such a way as to keepthe planetary temperature very nearly constant.But the capacity for control might now nearly beexhausted, because [CO2] is approaching the lowerlimit tolerable for photosynthesis. If that limit istaken to be 150 p.p.m., then the CO2 control of aclimate favorable for life can continue for another30–300Myr. Some adaptation to lower CO2 con-centrations and to higher temperature is possible,but according to Lovelock and Whitfield it wouldnot buy much time. Caldeira and Kasting (1992)are more encouraging! They employed a moreelaborate model that treats greenhouse heatingmore accurately, includes biologically mediatedweathering, and allows for some plant photosyn-thesis to persist to [CO2] < 10p.p.m. This treat-ment gives the biosphere another 0.9–1.5Gyr oflife, after which Earth might lose all its water tospace within a further 1Gyr. The outcome willthen be that the Earth’s atmosphere will perhapsonce again come to resemble that of its sister,Venus, as it did before the evolution of life modi-fied it.
1.10 FURTHER READING
The References provide literature citations for spe-
cific points raised in the text. More generally, thereare several excellent sources of information aboutthe origin of the atmosphere, its evolution, and theconnection with the origin and evolution of livingorganisms. The books by Levine (1985), Lewis(1997), Wayne (2000), and Yung and DeMore (1999)are primarily about the present-day solar systemand the atmospheres of the planets and satellites init, but they do contain fairly extended treatmentsof the origin and evolution of the atmospheres.Lewis and Prinn (1984) and Walker (1977) arespecifically concerned with the origin and evolu-tion of atmospheres; although the books are nowrather old, the principles presented still guide cur-rent thinking on the subject. Lovelock (1979, 1988)emphasizes the interaction between life and theatmosphere. Schopf and Klein (1992) edited amulti-author volume that contains contributionsthat remain authoritative guides to many of thetopics touched upon in the present chapter. Themore recent book by Schopf (1999) provides a veryreadable introduction to several matters of interesthere, including the origin of life, the oldest fossilsand their interpretation, stromatolites, and theimportance of the cyanobacteria. Shorter papers ofrelevance to our inquiry include those by Blakeand Carver (1977), Canuto et al. (1983a), Nunn(1998), Pepin (1991), Prinn (1982), and Walker(1980). To round off this list, we should mentiontwo very accessible articles published in Sciencethat provide an excellent overview of our subject:those by Hunten (1993), where the emphasis is onVenus and Mars; and by Kasting (1993), which pro-vides the complement to Hunten’s presentation.
REFERENCES
Ahrens, T.J. (1993) Impact erosion of terrestrial planetaryatmospheres. Annual Review of Earth and PlanetarySciences 21, 525–55.
Atreya, S.K., Pollack, J.B. & Matthews, M.S. (eds) (1989)Origin and Evolution of Planetary and Satellite At-mospheres. University of Arizona Press, Tucson.
Atreya, S.K., Edgington, S.G., Gautier, D. & Owen, T.C.(1995) Origin of the major planet atmospheres —cluesfrom trace species. Earth, Moon and Planets 67, 71–5.
Bachiller, R., Forveille, T., Huggins, P.J. & Cox, P. (1997)

30 richard p. wayne
The chemical evolution of planetary nebulae. Astron-omy and Astrophysics 324, 1123–34.
Bar-Nun, A. & Chang, S. (1983) Photochemical reactionsof water and CO in Earth’s primitive atmosphere. Jour-nal of Geophysical Research 88, 6662–72.
Basiuk, V.A. & Douda, J. (1999) Pyrolysis of simple aminoacids and nucleobases: survivability limits and impli-cations for extra-terrestrial survivability. Planetaryand Space Science 47, 577–84.
Beaumont, V. & Robert, F. (1999) Nitrogen isotope ratiosof kerogens in Precambrian cherts: a record of the evolution of atmospheric chemistry? PrecambrianResearch 96, 63–82.
Benz, W., Slattery, W.L. & Cameron, A.G.W. (1986) Theorigin of the moon and the single-impact hypothesis, 1.Icarus 66, 515–35.
Benz, W., Slattery, W.L. & Cameron, A.G.W. (1987) Theorigin of the moon and the single-impact hypothesis, 2.Icarus 71, 30–45.
Berkner, L.V. & Marshall, L.C. (1965) On the origin andrise of oxygen concentration in the Earth’s atmos-phere. Journal of Atmospheric Science 22, 225–61.
Blake, A.J. & Carver, J.H. (1977) The evolutionary role ofatmospheric ozone. Journal of Atmospheric Sciences34, 720–8.
Brandes, J.A., Boctor, N.Z., Cody, G.D., Cooper, B.A.,Hazen, R.M. & Yoder, H.S. (1998) Abiotic nitrogen re-duction on the early Earth. Nature 395, 365–7.
Brocks, J.J., Logan, G.A., Buick, R. & Summons, R.E.(1999) Archean molecular fossils and the early rise ofeukaryotes. Science 285, 1033–6.
Brush, S.G. (1990) Theories of the origin of the solarsystem 1956–1985. Reviews of Modern Physics 62,43–112.
Caldeira, K. & Kasting, J.F. (1992) The life span of thebiosphere revisited. Nature 360, 721–3.
Cameron, A.G.W. (1983) Origin of the atmospheres of theterrestrial planets. Icarus 56, 195–201.
Cameron, A.G.W. (1988) Origin of the solar system.Annual Reviews of Astronomy and Astrophysics 26,441–72.
Canfield, D.E. (1998) A new model for Proterozoic oceanchemistry. Nature 396, 450–3.
Canuto, V.M., Levine, J.S., Augustsson, T.R. & Imhoff,C.L. (1982) UV radiation from the young Sun and oxy-gen and ozone levels in the prebiological palaeoatmos-phere. Nature 296, 816–20.
Canuto, V.M., Levine, J.S., Augustsson, T.R. & Imhoff,C.L. (1983a) Oxygen and ozone in the early Earth’s atmosphere. Precambrian Research 20,109–20.
Canuto, V.M., Levine, J.S., Augustsson, T.R., Imhoff, C.L.& Giampapa, M.S. (1983b) The young Sun and theatmosphere and photochemistry of the early Earth.Nature 305, 281–6.
Chyba, C.F., Thomas P.J., Brookshaw, L. & Sagan, C.(1990) Cometary delivery of organic molecules to theearly Earth. Science 249, 366–73.
Cicerone, R.J. & Zellner, R. (1983) The atmosphericchemistry of hydrogen cyanide (HCN). Journal of Geophysical Research 88, 689–96.
Cleaves, H.J. & Miller, S.L. (1998) Oceanic protection ofprebiotic compounds from UV radiation. Proceedingsof the National Academy of Sciences of the USA 95,7260–3.
Cloud, P.E. (1972) A working model of the primitiveEarth. American Journal of Science 272, 537–48.
Cloud, P.E. (1983) The biosphere. Scientific American249(September), 132–89.
Cox, P.A. (1989) The Elements: Their Origin, Abun-dance, and Distribution. Oxford University Press,Oxford.
Cox, P.A. (1995) The Elements on Earth. Oxford Univer-sity Press, Oxford.
Deming, D. (1999) On the possible influence of extrater-restrial volatiles on Earth’s climate and the origin of oceans. Palaeogeography, Palaeoclimatology, andPalaeoecology 146, 33–51.
Derry, L.A., Kaufman, A.J. & Jacobsen, S.B. (1992) Sedi-mentary cycling and environmental-change in the lateProterozoic —evidence from stable and radiogenicisotopes. Geochimica et Cosmochimica Acta 56,1317–29.
DesMarais, D.J., Strauss, H., Summons, R.E. & Hayes,J.M. (1992) Carbon isotope evidence for the stepwiseoxidation of the Proterozoic environment. Nature 359,605–9.
Dreibus, G. & Wanke, H. (1987) Volatiles on Earth andMars —a comparison. Icarus 71, 225–40.
Durham, R. & Chamberlain, J.W. (1989) A comparativestudy of the early terrestrial atmospheres. Icarus 77,59–66.
Eiler, J.M., Mojziz, S.J. & Arrhenius, G. (1997) Carbonisotope evidence for early life. Nature 386, 665.
Farley, K.A. & Neroda, E. (1998) Noble gases in theEarth’s mantle. Annual Reviews of Earth and Planetary Science 26, 189–218.
Fleet, M.E. (1998) Detrital pyrite in Witwatersrand goldreefs: X-ray diffraction evidence and implications foratmospheric evolution. Terra Nova 10, 302–6.
François, L.M. & Gérard, J.-C. (1988) Ozone, climate, andbiospheric environment in the ancient oxygen-poor

Chemical Evolution 31
atmosphere. Planetary and Space Science 36, 1391–414.
Frayer, D.T. & Brown, R.L. (1997) Evolution of the abun-dance of CO, O2, and dust in the early universe. Astro-physical Journal Supplement Series 113, 221–43.
Gilliland, R.L. (1989) Solar evolution. Global and Planetary Change 75, 35–55.
Goody, R.M. & Yung, Y.L. (1989) Atmospheric Radia-tion. Oxford University Press, Oxford.
Han, T.-M. & Runnegar, B. (1992) Megascopic eukaryoticalgae from the 2.1-billion-year-old Negaunee iron for-mation, Michigan. Science 257, 232–5.
Holland, H.D. (1978) The chemistry of the atmosphereand oceans. John Wiley, Chichester.
Holland, H.D. (1997) Evidence for life on Earth more than3850 million years ago. Science 275, 38–9.
Holland, H.D. & Beukes, N.J. (1990) A paleoweatheringprofile from Griqualand West, South Africa —evidencefor a dramatic rise in atmospheric oxygen between 2.2 and 1.9 by BP. American Journal of Science 290A,1–34.
Holland, H.D., Feakes, C.R. & Zbinden, E.A. (1989) TheFlin Flon paleosol and the composition of the atmos-phere 1.8 BY BP. American Journal of Science 289,362–89.
Hoyle, F. (1982) Comets —a matter of life and death.Vistas in Astronomy 24, 123–39.
Hoyle, F. & Wickramasinghe, N.C. (1977) Does epidemicdisease come from space? New Scientist 76, 402–4.
Hoyle, F. & Wickramasinghe, N.C. (1983) Bacterial life inspace. Nature 306, 420.
Hunten, D.M. (1990) Escape of atmospheres —ancientand modern. Icarus 85, 1–20.
Hunten, D.M. (1993) Atmospheric evolution of the ter-restrial planets. Science 259, 915–20.
IGBP (1992) Global Change: Reducing Uncertainties.International Geosphere–Biosphere Programme,Stockholm.
Irvine, W.M. (1998) Extraterrestrial organic matter: a review. Origins of Life and Evolution of the Biosphere28, 365–83.
Javoy, M. (1997) The major volatile elements of the Earth:their origin, behavior, and fate. Geophysical ResearchLetters 24, 177–80.
Javoy, M. (1998) The birth of the Earth’s atmosphere: thebehavior and fate of its major elements. ChemicalGeology 147, 11–25.
Kamijo, K., Hashizume, K. & Matsuda, J. (1998) Noble gas constraints on the evolution of theatmosphere–mantle system. Geochimica et Cosmo-chimica Acta 62, 2311–21.
Karhu, J.A. & Holland, H.D. (1996) Carbon isotopes and the rise of atmospheric oxygen. Geology 24,867–70.
Kasting, J.F. (1987) Theoretical constraints on oxygen andcarbon dioxide concentrations in the Precambrianatmosphere. Precambrian Research 34, 205–39.
Kasting, J.F. (1988) Runaway and moist greenhouseatmospheres and the evolution of Earth and Venus.Icarus 74, 472–94.
Kasting, J.F. (1990) Bolide impacts and the oxidation stateof carbon in the Earth’s early atmosphere. Origins ofLife 20, 199–231.
Kasting, J.F. (1993) Earth’s early atmosphere. Science 259,920–6.
Kasting, J.F., Toon, O.B. & Pollack, J.B. (1988) Howclimate evolved on the terrestrial planets. ScientificAmerican 258(February), 46–53.
Kasting, J.F., Young, A.T., Zahnle, K.J. & Pinto, J.P. (1989)Sulfur, ultraviolet radiation, and the early evolution oflife. Origins of Life 19, 95–108.
Kasting, J.F., Eggler, D.H. & Raeburn, S.P. (1993) Mantleredox evolution and the oxidation state of the Archeanatmosphere. Journal of Geology 101, 245–57.
Kirchner, J.W. (1989) The Gaia hypothesis —can it betested? Reviews of Geophysics 27, 223–35.
Krasnopolsky, V.A. (1986) Photochemistry of the Atmos-pheres of Mars and Venus. Springer-Verlag, Berlin.
Kuhn, W.R. & Atreya, S.K. (1979) Ammonia photolysisand the greenhouse effect in the primordial atmos-phere of the Earth. Icarus 37, 207–13.
Lecuyer, C. & Ricard, Y. (1999) Long-trem fluxes of ferriciron: implication for the redox states of the Earth’smantle and atmosphere. Earth and Planetary ScienceLetters 165, 197–211.
Levine, J.S. (1982) The photochemistry of the paleoat-mosphere. Journal of Molecular Evolution 18, 161–72.
Levine, J.S. (ed.) (1985) The Photochemistry of Atmos-pheres. Academic Press, Orlando, FL.
Levine, J.S., Augustsson, T.R. & Natarajan, M. (1982) Theprebiological paleoatmosphere: stability and composi-tion. Origins of Life 12, 245–59.
Lewis, J.S. (1997) Physics and Chemistry of the Solar Sys-tem, rev. edn. Academic Press, San Diego.
Lewis, J.S. & Prinn, R.G. (1984) Planets and Their Atmospheres: Origin and Evolution. Academic Press,Orlando, FL.
Lovelock, J.E. (1979) Gaia: A New Look at Life on Earth.Oxford University Press, Oxford.
Lovelock, J.E. (1988) The Ages of Gaia: A Biography ofOur Living Earth. Oxford University Press, Oxford.

32 richard p. wayne
Lovelock, J.E. (1989) Geophysiology, the science of Gaia.Reviews of Geophysics 27, 215–22.
Lovelock, J.E. & Margulis, L. (1974) Atmospheric homeostasis by and for the biosphere. Tellus 26, 2–9.
Lovelock, J.E. & Whitfield, M. (1982) Life-span of thebiosphere. Nature 296, 561–3.
Lunine, J.I. (1997) Physics and chemistry of the solarnebula. Origins of Life 27, 205–24.
Lupton, J.E. (1983) Terrestrial inert gases: isotope tracerstudies and clues to primordial components in themantle. Annual Reviews of Earth and Planetary Sci-ence 11, 371–414.
McElroy, M.B., Kong, T.Y. & Yung, Y.L. (1977) Photo-chemistry and evolution of Mars’ atmosphere: a Vikingperspective. Journal of Geophysical Research 82,4379–88.
Margulis, L. & Lovelock, J.E. (1974) Biological mod-ulation of the Earth’s atmosphere. Icarus 21, 471–89.
Margulis, L., Barghoorn, E.S., Asherdorf, D., Banerjee, S.& Chase, D. (1980) The microbial community in thelayered sediments at Laguna Figueroa, Baja California,Mexico: does it have Precambrian analogs? Precam-brian Research 11, 93–123.
Maurel, M.C. & Decout, J.L. (1999) Origins of life: molecular foundations and new approaches. Tetra-hedron 55, 3141–82.
Miller, S.L. (1953) A production of amino acids underpossible primitive Earth conditions. Science 117,528–9.
Morrison, D. & Owen, T. (1996) The Planetary System.Addison-Wesley, Reading, MA.
Mojzsis, S.J., Arrhenius, G., McKeegan, K.D., Harrison,T.M., Nutman, A.P. & Friend, C.R.L. (1996) Evidencefor life on Earth before 3800 million years ago. Nature384, 55–9.
Mojzsis, S.J, Arrhenius, G., McKeegan, K.D., Harrison,T.M., Nutman, A.P. & Friend, C.R.L. (1997) Evidencefor life on Earth before 3800 million years ago. Nature386, 738.
Navarro-Gonzalez, R., Molina, M.J. & Molina, L.T.(1998) Nitrogen fixation by volcanic lightning in theearly Earth. Geophysical Research Letters 25, 3123–6.
Newman, W.I., Symbalisty, E.M.D., Ahrents, T.J. &Jones, E.M. (1999) Impact erosion of planetary atmos-pheres. Icarus 138, 224–40.
Nunn, J.F. (1998) Evolution of the atmosphere. Proceed-ings of the Geologists’ Association 109, 1–13.
Nutman, A.P., Mojzsis, S.J. & Friend, C.R.L. (1997)Recognition of ≥ 3850 Ma water-lain sediments inWest Greenland and their significance for the early
Archean Earth. Geochimica et Geologica Acta 61,2475–84.
Oberbeck, V.R. & Fogelman, O. (1989) Estimates of themaximum time required to originate life. Origins ofLife 19, 549–60.
Orgel, L.E. (1998) The origin of life —a review of facts andspeculations. Trends in Biochemical Sciences 23,491–5.
Oró, J., Miller, S.L. & Lazcano, A. (1990) The origin andearly evolution of life on Earth. Annual Reviews ofEarth and Planetary Science 18, 317–56.
Owen, T., Cess, R.D. & Ramanathan, V. (1979) Enhancedgreenhouse effect to compensate for reduced solarluminosity on early Earth. Nature 277, 640–2.
Pepin, R.O. (1987) Volatile inventories of the terrestrialplanets. Reviews of Geophysics 25, 293–6.
Pepin, R.O. (1989) Atmospheric compositions: key simi-larities and differences. In Atreya, S.K., Pollack, J.B. &Matthews, M.S. (eds) Origin and Evolution of Plane-tary and Satellite Atmospheres. University of ArizonaPress, Tucson.
Pepin, R.O. (1991) On the origin and early evolution of terrestrial planet atmospheres and meteoriticvolatiles. Icarus 92, 2–79.
Pepin, R.O. (1992) Origin of noble gases in the terrestrialplanets. Annual Reviews of Earth and Planetary Sci-ence 20, 389–430.
Pepin, R.O. (1997) Evolution of Earth’s noble gases: Con-sequences of assuming hydrodynamic loss driven bygiant impact. Icarus 126, 148–56.
Pollack, J.B. (1969) A non-gray CO2—H2O greenhousemodel of Venus. Icarus 10, 314–41.
Pollack, J.B. & Black, D.C. (1982) Noble gases in planetary atmospheres: implications for the origin andevolution of atmospheres. Icarus 51, 169–98.
Prinn, R.G. (1982) Origin and evolution of atmospheres:an introduction to the problem. Planetary and SpaceScience 8, 741–53.
Prinn, R.G. & Fegley, B. (1987) The atmospheres ofVenus, Earth, and Mars —a critical comparison. Annual Review of Earth and Planetary Science 15,171–212.
Rambler, M. & Margulis, L. (1980) Bacterial resistance toultraviolet radiation under anaerobiosis: Implicationsfor pre-Phanerozoic evolution. Science 210, 638–40.
Rasmussen, B. & Buick, R. (1999) Redox state of theArchean atmosphere: Evidence from detrital mineralsin ca. 3250–2750 Ma sandstones from the Pilbara Craton, Australia. Geology 27, 115–18.
Raven, J.A. (1997) The role of marine biota in the evolu-tion of terrestrial biota: Gases and genes–atmospheric

Chemical Evolution 33
composition and evolution of terrestrial biota. Biogeo-chemistry 39, 139–64.
Rettburg, P., Horneck, G., Strauch, W., Facius, R. &Seckmeyer, G. (1998) Simulation of planetary UVradiation climate on the example of the early Earth.Advances in Space Research 22, 335–9.
Rossow, W.B., Henderson-Sellers, A. & Weinreich, S.K.(1982) Cloud feedback —a stabilizing effect for theearly Earth. Science 217, 1245–7.
Runnegar, B. (1991) Precambrian oxygen levels estimated from the biochemistry and physiology of early eukaryotes. Global Planetary Change 97,97–111.
Rye, R. & Holland, H.D. (1998) Paleosols and theevolution of atmospheric oxygen: a critical review.American Journal of Science 298, 621–72.
Rye, R., Kuo, P.H. & Holland, H.D. (1995) Atmosphericcarbon dioxide concentrations before 2.2 billion yearsago. Nature 378, 603–5.
Sagan, C. & Chyba, C. (1997) The early faint Sun paradox:organic shielding of ultraviolet-labile greenhousegases. Science 276, 1217–21.
Sagan, C. & Mullen, G. (1972) Earth and Mars: Evolutionof atmospheres and surface temperatures. Science 177,52–6.
Schopf, J.W. (ed.) (1983) The Earth’s Earliest Biosphere.Princeton University Press, Princeton, NJ.
Schopf, J.W. (1999) Cradle of Life: The Discovery ofEarth’s Earliest Fossils. Princeton University Press,Princeton, NJ.
Schopf, J.W. & Klein, C. (eds) (1992) The Proterozoic Bio-sphere: A Multidisciplinary Study. Cambridge Univer-sity Press, Cambridge.
Schopf, J.W. & Packer, B.M. (1987) Early Archean (3.3 bil-lion to 3.5 billion year old) microfossils from Warra-woona Group, Australia. Science 237, 70–3.
Schubert, G. & Covey, C. (1981) The atmosphere ofVenus. Scientific American 245(July), 44–52.
Shimoyama, A. (1997) Complex organics in meteorites.Advances in Space Research 19, 1045–52.
Shizgal, B.D. & Arkos, G.G. (1996) Nonthermal escape ofthe atmospheres of Venus, Earth, and Mars. Reviews ofGeophysics 34, 483–505.
Sleep, N.H., Zahnle, K.J., Kasting, J.F. & Morowitz, H.J.(1989) Annihilation of ecosystems by large asteroidimpacts on the early Earth. Nature 342, 139–42.
Tajika, E. (1998) Mantle degassing of major and minorvolatile elements during the Earth’s history. Geophys-ical Research Letters 25, 3991–4.
Tolstikhin, I.N. & Marty, B. (1998) The evolution of ter-restrial volatiles: a view from helium, neon, argon and
nitrogen isotope modelling. Chemical Geology 147,27–52.
Towe, K.M. (1990) Aerobic respiration in the Archean.Nature 348, 54–6.
Towe, K.M. (1996) Environmental oxygen conditionsduring the origin and early evolution of life. Advancesin Space Research 18, 7–15.
Vellai, T. & Vida, G. (1999) The origin of eukaryotes: thedifference between prokaryotic and eukaryotic cells.Proceedings of the Royal Society of London B266,1571–7.
Volk, T. (1998) Gaia’s body: Toward a Physiology ofEarth. Springer-Verlag, New York.
Walker, J.C.G. (1976) Implications for atmospheric evo-lution of the inhomogeneous accretion model of theorigin of the Earth. In Windley, B.F. (ed.), The EarliestHistory of the Earth. Wiley, New York.
Walker, J.C.G. (1977) Evolution of the Atmosphere.Macmillan Publishing Co., New York.
Walker, J.C.G. (1980) Atmospheric constraints on theevolution of metabolism. Origins of Life 10, 93–104.
Walker, J.C.G. (1982). The earliest atmosphere of theEarth. Precambrian Research 17, 147–71.
Walker, J.C.G. (1985) Carbon dioxide on the early Earth.Origins of Life 16, 117–27.
Walker, J.C.G. (1990) Precambrian evolution of the climate system. Palaeogeography, Palaeoclimatology,and Palaeoecology (Global Planetary Change) 82,261–89.
Walker, J.C.G., Klein, C., Schidlowski, M., Schopf, J.W.,Stevenson, D.J. & Walter, M.R. (1983) Earth’s earliestbiosphere: its origin and evolution. In Schopf, J.W. (ed.),The Earth’s Earliest Biosphere. Princeton UniversityPress, Princeton, NJ.
Wanke, H. & Dreibus, G. (1988) Chemical compositionand accretion history of terrestrial planets. Philo-sophical Transactions of the Royal Society of LondonA325, 545–57.
Wayne, R.P. (2000) Chemistry of Atmospheres, 3rd edn.Oxford University Press, Oxford.
Wen, J.-S., Pinto, J.F. & Yung, Y.L. (1989) Photochemistryof CO and H2O: analysis of laboratory experiments and applications to the prebiotic Earth’s atmosphere.Journal of Geophysical Research 94, 14957–70.
Wetherill, G. (1990) Formation of the Earth. AnnualReviews of Earth and Planetary Science 18, 205–56.
Whittet, D.C.B. (1997) Is extraterrestrial organic matterrelevant to the origin of life on Earth? Origins of Lifeand Evolution of the Biosphere 27, 249–62.
Wickramasinghe, N.C. & Hoyle, F. (1998) Infrared
34 richard p. wayne
evidence for panspermia: an update. Astrophysics andSpace Science 259, 385–401.
Worsley, T.R. & Nance, R.D. (1989) Carbon redox and cli-mate control through Earth history. Global PlanetaryChange 75, 259–82.
Young, G.M., von Brunn, V., Gold, D.J.C. & Minter,W.E.L. (1998) Earth’s oldest reported glaciation: Physi-cal and chemical evidence from the Archean MozaanGroup (similar to 2.9Ga) of South Africa. Journal ofGeology 106, 523–38.
Yung, Y.L. & DeMore, W.B. (1999) Photochemistry of Planetary Atmospheres. Oxford University Press,Oxford.
Zahnle, K.J. (1986) Photochemistry of methane and theformation of hydrocyanic acid (HCN) in the Earth’searly atmosphere. Journal of Geophysical Research 91,2819–34.
Zahnle, K.J. & Walker, J.C.G. (1982) The evolution ofsolar ultraviolet intensity. Reviews of Geophysics andSpace Physics 20, 280–92.
Zahnle, K.J., Kasting, J.F. & Pollack, J.B. (1988) Evolutionof a steam atmosphere during Earth’s accretion. Icarus74, 62–97.
Zhang, Y. & Zindler, A. (1989) Noble-gas constraints onthe evolution of the Earth’s atmosphere. Journal ofGeophysical Research 94, 3719–37.