handbook-final-single page-2-11-low res
TRANSCRIPT

TRACKING IMPACTA HANDBOOK FOR HIGH QUALITY DATA COLLECTION
VVLEAD FELLOWSHIP PROGRAM

‑ MUTHONI NDUHIU VVLead Fellow, Kenya
DATA COLLECTION IS EVERYTHING – AT THE START OF
THE PROJECT, MID‑PROJECT AND AT THE END OF THE
PROJECT…I CANNOT IMAGINE STARTING A PROJECT
WITHOUT DATA COLLECTION.
List of Acronyms 2
Acknowledgements 2
Foreword: Development of this handbook 3
SECTION 1: INTRODUCTION TO THE HANDBOOK 6
Why does the quality of your data matter? 8
What do we mean by data quality? 9
When should you use this handbook? 11
How do you use this handbook? 12
Data Quality for Leadership-Building 13
SECTION 2: THE BASICS OF RECORDKEEPING 14
SECTION 3: DATA QUALITY CONSIDERATIONS, TIPS, AND CHECKS 18
Dimensions of data quality 20
Tips for enhancing data quality 22
Routine checks 26
SECTION 4: REPORTING ON KEY OUTPUT INDICATORS 28
Counting Beneficiaries 30
Output Indicators for Advocacy 32
Sample Indicators 33
Collection Frequency and Sources 34
Disaggregation and Source Documents 35
Aggregation for Reporting 35
SECTION 5: INDICATOR REPORTING TEMPLATES 36
GLOSSARY 44
APPENDICES 49
APPENDIX A: Standard VVLead indicators – descriptions, definitions and disaggregates 50
APPENDIX B: Implementing a Routine Data Quality Assessment 51
APPENDIX C: Indicator Reporting Templates 52
CONTENTS
A LEADER’S HANDBOOK FOR RECORDKEEPING AND DATA QUALITY
VVLEAD FELLOWSHIP PROGRAM
DQA
Data Quality Assessment
M&E Monitoring and Evaluation
SMARTStrategic, Measurable, Achievable, Realistic, Time-bound Objectives
RDQARoutine Data Quality Assessment
VVLEADVital Voices Lead fellowship program
LIST OF ACRONYMS
ACKNOWLEDGEMENTSThis handbook is the fruit of an extensive team work that lasted over two years. Vital Voices staff Lucina Di Meco, Marguerite
Berger, Emma Hersh, Elizabeth Andrews and Laura Thompson were instrumental for reaching this goal. Vital Voices
acknowledges the work of Iris Group staff and consultants, MaryBeth Hastings, Svetlana Negroustoueva, Olutobi Adeogo,
Julian Bagyendera and Njeri Kagondu who conducted the field audits and drafted the content for the publication. A
special thank you to the fellows that took part in the Data Quality Assessment Project and vitally contributed to bringing
this publication to life: Alice Aluoch, Amy Oyekunle, Beatrice Achieng Nas, Caroline Lentupuru, Charity Namara, Chinasa
Uwanna, Cynthia Awuor Coredo, Esther Ijewere-Kalejaiye, Eunice Oyella, Grace Ikirimat, Grace Nanyonga Mugisha, Hafsat
Costello Abiola, Iwalola Akin-Jimoh, Jane Anyango Odongo, Janet Adetoro, Janet Akao, Jayoung Naphtalie Margaret
Otieno, Jennifer Mulli, Linnet Nkunda, Memory Bandera, Mercy Babirye, Monica Malega, Muthoni Rosalyn Nduhiu, Njambi
Kiritu, Olasumbo Adeleke, Rehmah Kasule, Stella Lukwago Nakawuki, Titi Akosa, Victoria Emah Emah. *In 2013, Vital Voices,
with funding from the UK government’s Department of International Development established the VVLead Fellowship
Program to support a global network of emerging and established women leaders who are addressing challenges and
providing unusual and sustainable solutions to ensure full participation in society and the economy. VVLead’s activities
are centered around the three pillars, Connect, Learn and Collaborate.
LIST OF ACRONYMS & ACKNOW
LEDGEMENTS
A LEADER’S HANDBOOK FOR RECORDKEEPING AND DATA QUALITY2

VITAL VOICES INVESTS IN WOMEN LEADERS WHO IMPROVE
OUR WORLD. WE INVEST IN LEADERS BECAUSE THEY TAKE
ON THE GREAT RESPONSIBILITY OF IMPROVING SOCIETIES.
They strengthen laws, create jobs and defend political
freedoms. Yet, many of them have a hard time effectively
communicating their impact, as they often lack the tools
to track their personal, programmatic and organizational
progress. Women leaders are often so busy doing, that
they are not able to take time to monitor and evaluate
their work, thereby missing out on important learnings
and best practices.
While impact can also be measured through words
and personal accounts, data remains a critical tool in
monitoring and evaluation, especially as it relates to
communicating the significance and scope of their work.
Vital Voices developed this handbook in an effort to meet
the needs of a wide range of women leaders and social
entrepreneurs who want to gain a better understanding
of how to collect reliable data and clearly communicate
impact that accurately reflects their organization’s
local and global efforts. We designed this handbook
in partnership with some of the most exceptional women
leaders we work with from different regions of the world.
It is a direct response to their needs and concerns around
record keeping, data collection and impact evaluation.
We hope that many more women around the globe
will find this tool useful and will be able to improve their
data by incorporating it into their work.
Warm Regards,
Alyse Nelson
President & CEO
FOREWORD
A LEADER’S HANDBOOK FOR RECORDKEEPING AND DATA QUALITY 3
FOREWORD

BACKGROUNDTHE IDEA FOR THE HANDBOOK FIRST AROSE
FOLLOWING AN EXERCISE CONDUCTED IN EARLY
2015 BY THE VV LEAD FELLOWSHIP PROGRAM.
Supported by the UK Government’s Department
for International Development (DfID), the VVLead
Fellowship Program was launched in 2012 to support
a global network of emerging and established women
leaders committed to ending gender inequality
by fostering women’s economic empowerment,
eliminating gender‑based violence and/or changing
those cultural practices that are harmful for women
and girls.
The VVLead Fellowship Program served over 330 women leaders from emerging and developing countries all over the world,
who are committed to ending gender inequality in their communities by enhancing women’s economic empowerment,
fighting harmful cultural practices and reducing gender-based violence. The program offered them a unique opportunity
to exchange information, obtain resources and tools, access small grants, mentor and be mentored and receive vital
trainings tailored to meet their needs, goals and objectives.
In order to assess the monitoring and evaluation (M&E) capacities of fellows, Vital Voices conducted an external Data
Quality Assessment (DQA) exercise with a select number of its fellows. The purpose of the DQA was to learn more about
the data collection processes used by fellows to report fellowship outputs to VVLead, and to identify strengths and gaps
in fellows’ data quality. This assessment allowed Vital Voices to in turn give its donors a sense of the accuracy of VV’s
reporting on the fellowship’s results.
The DQA centered on interviews with a group of fellows from Nigeria, Uganda, and Kenya. Consultants with M&E expertise
in each country conducted the interviews and validated results by reviewing the fellows’ M&E collection and reporting
tools. Each fellow then identified ways to strengthen specific areas of weakness around M&E, while the consultant provided
BACKGROUND
A LEADER’S HANDBOOK FOR RECORDKEEPING AND DATA QUALITY4

technical guidance in pinpointing and implementing solutions. By improving fellows’ data collection systems, the DQA was
an important step in ensuring that VVLead can point to convincing evidence of the real value of investing in women leaders.
THE DQA RESULTED IN THE FOLLOWING FINDINGS, AMONG OTHERS:
• M&E skills have not been well developed among fellows, reflecting limited training and investment in M&E by their
organizations. Only a few fellows had an M&E officer in their institutions.
• Those fellows with M&E skills felt they still needed to improve how they manage data after recording it, and how
they use it in reporting.
• The DQA helped fellows understand and prioritize M&E processes.
• Where there was a lack of institutional capacity in M&E, it was more difficult for fellows to report quality data to
VVLead. For example, one fellow whose organization had no M&E system had to rely on outside organizations’
data to report her fellowship’s outputs, giving her little control over or confidence in data quality.
• Data integrity and confidentiality (see Section 3) was low. Most fellows reported that they did not have systems to
prevent data loss or manipulation, and physical files were generally not kept locked up.
Based on these findings, VVLead created this handbook to help fellows and others avoid the most common
barriers to data quality, build their M&E capacity, and increase the quality of the data they use for internal
management and to report to donors.
This handbook uses quotes and examples from VVLead fellows to illustrate lessons learned on good data
collection practices and the importance of data quality.
BACKGROUND
A LEADER’S HANDBOOK FOR RECORDKEEPING AND DATA QUALITY 5

INTRODUCTION TO THE HANDBOOKTHIS HANDBOOK IS DESIGNED FOR LEADERS OF NONPROFITS, SOCIAL ENTERPRISES AND BUSINESSES
WHO ARE SEEKING TO UNDERSTAND MORE ABOUT COLLECTING AND REPORTING ON DATA. IT IS NOT
A COMPLETE MANUAL ON MONITORING AND EVALUATION (M&E), BUT IT PROVIDES AN INTRODUCTION
TO THE BASIC BUILDING BLOCKS OF AN M&E SYSTEM. NO MATTER THE SIZE OF YOUR ORGANIZATION,
COLLECTING INFORMATION ON WHAT YOU DID AND WHO BENEFITTED IS THE STARTING POINT IN ASSESSING
THE VALUE OF YOUR WORK.
While you may already have a monitoring and evaluation (M&E) system in place for collecting data about your activities
and the people you serve, this handbook is meant to help you:
• Keep better records for your internal management and external reporting,
• Ensure data quality, and
• Assess the immediate effects and results of your work.
While this handbook focuses on monitoring and not on evaluation, data collection and monitoring lay the groundwork
for evaluating your work.
SECTION 1
A LEADER’S HANDBOOK FOR RECORDKEEPING AND DATA QUALITY6
I HAVE NEVER HAD ANY M&E TRAINING, NO SYSTEMATIC DATA COLLECTION
OR REPORTING TOOLS FOR TRACKING OUR ACTIVITIES AND RESULTS, ASIDE
FROM USING MY DIARY TO DOCUMENT INFORMATION ABOUT MY CLIENTS
AND BUSINESS ASSOCIATES. NOW I UNDERSTOOD THE NEED FOR VERIFIABLE
DATA FOR EVIDENCE‑BASED REPORTING. VITAL VOICES PROVIDES PRACTICAL
TRAINING YOU CAN APPLY TO WORK, AND I VALUED THE PROMPT RESPONSES
FROM MENTORS BY EMAILS, TOO.
‑ NIGERIAN FELLOW
SECTION 1: INTRODUCTION TO THE HANDBOOK

SECTION 1
A LEADER’S HANDBOOK FOR RECORDKEEPING AND DATA QUALITY 7
INTRODUCTION TO THE HANDBOOKTHIS HANDBOOK IS DESIGNED FOR LEADERS OF NONPROFITS, SOCIAL ENTERPRISES AND BUSINESSES
WHO ARE SEEKING TO UNDERSTAND MORE ABOUT COLLECTING AND REPORTING ON DATA. IT IS NOT
A COMPLETE MANUAL ON MONITORING AND EVALUATION (M&E), BUT IT PROVIDES AN INTRODUCTION
TO THE BASIC BUILDING BLOCKS OF AN M&E SYSTEM. NO MATTER THE SIZE OF YOUR ORGANIZATION,
COLLECTING INFORMATION ON WHAT YOU DID AND WHO BENEFITTED IS THE STARTING POINT IN ASSESSING
THE VALUE OF YOUR WORK.
While you may already have a monitoring and evaluation (M&E) system in place for collecting data about your activities
and the people you serve, this handbook is meant to help you:
• Keep better records for your internal management and external reporting,
• Ensure data quality, and
• Assess the immediate effects and results of your work.
While this handbook focuses on monitoring and not on evaluation, data collection and monitoring lay the groundwork
for evaluating your work.
I HAVE NEVER HAD ANY M&E TRAINING, NO SYSTEMATIC DATA COLLECTION
OR REPORTING TOOLS FOR TRACKING OUR ACTIVITIES AND RESULTS, ASIDE
FROM USING MY DIARY TO DOCUMENT INFORMATION ABOUT MY CLIENTS
AND BUSINESS ASSOCIATES. NOW I UNDERSTOOD THE NEED FOR VERIFIABLE
DATA FOR EVIDENCE‑BASED REPORTING. VITAL VOICES PROVIDES PRACTICAL
TRAINING YOU CAN APPLY TO WORK, AND I VALUED THE PROMPT RESPONSES
FROM MENTORS BY EMAILS, TOO.
‑ OLASUMBO ADELEKE VVLead Fellow, Nigeria

SECTION 1
A LEADER’S HANDBOOK FOR RECORDKEEPING AND DATA QUALITY8
Data are as important a resource to you and your organization as funding. If properly collected and used,
these facts, statistics and bits of information are powerful tools. But if you’re starting without a monitoring
and evaluation (M&E) system, collecting information to prove your success can be a daunting task. After
all, you know you’re successful – you can tell by the lives you’ve helped to change and the people you’ve
inspired. It can be frustrating when you need to prove or document this success.
When you’re doing so much with so little, investing effort
in providing evidence of your success may seem like it
just takes time and resources away from the good things
you do. But if thought through in advance, creating and
maintaining a simple data collection system can become
routine and reap significant benefits for your work.
A solid M&E process helps your organization and your
funders understand how your work is making a difference.
If properly managed, M&E can tell you where your efforts
are having the most impact, in which areas of activity it
makes sense to invest more time and resources, and where
your work can or should be adjusted to improve results.
M&E data also gives you important information that you
can use to duplicate or scale up your efforts. For example,
if you know that you spent four hours a week mentoring
two girls over the past year, you can estimate how much
time it will take to mentor more.
Solid data collection and reporting also builds your
credibility among donors and constituents, as they will find
you a reliable and trustworthy source of information about
your activities. Simply put, demonstrating competence in
reporting on your successes and setbacks builds confidence
among stakeholders that you are a capable leader.
With a strong reputation for credibility, it will be easier
for you to raise funds and attract other support that is
necessary to grow your work and increase your impact.
Aside from the direct impact good reporting has on your
work, it’s important to think about how your reporting can
contribute to global trends. For example, some donors
may feel there’s not sufficient or strong enough evidence
to justify investing their funds in women’s empowerment
efforts. If you collect high quality data that feeds into strong
reporting on the outcomes of women’s empowerment
interventions, your donors can make a better case at a
global level that women’s empowerment efforts are a
critical investment.
WHY DOES THE QUALITY OF YOUR DATA MATTER?
SECTION 1
A LEADER’S HANDBOOK FOR RECORDKEEPING AND DATA QUALITY 9
DATA QUALITY is how well your data show the changes in your community, country or world resulting
from your efforts. There are five main aspects of data quality. We discuss all of them in Section 3, but
two of the most important are summarized here: validity and reliability.
ARE THE DATA YOU ARE PRESENTING VALID?
In other words, do the data accurately represent
what you are trying to measure? Does the evidence
you provide actually capture progress toward your
expected results? If you expect that your activity
will lead to a certain result, valid data will contribute
to proving or disproving that link. Invalid data, on
the other hand, offers no useful information about
whether the link exists or not. For example, a project
that conducts outreach to increase the number of girls
attending secondary school may collect data that
show more girls attended school. But if the number
of school-age girls in the community also increased
during the time period, then a percentage or numerical
increase does not itself support a link between project
activities and the increase in number of girls in school.
What would make this information valid would be to
show an increase in the number of school-age girls
attending school, as this percentage of total number
of girls in the community.
Valid data are critical to showing – to yourself and
others – a link between your activities and your
desired results. If your data are not valid, you could
end up thinking you’re succeeding where you are not
– or thinking that you’re not succeeding where you
actually are. Such misleading information can cause
bad decision-making for your program.
ARE THE DATA YOU ARE PRESENTING RELIABLE?
Reliable data collection minimizes errors, is consistent
over time and does not depend on the person
collecting it. A reliable measurement is one that, if
repeated, will give the same results as it did the first
time. For example, one of your indicators may be
the number of participants in a workshop series. The
volunteer assigned to count participants for the first
workshop does not count participants who show up
late or leave early. The volunteer assigned to count for
the second workshop counts everyone who comes,
even if they aren’t there the whole time. The average
and total number of workshop participants would not
be reliable because of the different approaches used
for counting them.
Collecting data reliably is somewhat like playing a game
or sport. You don’t want to make up new rules every
time or change them in the middle of the game – you
want them to be consistent. It’s helpful to have the rules
written down so everyone can understand them and
so that someone from outside can duplicate the way
the game or sport is played. It’s the same way with data
– you want someone from outside your organization
to be able to duplicate your data collection and get
the same results, even if this duplication isn’t going
to happen. Inconsistent or unreliable data, such as
inflated estimates of participants and beneficiaries,
can erode stakeholders’ confidence in your reporting.
WHAT DO WE MEAN BY DATA QUALITY?

DATA COLLECTION
DATA ANALYSIS
REPORTING
SECTION 1
A LEADER’S HANDBOOK FOR RECORDKEEPING AND DATA QUALITY10
The quality of your data collection has
a strong effect on your reporting. With
poor data, you cannot be confident
that the results you are reporting are
reliable. You may be missing great
things that have resulted from your
work, or you may not be able to see
important ways you can improve
results.
In Section 4, we will discuss data quality in more detail,
along with tips to avoid problems with validity and reliability.

WHEN SETTING UP AN M&E/REPORTING FRAMEWORK: As you develop your plan for an activity or project, you should develop an M&E framework that lays out your personal
or project objectives, inputs, activities, anticipated outputs and outcomes, and how these outputs and outcomes will be
measured (indicators). This handbook can help you think through which outcomes, outputs and activities you should be
tracking, and which indicators are appropriate for measuring your success.
WHEN DECIDING WHAT DATA YOU CAN REASONABLY REPORT ON FOR YOUR ACTIVITIES: One of the unfortunate truths of M&E is that the best measures of our success are very difficult to collect, especially for
a small group with limited resources. This handbook will take you a step closer towards sorting through the trade-offs
involved in data collection, and selecting the data that you can routinely and sustainably collect.
WHEN LOOKING FOR A WORKSHEET TO HELP YOU COLLECT AND ORGANIZE YOUR DATA: To make your job easier in designing a quality data collection system, this handbook provides useful tools that you can
adapt for your work.
WHEN THINKING THROUGH THE LOGISTICS OF YOUR ACTIVITY OR PROJECT: Planning for data collection should happen when designing your project – but also when you’re in the last stages of event
or activity preparation. This will allow you to make sure you have your system set up to collect the data you need.
Your M&E framework should be based on your theory of
change. A theory of change is your/your organization’s
informed opinion about what needs to be done to
accomplish your goals. For example, your theory of change
could be that women in your community will increase their
economic status if more girls complete secondary school.
Based on this theory, you would engage in activities to
increase girls’ completion of secondary school, and your
objective would be a specific completion rate among
girls in your community by a certain date (see “Tips for
Increasing Data Quality” in Section 3).
This handbook has been designed to help you capture
the very first signs of your successes within that theory of
change, which primarily means: how many people benefit
from your work, and what services, products, other benefits
they receive. These are the outputs of your work. Correctly
identifying, classifying, counting and reporting on these
direct beneficiaries and benefits are essential first steps
in measuring results of your work.
You will likely want to know about outcomes as well –
not just how many people you reached and the services
they received, but how the world/community/person has
changed as a result of the service or product they received.
This kind of information is more difficult and expensive to
collect, and the time it takes to demonstrate change is
longer. You will need to plan ahead and honestly assess
your capacity and timeframe (and/or your organization’s
capacity and timeframe) to collect quality data on outcomes.
Although this handbook does not focus on data collection
for outcomes reporting, concepts of data quality still apply,
and it can be useful in thinking through the steps that are
required to capture medium- and long-term success.
SECTION 1
A LEADER’S HANDBOOK FOR RECORDKEEPING AND DATA QUALITY 11
WHEN SHOULD YOU USE THIS HANDBOOK?

SECTION 1
A LEADER’S HANDBOOK FOR RECORDKEEPING AND DATA QUALITY12
We know that the readers of this handbook work on a range of issues from a variety of angles and at
different geographical scales. You may have vast experience with M&E, or you may have very little. Your
organization may have a very complex data collection system or none at all.
To get the most out of this handbook, you should adapt its examples and tools to the specific topics, methodologies,
complexity, and scale of your own work. If anything in the handbook seems beyond the scope or capacity of your
organization, keep in mind that you can do quite a bit to improve data quality by just using the simpler tools and concepts
in this handbook, and you can incorporate more complex tools as your organization’s capacity develops.
HOW DO YOU USE THIS HANDBOOK?
SECTION 2 Section 2 covers the basics of recordkeeping. It also discusses disaggregation and how it helps you
tell a richer story about your work. Consult this section to get a broad overview of the importance
of data collection and how to do it well.
SECTION 3Section 3 explores data quality in some detail and offers tips to help you make sure you are doing
as much as you can to collect and report solid data. Read through this section to understand or
refresh your memory about setting up and maintaining data collection systems.
SECTION 4 Section 4 provides tables of suggested indicators, along with how data should be grouped
(disaggregated).
SECTION 5 Section 5 outlines the templates included at the end of the handbook to facilitate data collection.
These templates are designed for flexibility. Adapt these templates to meet your needs for capturing
information and reporting to donors.
ACTIVITIES
THE ACTIONS TAKEN BY YOU OR YOUR ORGANIZATION TO REACH YOUR
OBJECTIVE
THE IMMEDIATE RESULTS OF YOUR ACTIONS,
SUCH AS PUBLICATIONS DISTRIBUTED, LOANS MADE, NUMBER OF
BENEFICIARIES
THE CHANGES AS A RESULT OF YOUR ACTIVITIES ‑ IN ATTITUDES,
BEHAVIORS, POLICIES, FUNDING LEVELS, ETC.
OUTPUTS OUTCOMES
YOUR THEORY OF CHANGEYour theory of change helps you
decide the activities that you
believe will solve the problem
you are focused on. The outputs
and outcomes that result from
these activities should align with
the theory of change as well, and
your indicators will measure the
degree of change.
SECTION 1
A LEADER’S HANDBOOK FOR RECORDKEEPING AND DATA QUALITY 13
YOUR THEORY OF CHANGE
Many of the examples in this handbook assume
that the M&E framework you are creating is
for an organization or a project. However,
some people (like many of the women leaders
working with Vital Voices) may be measuring
their own leadership development. If this is
the case for you, you’ll want to set different
kinds of objectives – for example, to influence
issues important to you, mentor others, or win
public office.
This has implications for the data you collect. You’ll likely
want to keep your data collection system very simple,
as you don’t have the resources of an organization
to help you. But just like an organization, you’ll want
to make sure your information meets data quality
standards. Keep in mind that no one expects you as
an individual leader to have the same level of results
as an organization or business, so don’t worry if your
numbers of beneficiaries or other outputs are small.
REMEMBER: IT’S IMPORTANT TO BE REALISTIC WHEN SETTING TARGETS AND REPORTING DATA.
Improving your data collection processes
contributes to valid and reliable reporting, increases
credibility with your donors, and builds the case
that investing in women’s empowerment (or other
types of social change) is an effective strategy.
Outputs are a record of the immediate results
of your work – such as number of people who
participate in a workshop, number of publications
distributed, or number of products sold. Outcomes
are the next step – what happens as a result of
the outputs. This includes changes in attitudes
or behaviors, changes in revenue, and changes
in policies.
Developing a monitoring and evaluation framework
is an important step in designing a project. It
shows the logical steps between your activities
and your objectives, including what outputs and
outcomes you expect, and how you will measure
your progress.
Having good data is important for fundraising
purposes. When current or potential donors ask
you how you know your work is making a difference,
having an answer backed up with data is stronger
than making a guess. It boosts your credibility as
an effective leader.
Keep it simple and realistic. Being ambitious is
great, but trying to do too much with too little
can lead to unfocused efforts. Using simple data
collection tools and frameworks can provide you
with important information while not taking more
of your time or resources than you can afford.
DATA QUALITY FOR LEADERSHIP‑BUILDING
KEY POINTS TO REMEMBER FROM SECTION 1:
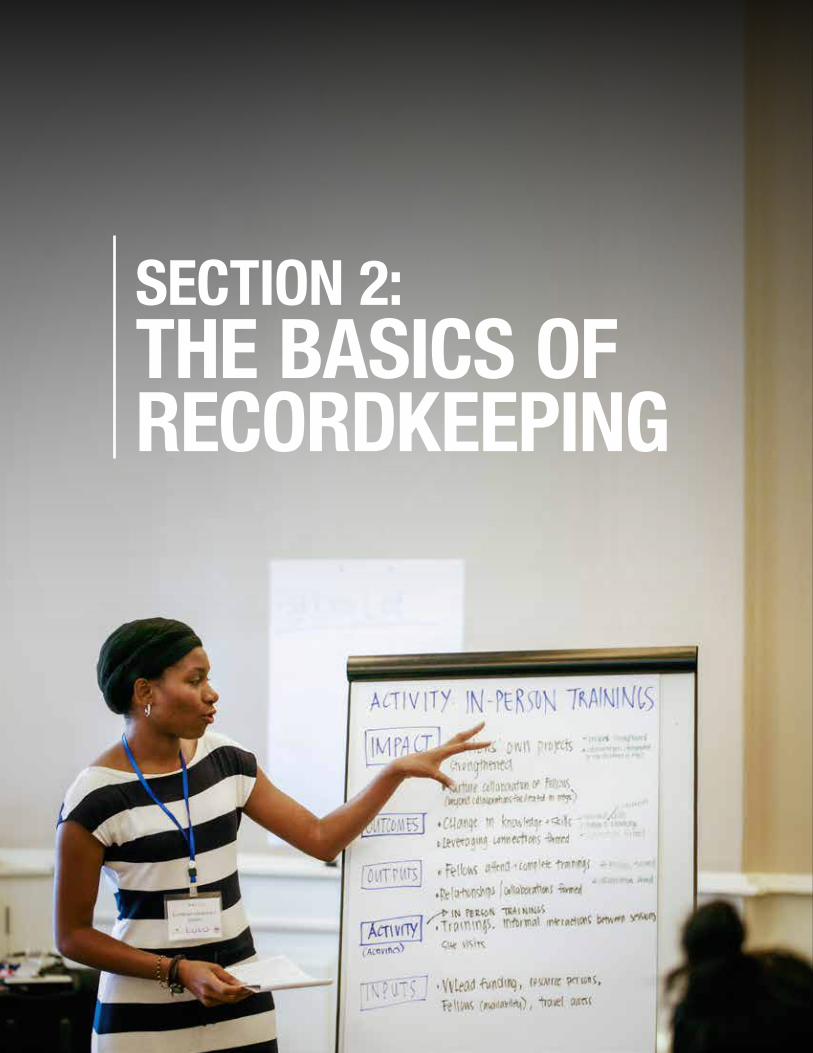
SECTION 2: THE BASICS OF RECORDKEEPING

SECTION 2
A LEADER’S HANDBOOK FOR RECORDKEEPING AND DATA QUALITY 15
THE BASICS OF RECORDKEEPING
HERE ARE THE BASICS:
DECIDE WHAT YOU WANT TO KNOW.
Good recordkeeping starts with a firm idea of what you think will
happen as a result of your project activities (the theory of change
and M&E logic framework mentioned above). Based on this idea,
decide what data you need to collect in order to show whether
your anticipated outcomes have occurred. You need to consider:
• What are my indicators to measure success?
• Are the data available to measure these indicators? If not,
how will this information be collected and tracked, such as
participants’ sex and age (disaggregation)?
• Disaggregation by sex is especially important and should be
a part of your plan from the beginning. Having information
about who benefits from your activities, disaggregated by
men/women and girls/boys, will help you to address gender
inequality in your work.
For example, if you are planning workshops in the community about
the importance of girls’ education, and you want both men and
women to attend because you think that’s important to ensuring girls
can complete school, then you need to track total attendance at the
workshop as well as how many men and how many women attend.
It’s best to think disaggregation through at the beginning to make
sure you’re collecting the information you need along the way.
Templates provided in this handbook can help you with your planning.
1
DISAGGREGATION IS AN IMPORTANT ASPECT OF DATA COLLECTION.
It means breaking down your
data so it tells a story in different
ways and more in-depth. Are you
reaching young people? Rural
people? Unemployed people? How
many men and how many women?
In order to tell a story with this data,
you have to start by collecting it
in the first place. That’s why you
need to decide in advance what kind
of things you want to know about
your beneficiaries. Then you can
be sure to collect this information
through sign-in sheets, surveys, and
registers.
.
RECORDKEEPING IS HOW YOU PUT YOUR M&E (REPORTING) FRAMEWORK INTO ACTION.

SECTION 2
A LEADER’S HANDBOOK FOR RECORDKEEPING AND DATA QUALITY16
CREATE A RECORDKEEPING SYSTEM THAT INCLUDES BOTH THE INDICATORS AND DISAGGREGATION ‑ AND STICK TO IT.
This includes:
• Data collection sheets (registration sheets, sign-in sheets, inventory lists, publication distribution records);
• Guidelines and definitions for collecting the information (such as who counts as a participant and when to count
participants); and,
• Some way of compiling the information, such as a spreadsheet.
Make sure your system works by thinking about the reporting you need to do on a regular basis and at the end of our
project. Adjust your system as necessary to capture the information you will need for internal management and external
reports. Making changes early in the process will be simpler. Changes to the indicators and recordkeeping processes in
the middle of the project may result in problems with data quality. For example, perhaps you have a lending program and
you only record the name, sex, and age for each recipient for the batch of loans. Then for the second batch you decide
you need to know the income level for each recipient. You would not be able to make any comparisons of the income
levels of the recipients of the two batches, or track whether the loans helped people in the first batch to increase their
income over time.
COLLECT BASELINE DATA IF YOU WILL BE REPORTING ON CHANGES.
For example, if you’re trying to improve your approach to outreach, knowing how many people you reached before you
began the improvements will be essential to showing whether you’ve succeeded in increasing that number. If you work
on empowering girls to reach high school or helping women to improve their livelihoods, knowing how many went to
high school or sold items in the market before your interventions is important for comparison at the end of your efforts.
DEVELOP A CHECKLIST TO MAKE SURE YOU COLLECT THE INFORMATION YOU NEED AT KEY MOMENTS.
A checklist should include what you need to do (such as developing a registration form and having copies available) before
activities or events, the date by which tasks need to get done, and who is responsible for performing that task. Following
the checklist will help make sure that you don’t forget to collect the information at the appropriate time – which is during
or right after an activity or event – and information doesn’t get lost.
TABLE 1 PROVIDES AN EXAMPLE. SEE OPPOSITE PAGE.
2
3
4
SECTION 2
A LEADER’S HANDBOOK FOR RECORDKEEPING AND DATA QUALITY 17
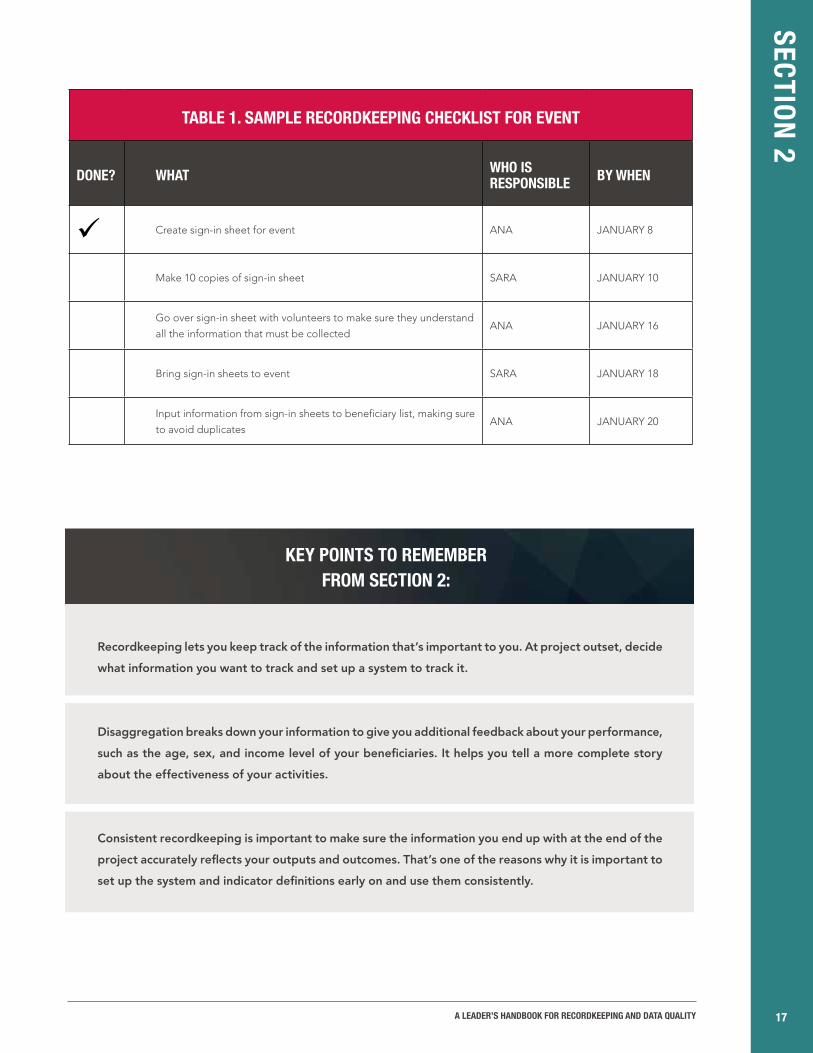
TABLE 1. SAMPLE RECORDKEEPING CHECKLIST FOR EVENT
DONE? WHAT WHO IS RESPONSIBLE BY WHEN
ü Create sign-in sheet for event ANA JANUARY 8
Make 10 copies of sign-in sheet SARA JANUARY 10
Go over sign-in sheet with volunteers to make sure they understand
all the information that must be collectedANA JANUARY 16
Bring sign-in sheets to event SARA JANUARY 18
Input information from sign-in sheets to beneficiary list, making sure
to avoid duplicatesANA JANUARY 20
Recordkeeping lets you keep track of the information that’s important to you. At project outset, decide
what information you want to track and set up a system to track it.
Disaggregation breaks down your information to give you additional feedback about your performance,
such as the age, sex, and income level of your beneficiaries. It helps you tell a more complete story
about the effectiveness of your activities.
Consistent recordkeeping is important to make sure the information you end up with at the end of the
project accurately reflects your outputs and outcomes. That’s one of the reasons why it is important to
set up the system and indicator definitions early on and use them consistently.
KEY POINTS TO REMEMBER FROM SECTION 2:
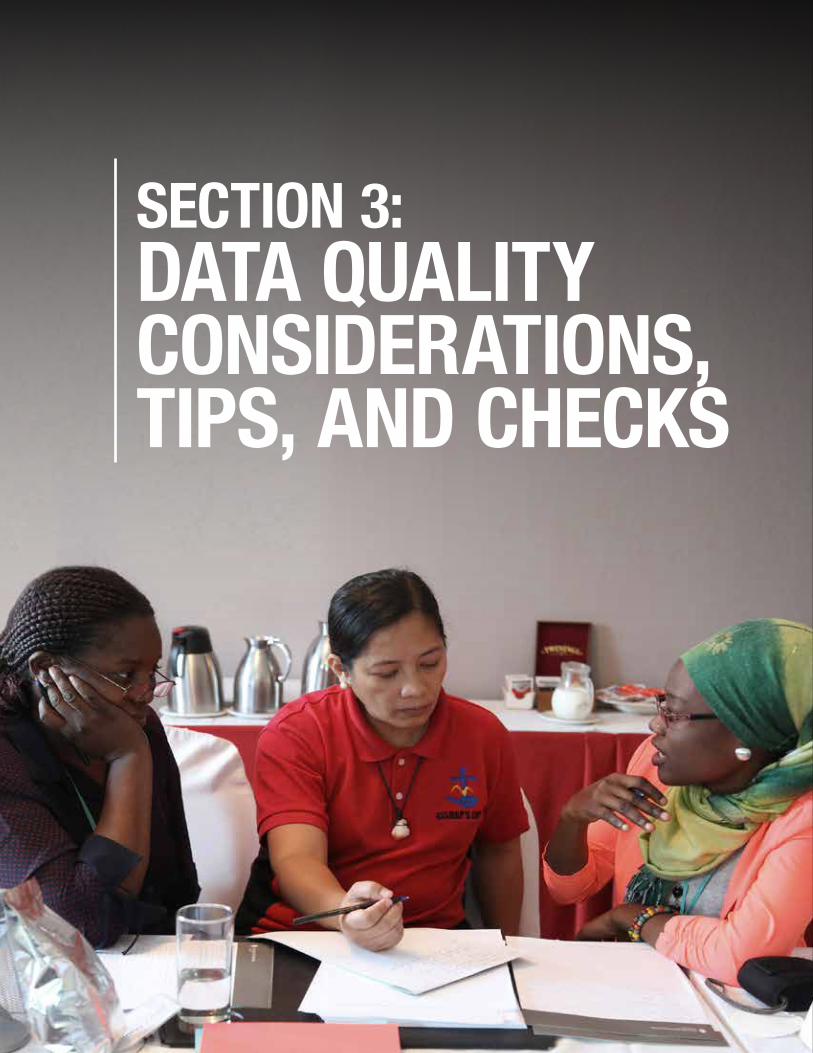
SECTION 3: DATA QUALITY CONSIDERATIONS, TIPS, AND CHECKS

SECTION 3
A LEADER’S HANDBOOK FOR RECORDKEEPING AND DATA QUALITY 19
DATA QUALITY CONSIDERATIONS, TIPS, AND CHECKS
AS DESCRIBED IN THE INTRODUCTION, THE QUALITY OF DATA YOU RECORD AND PRESENT TO STAKEHOLDERS
IS A VERY IMPORTANT ASPECT OF YOUR ONGOING SUCCESS. HIGH DATA QUALITY ALLOWS YOU TO SHOW
CONVINCINGLY HOW EFFECTIVE YOUR ACTIVITIES ARE IN REACHING YOUR DESIRED OBJECTIVES.
If your activities are not reaching your desired objectives, you can make needed adjustments. If they are, then you can
more easily convince those who share your objectives of the importance of supporting your work.
There’s a great deal you can do to ensure data quality by carefully thinking through the M&E framework and how best to
capture results. This section provides an overview of common data quality problems and how you can avoid or address them.
…DATA COLLECTION ENABLES ME TO
PLAN AND MONITOR PERFORMANCE AND
GREATLY AIDS IN DECISION MAKING.
‑ VICTORIA EMAH EMAH VVLead Fellow, Nigeria

SECTION 3
A LEADER’S HANDBOOK FOR RECORDKEEPING AND DATA QUALITY20
The following table defines the dimensions of data quality and provides examples to help you stay on track.
DIMENSIONS OF DATA QUALITY
TABLE 2. DATA QUALITY DIMENSIONS
DIMENSION DEFINITION EXAMPLES
VALIDITY/ACCURACY
The data measure what they are meant to
measure (the intended result) and demonstrate a
plausible contribution of the activity, project, or
organizational effort. Includes:
• FACE VALIDITY: An outsider would agree that the indicator is a valid and logical measure for results
• ATTRIBUTION: Indicators measure the contribution of person/project
• MEASUREMENT ERROR: Data are free from measurement errors
FOR EXAMPLE:
You’re doing this right if… you count beneficiaries
of a project by limiting your measurement to
those directly benefiting from project activities,
and not all those reached by the organization
Stop and rethink if… you show national-level
beneficiaries for a local level event or campaign,
because this may not reflect a realistic result of
your work.
RELIABILITY The data collection processes and analysis are
consistent over time and across different usersFOR EXAMPLE:
You’re doing this right if…Data collection sheets
for beneficiaries record the same categories of
information for every person.
Stop and rethink if… participation registration
sheets are used for some events, while for other
events, you don’t use the sheets and make a
guess afterwards about number of participants.
PRECISION The data are precise if they give sufficient
information to assess performanceFOR EXAMPLE:
You’re doing this right if… you record data on
ages of beneficiaries because you are trying to
understand the effect your work has on young
women.
Stop and rethink if… you want to compare results
in different communities but are not recording
geographical locations in your data collection.

SECTION 3
A LEADER’S HANDBOOK FOR RECORDKEEPING AND DATA QUALITY 21
TABLE 2. DATA QUALITY DIMENSIONS
DIMENSION DEFINITION EXAMPLES
TIMELINESS Data collection is timely if it provides answers when
you and your donors need them (before donor
reports are due; before annual planning; etc)
FOR EXAMPLE:
You’re doing this right if… your data collection
and analysis for activities included in your project
occur before you need to report to your donor.
Stop and rethink if… you typically leave data
collection and analysis until right before a report
is due, giving you little time to clarify and verify
the information collected before you have to
submit the report.
INTEGRITY Personal information (such as names, phone
numbers, email, health information, income) is kept
secure, whether in computer or hard copy files, and
not disclosed to others outside the organization.
FOR EXAMPLE:
You’re doing this right if… only staff and
volunteers trained on data integrity are allowed to
record beneficiary information.
Stop and rethink if…there’s a chance that
someone could enter incorrect information into
the system, or computer files are not backed up
CONFIDENTIALITY Data are complete if they capture the full range of
information that you need to make decisions.FOR EXAMPLE:
You’re doing this right if… computer files with
personal information have password protection.
Stop and rethink if… files are kept unlocked and
accessible to those outside the organization.
COMPLETENESS Input information from sign-in sheets to beneficiary
list, making sure to avoid duplicatesFOR EXAMPLE:
You’re doing this right if… your data reflects all
the different types of products you sell.
Stop and rethink if… you want to know
beneficiaries’ ages, but your sign-in sheet does
not have age ranges for each type of beneficiary.

BEFORE YOU BEGIN
OBJECTIVES
Developing SMART (Specific, Measurable, Achievable, Realistic, and Time-bound) objectives is not only the foundation of
a successful project, it also forms the basis for a strong M&E framework. SMART objectives make it much easier to figure
out what exactly you are trying to achieve and what information you need to collect to show the progress you are making
(see Glossary for more information on SMART objectives).
You can use a simple formula to develop your objective and give yourself the starting point for what you need to measure:
• What needs to change?
• By when?
• By how much?
SMART objectives reduce the likelihood that you will collect data that you don’t need, or miss data that is essential to
your project.
FOCUS
One of the advantages of developing an M&E framework is that it can give you important cues when you’ve taken on too
much or too broad a range of activities. For example, you may find that you need indicators to measure the percentage
of girls in school in your community, the number of new businesses started by women, and the number of politicians who
favor improved policy on gender-based violence. These indicators measure success toward very different objectives, and
it may be hard to measure them all well, unless you are part of a large program with dedicated M&E staff and resources
for data collection. Think critically about the focus of your activities. Are you trying to measure progress toward too
many different kinds of objectives? Select and narrow down your focus of activities to ensure that your project/program/
organization can realistically accomplish results toward your objectives, and that beneficiaries for and effects of all activities
can be measured with confidence.
SECTION 3
A LEADER’S HANDBOOK FOR RECORDKEEPING AND DATA QUALITY22
TIPS FOR ENHANCING DATA QUALITY
TO IMPROVE REPORTING AND YOUR OVERALL M&E SYSTEMS, THE FOLLOWING RECOMMENDATIONS
MAY BE HELPFUL TO YOU:
SECTION 3
A LEADER’S HANDBOOK FOR RECORDKEEPING AND DATA QUALITY 23
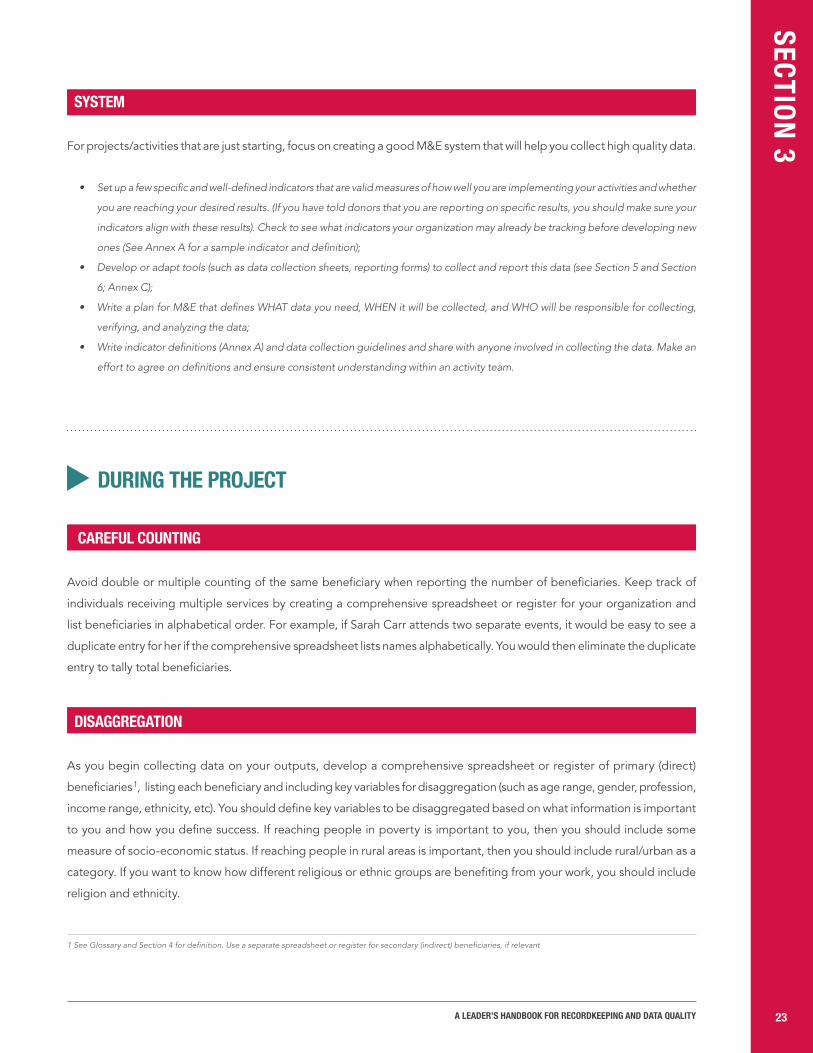
SYSTEM
For projects/activities that are just starting, focus on creating a good M&E system that will help you collect high quality data.
• Set up a few specific and well-defined indicators that are valid measures of how well you are implementing your activities and whether
you are reaching your desired results. (If you have told donors that you are reporting on specific results, you should make sure your
indicators align with these results). Check to see what indicators your organization may already be tracking before developing new
ones (See Annex A for a sample indicator and definition);
• Develop or adapt tools (such as data collection sheets, reporting forms) to collect and report this data (see Section 5 and Section
6; Annex C);
• Write a plan for M&E that defines WHAT data you need, WHEN it will be collected, and WHO will be responsible for collecting,
verifying, and analyzing the data;
• Write indicator definitions (Annex A) and data collection guidelines and share with anyone involved in collecting the data. Make an
effort to agree on definitions and ensure consistent understanding within an activity team.
DURING THE PROJECT
CAREFUL COUNTING
Avoid double or multiple counting of the same beneficiary when reporting the number of beneficiaries. Keep track of
individuals receiving multiple services by creating a comprehensive spreadsheet or register for your organization and
list beneficiaries in alphabetical order. For example, if Sarah Carr attends two separate events, it would be easy to see a
duplicate entry for her if the comprehensive spreadsheet lists names alphabetically. You would then eliminate the duplicate
entry to tally total beneficiaries.
DISAGGREGATION
As you begin collecting data on your outputs, develop a comprehensive spreadsheet or register of primary (direct)
beneficiaries1, listing each beneficiary and including key variables for disaggregation (such as age range, gender, profession,
income range, ethnicity, etc). You should define key variables to be disaggregated based on what information is important
to you and how you define success. If reaching people in poverty is important to you, then you should include some
measure of socio-economic status. If reaching people in rural areas is important, then you should include rural/urban as a
category. If you want to know how different religious or ethnic groups are benefiting from your work, you should include
religion and ethnicity.
1 See Glossary and Section 4 for definition. Use a separate spreadsheet or register for secondary (indirect) beneficiaries, if relevant
GEOGRAPHY
Think through the locations where your activities take place and whom they are intended to benefit. Are they all at
the community level? Do they go beyond the community to reach a specific geographical region of your country? The
whole country? Do you reach an international audience? Compile a list of all geographical areas where your activities are
implemented to allow for classification of your activities and subsequent data collection from these levels.
For example, if you conduct workshops and advocacy events at a community level, and media outreach and communications
at a national level, by categorizing them, you can report on these activities’ outputs by geographical level. It will help you
show the breadth of your reach, and see if necessary adjustments need to be made if your targets focused elsewhere.
MONITORING DIVERGENCE
As you routinely collect data, pay particular attention when recording and analyzing data that reflect higher or lower outputs
than you expected, and how these fit into the history and overall data trends. Document anything that made that activity or
event different, so you can make sense of the variation from expected output. For example, activities held around holidays
or during vacation times may have different results. This will make reporting on the results much easier down the road.
SHARING
Make an effort to network in your country/city in order to share information related to reporting and use of data. Describe
to others working for social change the benefits you have seen from improving your M&E efforts. For example, if you
have improved your outreach to a specific community of beneficiaries because of what you have learned from your data
collection, that’s something others would be interested in as well. Spreading the word about M&E can improve how others
capture success, and can increase your impact on movements for social change.
IMPROVING
Identify areas where you feel like your or your organization’s M&E skills can be improved, and develop a plan for improving
those skills. When necessary, seek technical assistance from experts in your organization or from online discussion groups
or seminars on M&E development. Adapt templates for data collection, data management and use, etc., from online
resource sites. Find peer fellows in your community, city, or even country, and meet, email or talk on the phone to discuss
M&E, share experiences and learn from each other.
SECTION 3
A LEADER’S HANDBOOK FOR RECORDKEEPING AND DATA QUALITY24

SECTION 3
A LEADER’S HANDBOOK FOR RECORDKEEPING AND DATA QUALITY 25
PROMISING PRACTICE:One VVLead fellow improved the timeliness of her organization’s reporting by instituting both electronic
reporting and a 24-hour reporting policy for the project.

SECTION 3
A LEADER’S HANDBOOK FOR RECORDKEEPING AND DATA QUALITY26
An RDQA is a good way to make sure your data is in good condition – in other words, that you are “keeping your house
in order.” It can be hard to set aside time to do this, but it is worthwhile. An RDQA can tell you some important things
about not just your data quality, but the quality and characteristics of your activities/project overall. This can be helpful if
you are thinking of replicating or scaling up the project, because it can give you important lessons from your experience
to apply as you move forward. An RDQA also prepares you for an external audit if one were to happen.
TABLE 3. CHARACTERISTICS OF DQA VERSUS RDQA
DOA RDQA
Assessment by donor or other stakeholder Self-assessment by program/organization
Standard approach to implementationFlexible use by programs for monitoring and supervision; or to prepare for an external audit
Conducted by an external audit teamConducted by internal audit team, or external team hired by organization
Internal stakeholders (organization and program staff) have limited input into recommendations
Program makes and implements own action plan in response to findings
ROUTINE CHECKS
ANOTHER IMPORTANT STRATEGY TO MAKE SURE YOU ARE COLLECTING AND REPORTING DATA THAT ARE
OF HIGH QUALITY IS TO PARTICIPATE IN EXTERNAL DATA QUALITY ASSESSMENTS (DQA) AND IMPLEMENT
ROUTINE DATA QUALITY ASSESSMENTS (RDQA).
DQAs are conducted by outside stakeholders, generally supported by donors. The Routine Data Quality Assessment
(RDQA) tool is a simplified version of the DQA. Instead of being driven by an external audit team, an internal team
uses an RDQA tool to assess a program/project’s ability to report quality data. Neither of these tools checks how you
accomplish your program objectives, but both help you check how much confidence you should have in your data – and
more importantly, how you can improve collecting and using data for internal and external reporting. The following table
describes the differences between a DQA and RDQA.
SECTION 3
A LEADER’S HANDBOOK FOR RECORDKEEPING AND DATA QUALITY 27
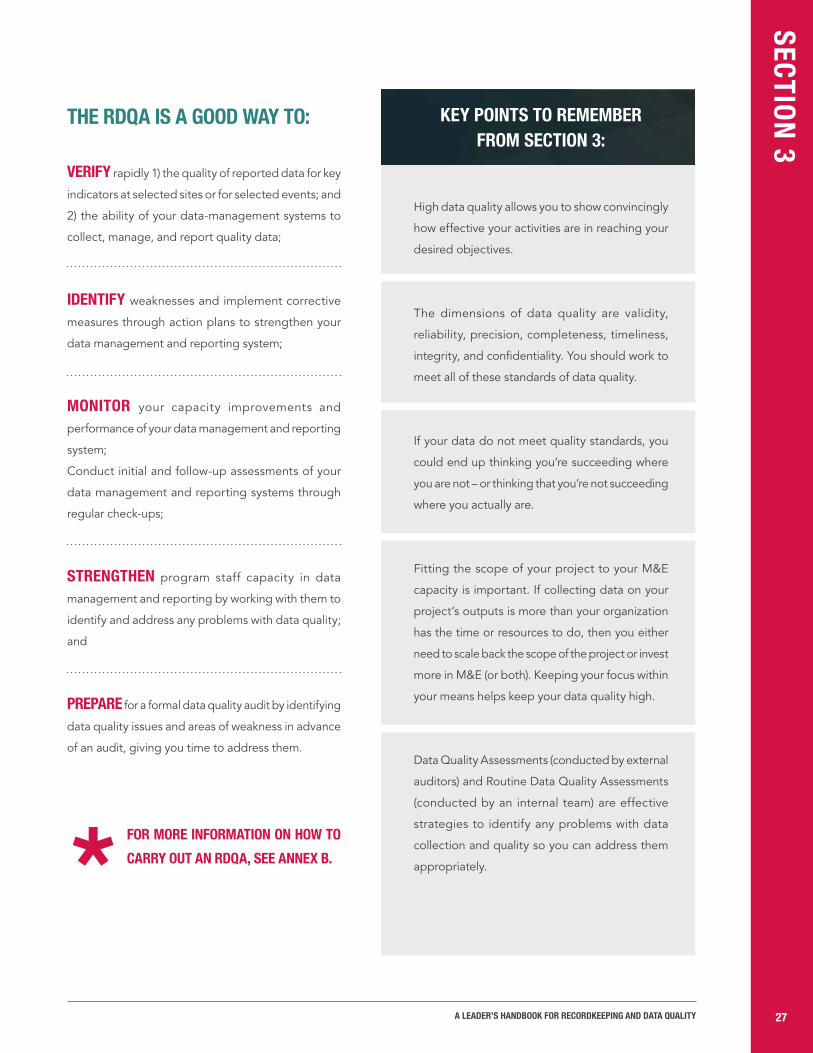
THE RDQA IS A GOOD WAY TO:
VERIFY rapidly 1) the quality of reported data for key
indicators at selected sites or for selected events; and
2) the ability of your data-management systems to
collect, manage, and report quality data;
IDENTIFY weaknesses and implement corrective
measures through action plans to strengthen your
data management and reporting system;
MONITOR your capacity improvements and
performance of your data management and reporting
system;
Conduct initial and follow-up assessments of your
data management and reporting systems through
regular check-ups;
STRENGTHEN program staff capacity in data
management and reporting by working with them to
identify and address any problems with data quality;
and
PREPARE for a formal data quality audit by identifying
data quality issues and areas of weakness in advance
of an audit, giving you time to address them.
FOR MORE INFORMATION ON HOW TO CARRY OUT AN RDQA, SEE ANNEX B.
High data quality allows you to show convincingly
how effective your activities are in reaching your
desired objectives.
The dimensions of data quality are validity,
reliability, precision, completeness, timeliness,
integrity, and confidentiality. You should work to
meet all of these standards of data quality.
If your data do not meet quality standards, you
could end up thinking you’re succeeding where
you are not – or thinking that you’re not succeeding
where you actually are.
Fitting the scope of your project to your M&E
capacity is important. If collecting data on your
project’s outputs is more than your organization
has the time or resources to do, then you either
need to scale back the scope of the project or invest
more in M&E (or both). Keeping your focus within
your means helps keep your data quality high.
Data Quality Assessments (conducted by external
auditors) and Routine Data Quality Assessments
(conducted by an internal team) are effective
strategies to identify any problems with data
collection and quality so you can address them
appropriately.
KEY POINTS TO REMEMBER FROM SECTION 3:
SECTION 4: REPORTING ON KEY OUTPUT INDICATORS

SECTION 4
A LEADER’S HANDBOOK FOR RECORDKEEPING AND DATA QUALITY 29
DATA QUALITY CONSIDERATIONS, TIPS, AND CHECKS
IN THIS SECTION, WE’LL EXAMINE KEY INDICATORS THAT YOU CAN USE TO TRACK YOUR PROGRESS
TOWARD YOUR OBJECTIVES. AS WE’VE DISCUSSED, INDICATORS ARE USED TO MEASURE THE CHANGE THAT
HAPPENS AS A RESULT OF YOUR WORK. THEY ARE THE BUILDING BLOCKS FOR YOUR M&E FRAMEWORK,
CRUCIAL FOR DECISION‑MAKING ABOUT YOUR ACTIVITIES.
OUTPUT indicators (the focus of this handbook) measure the immediate results of what you do, including number of people
participating in a workshop, or number of items sold.
OUTCOME indicators (not covered here but important for measuring progress) measure the next level results, such as
percentage of people in a community who approve of girls’ education, or number of policymakers who vote in favor of a
bill banning child marriage.
KEY QUESTIONSWhen choosing output indicators, ask yourself these key questions:
• Does everyone who works on this project know exactly what this indicator means?
• Does this indicator help describe how I am doing in reaching my objective?
• Can I collect this information? Do I have the time and resources set aside to collect it, or can I get the information
from an outside source?
• How often do I need to collect information on this indicator?
The example in Annex A provides a template you can use to help answer these questions.
SECTION 4
A LEADER’S HANDBOOK FOR RECORDKEEPING AND DATA QUALITY30
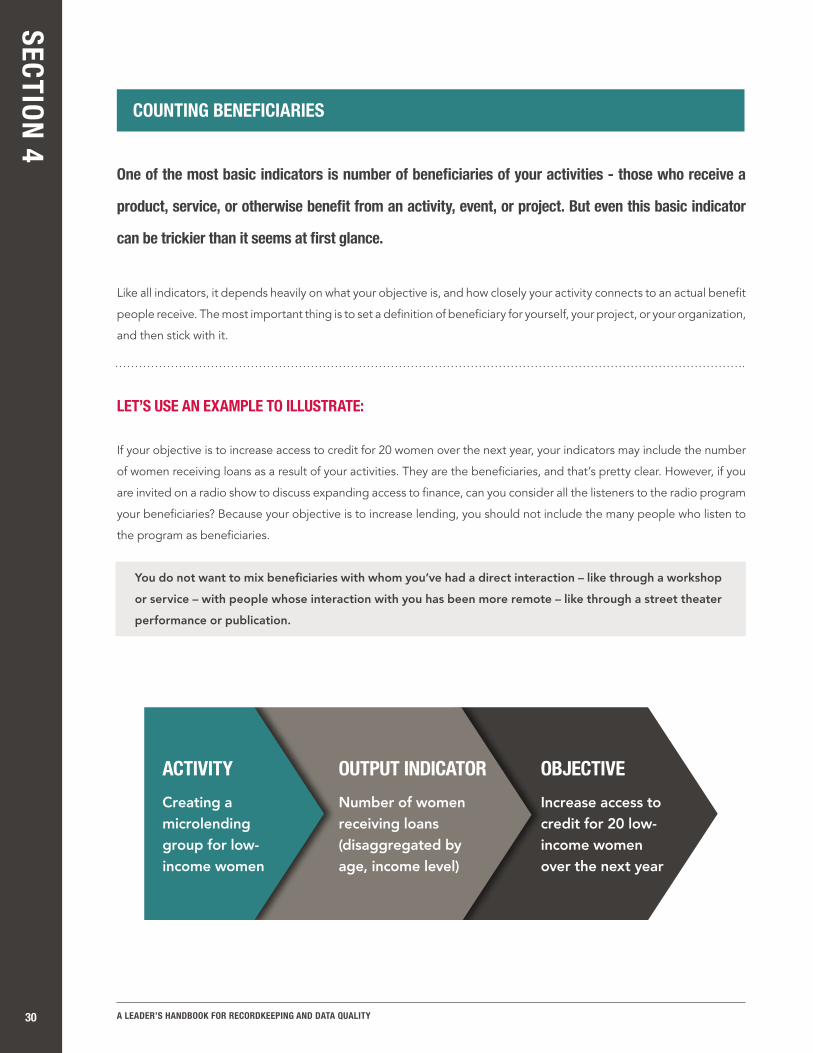
One of the most basic indicators is number of beneficiaries of your activities - those who receive a
product, service, or otherwise benefit from an activity, event, or project. But even this basic indicator
can be trickier than it seems at first glance.
Like all indicators, it depends heavily on what your objective is, and how closely your activity connects to an actual benefit
people receive. The most important thing is to set a definition of beneficiary for yourself, your project, or your organization,
and then stick with it.
LET’S USE AN EXAMPLE TO ILLUSTRATE:
If your objective is to increase access to credit for 20 women over the next year, your indicators may include the number
of women receiving loans as a result of your activities. They are the beneficiaries, and that’s pretty clear. However, if you
are invited on a radio show to discuss expanding access to finance, can you consider all the listeners to the radio program
your beneficiaries? Because your objective is to increase lending, you should not include the many people who listen to
the program as beneficiaries.
You do not want to mix beneficiaries with whom you’ve had a direct interaction – like through a workshop
or service – with people whose interaction with you has been more remote – like through a street theater
performance or publication.
COUNTING BENEFICIARIES
ACTIVITYCreating a microlending group for low-income women
OUTPUT INDICATORNumber of women receiving loans (disaggregated by age, income level)
OBJECTIVE Increase access to credit for 20 low-income women over the next year
SECTION 4
A LEADER’S HANDBOOK FOR RECORDKEEPING AND DATA QUALITY 31
If you had another objective to increase public awareness of access to finance, then you could include the number of radio
program listeners in your output indicators as evidence that you have increased public awareness, but you may not want
to consider these people project beneficiaries because they have received no direct service from that particular activity.
However, there are no firm rules – if you or your organization to decide to count radio listeners as your beneficiaries, that
is fine as long as you are able to be consistent and make a strong case for why you consider them beneficiaries.
It’s also useful to break down your beneficiaries into two groups. A direct (or primary) beneficiary is someone whose
benefit can be directly attributed to the activity, event or project. In the example above, the project’s loan recipients are
direct beneficiaries. An indirect (or secondary) beneficiary receives that benefit through the direct beneficiary. Counting
indirect beneficiaries can assist in establishing your work’s multiplier effect the communities you serve. A multiplier effect
is a calculation of the extension of the project or activity beyond the direct beneficiaries. For example, if you develop
the capacity of peer trainers, and each peer trainer recruits and trains other peer trainers, then the effect of your original
training is multiplied. Counting these indirect beneficiaries – people trained by your peer trainers – is important, because
it shows that the results of your activities are extending beyond your original activity.
Instead of an organizational objective, perhaps you are pursuing a personal leadership objective to increase women’s
leadership in business in your country. For example, you may be pursuing this objective by mentoring women in business
school to help them achieve their goals. If after one year, you have mentored five young women, then they are your
beneficiaries. Even if the percentage of women business leaders increases over the course of that year, you would not
claim the additional women business leaders as your beneficiaries, because they have received no direct benefit from
your mentorship and therefore are not a valid representation of your success.
WE HAVE SCALED UP OUR M&E UNIT BY
ENGAGING A DATA ENTRY CLERK, 30 SITE
DATA COLLECTORS (VOLUNTEERS), QUALITY
MONITORING OFFICER AND M&E MANAGER.
WE NOW HAVE A CHALLENGE OF OFFICE
SPACE TO CONTAIN THE M&E UNIT.
‑ VICTORIA EMAH EMAH VVLead Fellow, Nigeria
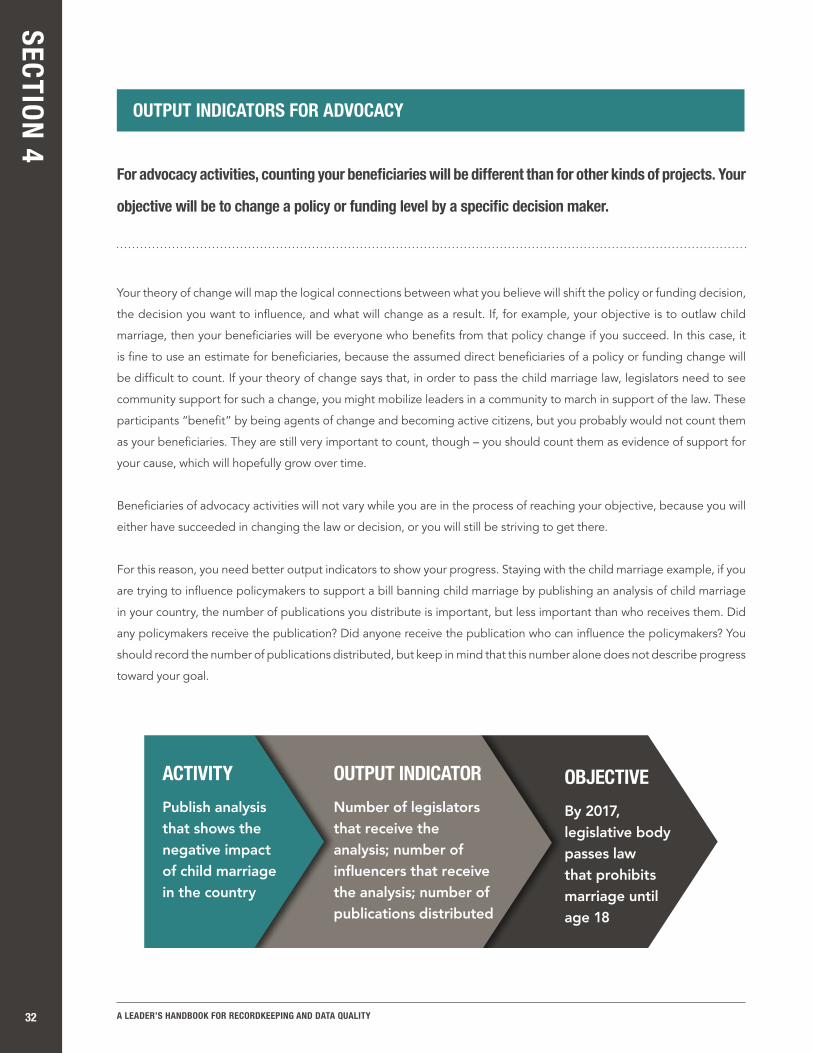
ACTIVITYPublish analysis that shows the negative impact of child marriage in the country
OUTPUT INDICATORNumber of legislators that receive the analysis; number of influencers that receive the analysis; number of publications distributed
OBJECTIVE By 2017, legislative body passes law that prohibits marriage until age 18
SECTION 4
A LEADER’S HANDBOOK FOR RECORDKEEPING AND DATA QUALITY32
For advocacy activities, counting your beneficiaries will be different than for other kinds of projects. Your
objective will be to change a policy or funding level by a specific decision maker.
Your theory of change will map the logical connections between what you believe will shift the policy or funding decision,
the decision you want to influence, and what will change as a result. If, for example, your objective is to outlaw child
marriage, then your beneficiaries will be everyone who benefits from that policy change if you succeed. In this case, it
is fine to use an estimate for beneficiaries, because the assumed direct beneficiaries of a policy or funding change will
be difficult to count. If your theory of change says that, in order to pass the child marriage law, legislators need to see
community support for such a change, you might mobilize leaders in a community to march in support of the law. These
participants “benefit” by being agents of change and becoming active citizens, but you probably would not count them
as your beneficiaries. They are still very important to count, though – you should count them as evidence of support for
your cause, which will hopefully grow over time.
Beneficiaries of advocacy activities will not vary while you are in the process of reaching your objective, because you will
either have succeeded in changing the law or decision, or you will still be striving to get there.
For this reason, you need better output indicators to show your progress. Staying with the child marriage example, if you
are trying to influence policymakers to support a bill banning child marriage by publishing an analysis of child marriage
in your country, the number of publications you distribute is important, but less important than who receives them. Did
any policymakers receive the publication? Did anyone receive the publication who can influence the policymakers? You
should record the number of publications distributed, but keep in mind that this number alone does not describe progress
toward your goal.
OUTPUT INDICATORS FOR ADVOCACY
SECTION 4
A LEADER’S HANDBOOK FOR RECORDKEEPING AND DATA QUALITY 33
SAMPLE INDICATORS
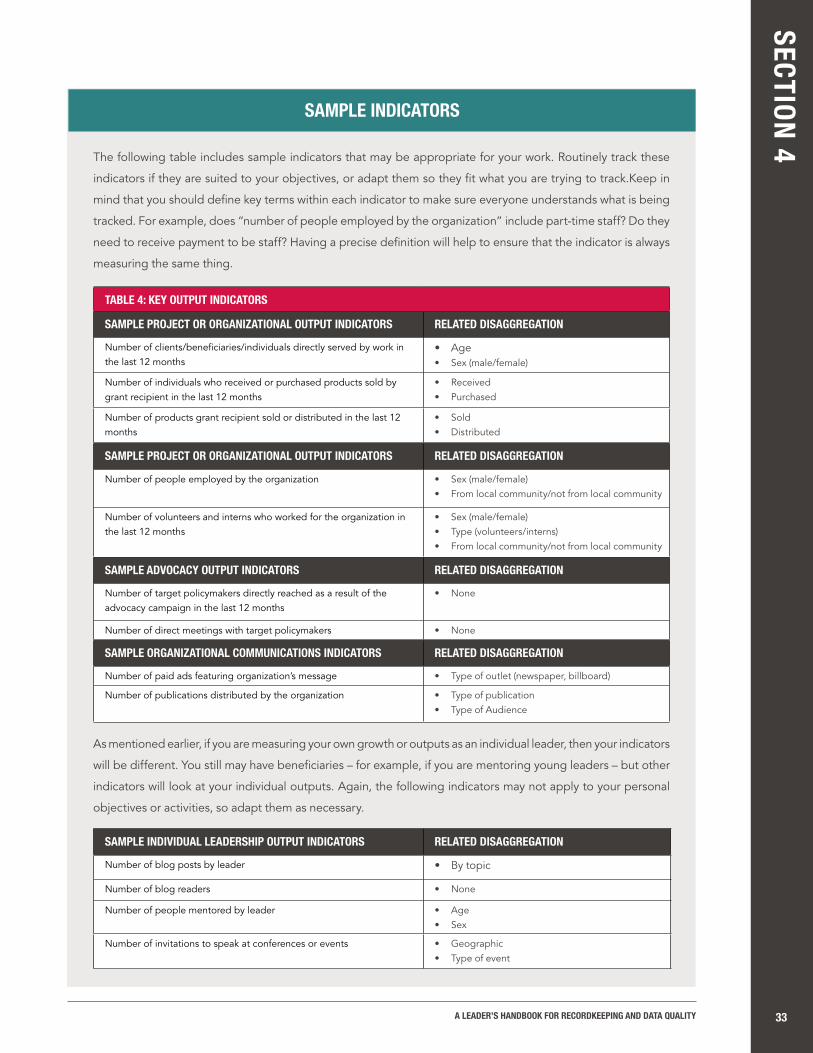
The following table includes sample indicators that may be appropriate for your work. Routinely track these
indicators if they are suited to your objectives, or adapt them so they fit what you are trying to track.Keep in
mind that you should define key terms within each indicator to make sure everyone understands what is being
tracked. For example, does “number of people employed by the organization” include part-time staff? Do they
need to receive payment to be staff? Having a precise definition will help to ensure that the indicator is always
measuring the same thing.
As mentioned earlier, if you are measuring your own growth or outputs as an individual leader, then your indicators
will be different. You still may have beneficiaries – for example, if you are mentoring young leaders – but other
indicators will look at your individual outputs. Again, the following indicators may not apply to your personal
objectives or activities, so adapt them as necessary.
TABLE 4: KEY OUTPUT INDICATORS
SAMPLE PROJECT OR ORGANIZATIONAL OUTPUT INDICATORS RELATED DISAGGREGATION
Number of clients/beneficiaries/individuals directly served by work in the last 12 months
• Age • Sex (male/female)
Number of individuals who received or purchased products sold by grant recipient in the last 12 months
• Received• Purchased
Number of products grant recipient sold or distributed in the last 12 months
• Sold• Distributed
SAMPLE PROJECT OR ORGANIZATIONAL OUTPUT INDICATORS RELATED DISAGGREGATION
Number of people employed by the organization • Sex (male/female)• From local community/not from local community
Number of volunteers and interns who worked for the organization in the last 12 months
• Sex (male/female)• Type (volunteers/interns)• From local community/not from local community
SAMPLE ADVOCACY OUTPUT INDICATORS RELATED DISAGGREGATION
Number of target policymakers directly reached as a result of the advocacy campaign in the last 12 months
• None
Number of direct meetings with target policymakers • None
SAMPLE ORGANIZATIONAL COMMUNICATIONS INDICATORS RELATED DISAGGREGATION
Number of paid ads featuring organization’s message • Type of outlet (newspaper, billboard)
Number of publications distributed by the organization • Type of publication• Type of Audience
SAMPLE INDIVIDUAL LEADERSHIP OUTPUT INDICATORS RELATED DISAGGREGATION
Number of blog posts by leader • By topic
Number of blog readers • None
Number of people mentored by leader • Age• Sex
Number of invitations to speak at conferences or events • Geographic• Type of event
SECTION 4
A LEADER’S HANDBOOK FOR RECORDKEEPING AND DATA QUALITY34
Regular data collection and reporting are very important because they allow you to keep your records
up to date, and ensure timeliness and accuracy of data collection.
If your data collection is a month after an event, for example, you may
forget or lose key details about the event. Regular reporting on the data
you collect lets your donors and supporters know that you understand
the importance of tracking your outputs, and you are thinking about
what information they need. Keeping your donors informed about your
successes increases their confidence that their investment in you and
in women’s empowerment has value.
As this handbook has described elsewhere, to collect the data to report
on these indicators, you will use source documents such as sign-in sheets,
client intake sheets, training registers, product distribution logs, etc.
You can then tally the data from these source documents for reporting
to donors to show progress in meeting project/program objectives.
COLLECTION FREQUENCY AND SOURCES
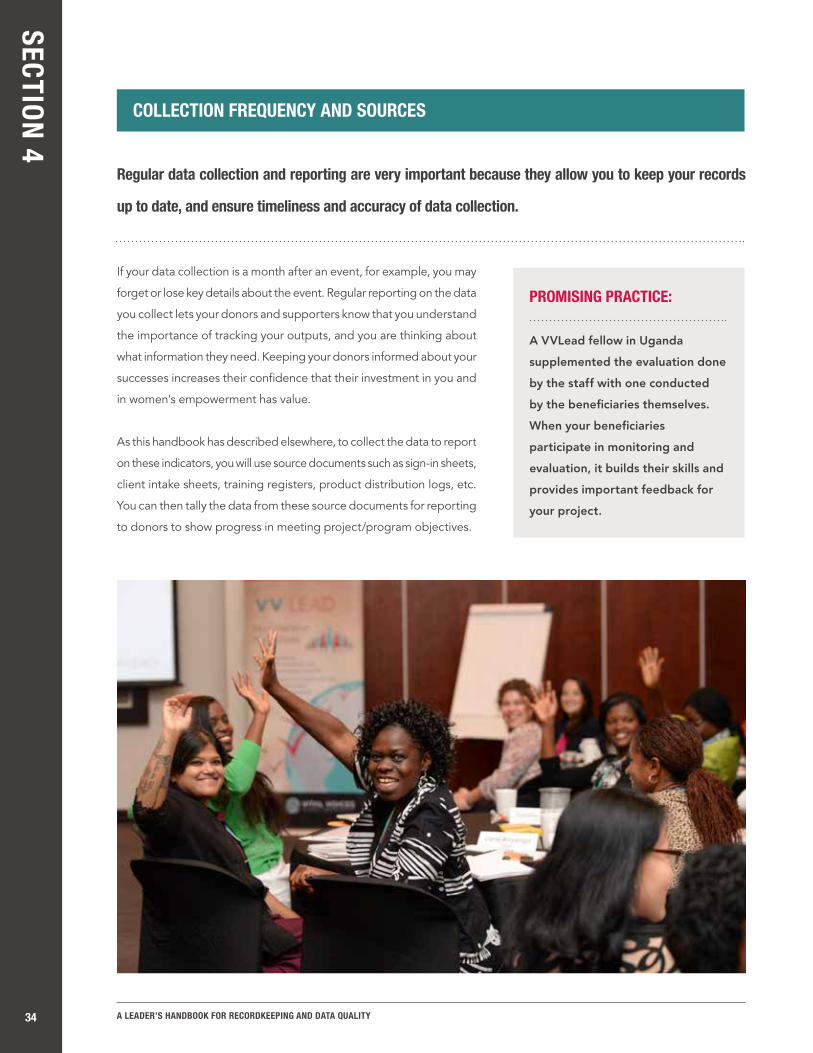
PROMISING PRACTICE:
A VVLead fellow in Uganda
supplemented the evaluation done
by the staff with one conducted
by the beneficiaries themselves.
When your beneficiaries
participate in monitoring and
evaluation, it builds their skills and
provides important feedback for
your project.

SECTION 4
A LEADER’S HANDBOOK FOR RECORDKEEPING AND DATA QUALITY 35
It’s important to remember that disaggregation of these data has to begin with the original source of the
data – the source documents.
In most cases, it is not practical to go backwards and divide data that have already been collected. For example, if your
source document or registry only lists the name of each child attending school, and you later want to know the percentage
of a certain age group attending school, you will be out of luck!
As described above, disaggregation of data or background characteristics is an important element of providing quality data,
as well as an important element of reducing inequality. It also allows you to tell a richer story with your data. For example,
instead of just reporting beneficiaries served, having sex-disaggregated data provides additional information that can
be used to improve programming and serve men and women (or boys and girls) equally. Similarly, when disaggregation
provides information on whether staff and volunteers have been hired or recruited from the local community or not, managers
can adjust their recruitment efforts if their hiring and recruiting is not representing the community as much as they’d like.
Because disaggregating data has so much value for you and for other stakeholders it is strongly recommended.
DISAGGREGATION AND SOURCE DOCUMENTS
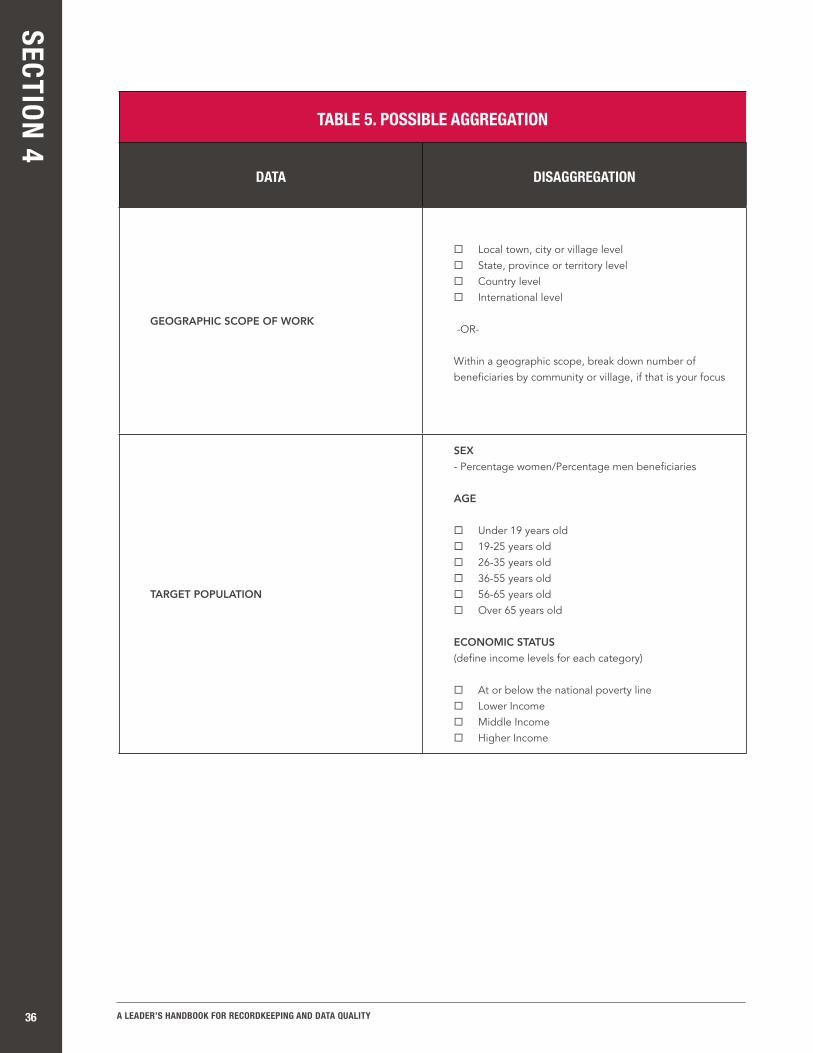
When reporting on your disaggregated data, you’ll likely want to fold that information back up into groups
that make sense for your project. After all, if you don’t group the information, you may end up reporting
a list of each beneficiary and his or her characteristics!
For example, if you are conducting workshops on human rights for adolescents and youth living with HIV, you will want to
record the age of each participant on your workshop sign-in sheet. When you report on participation, you should group
participants together in age ranges that are meaningful for your project. It shouldn’t just be one group (like 10-25) because
this doesn’t allow you to tell a story about who is participating in your workshops. It’s more meaningful to be able to say,
for example, “We had 12 participants under 14, 10 who are 15-19, and 23 who are 20-25.” This aggregation also allows
you to make adjustments if you are falling short of your expectations in any of these categories.
AGGREGATION FOR REPORTING
SECTION 4
A LEADER’S HANDBOOK FOR RECORDKEEPING AND DATA QUALITY36
TABLE 5. POSSIBLE AGGREGATION
DATA DISAGGREGATION
GEOGRAPHIC SCOPE OF WORK
¨ Local town, city or village level¨ State, province or territory level¨ Country level¨ International level
-OR-
Within a geographic scope, break down number of beneficiaries by community or village, if that is your focus
TARGET POPULATION
SEX
- Percentage women/Percentage men beneficiaries
AGE
¨ Under 19 years old¨ 19-25 years old¨ 26-35 years old¨ 36-55 years old¨ 56-65 years old¨ Over 65 years old
ECONOMIC STATUS
(define income levels for each category)
¨ At or below the national poverty line¨ Lower Income¨ Middle Income¨ Higher Income

SECTION 4
A LEADER’S HANDBOOK FOR RECORDKEEPING AND DATA QUALITY 37
Output indicators measure the immediate results of your work. Make sure the output indicators you
use are appropriate measures of whether or not you are advancing toward your objective.
Beneficiaries are people who have benefited from your work. Tracking the number of people you benefit
helps to show how you’re performing.
• Direct (or primary) beneficiaries are individuals whose benefit or service can be directly attributed
to the activity, project, person, or organization being monitored.
• Indirect (or secondary) beneficiaries are individuals whose benefit or service can be attributed to
a direct beneficiary.
You should keep in mind the quality and closeness of your interaction with people when counting
beneficiaries. You can still record and report on numbers of people who don’t qualify as beneficiaries –
such as the number of people who see your website – but it’s best not to combine those numbers with
those with whom you interact directly.
Collect information with source documents (sign-in sheets, training registers, product distribution
lists, etc.) that include the disaggregation you need. Group information together in meaningful ways
for reporting purposes.
KEY POINTS TO REMEMBER FROM SECTION 4:
SECTION 5: INDICATOR REPORTING TEMPLATES

SECTION 5
A LEADER’S HANDBOOK FOR RECORDKEEPING AND DATA QUALITY 39
INDICATOR REPORTING TEMPLATES
THERE ARE MANY DIFFERENT WAYS OF KEEPING TRACK OF DATA. WHEN CREATING YOUR RECORDKEEPING
SYSTEM, FIGURE OUT WHAT WILL WORK BEST FOR YOU/YOUR ORGANIZATION.
While computer files are great for compiling information collected, a notebook can also be a good way to tally numbers
and types of participants or beneficiaries, as long as you are consistent in what you’re recording and how you’re counting
beneficiaries. To make your life a little easier, this handbook offers a set of sample reporting templates (spreadsheets,
worksheets, etc) that you can use or adapt to your own needs.
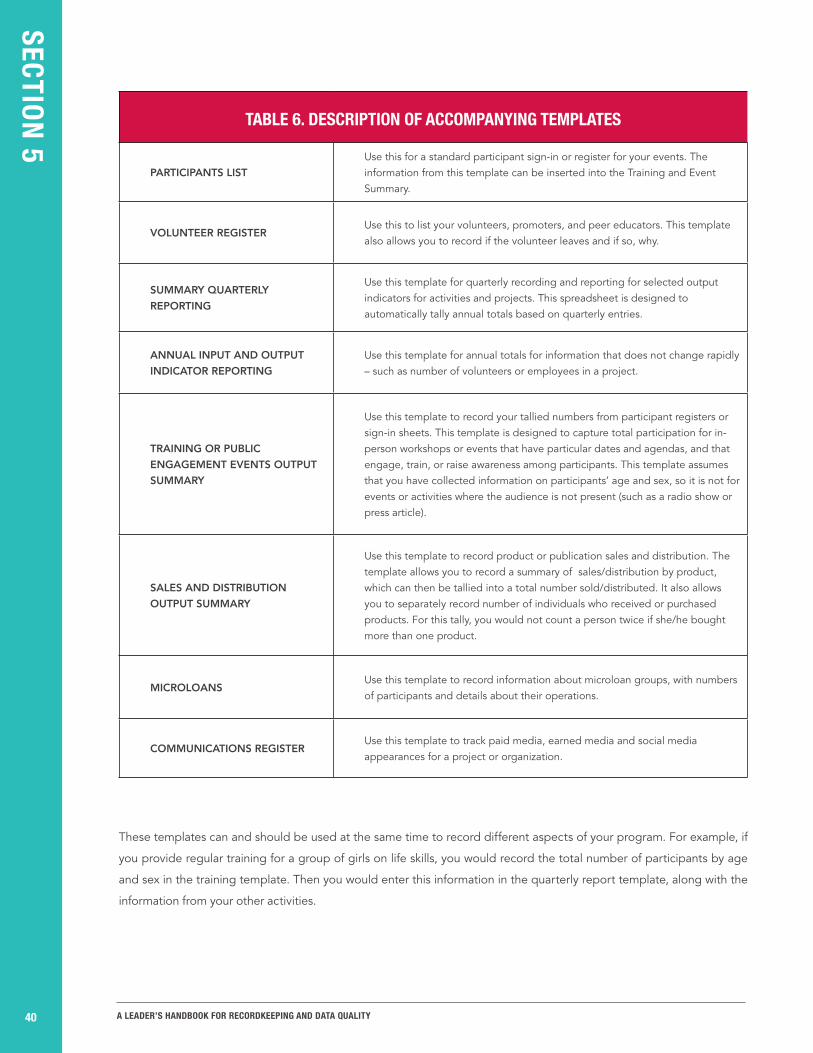
The templates include prompts in column headings and examples at the bottom to help guide you in what information to
enter in each. Please note that these templates will not meet the needs of every activity/project/program, so you should
make sure you adapt them to your needs. Specific templates provided in the annex are:
SECTION 5
A LEADER’S HANDBOOK FOR RECORDKEEPING AND DATA QUALITY40
TABLE 6. DESCRIPTION OF ACCOMPANYING TEMPLATES
PARTICIPANTS LIST
Use this for a standard participant sign-in or register for your events. The information from this template can be inserted into the Training and Event Summary.
VOLUNTEER REGISTERUse this to list your volunteers, promoters, and peer educators. This template also allows you to record if the volunteer leaves and if so, why.
SUMMARY QUARTERLY
REPORTING
Use this template for quarterly recording and reporting for selected output indicators for activities and projects. This spreadsheet is designed to automatically tally annual totals based on quarterly entries.
ANNUAL INPUT AND OUTPUT
INDICATOR REPORTING
Use this template for annual totals for information that does not change rapidly – such as number of volunteers or employees in a project.
TRAINING OR PUBLIC
ENGAGEMENT EVENTS OUTPUT
SUMMARY
Use this template to record your tallied numbers from participant registers or sign-in sheets. This template is designed to capture total participation for in-person workshops or events that have particular dates and agendas, and that engage, train, or raise awareness among participants. This template assumes that you have collected information on participants’ age and sex, so it is not for events or activities where the audience is not present (such as a radio show or press article).
SALES AND DISTRIBUTION
OUTPUT SUMMARY
Use this template to record product or publication sales and distribution. The template allows you to record a summary of sales/distribution by product, which can then be tallied into a total number sold/distributed. It also allows you to separately record number of individuals who received or purchased products. For this tally, you would not count a person twice if she/he bought more than one product.
MICROLOANSUse this template to record information about microloan groups, with numbers of participants and details about their operations.
COMMUNICATIONS REGISTERUse this template to track paid media, earned media and social media appearances for a project or organization.
These templates can and should be used at the same time to record different aspects of your program. For example, if
you provide regular training for a group of girls on life skills, you would record the total number of participants by age
and sex in the training template. Then you would enter this information in the quarterly report template, along with the
information from your other activities.

SECTION 5
A LEADER’S HANDBOOK FOR RECORDKEEPING AND DATA QUALITY 41
Your recordkeeping system does not have to
be complicated; it just needs to be consistent.
Spreadsheets are helpful because they allow
you to automatically tally totals and keep
information secure.
KEY POINTS TO REMEMBER FROM SECTION 5:

SECTION 5
A LEADER’S HANDBOOK FOR RECORDKEEPING AND DATA QUALITY42
Hopefully you have learned through this handbook that data quality and recordkeeping are essential pieces of your work,
and that with a little forethought, you can design a data collection system that fits your needs and/or the needs of your
organization. While monitoring and evaluation (M&E) can seem overwhelming, even simple steps toward improved data
quality can greatly expand your understanding of your successes and areas for development.
TO REVIEW, HERE ARE SOME OF THE MAIN POINTS OF THE HANDBOOK:
SECTION 1: • Improving data collection has important benefits, including increased credibility with donors and better
management decisions.
• A monitoring and evaluation (M&E) system lays out the logic of your theory of change and gives you the map
that tells you how well you are doing toward reaching your objectives.
• Measuring outputs – the immediate results of your activities – is the first step in gauging whether your work
is succeeding.
• Your M&E and data collection system should fit the resources of your organization in terms of time and
money. A simple system is more effective than one that is too complicated for your organization to manage.
SECTION 2:• Even a simple recordkeeping system can allow you to track the information important to your work.
• Disaggregation – collecting information with all the details you need – helps you tell a richer story about your
work, such as how men and women are participating or benefitting differently.
SECTION 3:• Data quality is important to make sure you aren’t missing important information – that you know with confidence
when you are making progress and when you are not.
• You should strive to make sure your data meets standards for validity, reliability, integrity, precision and
timeliness.
SECTION 4:• Your output indicators should tell you whether the immediate results of your activities are helping you reach
your objectives.
• Counting direct beneficiaries is one important way of measuring outputs. You should consider your level of
interaction when defining beneficiaries.
• Counting indirect beneficiaries is a good way to determine whether your work has influence beyond your
activities.
SECTION 5:• Your recordkeeping system does not have to be complicated, it just needs to be consistent.
CONCLUSION

SECTION 5
A LEADER’S HANDBOOK FOR RECORDKEEPING AND DATA QUALITY 43
Many leaders have been in the same position that you are in seeking to improve data quality, some of
whom have started from having no system at all. Here are some examples of simple changes VVLead
fellows made that had important results:
We hope that, like these fellows, you will find the changes that work for you or your organization, helping
you gather the data you need to make better decisions and gain further support for your important efforts.
IN UGANDA, Rehmah Kasule built on her solid
M&E practices by instituting a 24-hour reporting
policy and electronic reporting to improve
timeliness. She also conducted capacity
assessments and training sessions in M&E for
program staff.
NIGERIAN fellow Victoria Emah-Emah
has improved on her mechanisms for
collection, analysis and reporting of
data. She now has an M&E manager,
written data collection guidelines, and
standardized templates.
IN KENYA, Njambi Kiritu has manages her data using
an Excel package, thus facilitating easy data entry and
analysis (including disaggregation). Computerized records
have made it easy for her to call up any records and/or
consult with staff at any given time to get a feel of what
is happening, and what needs improvement/changing.

A LEADER’S HANDBOOK FOR RECORDKEEPING AND DATA QUALITY44
GLOSSARY

GLOSSARY
A LEADER’S HANDBOOK FOR RECORDKEEPING AND DATA QUALITY 45
GLOSSARY
THIS HANDBOOK USES MANY DIFFERENT CONCEPTS AND TERMS THAT ARE HELPFUL TO DATA COLLECTION
AND REPORTING. BELOW ARE THEIR DEFINITIONS BASED ON THIS HANDBOOK’S USE OF THEM, ALONG
WITH DEFINITIONS OF OTHER TERMS FREQUENTLY USED IN WOMEN’S EMPOWERMENT PROGRAMS.
ACTION PLAN: Methodical steps to be taken in pursuit of a specific outcome or objective, usually in the short or medium term. May also include assignments of responsibility and plans for financing.
ADVOCACY: The act of influencing decision makers – generally elected or appointed public officials, or heads of private companies or institutions – to change, improve, create or implement specific policies; or to start/end or increase/decrease spending for a specific issue.
ADVOCACY CAMPAIGN: A series of strategic and targeted actions whose purpose is to influence the decisions of those holding governmental, organisational, or institutional power.
BENEFICIARY: A person who receives a product, service, or otherwise benefits from an activity, event, or project; a person the program or activity is designed to benefit. See also: direct beneficiary; indirect beneficiary; unique beneficiary
BUSINESS: A privately-owned group organised primarily to sell a product or service.
BUSINESS PLAN: A document that captures the key objectives, relevant characteristics of markets and competitors, and target operating model for a specific enterprise.
CIVIL SOCIETY ORGANISATION (CSO): An organized group of people dedicated to a social good or function, or representing the interests of a particular group or locality, whether or not the group is registered or legally constituted.
COMMUNICATIONS PLAN: A document that captures communications objectives, target audiences, messages, messengers, and channels for reaching target audiences.
COMMUNITY: A group of people connected by geography, common interest, or ethnicity whose members identify as part of the group. When used to define beneficiaries, it generally refers to a relatively small, local geographic region within which the service or product is being provided.
CONSTITUENT: A person whose interests are represented by civil society organizations (CSOs), nongovernmental organizations (NGOs) or elected officials
DIRECT BENEFICIARY: An individual whose benefit or service can be directly attributed to the activity, project, person, or organization being monitored and evaluated
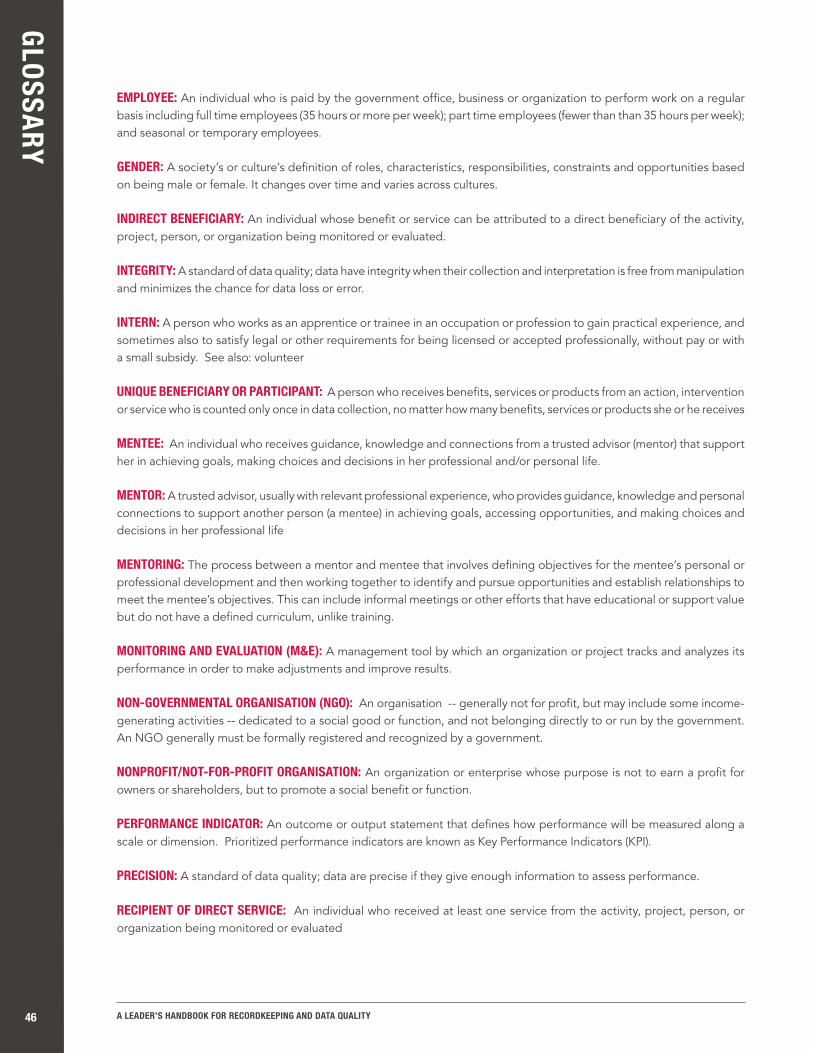
GLOSSARY
A LEADER’S HANDBOOK FOR RECORDKEEPING AND DATA QUALITY46
EMPLOYEE: An individual who is paid by the government office, business or organization to perform work on a regular basis including full time employees (35 hours or more per week); part time employees (fewer than than 35 hours per week); and seasonal or temporary employees.
GENDER: A society’s or culture’s definition of roles, characteristics, responsibilities, constraints and opportunities based on being male or female. It changes over time and varies across cultures.
INDIRECT BENEFICIARY: An individual whose benefit or service can be attributed to a direct beneficiary of the activity, project, person, or organization being monitored or evaluated.
INTEGRITY: A standard of data quality; data have integrity when their collection and interpretation is free from manipulation and minimizes the chance for data loss or error.
INTERN: A person who works as an apprentice or trainee in an occupation or profession to gain practical experience, and sometimes also to satisfy legal or other requirements for being licensed or accepted professionally, without pay or with a small subsidy. See also: volunteer
UNIQUE BENEFICIARY OR PARTICIPANT: A person who receives benefits, services or products from an action, intervention or service who is counted only once in data collection, no matter how many benefits, services or products she or he receives
MENTEE: An individual who receives guidance, knowledge and connections from a trusted advisor (mentor) that support her in achieving goals, making choices and decisions in her professional and/or personal life.
MENTOR: A trusted advisor, usually with relevant professional experience, who provides guidance, knowledge and personal connections to support another person (a mentee) in achieving goals, accessing opportunities, and making choices and decisions in her professional life
MENTORING: The process between a mentor and mentee that involves defining objectives for the mentee’s personal or professional development and then working together to identify and pursue opportunities and establish relationships to meet the mentee’s objectives. This can include informal meetings or other efforts that have educational or support value but do not have a defined curriculum, unlike training.
MONITORING AND EVALUATION (M&E): A management tool by which an organization or project tracks and analyzes its performance in order to make adjustments and improve results.
NON‑GOVERNMENTAL ORGANISATION (NGO): An organisation -- generally not for profit, but may include some income-generating activities -- dedicated to a social good or function, and not belonging directly to or run by the government. An NGO generally must be formally registered and recognized by a government.
NONPROFIT/NOT‑FOR‑PROFIT ORGANISATION: An organization or enterprise whose purpose is not to earn a profit for owners or shareholders, but to promote a social benefit or function.
PERFORMANCE INDICATOR: An outcome or output statement that defines how performance will be measured along a scale or dimension. Prioritized performance indicators are known as Key Performance Indicators (KPI).
PRECISION: A standard of data quality; data are precise if they give enough information to assess performance.
RECIPIENT OF DIRECT SERVICE: An individual who received at least one service from the activity, project, person, or organization being monitored or evaluated
GLOSSARY
A LEADER’S HANDBOOK FOR RECORDKEEPING AND DATA QUALITY 47
RECIPIENT OF PRODUCT: An individual who purchased or received at least one product from the activity, project, person, or organization being monitored or evaluated
RECORDKEEPING: The process of systematically collecting and maintaining the information necessary to document outputs and outcomes for an activity, program, or individual. Any information that documents and provides evidence in support of the achievement, collection, and reporting of indicators and disaggregates should be kept on file for the duration of the program or fellowship (for example, methodologies, curricula, assessments, workshop and training attendee lists, etc.)
RELIABILITY: A standard of data quality; data is reliable if data collection processes and analyses are consistent over time and across different users.
SMART: SMART objectives are designed to meet the following characteristics to increase chances of progress toward the objectives: Specific (is well-defined and narrow), measureable (can be measured by program or organization), Achievable (can be achieved in the given time-frame), Relevant (is relevant to the implementing body’s mission), Time-bound (includes a specific time frame).
SOCIAL ENTERPRISE: An income-generating activity within a non-profit organization, or a non-profit organization that is run as a business to provide goods and services for a social benefit and/or whose profits build the sustainability of the organization
STRATEGIC PLAN: A designation of prioritised actions expected to contribute to a strategic objective or objectives, usually over the medium or long term.
TARGET: Defines and communicates the value for each indicator that a program or individual expects to see over a given time interval.
THEORY OF CHANGE: A logical mapping of long-term goals and the things that need to change or happen in order to reach those goals. A theory of change helps in defining the activities that a project, program or organization needs to take in order to succeed.
TIMELINESS: A standard of data quality; data collection is timely if it provides answers when you and your donors need them.
TRAINING: Learning activity for participants involving: 1) a setting intended for teaching or transferring knowledge, skills, or attitudes; 2) formally designated instructors or lead persons; and 3) a defined curriculum, learning objectives, and outcomes. Training can include long-term academic degree programs, short- or long-term non-degree technical courses in an academic or other settings; seminars, workshops, conferences, on-the-job learning experiences, observational study tours, or distance learning as long as it includes the three elements above.
VALIDITY: A standard of data quality; data are valid if they measure what they are intended to measure and demonstrate a believable contribution of the project.
VOLUNTEER: A person who performs a service for an organization, company, or project willingly and without pay.
WOMEN’S EMPOWERMENT: The process of increasing women’s ability to make and act on decisions about their lives, including their influence over the social, economic, and political factors that shape their environment. Women’s empowerment projects often target economic issues (such as generation of or control over household income), social issues (such as consensual marriage or voluntary family planning), or political issues (such as women’s participation in public office).


APPENDICES

APPENDIX A
A LEADER’S HANDBOOK FOR RECORDKEEPING AND DATA QUALITY50
THE FOLLOWING EXAMPLE SHOWS THE WORK THAT MUST GO INTO DEFINING AND DESCRIBING AN INDICATOR TO ENSURE RELIABLE AND VALID DATA.
STANDARD VVLEAD INDICATORS – DESCRIPTIONS, DEFINITIONS AND DISAGGREGATES
EXAMPLE: INDICATOR NUMBER OF PEOPLE RECEIVING TRAINING
DEFINITION
Training is defined as a learning activity involving: 1) a setting intended for teaching or transferring knowledge, skills, or attitudes; 2) designated instructors or leaders; and 3) a defined curriculum, learning objectives, and/or outcomes.Training can include long-term academic degree programs, short- or long-term non-degree technical courses in academic or in other settings, seminars, workshops, conferences, on-the-job learning experiences, observational study tours, or distance learning as long as it includes the three elements above. Coaching and mentoring, meetings or other efforts that could have educational value but do not have a defined curriculum or objectives are not considered to be training.Only those who complete the entire training should be counted for this indicator; the recommendation is that participants attend at least 90% of total hours of training offered to be considered as beneficiaries of the training. Total beneficiaries of training should include each person only once. If reporting on outputs for each training session, individuals attending more than one training should be counted once for each training they complete.
LINKAGE TO LONG-TERM
OUTCOME OR IMPACT
Training can contribute to strengthening individual and institutional capacities. Training also improves the likelihood that individuals will continue using their skills.
INDICATOR TYPE Output
UNIT OF MEASURE Number of people
DATA SOURCE AND
REPORTING FREQUENCY
Reporting by implementing partners using standard monitoring and evaluation procedures on a quarterly/annual basis
KNOWN DATA LIMITATIONS
Validity: This indicator addresses only the training of knowledge and skills related to climate change. It may not translate to action nor is it a direct indicator of changes in institutional or organizational capacity.Precision: Simply knowing the number of people does not reflect the depth of skills and knowledge conveyed, or capacity to act.Reliability: Reliability becomes a concern if the number of training hours is not counted in the same way. Counting procedures should be consistent throughout the life of the activity.
BASELINE Baseline is at the start the project.
DISAGGREGATE(S)• Women/men• Below/over 18

APPENDIX B
A LEADER’S HANDBOOK FOR RECORDKEEPING AND DATA QUALITY 51
IMPLEMENTING A ROUTINE DATA QUALITY ASSESSMENT
DATA QUALITY DIMENSIONSThe RDQA is grounded in the components of data quality, namely, that programs/projects need accurate and reliable
data that are complete, timely, precise, credible and maintained under conditions of confidentiality, when appropriate.
FUNCTIONAL AREAS TO STRENGTHEN DATA MANAGEMENT AND REPORTING AND DATA QUALITYTo address data quality challenges, it is important to focus on the key functional areas that programs/projects include.
Table C1 shows these functional areas and related questions that you should answer in determining the strength of your
data management and reporting system.
Answers to these questions will help you highlight threats to data quality and the related aspects of the data management
and reporting system that require attention. For example, if data accuracy is an issue, the RDQA can help assess if reporting
entities are using the same indicator definitions, if they are collecting the same data elements, on the same forms, using
the same instructions. The RDQA can help assess if roles and responsibilities are clear (e.g. all staff know what data they
are collecting and reporting, when, to who and how) and if staff have received relevant training.
FUNCTIONAL
AREASQUESTIONS
DIMENSION OF
DATA QUALITY
M&E CAPABILITIES,
ROLES AND
RESPONSIBILITIES
Are key M&E and data-management staff identified with clearly assigned responsibilities?Accuracy, Reliability
TRAINING Have the majority of key M&E and data- management staff received the required training?Accuracy, Reliability
INDICATOR
DEFINITIONS
Are there operational indicator definitions meeting relevant standards that are systematically followed by all service points?
Accuracy, Reliability
DATA REPORTING
REQUIREMENTS
Has the program/project clearly documented (in writing) what is reported to who, and how and when reporting is required?
Accuracy, Reliability, Timeliness, Completeness
DATA COLLECTION
AND REPORTING
FORMS AND
TOOLS
Are there standard data-collection and reporting forms that are systematically used?Are data recorded with sufficient precision/detail to measure relevant indicators?Are data maintained in accordance with international or national confidentiality guidelines?Are source documents kept and made available in accordance with a written policy?
Accuracy, Reliability, Precision, Confidentiality, Timeliness, Integrity
DATA
MANAGEMENT
PROCESSES AND
DATA QUALITY
CONTROLS
Does clear documentation of collection, aggregation and manipulation steps exist?Are data quality challenges identified and are mechanisms in place for addressing them?Are there clearly defined and followed procedures to identify and reconcile discrepancies in reports?Are there clearly defined and followed procedures to periodically verify source data?
Accuracy, Reliability, Precision, Timeliness, Integrity, Confidentiality
Table C1. Data Management Functional Area and Key Questions to Address Data Quality
2 Adapted from Data Quality Audit Tool: Guidelines for Implementation. MEASURE Evaluation. 2008. Carolina Population Center, University of North Carolina at Chapel Hill.
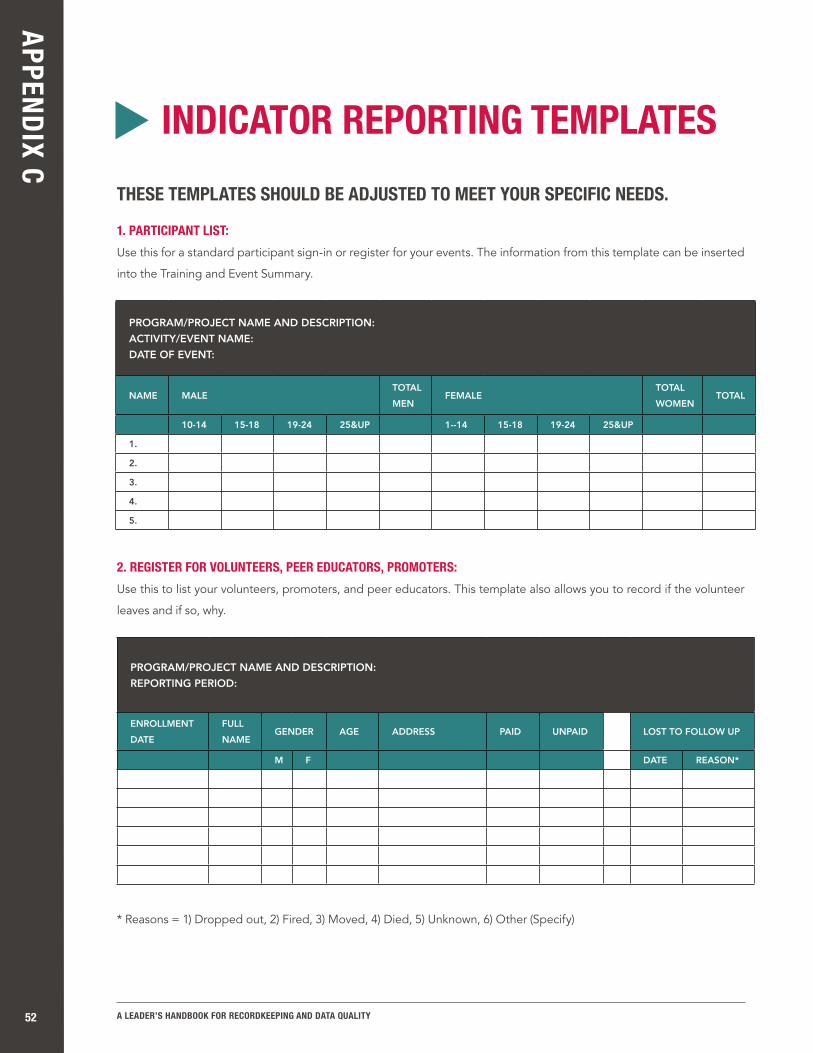
APPENDIX C
A LEADER’S HANDBOOK FOR RECORDKEEPING AND DATA QUALITY52
THESE TEMPLATES SHOULD BE ADJUSTED TO MEET YOUR SPECIFIC NEEDS.
1. PARTICIPANT LIST: Use this for a standard participant sign-in or register for your events. The information from this template can be inserted
into the Training and Event Summary.
2. REGISTER FOR VOLUNTEERS, PEER EDUCATORS, PROMOTERS: Use this to list your volunteers, promoters, and peer educators. This template also allows you to record if the volunteer
leaves and if so, why.
* Reasons = 1) Dropped out, 2) Fired, 3) Moved, 4) Died, 5) Unknown, 6) Other (Specify)
INDICATOR REPORTING TEMPLATES
PROGRAM/PROJECT NAME AND DESCRIPTION:
ACTIVITY/EVENT NAME:
DATE OF EVENT:
NAME MALETOTAL
MENFEMALE
TOTAL
WOMENTOTAL
10-14 15-18 19-24 25&UP 1--14 15-18 19-24 25&UP
1.
2.
3.
4.
5.
PROGRAM/PROJECT NAME AND DESCRIPTION:
REPORTING PERIOD:
ENROLLMENT
DATE
FULL
NAMEGENDER AGE ADDRESS PAID UNPAID LOST TO FOLLOW UP
M F DATE REASON*
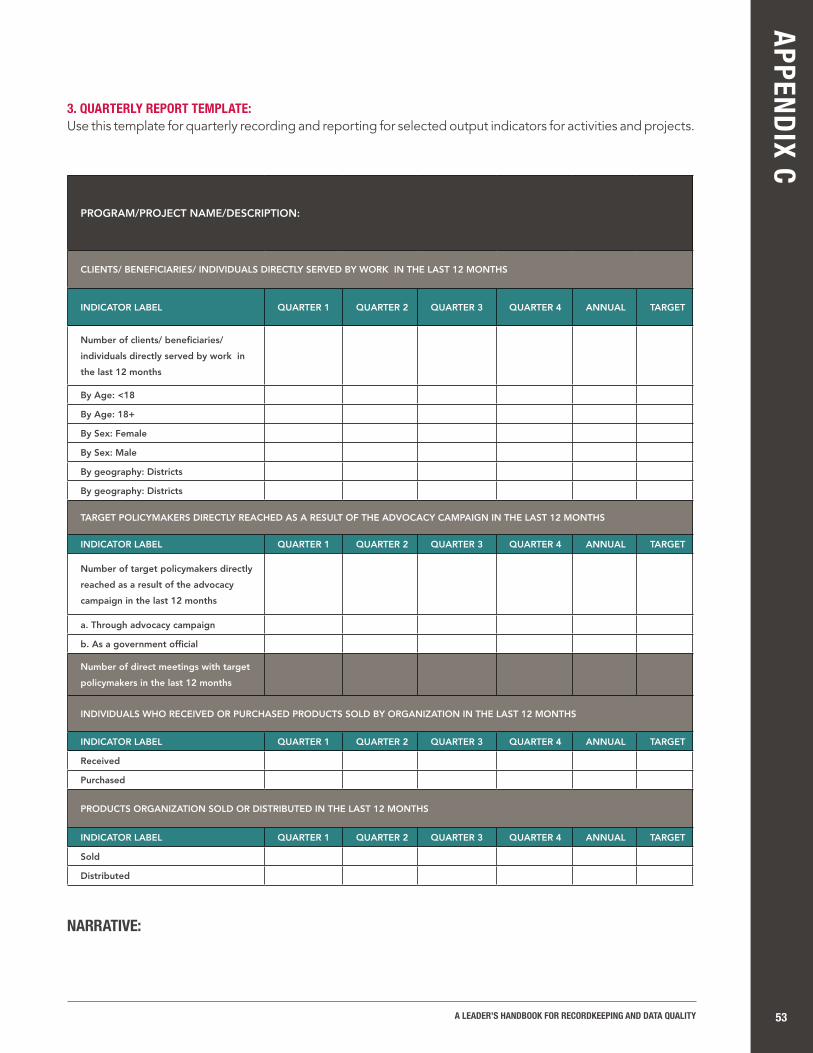
APPENDIX C
A LEADER’S HANDBOOK FOR RECORDKEEPING AND DATA QUALITY 53
3. QUARTERLY REPORT TEMPLATE: Use this template for quarterly recording and reporting for selected output indicators for activities and projects.
PROGRAM/PROJECT NAME/DESCRIPTION:
CLIENTS/ BENEFICIARIES/ INDIVIDUALS DIRECTLY SERVED BY WORK IN THE LAST 12 MONTHS
INDICATOR LABEL QUARTER 1 QUARTER 2 QUARTER 3 QUARTER 4 ANNUAL TARGET
Number of clients/ beneficiaries/
individuals directly served by work in
the last 12 months
By Age: <18
By Age: 18+
By Sex: Female
By Sex: Male
By geography: Districts
By geography: Districts
TARGET POLICYMAKERS DIRECTLY REACHED AS A RESULT OF THE ADVOCACY CAMPAIGN IN THE LAST 12 MONTHS
INDICATOR LABEL QUARTER 1 QUARTER 2 QUARTER 3 QUARTER 4 ANNUAL TARGET
Number of target policymakers directly
reached as a result of the advocacy
campaign in the last 12 months
a. Through advocacy campaign
b. As a government official
Number of direct meetings with target
policymakers in the last 12 months
INDIVIDUALS WHO RECEIVED OR PURCHASED PRODUCTS SOLD BY ORGANIZATION IN THE LAST 12 MONTHS
INDICATOR LABEL QUARTER 1 QUARTER 2 QUARTER 3 QUARTER 4 ANNUAL TARGET
Received
Purchased
PRODUCTS ORGANIZATION SOLD OR DISTRIBUTED IN THE LAST 12 MONTHS
INDICATOR LABEL QUARTER 1 QUARTER 2 QUARTER 3 QUARTER 4 ANNUAL TARGET
Sold
Distributed
NARRATIVE:
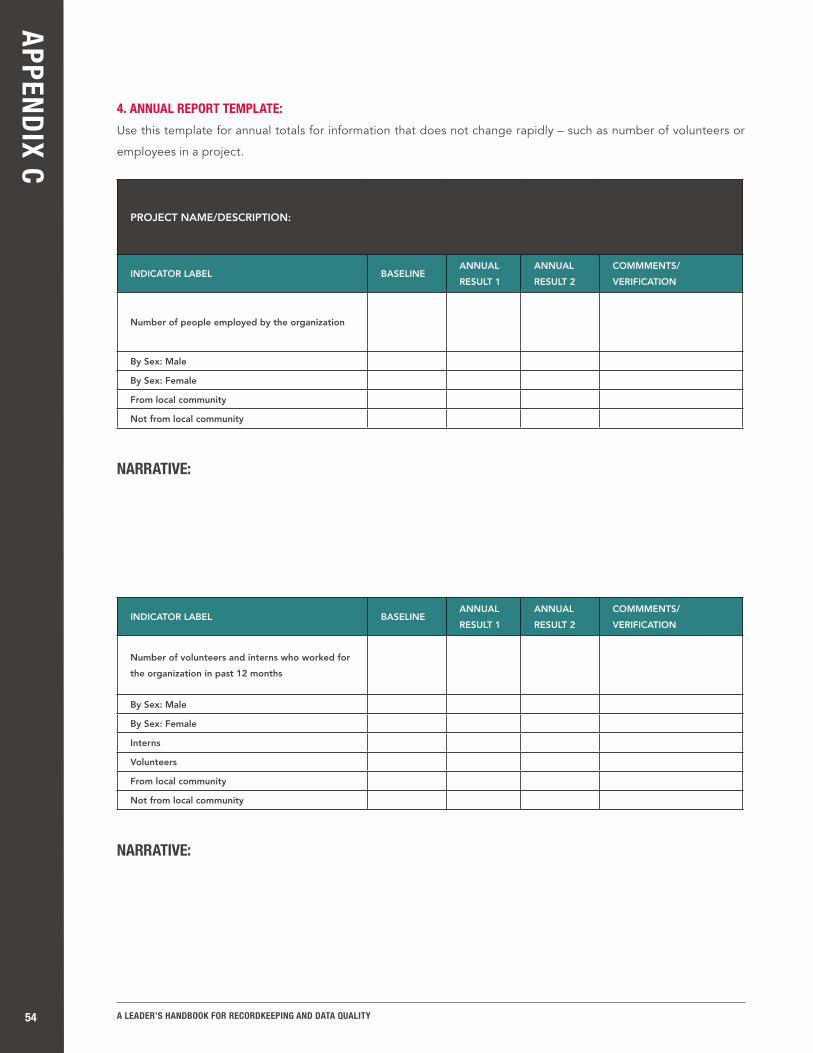
APPENDIX C
A LEADER’S HANDBOOK FOR RECORDKEEPING AND DATA QUALITY54
4. ANNUAL REPORT TEMPLATE: Use this template for annual totals for information that does not change rapidly – such as number of volunteers or
employees in a project.
PROJECT NAME/DESCRIPTION:
INDICATOR LABEL BASELINEANNUAL
RESULT 1
ANNUAL
RESULT 2
COMMMENTS/
VERIFICATION
Number of people employed by the organization
By Sex: Male
By Sex: Female
From local community
Not from local community
NARRATIVE:
INDICATOR LABEL BASELINEANNUAL
RESULT 1
ANNUAL
RESULT 2
COMMMENTS/
VERIFICATION
Number of volunteers and interns who worked for
the organization in past 12 months
By Sex: Male
By Sex: Female
Interns
Volunteers
From local community
Not from local community
NARRATIVE:

APPENDIX C
A LEADER’S HANDBOOK FOR RECORDKEEPING AND DATA QUALITY 55
5. TRAINING: Use this template to record your tallied numbers from participant registers or sign-in sheets. This template is designed to
capture total participation for in-person workshops or events that have particular dates and agendas, and that engage,
train, or raise awareness among participants. This template assumes that you have collected information on participants’
age and sex, so it is not for events or activities where the audience is not present (such as a radio show or press article).
PROGRAM/PROJECT NAME AND DESCRIPTION:
REPORTING PERIOD:
NUMBER OF BENEFICIARIES RECEIVING TRAINING BY PROJECT DURING REPORTING PERIOD
Number of
beneficiaries
receiving
training by
project during
reporting period
Date of EventDescription of Training/Sensitization,
including title, purpose, and settingTopic
Methodology:
How were
attendance data
gathered and
documented
Did this training
have a defined
curriculum? (Y/N)
EXAMPLE
6 3 1 8 Dec 1-3, 15
Entrepreneurship Training, 3-day
workshop, participants were given
knowledge and skills to start and run a
business
Business
Sign-in sheets,
with attendance
confirmed and
records kept on file
Yes

APPENDIX C
A LEADER’S HANDBOOK FOR RECORDKEEPING AND DATA QUALITY56
7. SALESUse this template to record product or publication sales and distribution. The template allows you to record a summary
of sales/distribution by product, which can then be tallied into a total number sold/distributed. It also allows you to
separately record number of individuals who received or purchased products. For this tally, you would not count a
person twice if she/he bought more than one product.
PROJECT NAME/DESCRIPTION:
PRODUCTS SOLD/
DISTRIBUTEDJANUARY TOTAL JANUARY TOTAL MARCH TOTAL Q1 TOTAL
Total Products Sold
Total Products
Distributed
Product A
Product B
Product C
NUMBER OF
INDIVIDUAL
RECIPIENTS/
PURCHASERS
JANUARY TOTAL JANUARY TOTAL MARCH TOTAL Q1 TOTAL
Recipients
Purchasers
Product A
Product B
Product C

APPENDIX C
A LEADER’S HANDBOOK FOR RECORDKEEPING AND DATA QUALITY 57
8. MICROLOANSUse this template to record information about microloan groups, with numbers of participants and details about their
operations.
A. Membership
PROJECT NAME/DESCRIPTION:
NAME OF GROUP MALE
MEMBERS
FEMALE
MEMBERS
MEMBERS
18-25
MEMBERS
25-40
TOTAL
MEMBERSKEY CONTACTS
EXAMPLE:
Revolution 0 15 6 9 15 Grace Abiba, Chair
B. Loan Information
PROJECT NAME/DESCRIPTION:
NAME OF GROUP DATE
STARTED
FREQUENCY
OF MEETINGS
BORROWING
DETAILS
TYPE OF
BUSINESSES
SAVINGS
AMOUNT
BANK ACCOUNT
DETAILS
EXAMPLE:
Revolution 9/12/12 Weekly
Borrow 500-
1000 at 10%
interest
Selling crafts,
pastries in
market
2500 No group account
9. COMMUNICATIONS REGISTER: Use this template to record appearances in media, including paid media (ads), earned media (articles that mention
organization or project), or social media (blogs by organization or project staff/volunteers/beneficiaries).
PROGRAM/PROJECT NAME AND DESCRIPTION:
REPORTING PERIOD:
DATEARTICLE, BLOG, OR AD
NAME
TYPE OF MEDIA
(PAID, SOCIAL, EARNED)
PUBLICATION OR WEBSITE
NAMEAUDIENCE SIZE
*Note that these tables can be combined into one if desired. They are separated here for space purposes. Also, note that microloans are not always
made to groups, and this table can be adapted for individual loan recipients.

VITAL VOICES GLOBAL PARTNERSHIP
1625 Massachusetts Ave., NW
Washington, D.C. 20036
202.861.2625 (main)
202.296.4142 (fax)
www.vitalvoices.org
VVLEAD FELLOWSHIP PROGRAM