hand gesture recognition based on signals cross · pdf filechapter 3 hand gesture recognition...
TRANSCRIPT

CHAPTER 3
Hand Gesture Recognition Based on SignalsCross-Correlation
Anna Lekova and Mo Adda
“Any sufficiently advanced technology is indistinguishable from magic”Arthur C. Clarke
Interactive gestures and body movements let us control and interact with mobiledevices, screens and robots. Vision-based gesture recognition systems analyze thedetected infrared and visible light after converting them into some measurable signal,e.g. voltage or current. Since, infrared and visible light are electromagnetic waves(EMW) with particular wavelength between 0.4 and 1.6µm, we introduce a concept
Anna LekovaBulgarian Academy of Sciences, Institute of Systems Engineering and Robotics1113 Sofia, Bulgariae-mail: [email protected]
Mo AddaUniversity of Portsmouth, School of ComputingPortsmouth, UKe-mail: [email protected]
Editor: A. Chaudhary, Recent Trends in Hand Gesture RecognitionDOI: 10.15579/gcsr.vol3.ch3, GCSR Vol. 3, pp. 43-74, 2015©Science Gate Publishing - Available under CC BY-NC 4.0 International License
43

44 A. Lekova and M. Adda
of a new kind of sensor for direct perception of EMW to see objects. We propose anovel framework for hand gesture featuring, profiling and recognizing based on signalprocessing and cross correlation of detected signals instead of Euclidean space analysisof image pixels by visual-based algorithms. Hand segmentation is accomplished oninfrared radiation, while hand joints are categorized according to the intensity of visiblelight on hand edges. The meaning of a gesture is described by wave-based profilesrepresenting the informative features of hand joints and their spatial relations oversome period of time. A hand joint profile is a waveform of known shape obtained bysuperposition of feature waves. During the hand segmentation, we use online fuzzyclustering to categorize the infrared radiation. During the feature extraction, theclustering algorithm categorizes the grayscale light intensity on hand edges. Duringthe training, the hand joint profiles are stored in the database as sampled sequencescorresponding to the superposition of sine waves with amplitudes and frequenciesderived from the obtained clusters. During the recognition phase, the current handgesture is matched to the hand joint profiles in the database by fast signals cross-correlation. Our first implementation of the proposed framework inputs the raw dataof Microsoft Kinect infrared and RGB image sensors that are wavelength dependentand produce a signal for electric current that is directly proportional to the changes inthe focused flow of reflected light during hand gesturing.
3.1 IntroductionInteractive gestures are quite magical nowadays. They let us control and interactwith mobile devices, screens and robots by air gestures, hands and body movements.The basic components of any gestural system [31] are presented in Fig.(3.1). Asensor is usually an electrical or electronic component, which detects changes in theenvironment. On detection it passes the information on to a comparator. It comparesthe current state to the previous state or the goal of the system and then makes simpleor sophisticated decisions. A comparator is usually a micro-controller or mechanicalsystems that control gestures by transferring commands to an actuator. Actuators canbe analog, like a small electric motor or digital, such as mobile software that changesthe screen orientation from portrait to landscape.Human-robot interaction (HRI) by gestures helps to personalize the communica-
tion with humans in various contexts and demands for a hand gesture recognition(HGR) system in real time. HGR systems can be classified into vision-based, infrared-based, electro-based, ultrasonic-based, accelerometer-based or wireless glove-based.The most popular sensors for robot vision are kind of cameras, like RGB, infrared depth(D), thermal or a combination of them. In recent years Microsoft Kinect sensor [7] forgesture recognition has been deployed widely for robots’ vision. Although, Kinect is anRGB-D sensor providing synchronized RGB and depth images that overcomes the clas-sical problems in computer vision concerning limitations of optical sensors sensitive tolight illumination and cluttered background, it is questionable though, whether vision-based sensors and software is the most effective way for robots’ vision and gesturerecognition in terms of lightweight and fast processing of algorithms.Real-world signals are analog. Not only the well-known electricity and magnetism

Hand Gesture Recognition Based on Signals Cross-Correlation 45
Figure 3.1: The basic components of any gestural system. (Image taken from [31]).
but light and heat are a measured response to continuously changes in energy levelsof physical processes. Visible light (VL) and infrared (IR) are composed of electro-magnetic waves (EMW) with wavelength ranging from 0.4 to 1.6µm and the differentcolors of the VL are variations in the wavelengths. Do we need another kind of sensorsfor direct perception of electromagnetic radiation (EMR) to see objects? An inter-esting fact is that visual perception is mostly based on experience of the brain. Forinstance, the first days after birth babies see everything upside down. So, can robotslearn how to reconstruct visual perception only by harvesting IR or VL analog signals?The concept we follow in this work is influenced by achievements in nano-technologies[8], nano-antennas [32] and interesting facts related to visions in some animals. Someanimals use different eyes, organs like “Ampullae of Lorenzini” [1] in sharks, electro-ceptive in fishes, pit organs and IR heat-sensitive membrane in some snakes [5] andorgans in the mouth of platypus [26] to sense electro fields. Traditionally, waves arecaptured by antennas that convert EMR into some measurable signal, e.g. electriccurrent. This naturally leads us to signal harvesting, processing and featuring by agrid of nano-antennas (nantennas) instead of Euclidean space analysis of image pixels.The devices to detect VL and IR can be divided into three main categories: thermal
detectors, quantum (photon) light detectors (QLD) such as a charge-coupled device(CCD) or a Bayer patterned sensor in digital cameras and radiation-field light detectors(RFLD), such as a very small antenna made-up with nanotechnology proportional tothe length of light wave. Each type of light detectors is capable of sensing incident IRor VL radiation and converting it into some measurable signals. The last two detec-tors are wavelength dependent and they produce a signal for a current that is directlyproportional to the response of changes in the focused flow of reflected light. QLDtechnologies exploit semiconductor devices for sensing VL or IR radiation, i.e., whensubjected to light radiation, photons interact with electrons within the semiconductorto create mobile electric charges, while RFLD directly detect a radiation field similarto radio receivers depending on the frequency of the detected wave converting thenthe light into electrical signals. This naturally leads us to process and feature directlyEMW. We propose a novel framework for hand gesture profiling and recognition basedon signal processing and cross correlation of EMW instead of visual-based algorithmsfor image pixels analysis in space and frequency domains. Hand tracking is done byshining infrared light into the space around objects and nano-antennas capture re-

46 A. Lekova and M. Adda
flections from IR or VL wavelengths. Hand segmentation is accomplished on infraredradiation; and base on it a set of monochromatic sensor data is separated for pro-cessing to decompose the hand in hand joints. A hand joint (HJ) is defined by itsinformative features - grayscale patterns on edges of the segmented hand. During thehand segmentation, we use online fuzzy clustering to categorize the infrared radiationand find the corresponding depth map and depth threshold where the hands are lo-cated. During feature extraction, we use online fuzzy clustering to categorize the lightintensity on hand edges together with its spatio-temporal information. The meaning ofa gesture is described by wave-based profiles of hand joints and their spatio-temporalrelations. A hand joint profile is a waveform of known shape obtained by superpositionof feature waves shifted by phase. During the training phase, the hand joint profilesare stored in the database (DB) of the robot as sampled sequences correspondingto the sum of sine waves with amplitudes and frequencies derived from the obtainedclusters. Signals cross-correlation is used for matching of the observed waveform tothe profiles in the DB.The progress made by current research [32] indicating that RF concepts can be trans-
ferred to optical and infrared frequencies and the state-of-the-art works [15, 18, 24, 27]confirm that signal-processing algorithms for time series analysis might be a betteralternative for hand gesture recognition. Time series analysis and measures are for ac-celeration signals [24], Doppler shifts along with Wi-Fi [27] or TV transmissions [18],as well as electrical fields to sense hand movements [15] instead of spectral, spatial andtemporal models of regions in visual image sequences. In addition, signal-processingalgorithms run faster than the pattern recognition techniques used in vision-based sys-tems, since they require less preprocessing of the raw data and limited training phase.Moreover, pattern recognition based on waveforms cross-correlation is a function of atime-lag that can identify a short signal (feature) occurring in a long signal stream.Although real-world signals can be processed in their analog form, processing signals
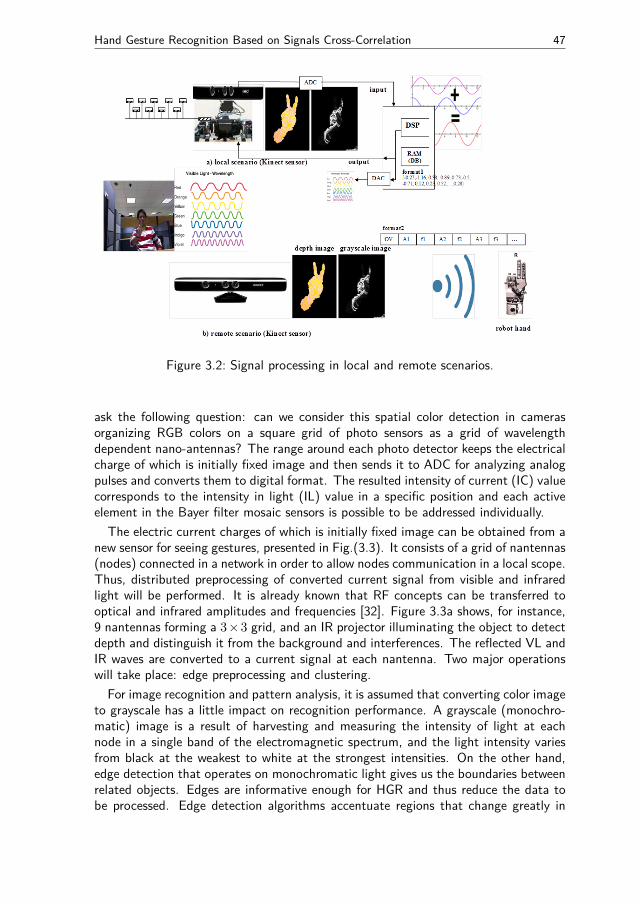
digitally provide the advantages of high speed and accuracy. Often analog signals needto be processed so that the information they contain can be analyzed. Analog VL andIR signals can be converted to another type of signals that may be of use for HGRor changed to digital format by Analog-to-Digital Convertors (ADC) for processingby Digital Signal Processors (DSPs). After digitizing, DSP manipulates the signalsmathematically and perform functions like “add”, “divide”, etc. It then returns thedigitized information back to analog form through the use of a Digital-to-AnalogConvertor (DAC) to be used in real word. As shown in Fig.(3.2), DSP informationis used to control the robot hand. During the input phase VL analog signal mightbe harvest through a vision-based sensor (Kinect) or other detectors. This continuoussignal is then converted to a digital form by ADC and passed to DSP. It performssignals “adding” and saves the complex waves into the memory. The output could beconverted back to analog signal in real world or continue in the digital format for morecomplex DSP functions. For instance, DSP may compress signals so that they can betransmitted quickly without noise and interference from one place to another or canperform an interface for hand robot control.Since the raw data obtained from Microsoft Kinect IR CMOS and Bayer patterned
RGB sensors is wavelength dependent and produce a current signal that is directlyproportional to changes in the focused flow of reflected light during gesturing, we
Hand Gesture Recognition Based on Signals Cross-Correlation 47
Figure 3.2: Signal processing in local and remote scenarios.
ask the following question: can we consider this spatial color detection in camerasorganizing RGB colors on a square grid of photo sensors as a grid of wavelengthdependent nano-antennas? The range around each photo detector keeps the electricalcharge of which is initially fixed image and then sends it to ADC for analyzing analogpulses and converts them to digital format. The resulted intensity of current (IC) valuecorresponds to the intensity in light (IL) value in a specific position and each activeelement in the Bayer filter mosaic sensors is possible to be addressed individually.The electric current charges of which is initially fixed image can be obtained from a
new sensor for seeing gestures, presented in Fig.(3.3). It consists of a grid of nantennas(nodes) connected in a network in order to allow nodes communication in a local scope.Thus, distributed preprocessing of converted current signal from visible and infraredlight will be performed. It is already known that RF concepts can be transferred tooptical and infrared amplitudes and frequencies [32]. Figure 3.3a shows, for instance,9 nantennas forming a 3×3 grid, and an IR projector illuminating the object to detectdepth and distinguish it from the background and interferences. The reflected VL andIR waves are converted to a current signal at each nantenna. Two major operationswill take place: edge preprocessing and clustering.For image recognition and pattern analysis, it is assumed that converting color image
to grayscale has a little impact on recognition performance. A grayscale (monochro-matic) image is a result of harvesting and measuring the intensity of light at eachnode in a single band of the electromagnetic spectrum, and the light intensity variesfrom black at the weakest to white at the strongest intensities. On the other hand,edge detection that operates on monochromatic light gives us the boundaries betweenrelated objects. Edges are informative enough for HGR and thus reduce the data tobe processed. Edge detection algorithms accentuate regions that change greatly in

48 A. Lekova and M. Adda
Figure 3.3: The architecture of a new sensor for seeing and recognizing hand gesturepatterns: (a) the grid layout of nano-antennas and (b) the interconnectionof grid to the CAN Bus.
intensity over short image distance and the most used algorithms are gradient-based,evaluating 2D gradient magnitude (GM) by 3× 3 square kernels. The purpose of theclustering is to categorize the input examples in fuzzy partitions resulting in overlap-ping clusters (features) for hand joints in terms of brighter and darker light intensityon edges in vicinity. We apply the online Low-complexity Constrained Fuzzy Clusteringalgorithm (LCFC) proposed in [21].As shown in Fig.(3.3b), nantennas are connected through a communication hardware
such as the CAN Bus [3], for instance. Nantenna nodes also communicate witheach other by their IDs knowing their neighbors in x and y directions. Node IDis generated automatically as a function of the nantenna position in the grid. Thepreprocessing phase involves distributed edge detection with all one-hop neighbors.The clustering, on the other hand, consists in categorizing the IC on edges with morethan one-hop neighbors and only if more clusters overlap, the IC of each cluster will betaken into consideration and sent for features, hand joints identification and profiling.Two approaches might be feasible to configure this new sensor - a distributed and acentralized.In a distributed environment all the preprocessing and clustering are established
at nantennas’ level. The final results are sent via the CAN Bus to the robot forfeatures post-processing. The algorithm for edge detection is distributed in all one-hop neighbors and can be described informally as: each node “telling the neighborsabout its IC and GM”. The algorithm is performed by each node in the grid, whileclustering only by edge nodes. An edge node is a node, if its GM is non-zero (blackcolor). The advantage here is that only a subset of nodes needs to know the IC or GMto detect edges or to perform clustering and clusters post-processing. Although thenew promising paradigm for a nano-network [9] to organize the cooperation amongnano-machines (tiny components consisting of an arranged set of molecules, whichare able to perform very simple tasks), this phase is expensive, as it requires manynantennas to guarantee good quality, e.g. 640×480 grid, additional hardware for eachnantenna to perform communications and computations, plus the conversion of the

Hand Gesture Recognition Based on Signals Cross-Correlation 49
IC signal into digital form.In a centralized environment, the nantennas have just nano circuit elements for
tuning the optical nantenna and a host processor. The CAN controller connects themto the bus. The CAN (controller area network) bus is a vehicle bus standard designed toallow micro-controllers and devices to communicate with each other within a vehiclewithout a host computer but now it is widely used in other areas, as automationand medical equipment. Nantennas can send messages by the host processor to therobot that handles both pre-processing and clustering. Each node is able to sendand receive messages, however not simultaneously. A message consists of node ID andpayload up to several bytes. Distributed architecture implements threads. Every threadruns identical functions for cross-node communication, where nodes pass messages toadvertise their IC and GM only to their neighbors. A node activates its own threadthrough a message. Thus robot will perform preprocessing and clustering in threads.For instance, 76800 threads will handle a 320× 240 grid of nantennas.Identification and profiling of features and hand joints is performed on the robot
side. During the training phase we perform reasoning process to decide whether theobtained clusters with close (x, y) coordinates are specific for a hand joint and how tolabel them together. First, we typify these features into sine waves with amplitudes andfrequencies corresponding to the number of pixels and grayscale intensity of the cluster.We then superpose these waves shifted by phases (adjustment angles) to obtain thebased waveforms for hand joints. The profiles can be described in two formats, eitheras sampled data sequences - the format1 in Fig.(3.8d) or a vector of ordered amplitudesand frequencies of participating features – the format2 in Fig.(3.8d). The DB consistsof waveforms with known shape in format1. The format to be used depends on theenvironment of the HRI scenario as shown in Fig.(3.2). DSP hardware in a localscenario (Fig.(3.2a)) can be used by a robot to add and sample the features waves,as well as to perform cross correlation for measuring the HJ waveform for profiles inthe DB. In a remote sensing scenario, see Fig.(3.2b), software sampler and adder areplaced on a robot side and the features are transmitting wirelessly in format2.In this chapter we propose a novel framework for hand gesture recognition extracted
from different measurable signals that are proportional to infrared or visible light ra-diation combining: (1) distributed or centralized hand segmentation by categorizingIR light; (2) distributed or centralized edge detection; (3) distributed or centralizedfeatures extraction by online low-complexity constrained fuzzy clustering method topartition the intensity of light on edges in the segmented hand; (4) identification oftypical hand joints clusters (features) in vicinity; (5) profiling of the hand joints assuperposition of sine waves corresponding to parameters of overlapping clusters; (6)cross correlation function to match the observed complex wave to profiles for handjoints in the database; (7) formalism of Symbol Relation Grammar for a hand gesturedescription through the participating hand joints at the beginning and the end overa period of time, as well as (8) simple and fast bit-wise operations for matching thepositioning relations of hand joints.The remainder of the chapter is organized as follows: In Section 3.2 we review the
related state-of-the-art systems. In Section 3.3 and Section 3.4 we present the basicconcepts and models in the proposed HGR framework. In Section 3.3, we introducethe Kinect sensors specifications, how IR and RGB raw data are preprocessed, as well

50 A. Lekova and M. Adda
as an overview of the used clustering algorithm. The innovation how hand jointsprofiles are represented by waves and signals cross-correlation for their classificationare described in Section 3.4. Section 3.5 illustrates how to interface Kinect sensorwith Action Script3 (as3). Software solutions for preprocessing of Kinect data andclustering of depth data are presented in Section 3.5.1, whereas experiments andresults are described in Sections 3.5.2 and 3.5.3. Finally, the conclusion follows.
3.2 Related WorksIn this Section we present the state-of-the-art work related both to Kinect basedhand gesture analysis and signal-processing algorithms for time series analysis for handgesture recognition.First, we review some of the problems that researchers meet in using the Kinect
sensor for HGR. The proposed online clustering algorithm, features identification andvisual grammar formalism may resolve some of them. A comprehensive review of re-cent Kinect-based computer vision algorithms and applications can be found in [17].Authors classify the state-of-the-art systems and approaches according to the type ofvision problems that can be addressed or enhanced by means of the Kinect sensor.One of the covered topics includes hand detection, pose estimation and gesture clas-sification. Hand detection and pose estimation can be accomplished either on depthimages [10, 19, 20, 22, 28, 30, 34] or by combination of color and depth information[13, 25, 33]. The compromise is fast against precise algorithms. The most used depthsimilarity measure between observed and trained images is the inverse of their pixel-wise Euclidean distance. The used techniques for hand detection from depth imagesare simple heuristics [30, 34], distance invariant hand segmentation [10, 28] or clus-tering of the depth pixels [10, 20] followed by convex hull analysis [20], morphologicalconstraints [10] or a Finger-Earth Mover’s distance [30] to measure the dissimilaritiesbetween different hand contour/shapes. The critical part here is that depth thresholdneeds to be determined [34] to indicate the depth level where the hand is located or avariety of authors’ assumptions need to be fulfilled, such as the hand to be the frontmost object or black belt equipped as in [30]. The often used models for 3-D poseestimation are: Particle Swarm Optimization [25], Support Vector Machine (SVM)to train and test from the obtained images features together with Hidden MarkovModel (HMM) for relation between poses [33], and Random Decision Forest [19] toconfigure a skeleton-base pose. Hand detection based on depth data needs to be en-hanced, since the resolution of the Kinect depth sensor is still limited and fingers tendto drop of the depth image because few light dots illuminate a finger far from thesensor. The hand detection can be enhanced by integrating color information [13] andmotion detection based on frame differencing. Authors in [13] recognize gestures byDynamic Time Warping (DTW) - a method that calculates an optimal match betweentwo given sequences (e.g. time series) which vary in time or speed. DTW measure isused to match the similarity between two temporal time series of skeleton data in [29].Hand gesture classification for pattern recognition targeting user-dependent gesturesrequires a training phase before use. The most popular approaches in literature for pat-tern recognition are HMM, DTW, Neural Networks (NN), Gaussian models, support

Hand Gesture Recognition Based on Signals Cross-Correlation 51
vector machines (SVM) and Bayesian networks. DTW is very efficient in operatingwith limited training data in contrast to HMM based methods which require extensivetraining in order to be effective.Some interesting research for bringing gesture recognition on all devices use differ-
ent sensors than vision-based and process analog signals. In [24] acceleration data isreceived in handheld devices for processing; Doppler shifts from the conventional wire-less signals during gesturing is evaluated by Fourier analysis [27]; changes betweensignals in gesturing during TV transmissions (or Wi-Fi) is distinguished in AllSee[18]; electrical fields are sensed during hand movements by electrical-field-based 3-D gesture-controller integrated circuit [15]. The main advantage of signal-processingalgorithms for hand gesture recognition like DTW and cross-correlation is that theyrun faster than the above mentioned pattern recognition techniques, since they re-quire less preprocessing of the raw data and limited training, which is necessary andextensive for HMM, for instance. However, the amount of storage space used bythe signal-processing algorithm grows as the number of features to be recognized in-creases, while it remains constant for HMM. The consumption of significant powerand computational resources limit handheld devices applicability for gesture recog-nition. Always-on cameras and wireless receivers that require rich signal processingcapabilities drain the battery, as well as computing FFTs and frequency-time Dopplerprofiles do. For that reason, AllSee extracts gesture information using simple rulesthat have minimal complexity to distinguish between signals in order to reduce therequired signal processing capabilities. For example, to classify between the push andpull gestures, the rule is: if the maximum changes in the signal occurs closer to thestart of a gesture segment, it is a pull action; otherwise, it is a push action.The promising research in nanotechnology with optical and infrared nantennas based
on metal nanostructures allow for efficient conversion of propagating light into nano-scale [32] will strongly enhance the radiation-field light detectors. As proposed in [32],nano-circuit elements and optical nantennas could be tuned to color variations in thewavelengths. With the first nano-networks test beds for molecular communicationsolutions [9], we can put the signal-preprocessing at nano-scale level and thus improvesignificantly the HGR time response, as well as save device resources.Our approach outperforms the state-of-the-art systems in terms of accuracy, fast al-
gorithm, simple hand joints profiling and classification based on signals cross-correlation.The used depth threshold for hand(s) location, which is calculated based on depthstream online and evolve, resolves some of the problems that researchers face whenusing Kinect sensor for hand gesture recognition. To the best of our knowledge, thisis the first work involving hand gesture recognition based on a signal cross-correlationas a similarity measure between the observed and trained waves that profile the handjoints and their features in a novel way. We found two works where a cross-correlationcoefficient is used as a similarity measure however, not as signals processing. In [11] forinstance, it is used at feature extraction phase after image segmentation and morpho-logical operation for hand gesture extraction. Authors in [29] denote a set of featuretime-series obtained from skeletal motion and use a distance metric based on DTW.We first introduce a concept for a new sensor for seeing hand gestures by a grid of IRand VL wavelength dependent nantennas and preprocessing the converted waves tocurrent signal light in a distributed way at the nantennas level.
52 A. Lekova and M. Adda
3.3 Hand Gesture Recognition Framework:Preprocessing and Categorizing of Raw Data
In this section we present the Kinect sensors, IR and RGB data preprocessing, anoverview of the online low-complexity constrained fuzzy clustering algorithm and post-processing of clusters in vicinity.Our first implementation of the proposed HGR framework exploits as inputs the raw
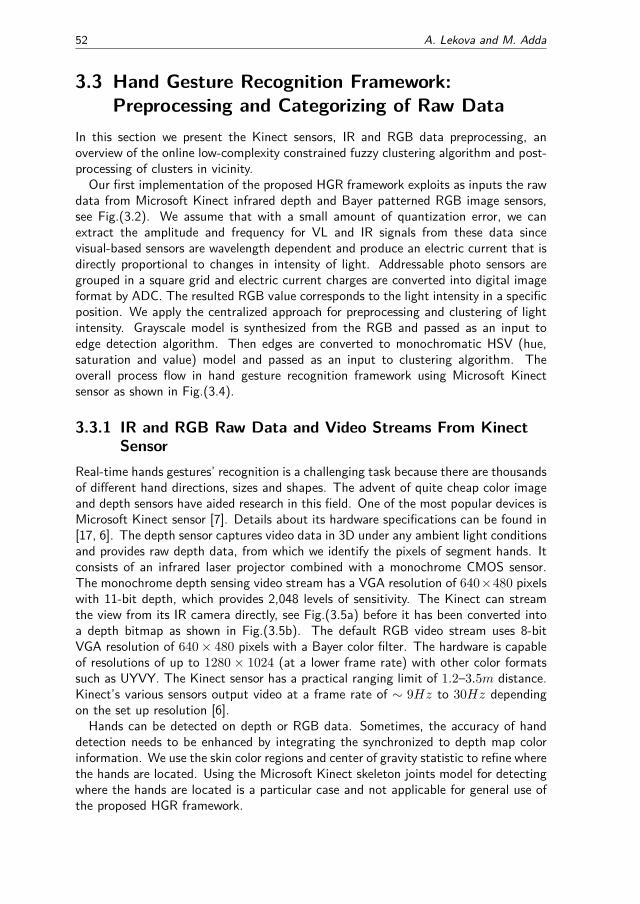
data from Microsoft Kinect infrared depth and Bayer patterned RGB image sensors,see Fig.(3.2). We assume that with a small amount of quantization error, we canextract the amplitude and frequency for VL and IR signals from these data sincevisual-based sensors are wavelength dependent and produce an electric current that isdirectly proportional to changes in intensity of light. Addressable photo sensors aregrouped in a square grid and electric current charges are converted into digital imageformat by ADC. The resulted RGB value corresponds to the light intensity in a specificposition. We apply the centralized approach for preprocessing and clustering of lightintensity. Grayscale model is synthesized from the RGB and passed as an input toedge detection algorithm. Then edges are converted to monochromatic HSV (hue,saturation and value) model and passed as an input to clustering algorithm. Theoverall process flow in hand gesture recognition framework using Microsoft Kinectsensor as shown in Fig.(3.4).
3.3.1 IR and RGB Raw Data and Video Streams From KinectSensor
Real-time hands gestures’ recognition is a challenging task because there are thousandsof different hand directions, sizes and shapes. The advent of quite cheap color imageand depth sensors have aided research in this field. One of the most popular devices isMicrosoft Kinect sensor [7]. Details about its hardware specifications can be found in[17, 6]. The depth sensor captures video data in 3D under any ambient light conditionsand provides raw depth data, from which we identify the pixels of segment hands. Itconsists of an infrared laser projector combined with a monochrome CMOS sensor.The monochrome depth sensing video stream has a VGA resolution of 640×480 pixelswith 11-bit depth, which provides 2,048 levels of sensitivity. The Kinect can streamthe view from its IR camera directly, see Fig.(3.5a) before it has been converted intoa depth bitmap as shown in Fig.(3.5b). The default RGB video stream uses 8-bitVGA resolution of 640× 480 pixels with a Bayer color filter. The hardware is capableof resolutions of up to 1280 × 1024 (at a lower frame rate) with other color formatssuch as UYVY. The Kinect sensor has a practical ranging limit of 1.2–3.5m distance.Kinect’s various sensors output video at a frame rate of ∼ 9Hz to 30Hz dependingon the set up resolution [6].Hands can be detected on depth or RGB data. Sometimes, the accuracy of hand
detection needs to be enhanced by integrating the synchronized to depth map colorinformation. We use the skin color regions and center of gravity statistic to refine wherethe hands are located. Using the Microsoft Kinect skeleton joints model for detectingwhere the hands are located is a particular case and not applicable for general use ofthe proposed HGR framework.

Hand Gesture Recognition Based on Signals Cross-Correlation 53
Figure 3.4: Overall process flow in hand gesture recognition framework.

54 A. Lekova and M. Adda
(a) (b)
Figure 3.5: Kinect stream from IR camera and converted into a depth map (Imagestaken from [6]): (a) IR image shows the laser grid Kinect uses to calculatedepth and (b) a depth map is visualized using color gradients from white(near) to black (far).
By analogy to Kinect skeleton joints we define 16 hand joints: 10 for fingertips forboth hands, and correspondingly 2 for left and right wrists, fists and palms. The HGRframework allows a new joint type to be easily inserted. Examples for hand jointsvariables are presented below:
Joint palm_l=hand.Joints[JointType.PalmLeft];
Joint fist_l=hand.Joints[JointType.FistLeft];
Joint fngtip_t_r=hand.Joints[JointType.FingerTipThumbRight];
Joint fngtip_1_r=hand.Joints[JointType.FingerTipPointingRight];
The hand joints’ identification is built on the depth data processing, color visionalgorithms, machine learning by fuzzy clustering and reasoning process on overlappingclusters.
3.3.2 Preprocessing of Depth and RGB Raw Data3.3.2.1 Preprocessing of a depth stream
Hand segmentation is accomplished on infrared radiation converted to depth map.The used technique here for hand detection from depth map is a simple heuristic overdepth stream or clustering. In a scenario where the hands are the most front objects,we can find the minimum depth (Dmin) and process only the depth values up to theDmin plus 90− 100mm (established during our experiments in “Kinect near mode”)to define a depth threshold (Dthr) for the pixels to be processed. Let BMD_D(x, y)be the output depth binary bitmap image data and the D(x, y) is the depth value ofthe pixel at (x, y) position. When Dmin > D(x, y) < Dmin+Dthr we consider thepixel as hand-like, otherwise we set BMD_D(x, y) to 0 (black color) to isolate thispixel. For more precise classification of the hand-like pixels we use LCFC algorithm.After clustering the pixels in the depth map, we distinguish between fingertips andpalm or fist by simple rules considering COG and radius of the clusters. More details

Hand Gesture Recognition Based on Signals Cross-Correlation 55
R’ = R/255
G’ = G/255
B’ = B/255
Cmax = max(R’, G’, B’)
H=0◦; S=0%; V = Cmax%
Figure 3.6: RGB to HSV color conversion for gray colors.
about the clustering algorithm and its parameters are presented in Section 3.3.4, whileAIR Kinect software solution for clustering of depth data is discussed in Section 3.5.1.2.In a scenario where a hand is not the front most object, the segmentation is aided by
RGB skin detected regions. We calculate COG (see next subsection) of the segmentedskin-like regions and use it in the reasoning process to ignore other body parts or noise,e.g. an object with the same depth values.
3.3.2.2 Preprocessing of RGB to monochromatic intensity of light
Each RGB pixel is transformed to HSV model before converting it to grayscale. Hueand Saturation channels are used for detecting the skin-like regions using predefinedthresholds. We apply the commonly used HSV threshold values that are good for mostimages (H has to be normalized by 360): Hmin = 0, Hmax = 0.14, Smin = 0.2and Smax = 0.68; V min = 0.36 and V max = 1. For dealing with different skincolor of people these thresholds vary. Let BMD_HSV (x, y) be the output binarybitmap image data and the H(x, y), S(x, y) and V (x, y) are the hue, saturationand value of the pixel at (x, y) position. When Hmin > H(x, y) < Hmax &Smin > S(x, y) < Smax & V min > V (xy) < Vmax we consider the pixel asskin-like, otherwise we set BMD_HSV (x, y) to 0 (black color) to isolate this pixel.We convert then the hand-like regions into a grayscale model. Monochromatic
(grayscale) images are a result of measuring the intensity of light in a single band ofthe electromagnetic spectrum, i.e., monochromatic light is when only a given frequencyis captured. The grayscale bitmap can be synthesized from a RGB image, as shownin Fig.(3.6). Gray colors have an equal amount of red, green and blue color levels inthe range [0, 255]. Only V channel is important in HSV model for shades of gray.We then apply a Sobel gradient based method [14] for edge detection. An edge is the
boundary between overlapping objects and we exploit it for hand joints identification.The Sobel operator performs a 2-D gradient measurement on an input grayscale im-age to accentuate regions that change greatly in intensity over short image distances.These regions correspond to edges. To find the absolute gradient magnitude at eachpoint, Sobel uses a pair of 3 × 3 convolution masks (kernels). The first estimatesthe gradient in the x-direction, while the other finds the gradient in the y-direction.These kernels are designed to respond maximally to edges running vertically and hor-izontally relative to the pixel grid manipulating a square of pixels at a time and arecombined together to find the absolute gradient magnitude at each point. The Sobelconvolution kernels are shown in Fig.(3.16a) in Section 3.5. The as3 source code forimplementation of Sobel algorithm is given too. Other 3× 3 and 5× 5 gradient oper-ators for edge detection are also very popular, such as Prewitt and Scharr and could

56 A. Lekova and M. Adda
For each pixel (x, y) calculate:
cogX=cogX+((r+g+b)/3)*x;
cogY=cogY+((r+g+b)/3)*y;
accumRGB += (r+g+b)/3;
cogX=cogX/accumRGB;
cogY=cogY/accumRGB;
Figure 3.7: Pseudo code for Center of Gravity (COG_rgb) statistic calculation.
be exploited, as well. We tried simpler algorithms for edge detection with only one5× 5 kernel, however it did not provide a good edge resolution resulting in clusteringwith less accuracy.After the hand segmentation, we use a center of gravity (COG) statistic, i.e., where
the COG of the segmented hand lies. Its purpose is to ignore the noise from backgroundpixels with the same IR (depth) values or to find the coarse orientation of the hand. Wepropose two approaches for calculating COG: (1) from depth bitmap - COG_D or (2)from RGB skin-based bitmap - COG_rgb like in [23]. Instead of performing burdenbitmap analysis to get the COG_rgb, a quick row data in depth map is spatiallyanalyzed by LCFC. For more details see Section 5.1.2. We find COG_D by coarseclustering with big DM threshold as 0.3, which results in one cluster with centroidsdefining the COG_D. For more precise estimation of Dthr we can vary the millimetersthat we add to Dmin until COG_D gets equal to COG_rgb. In a scenario where thehands are not the most front objects, we use the second approach and formulae given inFig.(3.7). It tolerates brighter pixels and they have more impact on the final COG_rgblocation than darker pixels. Thus Dthr evolves with each frame.
3.3.3 Feature Extraction3.3.3.1 Overview of low-complexity constrained fuzzy clustering algorithm
Our feature extraction is based on distance-based fuzzy clustering. The most oftenused distance-based clustering like CMeans and k-Mean are offline. A priori thresholdvalue defines when a cluster is to be updated or new cluster is to be created. Human-robot interaction by a vision-based gesture interface needs online clustering process.Estimating the number of clusters online will help in online optimization of the thresh-old value and the radii of the clusters. We apply online low-complexity constrainedfuzzy clustering algorithm to partition the coordinates and the V value of edge pixelsnormalized in [0, 1] range. The main idea is to localize specific small grayscale regionsby categorizing the values of edge pixels. The overview of LCFC algorithm is presentedin details in [21]. For more details about implementation, see Section 3.5.1.2.In the online clustering process, the given data set consists of input vectors X ={x1, . . . , xp}, which are p points in q-dimensional space. In the present application pis the number of pixels to be processed, while q is 3, referring to the three dimensionsof each pixel that we take into consideration - (x, y) coordinates and the V channel.The algorithm starts with an empty set of clusters. When a new cluster Ck is created(k is an index related to the time instant), the current input vector is assigned to

Hand Gesture Recognition Based on Signals Cross-Correlation 57
be a cluster center (Cc) and its cluster radius (Ru) is initially set to zero. Thenthis cluster is updated or new cluster is created depending on online decision usingequations Eq.(3.1) and Eq.(3.2). Euclidean distance to mean centers (Mc) togetherwith fuzzy membership degree (Md) of the input vector to each cluster participatein the updating or creating of a new cluster. The two smallest distances from theinput vector to reference centers Mcj participate in the denominator of Eq.(3.2). Thereference center is described by the arithmetic mean of coordinates for all classifiedinputs to the jth cluster by Eq.(3.1).
Mcj =cp∑
i=1si/cp (3.1)
where si ∈ Rq are the classified inputs to jth cluster and cp is their number
Mdij =
1−min (‖xi −Mcj‖)(
2m−1 ) , n = 1
1
1+min 1(‖xi−Mcj‖)(
2m−1 )
min 2(‖xi−Mcj‖)(2
m−1 )
, n > 1 (3.2)
where x ∈ Rq andm ∈ [1,∞) is the weighted exponent coefficient which determineshow much clusters may overlap. We set m to be equal to 2.The acceptable tolerances to Mc and Md are expressed by two thresholds: Md
threshold (Mdthr) and Mean Threshold (Mthr). When Md is less than Mdthr orDMcij is bigger than Mthr we create a new cluster, otherwise we can increase theradius of this cluster. The idea is cluster radii not to be updated anymore when: (1)an example is close to more than one cluster; (2) the examples classified to cluster jare concentrated in the far half of this cluster with a big radius. The two thresholdsare in the range of [0, 1] and are very intuitive for tuning. When Mdthr has values inthe range of [0.4, 0.5] the clusters are well partitioned. By varying Mdthr we performcoarse or fine clustering. When Mthr has values in the range of [0.4, 0.6] the dataare partitioned close to optimal and usually the same clustering centers are obtainedfor several close threshold values. Big values for Mdthr and small values for Mthrresult in a big number of clusters.
3.3.3.2 Thresholds for clustering of depth and RGB raw data
During the clustering of depth data, the input data to LCFC is as x, y and D valuesobtained from depth stream. As we noted in Section 3.3.2.1 we use coarse clusteringwith Mthr threshold 0.3 to find COG_D and fine clustering with Mthr threshold inthe range of [0.05, 0.07] to categorized fingertips and palm/fist. Mdthr threshold is0.4. During the clustering of RGB data, the input data to LCFC is x, y and V valueobtained from HSV model. Mthr is in the range of [0.08, 0.12] resulting in about30-40 clusters. Mdthr threshold is in the range of [0.4, 0.5].

58 A. Lekova and M. Adda
3.3.4 Post-processing of ClustersWe perform reasoning process after online fuzzy clustering in the regions with highchange in light intensity that corresponds to edges of the segmented hand. We definea neighborhood mask by analogy to neighbors in a communication network in n-hopsthat will perform this operation in a distributed way. Network nodes communicatewith each other by their IDs and know their neighbors in x and y directions. Node IDis generated automatically as a function of the node position in the grid. For instance,124 nantennas forming an 18× 8 grid and the node (cluster centroids) communicatemore or less with the neighbors in 9 hops horizontally and 4 hops vertically. Thus wemanipulate r× c nodes (r neighbors horizontally and c neighbors vertically) relative tothe adjacent segmented hand grid, referred to Fig.(3.9a). The neighborhood mask isusually much smaller than the segmented hand image, see Fig.(3.9c). We start fromfirst cluster centroids and take over with the others to find all places where more thanfour clusters overlapped avoiding clusters with light intensity less than 0.1 as it is notreally informative. As a result, we propose grayscale patterns with a potential to betypical for a hand joint features. Grayscale patterns consists of averaged V-values forthe neighbor nodes (pixels) but are transmitted for processing during the training ortesting phases together with the number of participating in the clusters nodes (pixels),as well as with the spatial information of the clusters centroids. The cell(s) in theadjacent grid where the neighborhood mask finds overlapping defines the HJ position.
3.4 Hand Gesture Recognition: Features and HandJoints Identification, Profiling and Classifications
In this section, we show how monochromatic light intensity in vicinity (features) andprofiles of hand joints are represented by waves and signals cross-correlation for theirclassification, how hand joints are positioned in the HGR framework and then how VGis applied for hand gesture description and recognition.
3.4.1 Features and Hand Joints identifications and profilingWe search for clusters that are typical for the hand joints containing brighter anddarker pixel information. A human eye can’t distinguish the gray shades, as the LCFCalgorithm does, even though they exist. In Fig.(3.8), we hardly distinguish sevenoverlapping clusters in the right fingertip. With the help of LCFC algorithm results,we found out that the averaged V channel for the fingers show density of clusters forbrighter and darker pixels in the neighborhood with radii about 16 pixels (in other words- many edges with different grayscale level are placed at the overlapping locations).Thus we defined the size of the neighborhood mask to be 19 × 9. We use theseobservations for features division and established several ranges for the averaged graylevel of the edges for neighbor pixels, in which the probability to identify a specificfeature is high. To avoid misclassification, we take into consideration all the clustersin the neighborhood mask. For instance, the averaged gray level of pixels aroundthe pointing finger or thumb has V-values in the range of [0.07, 0.3] and [0.6, 0.8] at

Hand Gesture Recognition Based on Signals Cross-Correlation 59
almost the same coordinates.The main idea in feature and HJ profiling is associated with identifying clusters with
specific light intensity on edges of hand joints to represent each feature as a wave.Visible light is EMW with frequency range of the visible spectrum from 405 to 790Terahertz (THz) and each signal can be represented as a Fourier series. Colors arevariations in RGB frequencies. The red, green and blue frequencies correspond to 430,560, 660 THz. The monochromatic intensity (gray shades) has its own frequency,as well, an equal amount of R, G and B. As shown in Fig.(3.6), only V channel isimportant in HSV model for shades of gray. For instance:
RGB hex code #989898 RGB(152,152,152) HSV(0◦,0%,59.6%)
RGB hex code #D0D0D0 RGB(208,208,208) HSV(0◦,0%,81.6%)
We typify the grayscale patterns (the features) as a sine wave since intensity of theelectric current captured by the detector which represents the converted visible light, isa simple periodic signal. For the sake of simplicity, according to the cluster parametersand following the principle of superposition, we characterize clusters in the vicinity asa waveform obtained by a combination of sine waves shifted by phase. An illustrationon how the edges of the segmented hand, overlapping clusters and gray patterns looklike is presented in Fig.(3.8). Simple sine waves correspond to each cluster (feature)for the pointing finger, see Fig.(3.8a). The complex waveform shown in Fig.(3.8c) isone of the profiles in the database for pointing fingers.Mathematically, the most basic wave is the one-dimensional sine wave (or sinusoid).
It is a mathematical curve that describes a smooth repetition of oscillations. Its mostbasic form as a function of time (t) is described by Eq.(3.3) :
y (t) = Asin (2πft+ φ) (3.3)
where
A is the amplitude (the peak deviation of the function from zero),f is the frequency (the number of oscillations that occur per second),φ is the phase, specifies in radians.
When φ is non-zero, the entire waveform appears to be shifted in time. A negativevalue represents a delay, and a positive value represents an advance.Equation 3.3 is enough to represent the intensity of the current captured by the
sensor which represents a simple periodic signal. We epitomize the intensity of thegray color in each cluster as the frequency of the sine wave. We take into considera-tion the number of participating pixels in the cluster (correspondingly the number ofnantennas from which this gray intensity in the cluster is obtained), as well as a phaseabstraction representing an advance in time that sinusoids for right handed positioningclusters (ordered by x coordinate) have. As an alternative, features might be orderedby their y coordinates. The number of examples in each cluster corresponds to waveamplitude, frequency associated with intensity of gray color, and phases distinguishinghow the waves are to be superposed in time. We then compose a complex waveformby superposition of individual for features sine waves. Thus a hand joint profile is a

60 A. Lekova and M. Adda
Figure 3.8: Edges of the segmented hand and features and HJ profiling and formats.
Hand Gesture Recognition Based on Signals Cross-Correlation 61
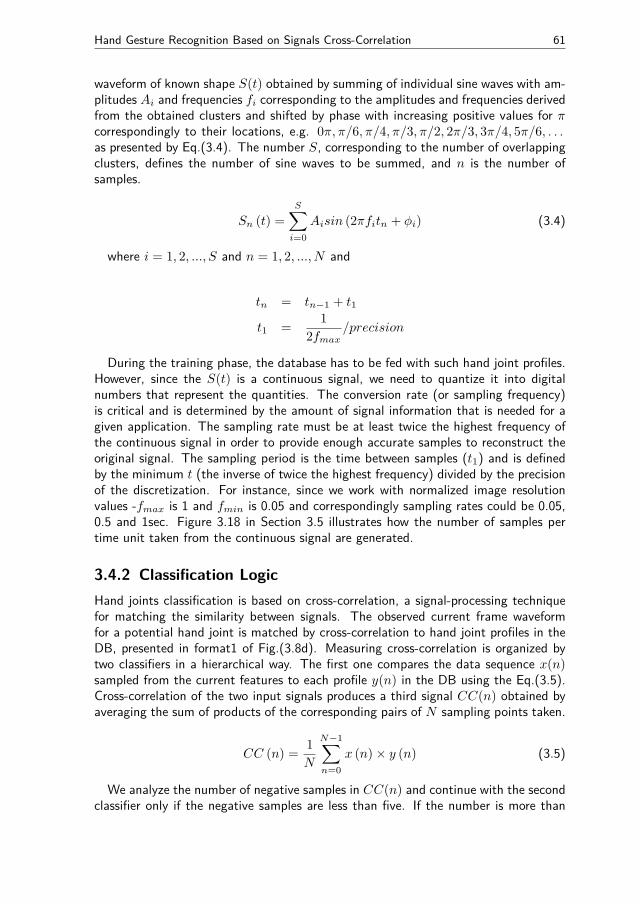
waveform of known shape S(t) obtained by summing of individual sine waves with am-plitudes Ai and frequencies fi corresponding to the amplitudes and frequencies derivedfrom the obtained clusters and shifted by phase with increasing positive values for πcorrespondingly to their locations, e.g. 0π, π/6, π/4, π/3, π/2, 2π/3, 3π/4, 5π/6, . . .as presented by Eq.(3.4). The number S, corresponding to the number of overlappingclusters, defines the number of sine waves to be summed, and n is the number ofsamples.
Sn (t) =S∑
i=0Aisin (2πfitn + φi) (3.4)
where i = 1, 2, ..., S and n = 1, 2, ..., N and
tn = tn−1 + t1
t1 = 12fmax
/precision
During the training phase, the database has to be fed with such hand joint profiles.However, since the S(t) is a continuous signal, we need to quantize it into digitalnumbers that represent the quantities. The conversion rate (or sampling frequency)is critical and is determined by the amount of signal information that is needed for agiven application. The sampling rate must be at least twice the highest frequency ofthe continuous signal in order to provide enough accurate samples to reconstruct theoriginal signal. The sampling period is the time between samples (t1) and is definedby the minimum t (the inverse of twice the highest frequency) divided by the precisionof the discretization. For instance, since we work with normalized image resolutionvalues -fmax is 1 and fmin is 0.05 and correspondingly sampling rates could be 0.05,0.5 and 1sec. Figure 3.18 in Section 3.5 illustrates how the number of samples pertime unit taken from the continuous signal are generated.
3.4.2 Classification LogicHand joints classification is based on cross-correlation, a signal-processing techniquefor matching the similarity between signals. The observed current frame waveformfor a potential hand joint is matched by cross-correlation to hand joint profiles in theDB, presented in format1 of Fig.(3.8d). Measuring cross-correlation is organized bytwo classifiers in a hierarchical way. The first one compares the data sequence x(n)sampled from the current features to each profile y(n) in the DB using the Eq.(3.5).Cross-correlation of the two input signals produces a third signal CC(n) obtained byaveraging the sum of products of the corresponding pairs of N sampling points taken.
CC (n) = 1N
N−1∑n=0
x (n)× y (n) (3.5)
We analyze the number of negative samples in CC(n) and continue with the secondclassifier only if the negative samples are less than five. If the number is more than

62 A. Lekova and M. Adda
Figure 3.9: Adjacent to hand grid: (a) 0.15×0.15 cell, (b) 0.25×0.25 cell and (c)19×9 neighborhood mask.
five, the cross-correlation coefficient (CCoef) of the two signals is very small and itis not worth any calculations. We calculate CCoef , which lies between −1 and +1,from Eq.(3.6) in order to obtain a grade of similarity. The value of +1 means 100%similarity, while small values indicate very low correlation.
CCoef =∑N−1
n=0 (x (n)− x)× (y (n)− y)√∑N−1n=0 (x (n)− x)2 ×
∑N−1n=0 (y (n)− y)2
(3.6)
where x and y are the means of x(n) and y(n), respectively.
3.4.3 Positioning and Timing Information
Once the hand joints are identified and classified, the HGR framework positions themusing binary encoding corresponding to their locations in a hand according to theirpositions in a grid adjacent to the segmented hand. It has 4 × 4 cells and takes thesize of the segmented hand. We use COG_D(x, y) coordinates for tuning the sizeof the grid to end the wrist in order to increase the precision for localizing fingertipssince some of the wrist and finger hand joints show equal wave profiles. Moreover,the cells where COG_D and the fingertip are positioned help us to define the handdirection. Most researchers assume that the hand is always pointing upward but thisis not true. For instance, in Fig.(3.9a), we compare the grid cells where COG_Dand a hand joint of type FingerTipPointing by simple logic to detect a left orientedhand. We define a pattern of bits to describe the HJ location that is relative to theadjacent grid. The corresponding decimal number is used at the gesture recognitionphase. At the beginning, the HJ Location (HJL) consists of only zeros - “0” and whenwe classify a HJ (e.g. the presence of a finger) we assign a one - “1” according to(x, y) coordinates of neighbor pixels. For instance, if the adjecent to hand grid has100 × 100 pixels the HJL1 in Fig.(3.9a) has 01 at position x in the range [0, 0.25]and y in the range [0.25, 0.5] because there are overlapping grayscale patterns. Thefollowing figures show the tracked HJs in the different cells in hand grids and thepattern of bits for the HJ location.

Hand Gesture Recognition Based on Signals Cross-Correlation 63
Figure 3.10: Feature locations and masks for relations.
Gestures.push({nameG:"OK", min_fingers:1, HJs:" thumb, fist", beginning_relation:"above",
beginning_HJs:"thumb, fist", ending_relation:"above", ending_HJs:"thumb, fist", runtime:
1000});
Figure 3.11: Pseudo code for gesture description in VG.
3.4.4 Recognition of a Hand GestureWe incorporate the positions of segmented fingers and a palm with semantic keywordsto define the meaning of the gesture. A gesture might consist of one pose (staticgesture) or more poses (dynamic gesture). A pose consists of HJs and their spatialrelations for some period of time. At the recognition phase, we use a Visual Grammar(VG) formalism proposed in [16] to describe the decomposition of a gesture into itsposes, poses into hand joints and their spatial relations to each other over someperiod of time. Each sentence is composed of a set of elementary objects, which areconnected by binary relations, e.g. the relationships of hand joints to each other.We define an enumeration JointRelationship to describe the possible relationships ofjoints that are supported by the VG, such as “above”, “leftOf”, “aboveAndRight”, and“belowAndLeft”. The pose description is incorporate in the gesture description withbeginning and ending objects, see the description of gesture “OK” in Fig.(3.11). Thegesture is static because the instances for the objects beginning _HJs and beginning_relation are the same as ending _HJs and ending _relation.The reasoning process for gesture recognition is based on comparing the beginning
and ending HJs and evaluating of the beginning and ending relations according to theHJs locations during the gesture runtime. Locations are binary numbers according tothe HJ position in the adjacent grid. The “1” in the 13th and 15th bit in HJL1 inFig.(3.10) indicate that there is “aboveAndLeft” oriented feature. To evaluate locationrelation, we use bit-wise operations (AND, OR, masking and bit shifts) that operate onthe binary representation of an integer that characterize the HJ positions in the grid.Location matching is based on logical AND on each pair of bits from the HJL1 andHJL2. The mask above in Fig.(3.10) (- 255) helps in recognizing the “up” orientedHJ. By applying the mask above to HJL2 we establish whether the second hand joint isbelow the first one. Figure 3.12 shows a pseudo code how the relation above betweenthe two hand joints HJ1 and HJ2 with corresponding bit patterns about their locations

64 A. Lekova and M. Adda
function relation_above(HJ_type HJ1, HJ_type HJ2, Location HJL1, Location HJL2 ):Boolean{
if (HJL1 >=16384) //the first HJ is UP positioned
mask_HJL2=255;//0000000011111111
one of the bits [6,4,2,0] MUST be 1;
HJL2_masked =HJL2 & mask_HJL2;
//check the second bit in HJL2 ;
if((HJL2.masked >�> 2) &1) = =1 return TRUE; }
Figure 3.12: Pseudo code how relations in VG sentences are evaluated.
HJL1 and HJL2 is evaluated to be true or false.
3.5 Implementation and Experimental ResultsIn this Section, we present in brief how the proposed HGR framework is implemented byinterfacing Adobe AIR 3.0 with Kinect sensor. We provide the algorithm for clusteringthe depth stream, as well as parts of as3 source codes for RGB bitmap data preprocess-ing, feature identification and profiling, and cross-correlation of the observed waves toprofiles in the DB. For verification and comparison of the proposed HGR framework,we use the hand gesture dataset collected by a Kinect sensor in [30] and providedonline in [4]. Experimental results and discussion follow.Since the input data for the proposed HGR framework is low level depth and RGB
Kinect streams we use Kinect Native Extension with Adobe AS3 software (AIRKinect)developed by [35]. It has a lot of built-in features from light level functions thatprovide an abstraction layer with a generic interface to those two sensors to APIs thatuse the rich experience of the Microsoft Kinect. The drivers, installation directives andapplication libraries for interfacing Kinect with Flash&AS3 can be found in [35]. Howto get started with installation of Kinect drivers and application libraries for the MSSDK version of the Kinect sensor for interfacing Kinect with AS3, as well as a simpleAIRKinect application rendering the depth image, can be found on the site developedby us [2].
3.5.1 Implementation of HGR FrameworkThe AIRKinect-based application returns depth and color data using the followingframe events CameraImageEvent.DEPTH_IMAGE_UPDATE and CameraImageEvent.RGB_IMAGE_UPDATE, which fire each time when new frame is available from thesensor. For each frame, we check whether the number of clusters in the current frameis different to the number in previous frame, and if this is true we continue withprocessing the depth stream and RGB bitmap, see Fig.(3.4).
3.5.1.1 Coordinate systems
The Kinect sensor uses a laser grid to calculate depth map Fig.(3.5b) form IR imageFig.(3.5a). Microsoft Kinect SDK [7] uses two different coordinate systems: a skeleton

Hand Gesture Recognition Based on Signals Cross-Correlation 65
(a) Skeleton space coordinate system[7].
(b) The depth image space co-ordinate system.
Figure 3.13: Coordinate systems in Microsoft Kinect for Windows SDK.
coordinate system and a depth image space coordinate system. The skeleton coordi-nate system as shown in Fig.(3.13a) places a Kinect at the origin with the positivez-axis extending in the direction in which the Kinect is pointed. The positive y-axisextends upward and the positive x-axis extends to the left. The three coordinates areexpressed in meters. The depth and RGB image space coordinate system, refer toFig.(3.13b) has its origin in the left upper corner of the image with the x-axis point-ing right and the y-axis pointing down. For each frame, the depth sensor captureseverything visible in the field of view, provided as a grayscale image or as a stream,consisting of only z coordinates expressed depth in millimeters. The image resolutionspecifies the length of depth stream.To simplify the bitmap analysis of the grayscale image to get the depth values, we
parse the depth stream and transform it to 2D array of pixels. In order to repeat andcompare the experiments provided by different approaches that use dataset providedin [4], we show in Fig.(3.14) how to get the (x, y) coordinates for the depth valuesfrom the text files with depth streams as in [4]. The process of the depth stream inXYZ array in AIRKinect can be found in our site [2].
3.5.1.2 Preprocessing of depth raw data
The input to LCFC algorithm for clustering of depth data is the z coordinate, i.e., thedepth value for each pixel normalized according to minDepth and maxDepth. The fullsources can be found in [2] in the topic: Download, while the explanations on howto vary the LCFC thresholds for coarse and fine clustering can be seen at the topic:Clustering.
3.5.1.3 Preprocessing of color raw data
RGB raw data needs to be preprocessed before passing to LCFC algorithm for cat-egorizing them. The bitmap data handled during the event CameraImageEvent.RGB_IMAGE_UPDATE initializes an array named input_RGB, as shown in Fig.(3.15).In scenarios where the hands are not the most front objects, we first perform skin
region segmentation to find the COG_rgb for the segmented hand using formulae in

66 A. Lekova and M. Adda
function loaderCompleteHandler(event:Event) : void{
//loading the depth streams as text filesloader.removeEventListener(Event.COMPLETE, loaderCompleteHandler);parse(loader.data)
}var lines:Array = data.split(’\n’); //split data file by lines (height)
for(i=0;i<height;i++){
tabs[i] = lines[i].split(","); //split data file by comas (width)depth_data[i] = lines[i].split(",");
}
//then we need to rotate the bitmap by 90◦
for(i=0;i<height;i++){
for(var j:int=0;j<width;j++){
depth_data[j][i]=tabs[i][j];//trace(depth_data[j][i]);
}
}
Figure 3.14: Part of as3 code for parsing of the depth text files in [4].
protected function onRGBImageUpdateHandler(event:CameraImageEvent):void{
_rgbBitmap.bitmapData = event.imageData;input_RGB=new Array();var i:int = 640 * 480;while ( i-- ){
//this is the position of each pixel in x & yx1 = i % 640;y1 = int( i / 640 );color = _rgbBitmap.bitmapData.getPixel( x1, y1 );input_RGB[x1][y1]=color; //to trace color: trace(input_RGB[x1][y1].toString(16));
}
}
Figure 3.15: Part of as3 code for RGB bitmap data handling.

Hand Gesture Recognition Based on Signals Cross-Correlation 67
Figure 3.16: Sobel convolution kernels, G - approximate gradient magnitude.
Fig.(3.7). Then we detect edges by Sobel gradient measurement. The Sobel operator[14] consists of a pair of 3× 3 convolution kernels as shown in Fig.(3.16). The secondkernel is simply the first rotated by 90°. As3 code showing how to apply the Sobeloperator to the bitmap data for edge detection is expressed in Fig.(3.17).We convert BMD_edges from RGB to HSV format, see Fig.(3.6); and the V values
together with (x, y) pixel coordinates of the segmented hand are made the inputs toLCFC algorithm. The clustering thresholds for processing color data in our imple-mentation are: MDthr = 0.4 and Mthr = 0.07 resulting in about 40-55 number ofclusters and average 5-8 overlapped clusters. The size of the neighborhood mask is19× 9 pixels and the clusters are ordered by their x coordinates.
3.5.1.4 Implementation of hand joint profiling and signals cross-correlation
Figure 3.18 illustrates how the number of samples are taken from the continuoussignal. With a sampling period of t1 = 0.05 the accuracy of the corresponding digitalsignals is better; however this will increase the size of DB and the time for responding.The t1 = 0.5 gives enough precision in only 42 samples per profile. The pseudocode, mainly given to illustrate the input format of waves for cross-correlation, shownin Fig.(3.19), explain how to add the individual sine waves with amplitudes Ai andfrequencies fi for calculating S(t).Measuring the similarity between signals by cross-correlation is organized by two
classifiers in a hierarchical way. First we measure cross-correlation between the ob-served and trained, in the DB, waves that produces a third wave CC(n). Then weanalyze the number of negative samples in CC(n) and if it is less than 5 and theminimal amplitude of CC(n) is in the range [−0.05, 0.2] we calculate cross-correlationcoefficient (CCoef) of the two signals by Eq.(3.6) in order to obtain the grade ofsimilarity. Implementation is shown in Fig.(3.20).The DB consists of 6940 profiles, while the VG consists of 18 sentences. According
to the recognized poses and their timestamps, the rotation angles for the motors ofthe robot hand(s) are updated, however this is a scope of another study.
3.5.2 ExperimentsDuring the testing phase, we match a potential hand joint wave to the preprocessedhand gesture of the trained data in the DB. They are collected during the training

68 A. Lekova and M. Adda
function SobelEdgeCalculation(w:int, h:int,BMD_rgb:Array) {for (row = 1; row < w; row++){
for ( column = 1; column < h; column++){m11 = GrayTransf(BMD_rgb [row-1][column-1]);m12 = GrayTransf(BMD_rgb [row][column-1]);m13 = GrayTransf(BMD_rgb [row+1][column-1]);m21 = GrayTransf(BMD_rgb [row-1][column]);m22 = GrayTransf(BMD_rgb [row][column]);m23 = GrayTransf(BMD_rgb [row+1][column]);m31 = GrayTransf(BMD_rgb [row-1][column+1]);m32 = GrayTransf(BMD_rgb [row][column+1]);m33 = GrayTransf(BMD_rgb [row+1][column+1]);
Gx = -m11+m13-2*m21+2*m23-m31+m33;Gy = m11+2*m12+m13-m31-2*m32-m33;
G = Math.abs(Gx)+Math.abs(Gy); // G *= 0.5;newPixel= (G<�< 16) + (G <�< 8) + G;BMD_edges[row][column]=newPixel;
}}
}
function GrayTransf(px:uint):uint {var red:uint = (px >�> 16 & 0xFF);var green:uint = (px >�> 8 & 0xFF);var blue:uint = (px & 0xFF);// Any color is obtained by mixing the three primary colors in suitable proportions
return (red* 0.30 + green* 0.59 + blue* 0.11);
}
Figure 3.17: Part of as3 source code for edge detection by the Sobel algorithm.
Figure 3.18: Variation in the number of samples taken from a continuous wave todescribe it as a discrete wave.

Hand Gesture Recognition Based on Signals Cross-Correlation 69
Inputs: arr [] - array of struct with parameters for overlapping_clusterssampling period t1 = 0.5sec, ti = ti−1 + t1
//clusters parameters-> Nexamples:number of examples; arr[1].color: colorif(arr.length==6) {
for(i=0;i<42;i++) {FM[i]=arr[0].Nexamples*Math.sin(2*Math.PI*arr[0].color*t[i])+arr[1].Nexamples*Math.sin(2*Math.PI*arr[1].color*t[i]+Math.PI/4)+arr[2].Nexamples*Math.sin(2*Math.PI*arr[2].colorr*t[i]+Math.PI/2)+arr[3].Nexamples*Math.sin(2*Math.PI*arr[3].colorr*t[i]+3*Math.PI/4)+arr[4].Nexamples*Math.sin(2*Math.PI*arr[4].colorr*t[i]+Math.PI)+arr[5].Nexamples*Math.sin(2*Math.PI*arr[5].color*t[i]+3*Math.PI/2);
}
}
Figure 3.19: Pseudo code for calculating S(t).
Input: FM and the number of the simple sinusoids in the wavefunction cross_correlation(number:int,FM:Array):Number {
// Implementation of Eq(3) for all c records in DBfor( c=0;c<DB.length;c++){
cnt_neg=0;//counter for negative values in CC(n)Di=FRB[c].concat();for(d=0;d<Di.length-1;d++) {
CC[d]=Di[d]*FM[d];if (product[d] < 0.0)
cnt_neg++;}for(d=0;d<Di.length-2;d++) {
if (minAmplitudeCC>CC[d])minAmplitudeCC =CC[d];
}if( cnt_neg<10 && minAmplitudeCC <-0.0 && minAmplitudeCC >=-0.2 )
CCoef [c]=0.75;if( cnt_neg<10 && minAmplitudeCC <-0.2 && minAmplitudeCC >=-0.4 )
CCoef [c]=0.5;if( cnt_neg<5 && minAmplitudeCC <=0.0 && minAmplitudeCC >=-0.05 ) {
//Implementation of Eq.(4)for(d=0;d<Di.length-1;d++) {
mean1=mean1+Di[d];mean2=mean1+FM[d];
}mean1=mean1/Di.length;mean2=mean2/Di.length;for(d=0;d<Di.length-1;d++) {
nomin=nomin+(Di[d]-mean1)*(FM[d]-mean2);denom1=denom1+(Di[d]-mean1)*(Di[d]-mean1);denom2=denom2+(FM[d]-mean2)*(FM[d]-mean2);
}CCoef [c]=nomin/(Math.sqrt(denom1*denom2));
}Di.splice(0);}//ending with all profiles in DB for current size
return (the_max_to_all_DBprofiles_CCoef);
}
Figure 3.20: Pseudo code for wave’s cross-correlation.

70 A. Lekova and M. Adda
Table 3.1: Overall Accuracy for gestures: “Pointing” (G2), “Number_two” (G3), “Hi”(G6), “Ok” (G9).
Gesture cases tp AccG2 all 10 Subjects 40 38 0. 95G3 all 10 Subjects 40 36 0. 90G6 all 10 Subjects 40 33 0.82G9 all 10 Subjects) 40 38 0.95
phase from hand gesture dataset taken by a Kinect sensor [30] and given online[4].Dataset is collected from 10 subjects, each containing 10 gestures and 10 differentposes for the same gesture, so in total the dataset consists of 1000 cases, each ofwhich consists of a color image and a depth map. The gestures are static and taken indifferent views, backgrounds, and variations in a gesture pose, illumination, skin color,sizes and shapes. We trained and tested the performance of our HGR framework onlyfor four gestures from the dataset, collected from all 10 subjects in 10 different posesfor the same gesture, so in total we exploit 400 cases. We use the first six posesfrom all subjects to train the DB, and the last four poses to test the accuracy of ourHGR framework. The types of gestures we identified are: “Pointing” – gesture G2;“Number_two” – gesture G3; “Hi” – gesture G6 and “Ok” – gesture G9.Our training phase has taken 240 cases from all 10 subjects, with the first 6 poses
taken for all 4 gestures. After hand segmentation according to the depth streamand preprocessing of color information given for each pose, we identify about 25-30grayscale patterns in short distance featuring HJs. A hand joint may be identified bymore than one grayscale pattern, for instance, about 6 profiles specify a spread fingerand more than 10 categorize folded fingers that present in all four gestures. Afterprofiling and labeling these features with the relevant type of HJ, we recorded them inthe DB. However, self-signal cross-correlation needs to be performed first to removeduplicated wave profiles. The current DB consists of 1810 wave profiles for the gestureG3 and 6940 for the all four gestures. The VG consists of 18 sentences. The sentencescombined a type of finger(s), one or two relations with palm, folded fingers or wrist.For instance, the sentences for “Ok” gesture are 3. A thumb and the relation “above”combined with three HJs: palm, wrist or folded fingers (fist).
3.5.3 Results and DiscussionIn the context of classification tasks, accuracy represents the percentage of recogni-tions that are correct. The terms true positives (tp) and false positives (fp) are usedto compare the given classification of the HGR framework with the desired correct clas-sification. Correct gesture recognition is taken as “tp”. Overall accuracy is calculatedby Eq.(3.7).
Acc = tp
tp+ fp= tp
total number of cases(3.7)
Table 3.1 illustrates the accuracy in recognizing the four gestures. The testing cases

Hand Gesture Recognition Based on Signals Cross-Correlation 71
are the last four poses for each gesture taken from all subjects – 40 cases per gesture.The overall accuracy is 90%. It shows that the proposed HGR framework needs asmall number of cases during the training to start recognizing a new gesture with afeasible accuracy – only 240 cases and about 1810 wave profiles in the DB. Moreover,still during the training and feeding to our DB with HJ profiles for the gesture G3,we observed that only by 60 poses we obtain 80% accuracy in recognition. We use160 cases at the testing phase - from all 10 subjects, the last 4 poses taken for all 4gestures. We establish that the accuracy in recognition of spread fingers (index, middleor ring) and in thumb is about 95%. The subject is irrelevant however the orientationof the hand is important. For instance, the cases with no upward-oriented hand in G3are less than upward-oriented ones and consequently they are less recognizable. Theworst recognition accuracy shows gesture G6. We explain this with the fact that thetraining poses for this gesture are not enough to distinguish between index, middle andring fingers, which participate in the VG sentences for “Hi” gesture description. Wematched at least 5 HJs profiles for fingers in the VG sentence however, we are not surewhat type of fingers participate (index, middle or ring) since they have similar profiles.We will solve this problem in the future with more detailed study of HJs positions inaccordance to the adjacent to the hand grid. The reason for less recognition accuracyfor gesture G3 could be attributed to the quantization errors in depth camera and lowKinect resolution that limit our classification when a finger is dropped. A human eyecannot see a dropped finger however, in case a finger is not dropped at all, a grayscalepattern exists and the DB has been trained with such profiles. We can then laterrecognize the low resolution cases. Another reason for dropping could be related towhen the subject is in “Kinect near mode” and the finger is closer to Kinect than theminimum depth threshold. The good thing is that we always distinguish fingers thanthe other hand joints and unpredictably we recognized the folded fingers present inall 4 gestures with an accuracy of 97%, which will be very useful in the future forrecognizing complex dynamic gestures.We plan to improve the overall accuracy of the proposed HGR framework in the
future by training it with much more profiles derived from gestures varying in handsizes, shapes and poses together with the enhanced in resolution of new Kinect sensors.We followed the lessons from Microsoft Kinect and Leap to design accurate data-drivensoftware algorithms for gesture recognition [12]. The extremely low cost of CPU andGPU cycles permits now to throw large amounts of Kinect data at the computer and letthe algorithms figure out from a large set of tagged data and decide which attributes(features) are important for making the recognition decisions. We also discovered howto determine which feature provides the most valuable information and how to reducethe data for identification by clustering light intensity on hand edges. However, aDB optimization is required when the HGR framework is applied in a local mode ona robot side. The framework can easily be extended for more gestures. The systemresponse time depends on the clustering time and the numbers of waves in the DB,but not on the HJ position and orientation because that does not affect its size. DBdoes not contain the positions of features for hand joints.

72 A. Lekova and M. Adda
3.6 Conclusions
The recent study proposes a new way of understanding and interpreting gestures byrobots, and therefore opening up a number of research opportunities in the field ofdesigning smart sensors derived from the radar technology using a signal in the opticalrange of the electromagnetic spectrum to perform signal processing. The proposedhand gesture recognition framework can be applied to different measurable signalsthat are proportional to infrared or visible light radiation and is robust to lighteningconditions, cluttered backgrounds and hand sizes, shapes and poses by exploitinggrayscale patterns for the regions with the high change in light intensity obtainedby online low-complexity constrained fuzzy clustering and reasoning. The frameworkhas been applied to row data obtained by Microsoft Kinect IR and RGB sensors andthe result clustering, features identification and a novel profiling resolved some of theproblems that researchers met when using Kinect sensor for hand gesture recognition.The framework might be implemented in two scenarios as a local hardware solutionpracticable when the sensor is placed on a robot side or as wireless software applicationpracticable for remote gesture recognition. In the future we plan to design the proposedgrid of nano-antennas in a network simulator, as well as in a network emulator, and testthe overall distributed process for preprocessing and clustering of the harvest infraredand visible light converted to electric current signals.
References
[1] Ampullae of lorenzini. http://en.wikipedia.org/wiki/Ampullae_of_Lorenzini.
[2] As3kinectnui for gestures recognition. http://as3kinect.aabg.eu/depth.[3] Can bus. http://en.wikipedia.org/wiki/CAN_bus.[4] Hand gesture dataset taken with a Kinect sensor. http://eeeweba.ntu.edu.s
g/computervision/people/home/renzhou/HandGesture.htm.[5] Infrared sensing in snakes. http://en.wikipedia.org/wiki/Infrared_sensi
ng_in_snakes.[6] Kinect. http://en.wikipedia.org/wiki/Kinect.[7] Microsoft kinect sensor. http://www.microsoft.com/en-us/kinectforwind
ows.[8] Nantenna. http://en.wikipedia.org/wiki/Nantenna.[9] I.F. Akyildiz, F. Brunetti, and C. Blázquez. Nanonetworks: a new communication
paradigm. Computer Networks, 52(12):2260–2279, 2008.[10] M. Asad and Ch. Abhayaratne. Kinect depth stream pre-processing for hand
gesture recognition. In IEEE International Conference on Image Processing (ICIP),pages 3735–3739, 2013.
[11] R. Azad, B. Azad, and I. Kazerooni. Real-time and robust method for handgesture recognition system based on cross-correlation coefficient. Advances inComputer Science: an International Journal, 2(6):121–125, 2013.
[12] D. Cardinal. Making gesture recognition work: lessons from Microsoft Kinect and

Hand Gesture Recognition Based on Signals Cross-Correlation 73
leap. http://www.extremetech.com/extreme/160162-making-gesture-recognition-work-lessons-from-microsoft-kinect-and-leap.
[13] P. Doliotis, A. Stefan, C. McMurrough, D. Eckhard, and V. Athitsos. Comparinggesture recognition accuracy using color and depth information. In 4th Interna-tional Conference on PErvasive Technologies Related to Assistive Environments(PETRA), page Article No. 20, 2011.
[14] R. Duda and P. Hart. Pattern Classification and Scene Analysis. Wiley & Sons,1973.
[15] S. Evanczuk. Microchip elevates HMI design with e-field-based 3-D gesture-recognition chip. EDN, 57(18):p14, 2012.
[16] F. Ferrucci, G. Pacini, G. Satta, M.I. Sessa, G. Tortora, M. Tucci, and G. Vitiello.Symbol–relation grammars: a formalism for graphical languages. Information andComputation, 131(1):1–46, 1996.
[17] J. Han, L. Shao, D. Xu, and J. Shotton. Enhanced computer vision with MicrosoftKinect sensor: a review. IEEE Transactions on Cybernetics, 43(5), 2013.
[18] B. Kellogg, V. Talla, and S. Gollakota. Bringing gesture recognition to all devices.In 11th USENIX Symposium on Networked Systems and Design Implementation(NSDI), pages 303–316, 2014.
[19] C. Keskin, F. Kirac, Y.E. Kara, and L. Akarun. Real time hand pose estima-tion using depth sensors. In IEEE International Conference on Computer VisionWorkshops (ICCV Workshops), pages 1228–1234, 2011.
[20] U. Lee and J. Tanaka. Hand controller: image manipulation interface using fin-gertips and palm tracking with Kinect depth data. In 10th Asia Pacific Conferenceon Computer and Human Interaction, pages 705–706, 2012.
[21] A. Lekova. Evolving fuzzy modeling based on low-complexity constrained fuzzyclustering. Comptes rendus de l’Académie bulgare des Sciences, 67(10):1411–1418, 2014.
[22] H. Liang, J. Yuan, and D. Thalmann. 3-d fingertip and palm tracking in depthimage sequences. In 20th ACM International Conference on Multimedia (MM),pages 785–788, 2012.
[23] A. Malima, E. Özgür, and M. Çetin. A fast algorithm for vision-based hand gesturerecognition for robot control. In 14th IEEE Conference on Signal Processing andCommunications Applications, pages 1–4, 2006.
[24] T. Marasović and V. Papić. User-dependent gesture recognition on Androidhandheld devices. In 22nd International Conference on Software, Communicationsand Computer Networks (SoftCOM), 2014.
[25] I. Oikonomidis, N. Kyriazis, and A. Argyros. Efficient model-based 3-D trackingof hand articulations using Kinect. In 22nd British Machine Vision Conference(BMVC), pages 101.1–101.11, 2011.
[26] M. Patel. Platypus electroreception. http://www.reed.edu/biology/professors/srenn/pages/teaching/web_2007/myp_site/index.html, 2007. Biol-ogy 342: Animal Behavior.
[27] Q. Pu, S. Gupta, S. Gollakota, and S. Patel. Whole-home gesture recognitionusing wireless signals. In 19th Annual International Conference on Mobile Com-puting & Networking (MobiCom), pages 27–38, 2013.
[28] J.L. Raheja, A. Chaudhary, and K. Singal. Tracking of fingertips and centre of

74 A. Lekova and M. Adda
palm using KINECT. In 3rd IEEE International Conference on ComputationalIntelligence, Modelling and Simulation, pages 248–252, 2011.
[29] M. Raptis, D. Kirovski, and H. Hoppe. Real-time classification of dance ges-tures from skeleton animation. In ACM SIGGRAPH/Eurographics Symposiumon Computer Animation, pages 147–156, 2011.
[30] Z. Ren, J. Yuan, and Z. Zhang. Robust hand gesture recognition based onfinger-Earth Mover’s Distance with a commodity depth camera. In 19th ACMInternational Conference on Multimedia (MM), 2011.
[31] D. Saffer. Designing Gestural Interfaces: Touchscreens and Interactive Devices.O’Reilly Media, 2008.
[32] M. Schnell. Infrared Nanophotonics based on Metal Antennas and TransmissionLines. PhD thesis, Universidad del Pais Vasco, 2012.
[33] M. Tang. Hand gesture recognition using Microsoft’s Kinect. http://www.scribd.com/doc/91488017/Tang-Hand-Gesture-Recognition, 2011.
[34] R. Tara, P. Santosa, and T. Adji. Hand segmentation from depth image usinganthropometric approach in natural interface development. International Journalof Scientific and Engineering Research, 3(5):1–5, 2012.
[35] W. Verweirder, R. Gerbasi, and J. Imhof. Airkinect-2-core. http://as3nui.github.io/airkinect-2-core.