hampton roads real estate market review - · pdf filewith the data and analysis by james...
TRANSCRIPT
E. V. WILLIAMS CENTER FOR REAL ESTATE AND ECONOMIC DEVELOPMENT
WWW.ODU.EDU/CREED
H A M P T O N R O A D S R E A L E S T A T E
M A R K E T R E V I E W
3
ASSOCIATE PUBLISHER
Mike Herron
Inside Business
757.222.3991
SPECIAL PUBLISHING MANAGER
Olga Currie
GRAPHIC DESIGN
Pico Design & Illustration
www.picodesign.net
757.493.0370
DIRECTOR OF SALES
Bill Blake
757.222.3165
ADVERTISING SALES
Robin Simmons
John Kinsley
BUSINESS MANAGER
Debbi Wilson
Inside Business
150 W. Brambleton Avenue
Norfolk, Virginia 23510
757.222.5353
E. V. Williams Center for Real Estate & Economic
Development
www.odu.edu/creed
Data for Old Dominion University E.V. Williams Center for Real Estate and
Economic Development Market Survey wascollected in the fourth quarter — 2011
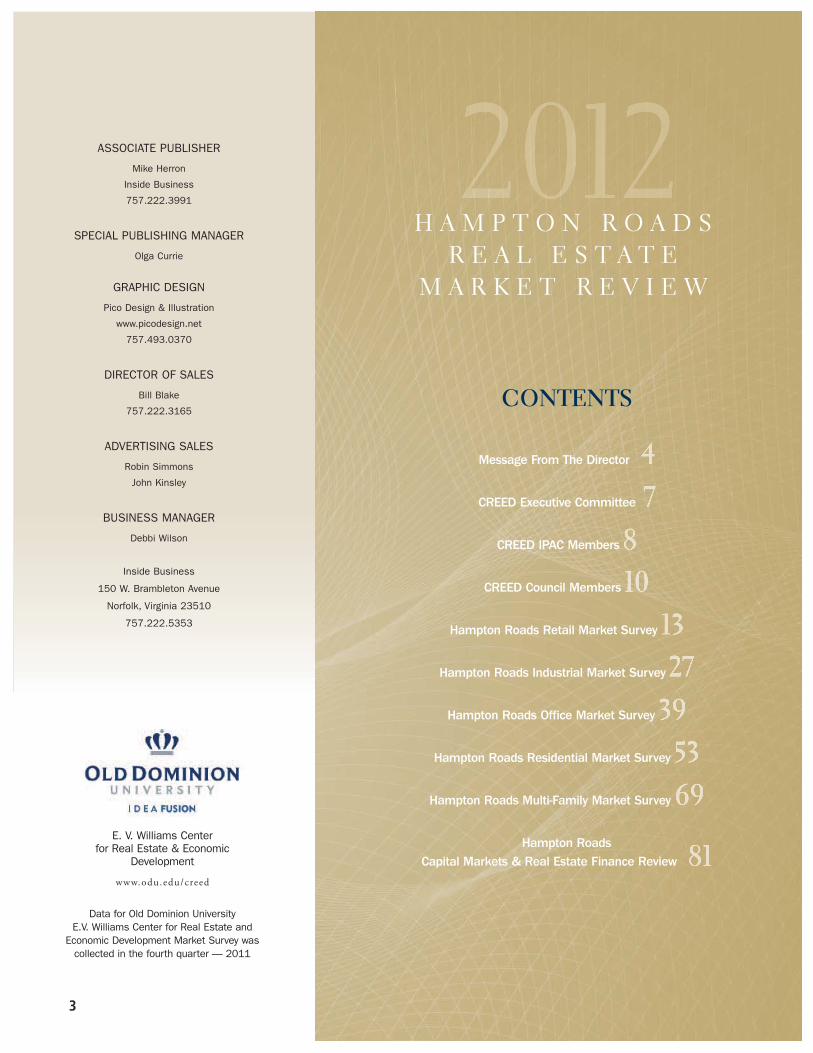
CONTENTS
Message From The Director
CREED Executive Committee
CREED IPAC Members
CREED Council Members
Hampton Roads Retail Market Survey
Hampton Roads Industrial Market Survey
Hampton Roads Office Market Survey
Hampton Roads Residential Market Survey
Hampton Roads Multi-Family Market Survey
Hampton Roads Capital Markets & Real Estate Finance Review
H A M P T O N R O A D S
R E A L E S T A T E
M A R K E T R E V I E W
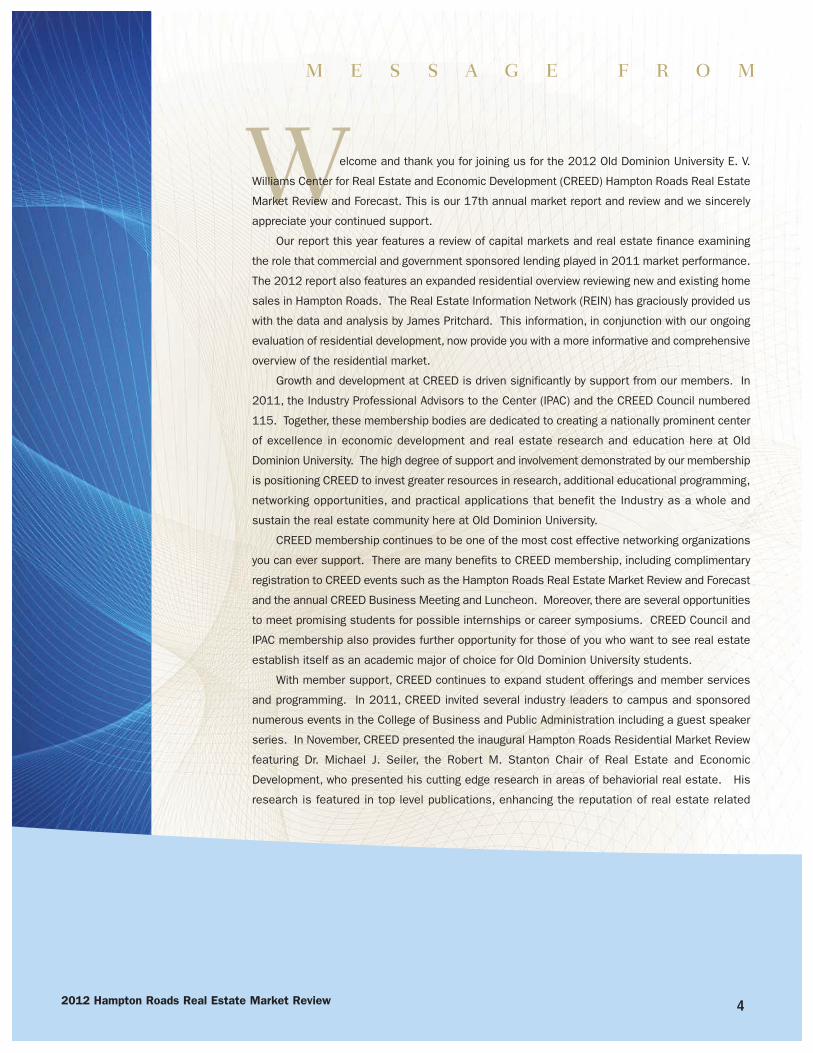
M E S S A G E F R O M
Welcome and thank you for joining us for the 2012 Old Dominion University E. V.
Williams Center for Real Estate and Economic Development (CREED) Hampton Roads Real Estate
Market Review and Forecast. This is our 17th annual market report and review and we sincerely
appreciate your continued support.
Our report this year features a review of capital markets and real estate finance examining
the role that commercial and government sponsored lending played in 2011 market performance.
The 2012 report also features an expanded residential overview reviewing new and existing home
sales in Hampton Roads. The Real Estate Information Network (REIN) has graciously provided us
with the data and analysis by James Pritchard. This information, in conjunction with our ongoing
evaluation of residential development, now provide you with a more informative and comprehensive
overview of the residential market.
Growth and development at CREED is driven significantly by support from our members. In
2011, the Industry Professional Advisors to the Center (IPAC) and the CREED Council numbered
115. Together, these membership bodies are dedicated to creating a nationally prominent center
of excellence in economic development and real estate research and education here at Old
Dominion University. The high degree of support and involvement demonstrated by our membership
is positioning CREED to invest greater resources in research, additional educational programming,
networking opportunities, and practical applications that benefit the Industry as a whole and
sustain the real estate community here at Old Dominion University.
CREED membership continues to be one of the most cost effective networking organizations
you can ever support. There are many benefits to CREED membership, including complimentary
registration to CREED events such as the Hampton Roads Real Estate Market Review and Forecast
and the annual CREED Business Meeting and Luncheon. Moreover, there are several opportunities
to meet promising students for possible internships or career symposiums. CREED Council and
IPAC membership also provides further opportunity for those of you who want to see real estate
establish itself as an academic major of choice for Old Dominion University students.
With member support, CREED continues to expand student offerings and member services
and programming. In 2011, CREED invited several industry leaders to campus and sponsored
numerous events in the College of Business and Public Administration including a guest speaker
series. In November, CREED presented the inaugural Hampton Roads Residential Market Review
featuring Dr. Michael J. Seiler, the Robert M. Stanton Chair of Real Estate and Economic
Development, who presented his cutting edge research in areas of behaviorial real estate. His
research is featured in top level publications, enhancing the reputation of real estate related
42012 Hampton Roads Real Estate Market Review
5
T H E D I R E C T O R
research in the College and University. Also presenting at this inaugural event, ODU’s leading
economist, Dr. Vinod Agarwal, as well as Van Rose of Rose and Womble, and the Honorable Judge
Frank Santoro spoke on the economic and legal aspects of current home buying and residential
lending trends at both the regional and national levels.
Looking ahead to 2012, CREED is expanding its partnership with the local chapter of the
Urban Land Institute, in addition to many other regional industry partners, to bring the nationally-
acclaimed ULI Reality Check land-planning exercise to Old Dominion University on May 17, 2012.
This event will bring together 300 practitioners specializing in development, infrastructure,
engineering and land-use policies for a one-day visioning exercise to determine sustainable and
effective planning for our region’s projected growth for the next 25 years. The post-implementation
engagement of Reality Check will be housed at CREED and will set the platform for mobilization
of the recommendations and land-use strategies that evolve from the Reality Check event.
In addition, CREED, in partnership with the College of Business and Public Administration, will
launch the Commercial Real Estate Institute (CREI) in the spring of 2012. This week-long
instructional program will offer commercial real estate practitioners the opportunity to earn
continuing education credits by completing courses in CCIM foundations, Excel and Real Estate
Financial Analysis, and Ethics and Leadership.
Fall 2012 will bring the 1st Annual CREED Tennis Pro-Am back to Old Dominion University. This
exciting networking event sold out in 2011 and generated some friendly industry competition.
CREED will also host the 2012 Hampton Roads Residential Market Review in November 2012,
so watch for details to be announced later this year.
There are many people to thank for their contributions to this report and the annual market
review. Many writers and speakers make this program such a success. Of course, a special thank
you to all the volunteers within the real estate and economic development community for providing
their expertise and sharing their data. None of this is possible without your commitment.
In closing, please note that we have changed the way we present some of our information.
Every effort is made to provide the most accurate information in these reports. If you find an
error, or have a suggestion on how to improve upon these reports, please contact me with
comments.
Your continued support is truly appreciated.
John R. Lombard, Ph.D.
John R. Lombard, Ph.D.Associate Professor and Chair | Department of Urban Studies and Public Administration
Director, E. V. Williams Center for Real Estate and Economic Development
Old Dominion University | College of Business and Public Administration | Norfolk, VA 23529-0218
Direct line: (757) 683-4809 Center line: (757) 683-5352

MISSION OF
CREEDThe E.V. Williams Center for Real Estate
and Economic Development (CREED) at
Old Dominion University (ODU) is a
member-based organization that serves
the real estate and economic
development communities. CREED is a
non-profit, non-political organization,
established to serve as a liaison between
ODU and the business community.
CREED supports the real estate and
economic development industry through
the application of research, resources and
continuing education to further land
planning and development initiatives.
CREED also provides an accessible,
interactive, and innovative portal for ODU
students to interact with leading industry
partners in the public and private sectors.
For membership information, contact
CREED Program Manager, Kyllie Brinkley,
757.683.5352, [email protected]
62012 Hampton Roads Real Estate Market Review
Executive Committee
Chair ............................................... Stephanie Sanker
Director............................................ John Lombard
Sponsorship Chair .......................... Candi James
Publications Chair ........................... Brian Dundon
Membership Chair .......................... Craig Cope
Curriculum Co-Chairs........................ Jon Crunkleton
.................................................... Brad Sanford
By-Laws Chair .................................. Andrew Keeney
Past Chair........................................ Brad Sanford
At-Large ........................................... Billy King
.................................................... Tom Dillon
CREED Program Manager.................Kyllie Brinkley
Market Review Committee
Industrial............................... William C. Throne and
......................................... Stephanie Sanker
Office.................................... Casey J. O'Hearn
Retail .................................... David Machupa, Kyllie Brinkley
......................................... and David Chapmin
Multi-family............................ Charles Dalton/Real Data
Residential............................ Ron Wildermuth, Blair Hardesty,
James Pritchard and Van Rose
Capital Markets & Real
Estate Finance ...................... Victor L. Pickett
THE 2012 OFFICERS AND MEMBERS OF CREED ARE AS FOLLOWS:
Research/Editorial Committee
Kyllie Brinkley
David Chapman
Albert Duncan
Brian Dundon
Nancy Gossett Dove
Elizabeth Hancock
Janice Hurley
Joy Learn
John Lombard
Maureen Rooks
Brad Sanford
Lane Shea
Kristi Sutphin
To obtain additional copies of this report, please goto our website: www.odu.edu/creed
Send to:Kyllie Brinkley Program ManagerE. V. Williams Center for Real Estateand Economic DevelopmentOld Dominion University2088 Constant HallNorfolk, VA 23529
Telephone: (757) 683-5352
E-Mail: [email protected]
7

82012 Hampton Roads Real Estate Market Review
Honorary MemberRobert M. Stanton, CSM and CPMStanton Partners, Inc.
Jeff AinslieAinslie Group
G. Robert Aston, Jr.TowneBank
Ramon W. Breeden, Jr.The Breeden Company
Sanford (Sandy) M. CohenDivaris Real Estate, Inc.
Craig CopeLiberty Property Trust
Cecil V. CutchinsOlympia Development Corporation
Robert L. DeweyWillcox & Savage, PC
Thomas M. DillonFulton Bank
N. Joseph Dreps BB&T
Pamela J. FaberLeClair Ryan
Joel T. Flax, CPADixon Hughes Goodman LLP
David M. GianascoliGee’s Group Real Estate Development
John L. Gibson, IIIEllis-Gibson DevelopmentGroup
Warren HarrisCity of Virginia Beach Economic Development
Miles B. LeonS. L. Nusbaum Realty Company
Michael W. McCabeHarvey Lindsay CommercialReal Estate
I N D U S T R Y P R O F E S S I O N A L A D V
T H A N K Y O U 2 0 1 2 S P O N S O R S
2012 Market ReviewReception Sponsor
9
Michael NewsomeClark Whitehill Enterprises, Inc.
Harrison J. PerrinePerrine Investments
Don Perry Continental Development
Victor L. PickettGrandbridge Real Estate Capital, LLC
Thomas E. RobinsonRobinson Development Group
Jim V. RoseRose & Womble Realty Co., LLC
Bradley R. Sanford, MAIDominion Realty Advisors
Burrell F. SaundersLyall Design Architects
Reese SmithReese Smith & Associates
Tony SmithRobinson Development Group
Deborah K. Stearns, CPM, SIORHarvey Lindsay CommercialReal Estate
Richard ThurmondWilliam E. Wood & Associates
Jon S. WheelerWheeler Interests
Robert T. WilliamsTri City Developers, LLC
Steven WrightCity of Chesapeake Economic Development
I S O R S T O T H E C E N T E R ( I P A C )
J. Scott AdamsCB Richard Ellis|Hampton Roads
Tom AthertonAtherton Real Estate Development
Judy BooneJudy Boone Realty
Stewart Buckle, IIThe Morgan Real Estate Group
M. Albert CarmichaelHarvey Lindsay CommercialReal Estate
W. Page CockrellHurt & Proffitt
David CollierFirst Atlantic Restoration
Lawrence J. Colorito, Jr., MAIAxial Advisory Group, LLC
Hahns L. CopelandDARVA Group LLC
Ann K. CrenshawKaufman & Canoles, P.C.
Don Crigger, CCIMCB Richard Ellis of Virginia, Inc.
Jon R. Crunkleton, Ph.D.Old Dominion University
Kim CurtisTidewater Home Funding
William G. DardenHearndon Construction Co.
Laura B. de GraafBank of America Merrill Lynch
Michael DivarisDivaris Real Estate, Inc.
Helen DragasThe Dragas Companies
Brian DundonDundon & Associates
Tom ElderHampton Roads EconomicDevelopment Alliance
Sandra FerebeeGSH Residential Sales
Bart Frye, Jr.Frye Properties, Inc.
Brian E. Gordineer, A.A.SCity of Hampton, Office of the Assessor
Howard E. GordonWilliams Mullen
Dennis W. GruelleAppraisal Consultation Group
Elizabeth O. HancockOffice of Real Estate Assessor, Norfolk
Russell G. Hanson, Jr.Hanson Capital, LLC
Carl HardeeLawson Realty Corporation
John HarryJohn C. Harry, Inc.
Dorcas T. Helfant-BrowningDTH Properties, LLC
Charles HutchisonVanasse Hangen Brustlin, Inc.
Michael A. InmanInman & Strickler, P.L.C.
Candi JamesHBA Architecture & Interior Design, Inc.
Cherie JamesCherie James, CPA
Terry JohnsonAbbitt Realty
Mallory KahlerCity of Portsmouth Economic Development
E. Andrew KeeneyKaufman & Canoles, P.C.
R. I. King, IICushman & Wakefield |THALHIMER
William E. King, SIORHarvey Lindsay Commercial Real Estate
April KoleszarKoleszar Properties, Inc.
Barry M. KornblauSummit Realty Group, Inc.
Tyler LeinbachMeredith Construction Company
CREED COUNCIL MEMBERS
102012 Hampton Roads Real Estate Market Review
John R. (Jack) Lewis, IIECS Mid-Atlantic, LLC
Harvey Lindsay, Jr.Harvey Lindsay Commercial Real Estate
Jeffrey R. MackThe CIM Group
M. B. Mike Mausteller, Jr.Harvey Lindsay Commercial RealEstate
G. Cliff MooreVirtexco Corporation
Michael NiceGeorge Nice and Sons, Inc.
Thomas O’GradyClancy & Theys Construction
James N. Owens, CCIMHarvey Lindsay Commercial Real Estate
Robert L. Philips, Jr.Cushman & Wakefield|THALHIMER
Chris ReadCB Richard Ellis|Hampton Roads
F. Craig ReadRead Commercial Properties
Worth RemickCB Richard Ellis|Hampton Roads
John C. Richards, Jr.CB Richard Ellis/Melody & Co.
Rennie RichardsonRichardson Real Estate Corporation
Charles E. Rigney, Sr.City of Norfolk Department ofDevelopment
Maureen G. RooksJones Lang LaSalle
J. Randy Royal Kimley-Horn and Associates
Robert J. RuhlCity of Virginia BeachEconomic Development
Stephanie Sanker, SIOR, CCIMS.L. Nusbaum Realty Co.
Robert M. Sherman III, CPMHarrison & Lear, Inc.
Kenneth Sisk, P.E.Bowman Consulting Group
Anthony W. SmithRobinson Development Group
Robert M. StantonStanton Partners, Inc.
Jeremy R. StarkeyMonarch Bank Commercial Real Estate Finance/Monarch Capital, LLC
Daniel R. StegallDaniel Richard Stegall, A Professional Law Corporation
Terrie L. SuitThe Office of Commonwealth Preparedness
Leo SuttonEXIT Realty CentralCommercial
Michael SykesBank of Hampton Roads
Robert M. Thornton, CRE, CCIM, SIORCushman & Wakefield|THALHIMER
William C. Throne, SIOR, CCIM, ALCCushman & Wakefield|THALHIMER
Jamie TollenaereMcKenzie Construction Corporation
Stewart Tyler, ASARight of Way Acquisitions & Appraisals
George D. Vick, IIIHarvey Lindsay Commercial Real Estate
Edward W. WareNorfolk Redevelopment and Housing
H. Mac Weaver, IIWells Fargo Real Estate Group
Edward M. WilliamsWilliam E. Wood & Associates
F. Blair WimbushNorfolk Southern Corporation
Peter E. Winters, Jr.Bank of Hampton Roads
Chris WoodJD & W
John P. Wright Waverton Associates
Michael P. Zarpas Global Real Estate Investment Inc.
11

122012 Hampton Roads Real Estate Market Review
13
Author David Machupa
Cushman & Wakefield | THALHIMER
Survey Collection Kyllie Brinkley
E.V. Williams Center for Real Estate and Economic Development
Old Dominion University
Data Analysis/ David Chapman
Layout Old Dominion University
Financial The E. V. Williams Center for Real Estate and Economic Support Development (CREED) functions and reports are funded by
donations from the CREED IPAC and Council Advisory Boards, organizations, and individuals.
Disclosure The data used for this report are deemed reliable; however, neither Old Dominion University, the E. V. Williams Center for Real Estate and Economic Development, nor sponsoring companiesand/or individuals makes any representation or warranty as to itsaccuracy.
20
12
RE
TAIL
H A M P T O N
R O A D S
M A R K E T
R E V I E W
RETAIL
142012 Hampton Roads Real Estate Market Review
This survey gathered information about strip shopping centers and regional malls located in the Hampton Roads MSA thatwere generally 30,000 square feet in size or larger. Additionally, information on retail-oriented freestanding buildings atleast 23,000 square feet and freestanding buildings that contained furniture stores, discounters, grocery stores or categorykiller retailers that met the established size criteria were included in the survey.
Automotive uses and buildings containing “downtown storefronts” were not included. Although available retail space in manysubmarkets (e.g. Ghent) is best described as a collection of small specialty shops, storefronts or freestanding buildings,practical limitations dictated that the focus of the survey be on larger product types.
The survey data was collected between October 2011 and January 2012. Questionnaires were mailed to owners, leasingagents and property managers responsible for retail properties meeting the selection criteria. Direct contact was utilizedas a follow-up to the mailing to encourage participation. Information on square footage for freestanding buildings wasobtained from building owners, tax records, store managers and retail real estate representatives. Sales information wasobtained from property owners, real estate agents, appraisers and real estate assessors.
METHODOLOGY
2012 R E T A I L
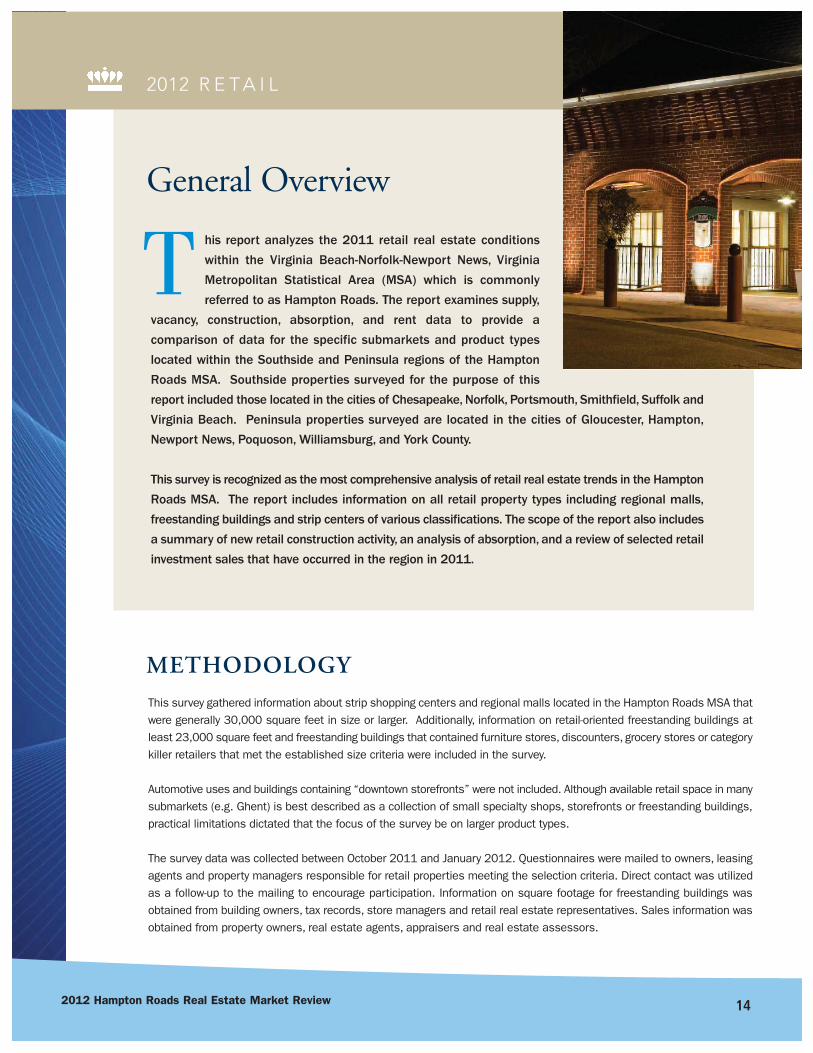
his report analyzes the 2011 retail real estate conditions
within the Virginia Beach-Norfolk-Newport News, Virginia
Metropolitan Statistical Area (MSA) which is commonly
referred to as Hampton Roads. The report examines supply,
vacancy, construction, absorption, and rent data to provide a
comparison of data for the specific submarkets and product types
located within the Southside and Peninsula regions of the Hampton
Roads MSA. Southside properties surveyed for the purpose of this
report included those located in the cities of Chesapeake, Norfolk, Portsmouth, Smithfield, Suffolk and
Virginia Beach. Peninsula properties surveyed are located in the cities of Gloucester, Hampton,
Newport News, Poquoson, Williamsburg, and York County.
This survey is recognized as the most comprehensive analysis of retail real estate trends in the Hampton
Roads MSA. The report includes information on all retail property types including regional malls,
freestanding buildings and strip centers of various classifications. The scope of the report also includes
a summary of new retail construction activity, an analysis of absorption, and a review of selected retail
investment sales that have occurred in the region in 2011.
General Overview
T

20
12
RE
TAIL
15
DEFINITIONS OF TERMSAsking Rates: The market rate per square foot of a retail property (excluding freestandingbuildings and malls), exclusive of additional rents that may be paid under a triple net lease.Interpretation of average retail rates in different product types and submarkets should beviewed cautiously given the tremendous variability in rates for like products and for prop-erties located within the same submarket. Factors such as visibility, co-tenancy and acces-sibility are some of the many sources of variation in market rates which should be con-sidered.
Big Boxes: Contiguous retail space that is at least 23,000 square feet and located in anyone of the identified product types. Retailers occupying big boxes include, but are not lim-ited to, the following: category killers, specialty stores, discounters, furniture stores, gro-cery stores and theaters. Bowling alleys, automotive uses, roller rinks and ice-skating rinkswere not included.-
CAM: Common Area Maintenance
Product Types: Properties were classified according to one of the following nine retail product types. The International Council ofShopping Centers defined the first six categories. Three additional categories were included to accurately categorize theremaining properties.
Neighborhood Center 30,000 to 150,000 square feet; supermarket anchored
Community Center 100,000 to 350,000 square feet; discount department store, supermarket or drug store anchored
Fashion/Specialty Center 80,000 to 250,000 square feet; fashion anchored
Power Center 250,000 to 600,000 square feet; category killer, home improvement and discount department store anchored
Theme Festival Center 80,000 to 250,000 square feet; restaurants, entertainment anchored
Outlet Center 50,000 to 400,000 square feet; manufacturer’s outlet store anchored
Freestanding Individual building not considered a shopping center
Mall Shopping center with area designed for pedestrian use only
Other Any center that does not fit into a typical category
Regional Mall Node: Submarket anchored by regional mall.
Small Shop: In-line retail space usually less than 10,000 square feet located in a multi-tenanted shopping center.
Submarkets: Hampton Roads is divided into 35 retail submarkets (25 Southside submarkets and 10 Peninsula submarkets)which reflected general concentrations, pockets or corridors of retail product type. Geographical boundaries of the retail sub-markets were influenced by density of existing retail product, physical or geographical obstacles, existing transportation net-works, municipal boundaries, population concentrations and retailers’ perceptions of the MSA. Final determination of specif-ic boundaries of each submarket was made by a subcommittee of retail real estate professionals who are actively involved inthe MSA. Also highlighted were specific submarkets that are anchored by regional malls. A map which identifies the generallocation of each submarket is included in the centerfold of this report.
Triple Net Lease: Type of lease under which a tenant pays its pro-rata share of real estate taxes, insurance and common areamaintenance.
162012 Hampton Roads Real Estate Market Review
2012 R E T A I L
Gradual recovery, which has been the mantra on a local and national level, is exactly what the Hampton Roads retail marketis experiencing. As 2010 came to a close, we were hopeful that the worst had come to pass. Market watchers werewitnessing vacancy rates decreasing in conjunction with decreasing rental rates along with an increase in retail tenantactivity. Lenders had not opened the purse strings to the extent of years past, but obtaining financing, while still difficult,was less difficult than the prior year. Overall, 2011 brought us less than what we hoped for, but exactly what we expected,a gradual recovery.
What we saw in 2011 was increased activity from various mid-size and big box users. This new development speaks wellas to the direction of the market. On the Southside, Harris Teeter is under construction in Portsmouth, Target is underconstruction behind Pembroke Mall in Virginia Beach, Dicks Sporting Goods opened in northern Suffolk, Cinemark openeda 40,000 sf theater in the Chesapeake Square, and Wal-Mart opened in the Edinburgh area of Chesapeake. The Peninsulasaw The Fresh Market relocate and open a location in Williamsburg. We are hearing of and seeing additional grocery storeactivity in the entire Hampton Roads market. The Neighborhood Market, a Wal-Mart concept, has purchased multiple sitesin Hampton Roads this past year. The fact that the grocery stores are touring and evaluating opportunities is anothervalidation of the stability of Hampton Roads. The highlight of the past year was confirmation that Hampton Roads willwelcome it first Whole Foods as they open in Virginia Beach in 2012.
Concerning the small space users, we can say the bedding industry is alive and well in Hampton Roads as The MattressFirm and Sleepy’s have aggressively expanded this past year. Blockbuster continues to close stores and many have beenor are in the process of being repositioned. The fast casual users such as Panera Bread and Chipotle remain active. Themobile phone industry continues to drive retail locations with Verizon Wireless and Ntelos having opened new stores in2011. The market has also seen the frozen yogurt retailers expanding. If you need coffee, you need not look far. Starbuckshas two stores under construction, Dunkin Donuts has one location under construction in Virginia Beach, while KrispyKreme opened two stores and is looking for additional sites.
As in years past, we have seen a culling of the retail herd. Not indicative of the Hampton Roads market, A.J. Wright andBorders closed all locations nationwide. Total Wine and Beverage quickly expanded into the former Borders in the Hilltopsubmarket of Virginia Beach. Many of the A.J. Wright locations were converted to Marshalls or leased by other tenants.Market watchers are keeping a keen eye on Sears and Kmart as these companies are starting to close stores and havebeen unsuccessful in implementing merchandising plans that will attract customers. Sears has announced plans to closeits Norfolk location in 2012. Sears owns many of their sites; therefore, these sites may generate prime redevelopmentopportunities in the future.
Retail investment sales continue to be few and far between. The logjam of lender owned property that is constantlydiscussed has not hit the market. What we have seen this past year is a new way for lenders to deal with troubled assets.Rather than work through the foreclosure process, we have seen lenders sell the loan/note to investors enabling them toremove the non-performing loans from the books.
Overall, the Hampton Roads retail market remains stable and continues to gradually improve. The increased port activity,the stabilizing military presence, and increased consumer confidence has led to increased tenant activity in our market.Provided fuel pricing does not reach a level that seriously impacts consumers’ disposable income, we should see 2012outperform 2011 just as 2011 outperformed 2010.
YEAR IN REVIEW
20
12
RE
TAIL
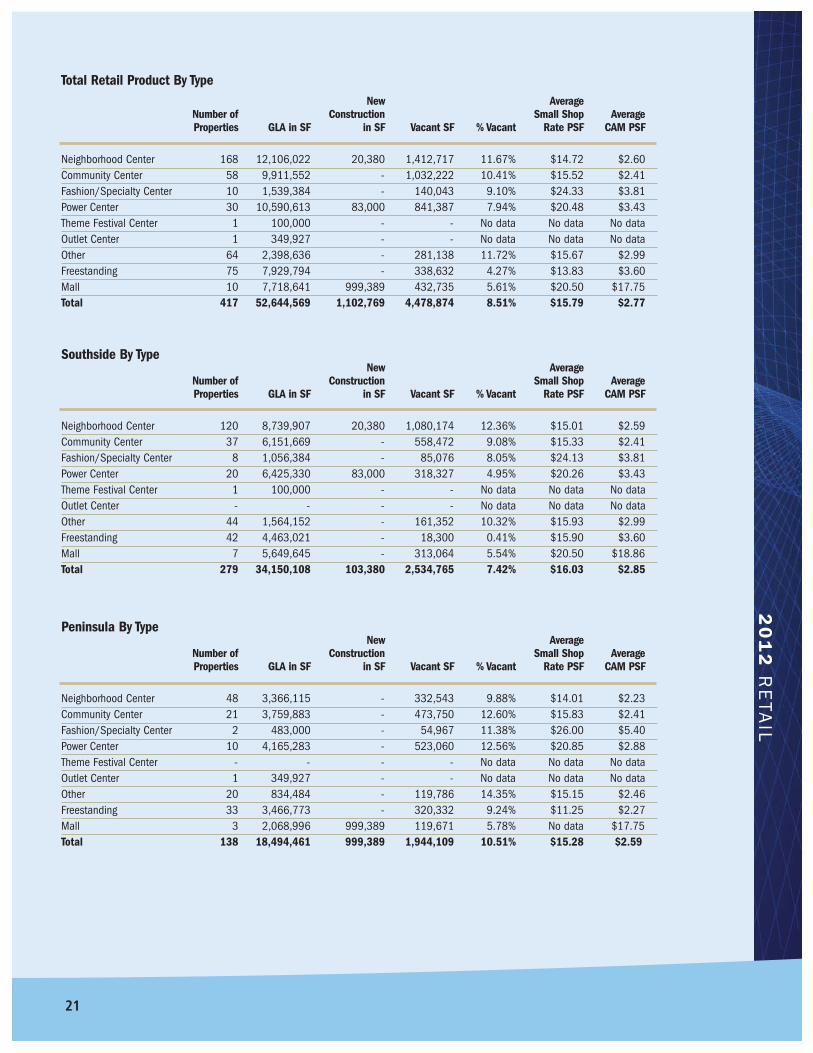
The Hampton Roads retail market containedapproximately 52,644,569 square feet ofgross leasable area (“GLA”) in 417properties with an average asking rental rateof $15.79 triple net. The US Census Bureauindicates the population of the Hampton
Roads MSA is approximately 1.7million resulting in a 32.30 squarefeet of retail supply per person.Certain methodological differencesin this survey (e.g. the inclusion offreestanding buildings and malls)make it difficult to compare percapita supply in the MSA to anational average statistic.
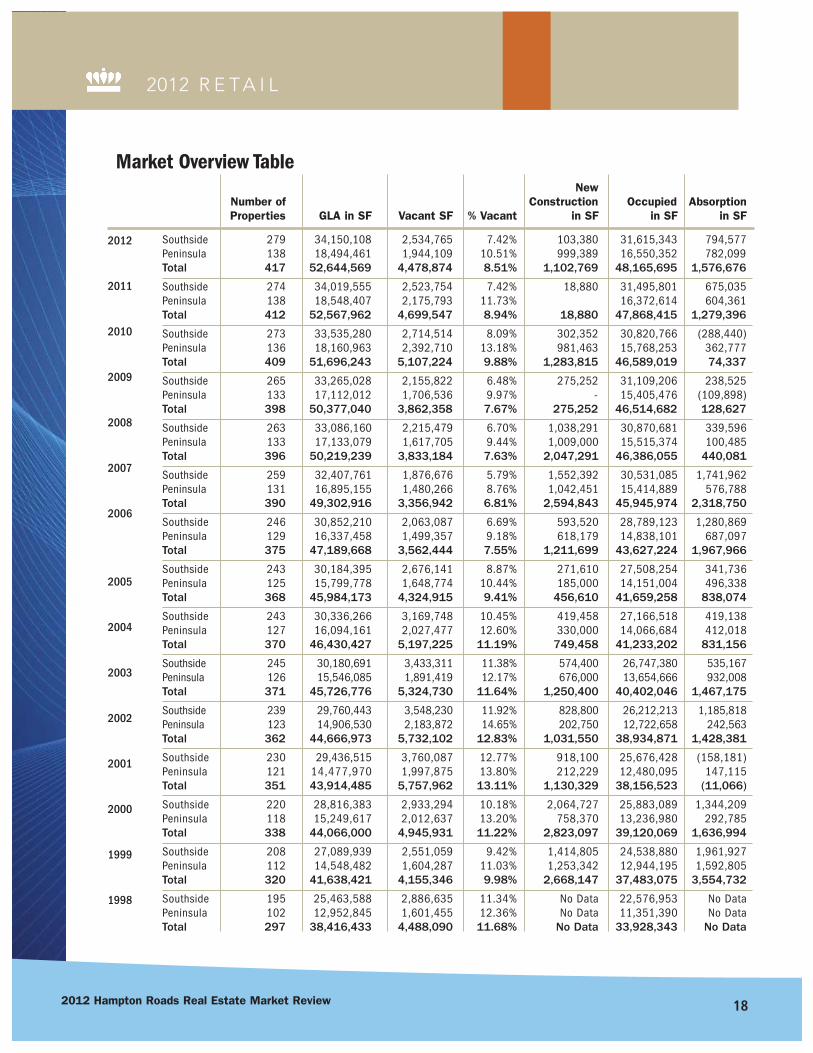
Hampton Roads consists of two markets, the Southside and Peninsula. The Southside market has approximately34,150,108 square feet, roughly 66% of the total square footage in the market, in 279 properties. The average askingrent for small shop space increased ever so slightly $.03 over 2010 numbers to $16.03 triple net. The increase in rentalrates had little effect on the overall vacancy rate for Hampton Roads as the vacancy rate remained stable at 7.42%. In2011, there was 103,380 square feet of projects built on the Southside this past year.
The Peninsula also experienced some mixed change this past year. The 138 properties on the Peninsula that weresurveyed combined for 18,494,461 square feet of product. The average asking price of small shop space decreased by$.37 to $15.28 per square foot triple net, this reduced rate help drive absorption and we saw a greater decrease in thevacancy rate on the Peninsula. The vacancy rate dropped 1.22% to 10.51% and interest remains very strong for selectsubmarkets. Despite previous over development in the Williamsburg submarket, we did welcome Food Lion and a relocationof The Fresh Market to the area. A positive indicator is that the former Fresh Market location has been back filled.
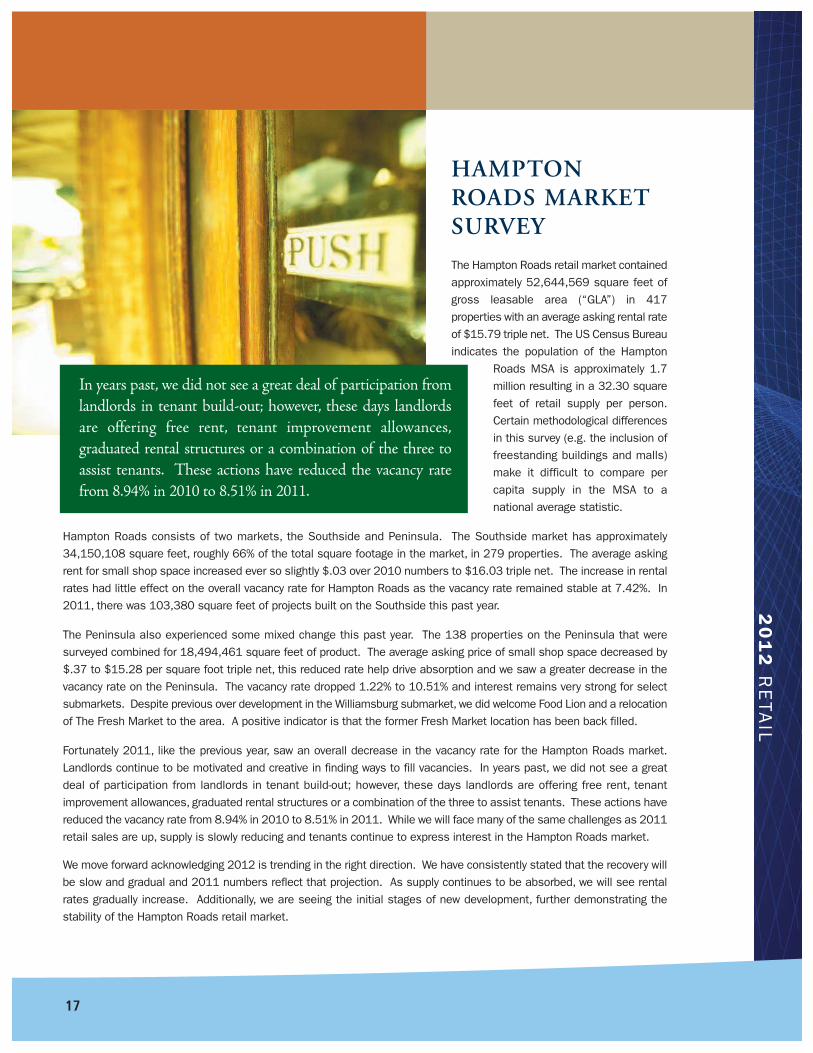
Fortunately 2011, like the previous year, saw an overall decrease in the vacancy rate for the Hampton Roads market.Landlords continue to be motivated and creative in finding ways to fill vacancies. In years past, we did not see a greatdeal of participation from landlords in tenant build-out; however, these days landlords are offering free rent, tenantimprovement allowances, graduated rental structures or a combination of the three to assist tenants. These actions havereduced the vacancy rate from 8.94% in 2010 to 8.51% in 2011. While we will face many of the same challenges as 2011retail sales are up, supply is slowly reducing and tenants continue to express interest in the Hampton Roads market.
We move forward acknowledging 2012 is trending in the right direction. We have consistently stated that the recovery willbe slow and gradual and 2011 numbers reflect that projection. As supply continues to be absorbed, we will see rentalrates gradually increase. Additionally, we are seeing the initial stages of new development, further demonstrating thestability of the Hampton Roads retail market.
HAMPTONROADS MARKETSURVEY
In years past, we did not see a great deal of participation fromlandlords in tenant build-out; however, these days landlordsare offering free rent, tenant improvement allowances, graduated rental structures or a combination of the three toassist tenants. These actions have reduced the vacancy ratefrom 8.94% in 2010 to 8.51% in 2011.
17
182012 Hampton Roads Real Estate Market Review
2012 R E T A I L
2012
2011
2010
2009
2008
2007
2006
2005
2004
2003
2002
2001
2000
1999
1998
Market Overview TableNew
Number of Construction Occupied AbsorptionProperties GLA in SF Vacant SF % Vacant in SF in SF in SF
Southside 279 34,150,108 2,534,765 7.42% 103,380 31,615,343 794,577 Peninsula 138 18,494,461 1,944,109 10.51% 999,389 16,550,352 782,099 Total 417 52,644,569 4,478,874 8.51% 1,102,769 48,165,695 1,576,676
Southside 274 34,019,555 2,523,754 7.42% 18,880 31,495,801 675,035 Peninsula 138 18,548,407 2,175,793 11.73% 16,372,614 604,361 Total 412 52,567,962 4,699,547 8.94% 18,880 47,868,415 1,279,396
Southside 273 33,535,280 2,714,514 8.09% 302,352 30,820,766 (288,440)Peninsula 136 18,160,963 2,392,710 13.18% 981,463 15,768,253 362,777 Total 409 51,696,243 5,107,224 9.88% 1,283,815 46,589,019 74,337
Southside 265 33,265,028 2,155,822 6.48% 275,252 31,109,206 238,525 Peninsula 133 17,112,012 1,706,536 9.97% - 15,405,476 (109,898)Total 398 50,377,040 3,862,358 7.67% 275,252 46,514,682 128,627
Southside 263 33,086,160 2,215,479 6.70% 1,038,291 30,870,681 339,596Peninsula 133 17,133,079 1,617,705 9.44% 1,009,000 15,515,374 100,485Total 396 50,219,239 3,833,184 7.63% 2,047,291 46,386,055 440,081
Southside 259 32,407,761 1,876,676 5.79% 1,552,392 30,531,085 1,741,962Peninsula 131 16,895,155 1,480,266 8.76% 1,042,451 15,414,889 576,788Total 390 49,302,916 3,356,942 6.81% 2,594,843 45,945,974 2,318,750
Southside 246 30,852,210 2,063,087 6.69% 593,520 28,789,123 1,280,869Peninsula 129 16,337,458 1,499,357 9.18% 618,179 14,838,101 687,097Total 375 47,189,668 3,562,444 7.55% 1,211,699 43,627,224 1,967,966
Southside 243 30,184,395 2,676,141 8.87% 271,610 27,508,254 341,736Peninsula 125 15,799,778 1,648,774 10.44% 185,000 14,151,004 496,338Total 368 45,984,173 4,324,915 9.41% 456,610 41,659,258 838,074
Southside 243 30,336,266 3,169,748 10.45% 419,458 27,166,518 419,138Peninsula 127 16,094,161 2,027,477 12.60% 330,000 14,066,684 412,018Total 370 46,430,427 5,197,225 11.19% 749,458 41,233,202 831,156
Southside 245 30,180,691 3,433,311 11.38% 574,400 26,747,380 535,167Peninsula 126 15,546,085 1,891,419 12.17% 676,000 13,654,666 932,008Total 371 45,726,776 5,324,730 11.64% 1,250,400 40,402,046 1,467,175
Southside 239 29,760,443 3,548,230 11.92% 828,800 26,212,213 1,185,818Peninsula 123 14,906,530 2,183,872 14.65% 202,750 12,722,658 242,563Total 362 44,666,973 5,732,102 12.83% 1,031,550 38,934,871 1,428,381
Southside 230 29,436,515 3,760,087 12.77% 918,100 25,676,428 (158,181)Peninsula 121 14,477,970 1,997,875 13.80% 212,229 12,480,095 147,115Total 351 43,914,485 5,757,962 13.11% 1,130,329 38,156,523 (11,066)
Southside 220 28,816,383 2,933,294 10.18% 2,064,727 25,883,089 1,344,209Peninsula 118 15,249,617 2,012,637 13.20% 758,370 13,236,980 292,785Total 338 44,066,000 4,945,931 11.22% 2,823,097 39,120,069 1,636,994
Southside 208 27,089,939 2,551,059 9.42% 1,414,805 24,538,880 1,961,927Peninsula 112 14,548,482 1,604,287 11.03% 1,253,342 12,944,195 1,592,805Total 320 41,638,421 4,155,346 9.98% 2,668,147 37,483,075 3,554,732
Southside 195 25,463,588 2,886,635 11.34% No Data 22,576,953 No DataPeninsula 102 12,952,845 1,601,455 12.36% No Data 11,351,390 No DataTotal 297 38,416,433 4,488,090 11.68% No Data 33,928,343 No Data
20
12
RE
TAIL
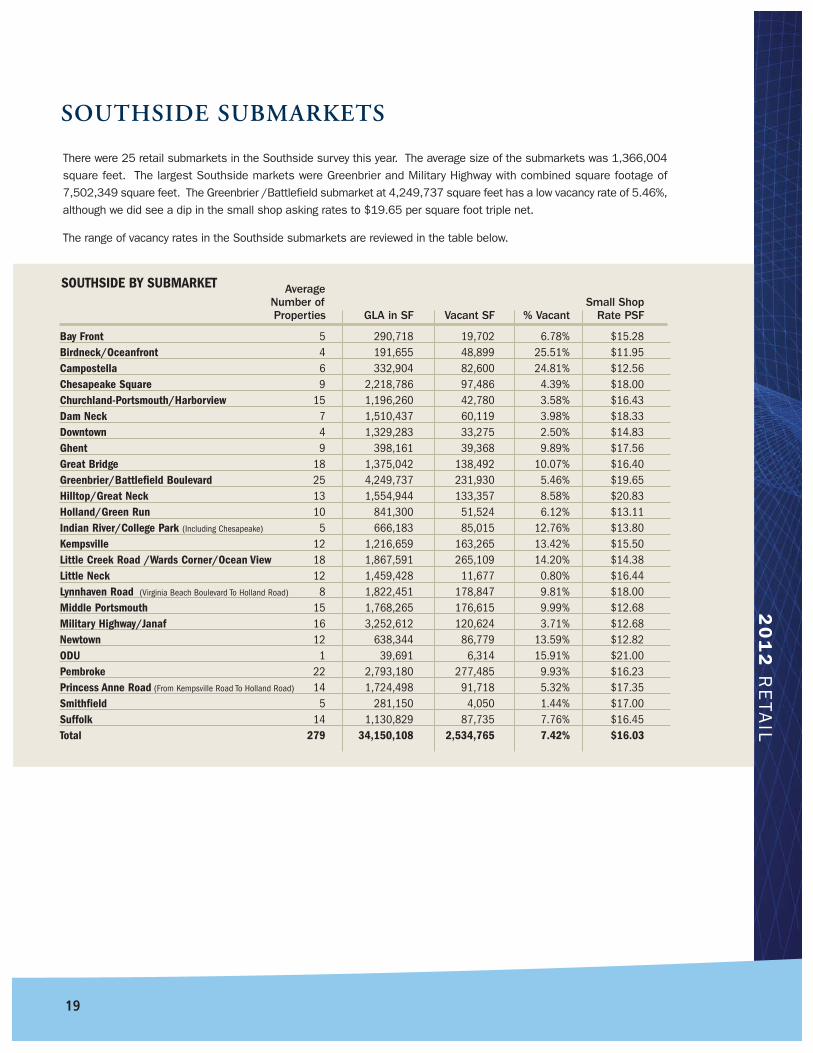
There were 25 retail submarkets in the Southside survey this year. The average size of the submarkets was 1,366,004square feet. The largest Southside markets were Greenbrier and Military Highway with combined square footage of7,502,349 square feet. The Greenbrier /Battlefield submarket at 4,249,737 square feet has a low vacancy rate of 5.46%,although we did see a dip in the small shop asking rates to $19.65 per square foot triple net.
The range of vacancy rates in the Southside submarkets are reviewed in the table below.
SOUTHSIDE SUBMARKETS
Average Number of Small ShopProperties GLA in SF Vacant SF % Vacant Rate PSF
Bay Front 5 290,718 19,702 6.78% $15.28 Birdneck/Oceanfront 4 191,655 48,899 25.51% $11.95 Campostella 6 332,904 82,600 24.81% $12.56 Chesapeake Square 9 2,218,786 97,486 4.39% $18.00 Churchland-Portsmouth/Harborview 15 1,196,260 42,780 3.58% $16.43 Dam Neck 7 1,510,437 60,119 3.98% $18.33 Downtown 4 1,329,283 33,275 2.50% $14.83 Ghent 9 398,161 39,368 9.89% $17.56 Great Bridge 18 1,375,042 138,492 10.07% $16.40 Greenbrier/Battlefield Boulevard 25 4,249,737 231,930 5.46% $19.65 Hilltop/Great Neck 13 1,554,944 133,357 8.58% $20.83 Holland/Green Run 10 841,300 51,524 6.12% $13.11 Indian River/College Park (Including Chesapeake) 5 666,183 85,015 12.76% $13.80 Kempsville 12 1,216,659 163,265 13.42% $15.50 Little Creek Road /Wards Corner/Ocean View 18 1,867,591 265,109 14.20% $14.38 Little Neck 12 1,459,428 11,677 0.80% $16.44 Lynnhaven Road (Virginia Beach Boulevard To Holland Road) 8 1,822,451 178,847 9.81% $18.00 Middle Portsmouth 15 1,768,265 176,615 9.99% $12.68 Military Highway/Janaf 16 3,252,612 120,624 3.71% $12.68 Newtown 12 638,344 86,779 13.59% $12.82 ODU 1 39,691 6,314 15.91% $21.00 Pembroke 22 2,793,180 277,485 9.93% $16.23 Princess Anne Road (From Kempsville Road To Holland Road) 14 1,724,498 91,718 5.32% $17.35 Smithfield 5 281,150 4,050 1.44% $17.00 Suffolk 14 1,130,829 87,735 7.76% $16.45 Total 279 34,150,108 2,534,765 7.42% $16.03
SOUTHSIDE BY SUBMARKET
19
202012 Hampton Roads Real Estate Market Review
2012 R E T A I L
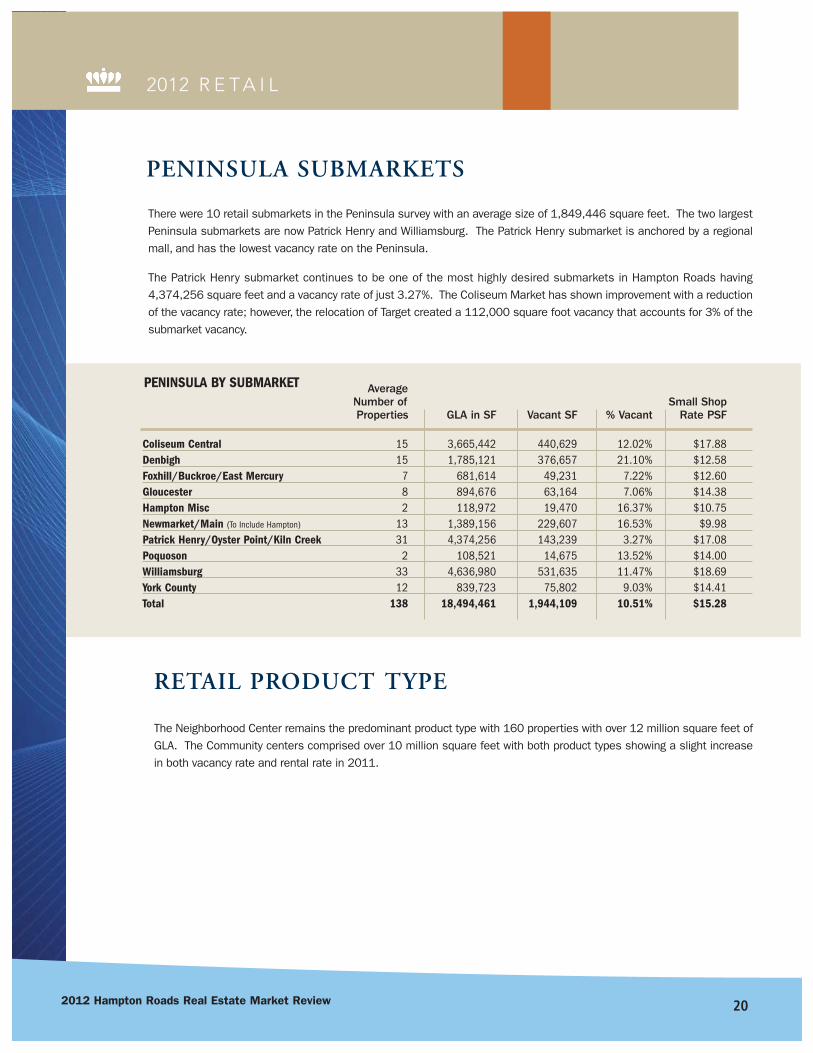
There were 10 retail submarkets in the Peninsula survey with an average size of 1,849,446 square feet. The two largestPeninsula submarkets are now Patrick Henry and Williamsburg. The Patrick Henry submarket is anchored by a regionalmall, and has the lowest vacancy rate on the Peninsula.
The Patrick Henry submarket continues to be one of the most highly desired submarkets in Hampton Roads having4,374,256 square feet and a vacancy rate of just 3.27%. The Coliseum Market has shown improvement with a reductionof the vacancy rate; however, the relocation of Target created a 112,000 square foot vacancy that accounts for 3% of thesubmarket vacancy.
PENINSULA SUBMARKETS
RETAIL PRODUCT TYPE
The Neighborhood Center remains the predominant product type with 160 properties with over 12 million square feet ofGLA. The Community centers comprised over 10 million square feet with both product types showing a slight increasein both vacancy rate and rental rate in 2011.
Average Number of Small ShopProperties GLA in SF Vacant SF % Vacant Rate PSF
Coliseum Central 15 3,665,442 440,629 12.02% $17.88 Denbigh 15 1,785,121 376,657 21.10% $12.58 Foxhill/Buckroe/East Mercury 7 681,614 49,231 7.22% $12.60 Gloucester 8 894,676 63,164 7.06% $14.38 Hampton Misc 2 118,972 19,470 16.37% $10.75 Newmarket/Main (To Include Hampton) 13 1,389,156 229,607 16.53% $9.98 Patrick Henry/Oyster Point/Kiln Creek 31 4,374,256 143,239 3.27% $17.08 Poquoson 2 108,521 14,675 13.52% $14.00 Williamsburg 33 4,636,980 531,635 11.47% $18.69 York County 12 839,723 75,802 9.03% $14.41 Total 138 18,494,461 1,944,109 10.51% $15.28
PENINSULA BY SUBMARKET
20
12
RE
TAIL
New AverageNumber of Construction Small Shop Average Properties GLA in SF in SF Vacant SF % Vacant Rate PSF CAM PSF
Neighborhood Center 168 12,106,022 20,380 1,412,717 11.67% $14.72 $2.60 Community Center 58 9,911,552 - 1,032,222 10.41% $15.52 $2.41 Fashion/Specialty Center 10 1,539,384 - 140,043 9.10% $24.33 $3.81 Power Center 30 10,590,613 83,000 841,387 7.94% $20.48 $3.43 Theme Festival Center 1 100,000 - - No data No data No data Outlet Center 1 349,927 - - No data No data No data Other 64 2,398,636 - 281,138 11.72% $15.67 $2.99 Freestanding 75 7,929,794 - 338,632 4.27% $13.83 $3.60 Mall 10 7,718,641 999,389 432,735 5.61% $20.50 $17.75 Total 417 52,644,569 1,102,769 4,478,874 8.51% $15.79 $2.77
New AverageNumber of Construction Small Shop Average Properties GLA in SF in SF Vacant SF % Vacant Rate PSF CAM PSF
Neighborhood Center 120 8,739,907 20,380 1,080,174 12.36% $15.01 $2.59 Community Center 37 6,151,669 - 558,472 9.08% $15.33 $2.41 Fashion/Specialty Center 8 1,056,384 - 85,076 8.05% $24.13 $3.81 Power Center 20 6,425,330 83,000 318,327 4.95% $20.26 $3.43 Theme Festival Center 1 100,000 - - No data No data No dataOutlet Center - - - - No data No data No dataOther 44 1,564,152 - 161,352 10.32% $15.93 $2.99 Freestanding 42 4,463,021 - 18,300 0.41% $15.90 $3.60 Mall 7 5,649,645 - 313,064 5.54% $20.50 $18.86 Total 279 34,150,108 103,380 2,534,765 7.42% $16.03 $2.85
Total Retail Product By Type
Southside By Type
New AverageNumber of Construction Small Shop Average Properties GLA in SF in SF Vacant SF % Vacant Rate PSF CAM PSF
Neighborhood Center 48 3,366,115 - 332,543 9.88% $14.01 $2.23 Community Center 21 3,759,883 - 473,750 12.60% $15.83 $2.41 Fashion/Specialty Center 2 483,000 - 54,967 11.38% $26.00 $5.40 Power Center 10 4,165,283 - 523,060 12.56% $20.85 $2.88 Theme Festival Center - - - - No data No data No data Outlet Center 1 349,927 - - No data No data No data Other 20 834,484 - 119,786 14.35% $15.15 $2.46 Freestanding 33 3,466,773 - 320,332 9.24% $11.25 $2.27 Mall 3 2,068,996 999,389 119,671 5.78% No data $17.75 Total 138 18,494,461 999,389 1,944,109 10.51% $15.28 $2.59
Peninsula By Type
21
222012 Hampton Roads Real Estate Market Review
2012 I N D U S T R I A L
4,000,000
3,500,000
3,000,000
2,500,000
2,000,000
1,500,000
1,000,000
500,000
01999 2000 2001 2002 2003 2004 2005 2006 2007 2008 2009 2010 2011
Vaca
nt S
quar
e Fe
et
SouthsidePeninsulaTOTAL
Big Box Vacancy
BIG BOX VACANCY
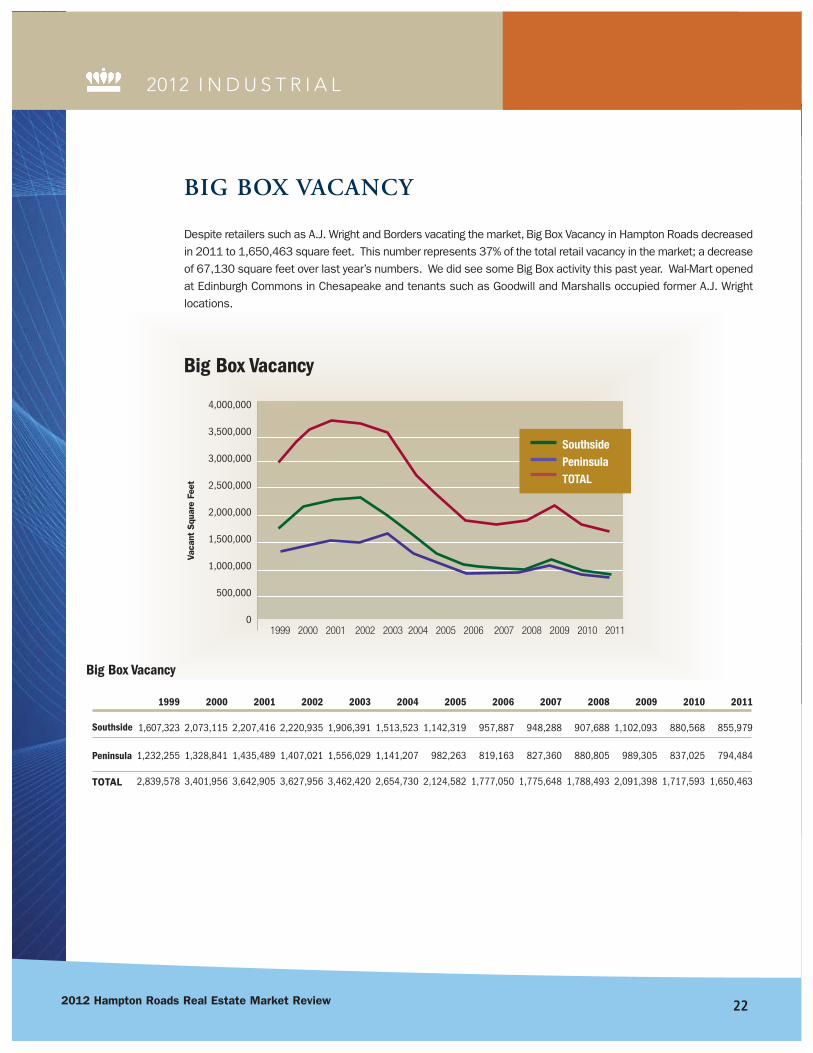
Despite retailers such as A.J. Wright and Borders vacating the market, Big Box Vacancy in Hampton Roads decreasedin 2011 to 1,650,463 square feet. This number represents 37% of the total retail vacancy in the market; a decreaseof 67,130 square feet over last year’s numbers. We did see some Big Box activity this past year. Wal-Mart openedat Edinburgh Commons in Chesapeake and tenants such as Goodwill and Marshalls occupied former A.J. Wrightlocations.
1999 2000 2001 2002 2003 2004 2005 2006 2007 2008 2009 2010 2011
1,607,323 2,073,115 2,207,416 2,220,935 1,906,391 1,513,523 1,142,319 957,887 948,288 907,688 1,102,093 880,568 855,979
1,232,255 1,328,841 1,435,489 1,407,021 1,556,029 1,141,207 982,263 819,163 827,360 880,805 989,305 837,025 794,484
2,839,578 3,401,956 3,642,905 3,627,956 3,462,420 2,654,730 2,124,582 1,777,050 1,775,648 1,788,493 2,091,398 1,717,593 1,650,463
Southside
Peninsula
TOTAL
Big Box Vacancy
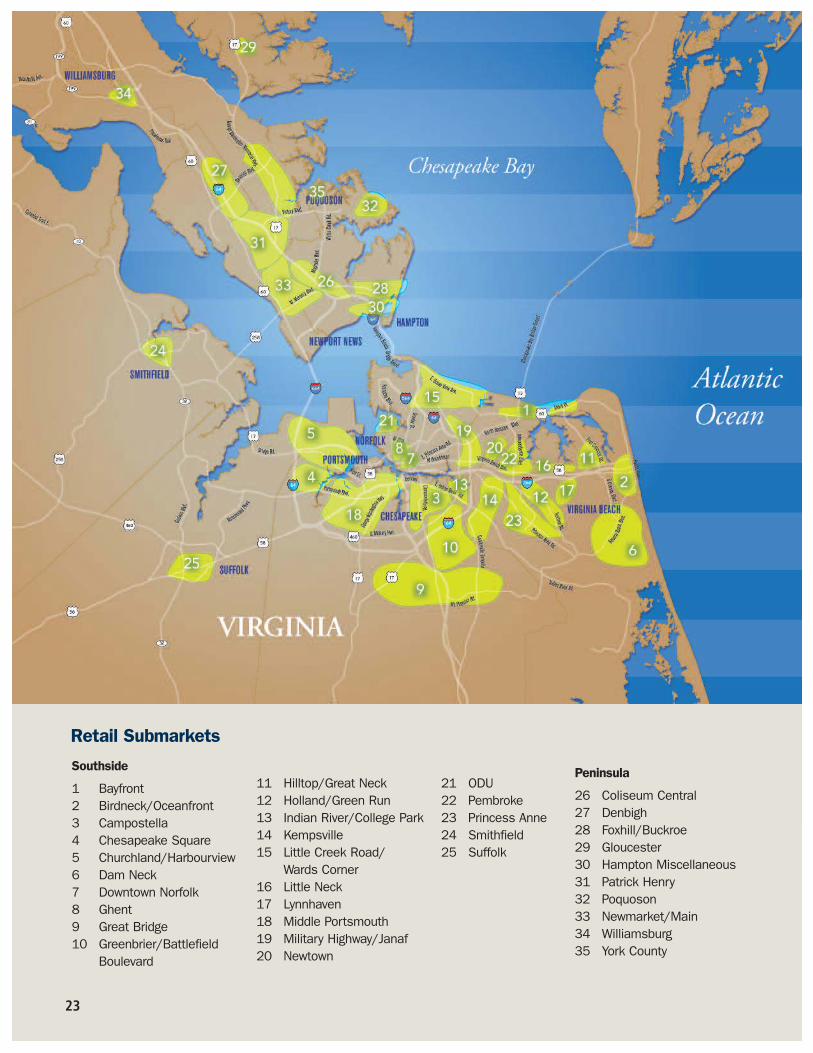
Retail Submarkets
Southside
1 Bayfront2 Birdneck/Oceanfront3 Campostella4 Chesapeake Square 5 Churchland/Harbourview6 Dam Neck7 Downtown Norfolk8 Ghent9 Great Bridge 10 Greenbrier/Battlefield
Boulevard
11 Hilltop/Great Neck 12 Holland/Green Run13 Indian River/College Park14 Kempsville 15 Little Creek Road/
Wards Corner16 Little Neck17 Lynnhaven18 Middle Portsmouth19 Military Highway/Janaf20 Newtown
21 ODU 22 Pembroke 23 Princess Anne 24 Smithfield25 Suffolk
Peninsula
26 Coliseum Central27 Denbigh 28 Foxhill/Buckroe29 Gloucester30 Hampton Miscellaneous31 Patrick Henry32 Poquoson33 Newmarket/Main 34 Williamsburg35 York County
23
SOUTHSIDE
BAY FRONT
Cape Henry Plaza A 58,424
Chic's Beach Shopping Center A 79,397
Kroger H 47,000
Lake Shores Plaza Shopping Center A 58,230
Marina Shores G 47,667
BIRDNECK / OCEANFRONT
Birdneck SC A 65,460
Farm Fresh H 29,296
Harris Teeter H 48,000
Linkhorn Shops A 48,899
CAMPOSTELLA
Atlantic Commons A 63,393
Bainbridge Marketplace A 46,444
Campostella Corner A 43,375
George Washington Commons A 44,942
Holly Point SC A 65,321
Southgate Plaza A 69,429
CHESAPEAKE SQUARE
BJ's H 115,660
Chesapeake Center B 270,602
Chesapeake Square Mall I 800,000
Crossroads Center at Chesapeake Square D 332,464
Food Lion @ Chesp. Sq. H 45,000
Home Depot H 130,060
Lowes H 115,000
Taylor Road Plaza A 60,000
Wal-Mart Supercenter/Sam's Club H 350,000
CHURCHLAND / PORTSMOUTH / HARBOURVIEW
Academy Crossing G 45,483
Churchland Place Shoppes G 21,000
Churchland SC A 149,741
Churchland Square A 72,189
Grand H 30,000
Harbor View Shoppes A 17,000
Harbour View East D 172,000
Harbourview Station East D 217,308
Harbourview Station West D 83,007
Marketcenter at Harbourview A 86,130
Marketplace Square A 12,461
Planet Fitness Plaza A 52,966
Poplar Hill Plaza B 102,326
Sterling Creek A 75,660
Town Point Square A 58,989
DAM NECK
Dam Neck Crossing B 138,571
Dam Neck Square A 67,917
General Booth Plaza A 73,320
Red Mill Commons D 750,000
Red Mill Walk B 240,000
Sandbridge SC A 66,800
Strawbridge Marketplace A 173,829
DOWNTOWN
Berkley Center A 47,945
Church Street Crossing A 51,000
MacArthur Center Mall I 1,100,000
Waterside Festival Marketplace I 130,338
GHENT
201 Twenty One A 15,616
21st Street Pavilion G 21,000
Center Shops A 139,081
Colley Village A 44,585
Ghent Place G 13,000
Harris Teeter H 27,000
Palace Shops I, II C 78,367
Palace Station G 38,000
The Corner Shops G 21,512
GREAT BRIDGE
Cahoon Commons D 278,023
Cedar Lakes Center A 35,659
Centerville Crossing A 50,000
Country Club Shoppes H 17,700
Crossings at Deep Creek A 68,970
Dominion Marketplace A 73,103
Dominion Plaza SC A 63,733
Glenwood Square A 73,859
Great Bridge SC A 156,937
Hanbury Village A 100,560
Harbor Watch Shoppes G 21,505
Las Gaviotas A 82,000
Millwood Plaza G 16,930
Mt. Pleasant Shopping Center A 100,000
Mt. Pleasant Village A 34,180
Wilson Village A 52,500
Woodford Shoppes B 9,760
Woodford Square B 139,623
GREENBRIER / BATTLEFIELD BOULEVARD
Battlefield Marketplace G 30,000
Chesapeake Crossing B 287,679
Country Club Square H 12,600
Crossways Center I & Eden Way Shops D 438,725
Crossways II D 152,686
Edinburgh Commons D 184,232
Edinburgh East D 133,000
Gainsborough Square A 88,862
Greenbrier Mall I 899,665
Greenbrier Market Center D 487,580
Greenbrier South SC A 97,500
Home Depot H 130,060
K-Mart/OfficeMax H 165,000
Knell's Ridge Square G 40,000
Lowes H 114,000
Orchard Square A 88,910
Parkview @ Greenbrier A 83,711
Plantation Woods A 16,800
Regal Cinemas H 60,763
The Shoppes at Greenbrier G 40,000
Towne Place at Greenbrier C 127,109
Village Square G 15,000
Volvo Parkway SC G 41,874
Wal-Mart Way Crossing G 80,160
Wal-Mart/Sam's Club/Kohl's D 433,821
HILLTOP / GREAT NECK
Great Neck Square A 93,887
Great Neck Village A 73,836
Hilltop East C 144,100
Hilltop North B 202,511
Hilltop Plaza B 152,025
Hilltop Square B 220,413
Hilltop West G 60,000
La Promenade C 63,280
Marketplace at Hilltop C 113,000
Mill Dam Crossing A 25,776
Regency Hilltop B 236,549
Renaissance Place G 47,667
Target H 122,000
HOLLAND / GREEN RUN
Auburn Place A 42,709
Chimney Hill B 207,175
Green Run Square A 75,000
Holland Plaza SC A 155,000
Holland Windsor Crossing B 47,400
Lowes H 125,323
Lynnhaven Green A 50,838
Rosemont Center A 1,000
Shipps Corner A 63,355
Timberlake SC A 73,500
INDIAN RIVER / COLLEGE PARK
College Park I & II B 181,902
College Park Square H 183,874
Indian River Plaza B 126,017
Indian River SC A 123,752
Tidewater Plaza A 50,638
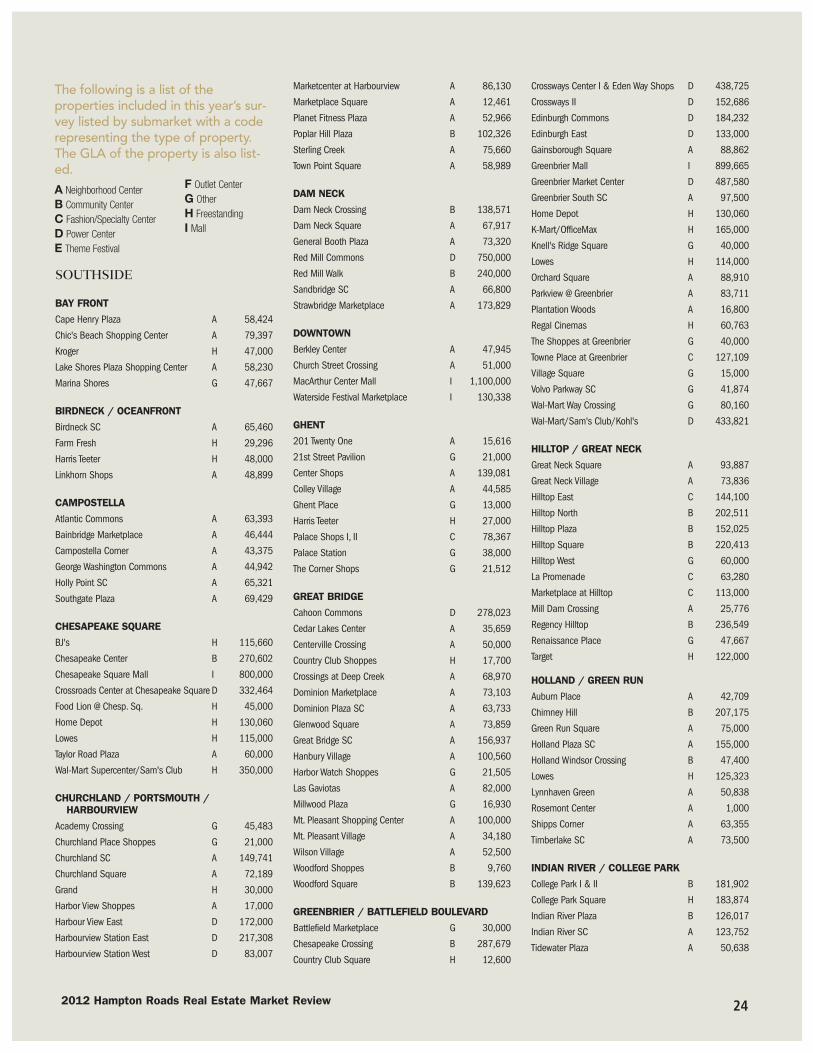
The following is a list of the properties included in this year’s sur-vey listed by submarket with a coderepresenting the type of property.The GLA of the property is also list-ed. A Neighborhood Center B Community Center C Fashion/Specialty Center D Power Center E Theme Festival
F Outlet Center G Other H Freestanding I Mall
242012 Hampton Roads Real Estate Market Review
KEMPSVILLE
Arrowhead Plaza A 97,006
Fairfield SC B 239,763
Kemps Corner Shoppes G 25,929
Kemps River Center A 62,507
Kemps River Crossing B 245,268
Kempsville Crossing A 94,477
Kempsville Plaza A 60,778
Parkway Marketplace A 26,602
Providence Square SC A 135,915
University Shoppes A 26,100
Witchduck Exchange A 50,000
Woods Corner A 152,314
Ames/Kroger B 140,568
Dollar Tree Shopping Center A 51,415
East Beach Marketplace B 202,000
East Beach Shoppes A 63,000
Farm Fresh - Little Creek H 66,000
Glenwood Shoppes A 53,255
Little Creek and Tidewater Shops B 119,820
Little Creek Square A 82,300
Meadowbrook S C G 27,260
Mid-Town A 75,768
Mid-Way SC G 31,000
Ocean View SC A 73,658
Roosevelt Gardens SC A 109,175
Southern Shopping Center B 239,719
Suburban Park B 116,113
Super Wal-Mart H 225,000
Wards Corner Strip A 61,540
Wedgewood SC A 130,000
LITTLE NECK
Birchwood SC A 358,635
Home Depot H 130,060
Kroger H 45,000
London Bridge Plaza B 114,584
Lowes H 160,000
Lynnhaven 2600 A 13,326
Lynnhaven Convenience G 36,900
Lynnhaven Shopping Center B 191,136
Princess Anne Plaza West C 77,558
Regatta Bay Shops G 60,000
Sam's Club Plaza D 248,604
LYNNHAVEN ROAD
Lynnhaven Crossing G 55,550
Lynnhaven East B 97,303
Lynnhaven Mall I 1,293,100
Lynnhaven North B 176,254
Lynnshores Shopping Center G 12,692
Lynnway Place G 30,213
Parkway Plaza G 44,227
Wal-Mart H 113,112
MIDDLE PORTSMOUTH
Afton SC A 106,500
Airline Marketplace A 69,000
Airline Plaza A 99,549
Alexander's Corner Shopping Center A 50,826
Elmhurst Square A 66,250
Gilmerton Square G 43,236
Manor Commerce Center G 67,060
Manor Shops G 14,573
Old Towne Marketplace A 42,000
Rodman SC A 45,000
Super Wal-Mart H 200,000
Triangle SC A 82,430
Victory Crossing D 500,000
Victory West Shopping Center A 167,102
Williams Court B 214,739
MILITARY HIGHWAY / JANAF
3455 Azalea Garden Road A 1,024
Best Square B 140,030
Broad Creek SC D 205,417
Bromley SC A 67,790
CostCo H 110,000
Dump/Mega Office G 115,854
Farm Fresh H 60,000
Food Lion #170 H 41,000
Grand Outlet H 35,000
Janaf D 878,381
Lowes H 115,000
Military Crossing D 192,000
Military Triangle G 10,061
Super K-Mart & Shoppes B 200,000
Super Wal-Mart H 224,513
The Gallery @ Military Circle I 856,542
NEWTOWN
Cypress Plaza SC A 59,012
Cypress Point A 117,958
Diamond Springs North (Shopping Center) A
23,880
Diamond Springs Shoppes H 18,840
Newpointe SC A 92,978
Newtown Baker Crossing A 91,687
Newtown Center G 19,876
Newtown Convenience Center G 19,800
Northampton Business Center G 85,000
Thomas Corner SC G 23,557
Weblin Square G 31,552
Wesleyan Commons Shopping Center A 54,204
ODU
First Floor Retail Shops
at University Village Apartments G 39,691
PEMBROKE
Aragona SC A 69,700
Best Buy H 45,000
Collins Square A 123,870
Columbus Village East A 63,000
Columbus Village Entertainment Center E 100,000
Dean Plaza (Former HQ) D 140,000
Former Bloom Brothers H 165,000
Giant Square B 150,000
Goodwill H 34,000
Haverty's H 55,000
Haygood SC B 178,533
Haynes H 228,000
Hunter's Mill Shoppes G 22,827
Loehmann's Plaza C 139,380
Northern Super Center G 36,588
Pembroke East B 27,200
Pembroke Mall I 570,000
Pembroke Meadows SC A 81,592
Pembroke Place B 165,000
Pembroke Plaza G 34,900
Roomstore H 50,000
The Town Center of Virginia Beach C 313,590
PRINCESS ANNE ROAD
Brenneman Farm SC A 228,197
Courthouse Marketplace A 122,000
Home Depot H 130,000
Kempsville Marketplace A 71,460
Landstown Commons D 505,766
Lynnhaven Square S C G 22,933
Parkway SC A 64,820
Pleasant Valley Marketplace A 88,107
Princess Anne Marketplace B 209,500
Princess One SC A 84,725
Salem Crossing D 92,316
Salem Lakes Marketplace A 42,087
Salem Lakes SC A 37,087
Woodtide SC A 25,500
SMITHFIELD
Cypress Run SC G 25,000
Eagle Harbor A 77,400
Shoppes at Eagle Harbor A 24,386
Smithfield Plaza B 89,120
Smithfield Square A 65,244
SUFFOLK
Bennetts Creek Crossing A 109,812
Bennetts Creek Food Lion A 64,544
Harbor View Shoppes A 18,835
Holland Plaza A 69,345
Kensington Square A 6,000
Lowes H 150,000
Mattress Discounters Plaza A 59,892
Oak Ridge A 38,700
Suffolk Plaza B 176,733
Suffolk Plaza West A 60,000
Suffolk Shopping Center B 155,733
Suffolk Specialty Shops G 15,200
25
Suffolk Village SC G 11,875
Wal-Mart Super Center H 194,160
PENINSULA
COLISEUM CENTRAL
Coliseum Corner A 49,267
Coliseum Crossing B 221,004
Coliseum Marketplace A 86,681
Coliseum Specialty Shops G 15,026
Coliseum Square G 45,041
Hampton Towne Centre D 376,100
Hampton Woods A 89,092
Home Depot H 130,060
Peninsula Towncenter I 994,235
Riverdale Plaza D 280,133
Sports Authority H 40,000
Target H 122,000
The Power Plant D 621,150
Todd Center & Todd Lane Shops B 242,000
Wal-Mart Super Center H 193,316
DENBIGH
Beaconsdale SC A 28,000
Denbigh Speciality Shops G 24,504
Denbigh Village Centre B 334,299
Denbigh Village Shopping Center H 327,322
Ferguson Center G 118,000
Former Hills Denbigh H 86,589
Jefferson Crossing (formerly Denbigh Crossing) A
145,000
Kmart H 115,854
Lee Hall Plaza A 36,000
Newport Crossing B 200,088
Richneck Shopping Center A 63,425
Stoneybrook Shopping Center A 74,340
Turnberry Crossing A 53,775
Village Square A 40,000
Warwick Denbigh SC B 137,925
FOXHILL / BUCKROE / EAST MERCURY
Buckroe SC A 76,000
Farm Fresh Phoebus H 39,000
Kmart H 94,500
Langley Square A 120,646
Marketplace @ Nickerson A 70,450
Nickerson Plaza A 83,849
Willow Oaks Village Square S.C. B 197,169
GLOUCESTER
Food Lion H 40,000
Hayes Plaza SC A 52,651
Hayes SC A 100,000
Home Depot H 100,000
Lowe's H 125,000
Shoppes at Gloucester B 82,025
Wal-Mart Super Center H 220,000
York River Crossing B 175,000
HAMPTON MISCELLANEOUS
Kecoughtan SC A 64,327
The Shops at Hampton Harbor G 54,645
NEWMARKET / MAIN
4113 W Mercury Blvd. H 49,770
4205 W. Mercury Blvd. H 28,080
Brentwood SC A 53,600
Dresden SC G 35,000
Forest Park Square B 150,000
Francisco Village A 55,865
Hampton Plaza B 173,199
Hilton SC A 74,000
Midway Shopping Center G 58,780
Newmarket South D 368,085
Plaza @ Newmarket B 117,377
Warwick Center A 150,000
Warwick Village A 75,400
PATRICK HENRY / OYSTER POINT / KILN CREEK
Bayberry Village A 72,883
Best Buy Building H 135,000
City Center C 230,000
Commonweatlh Center G 30,279
Fairway Plaza G 37,950
Glendale SC G 30,000
Grand Furniture H 35,000
Harris Teeter H 52,334
Haverty's H 45,000
Haynes H 85,000
Hidenwood SC A 100,000
Jefferson Commons D 400,000
Jefferson Greene G 57,430
Jefferson Plaza D 178,200
Kroger H 55,000
Lowes H 120,000
Market Place @ Oyster Point A 69,660
Newport Marketplace D 450,000
Newport Square B 184,126
Office Depot H 30,122
Oyster Point Plaza A 73,197
Oyster Point Square A 83,089
Patrick Henry Mall I 714,607
Patrick Henry Place A 17,000
Sam's Club H 133,880
The Shoppes at Oyster Point G 30,000
Victory Center @ Kiln Creek A 78,000
Village Square @ Kiln Creek B 263,000
Villages of Kiln Creek G 45,300
Wal-Mart Super Center H 201,146
Yoder Plaza SC D 337,053
POQUOSON
Poquoson SC A 57,458
Wythe Creek Plaza SC A 51,063
WILLIAMSBURG
Colony Square A 66,806
Ewell Station A 68,048
Festival Marketplace G 16,216
Gallery Shops G 18,187
Governor's Green SC A 100,000
Home Depot H 130,000
James York Plaza B 137,708
Kingsgate Green B 138,348
Lowes H 163,000
Marketplace Shoppes G 32,026
Marketplace Shopping Center A 36,000
Monticello Marketplace B 299,792
Monticello SC A 82,000
New Town Shops on Main C 253,000
Norge Crossing H 52,000
Olde Towne SC G 30,000
Prime Outlets F 349,927
Quarterpath Crossing A 85,600
Settlers Market at New Town B 37,051
Staples H 37,400
The Marquis (Phase I) D 1,000,000
The Shops at High Street B 114,449
Village Shops at Kingsmill G 82,200
Wal-Mart SuperCenter H 210,000
Williamsburg Crossing A 149,933
Williamsburg Farm Fresh A 79,188
Williamsburg Marketcenter B 120,920
Williamsburg Outlet Mall I 180,000
Williamsburg Pavillion Shops G 50,000
Williamsburg SC I & II B 251,000
Williamsburg Towne and Cnty A 49,802
WindsorMeade Marketplace D 174,379
Yankee Candle H 42,000
YORK COUNTY
Grafton SC A 32,000
Heritage Square A 73,665
Kiln Creek Center A 45,700
Lakeside 17 H 8,400
Marketplace @ Yorktown A 73,050
Patriots Square A 47,231
Pavilion at Kiln Creek A 26,820
Shady Banks SC A 56,634
Wal-Mart SuperCenter H 220,000
Washington Square Shopping Center B 183,403
York Square A 48,720
Yorkshire Downs G 23,900
27
Author William C. Throne, SIOR, CCIM, ALC
Data Preparation Stephanie Sanker, SIOR, CCIM
Survey Coordination Stephanie Sanker, SIOR, CCIM
Reporters Greenbrier........................................................ Christine Kaempfe
Bainbridge/S. Elizabeth River Area .................... Chip Worley
Cavalier Industrial Park..................................... Pat Mumey
Norfolk Commerce Park/Central Norfolk Area ... Worth Remick
Norfolk Industrial Park ...................................... Charles Dickinson
West Side/MidTown Norfolk Area ...................... Billy King
Lynnhaven........................................................ Brian Baker
Greenwich/Cleveland Streets Area .................... Bobby Beasley
Airport Industrial Area ...................................... Bobby Beasley
Portsmouth...................................................... Sam Walker
Suffolk ............................................................. Bill Throne
Isle of Wight..................................................... Billy King
Copeland/Lower Peninsula ............................... Clay Culbreth
Oyster Point/Middle Peninsula Area .................. Bobby Philips
Oakland/Upper Peninsula Area ......................... Clay Culbreth
Williamsburg Extended Area ............................. Bobby Phillips
Financial The E. V. Williams Center for Real Estate and Economic Support Development (CREED) functions and reports are funded by
donations from the CREED IPAC and Council Advisory Boards, organizations, and individuals.
Disclosure The data used for this report are deemed reliable; however, neither Old Dominion University, the E. V. Williams Center for Real Estate and Economic Development, nor sponsoring companiesand/or individuals makes any representation or warranty as to itsaccuracy.
20
12
IND
US
TR
IAL
H A M P T O N
R O A D S
M A R K E T
R E V I E W
INDUSTRIAL
282012 Hampton Roads Real Estate Market Review
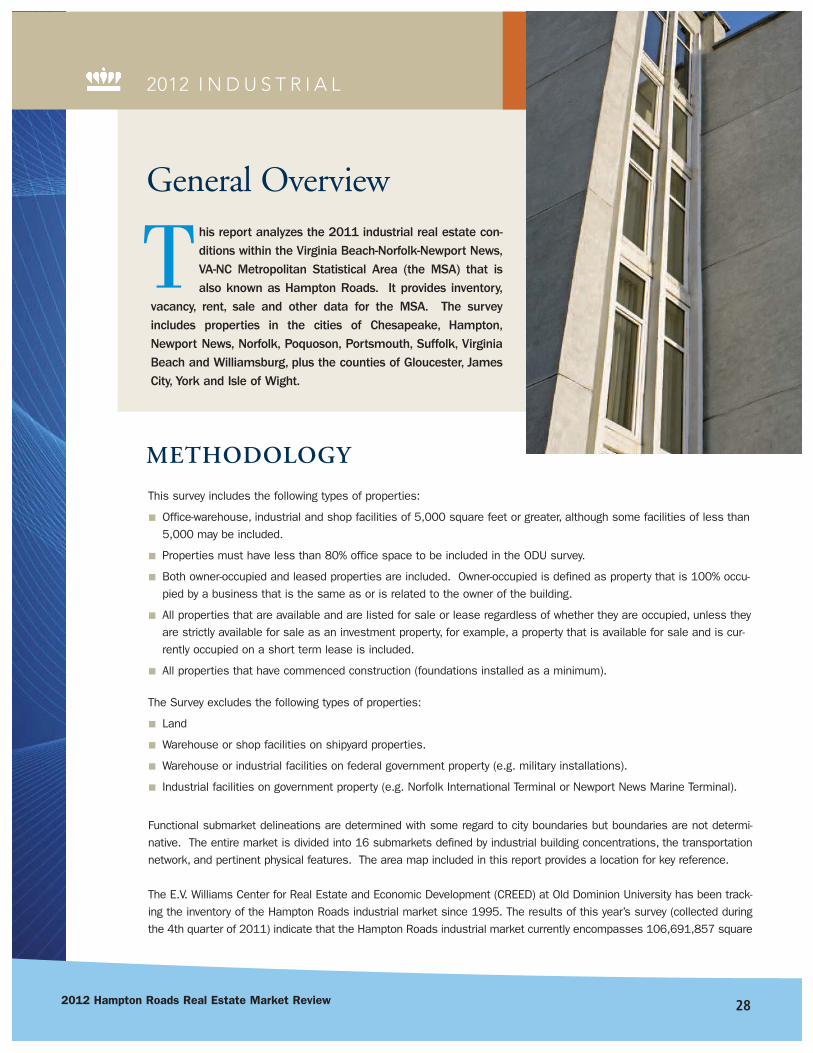
This survey includes the following types of properties:
■ Office-warehouse, industrial and shop facilities of 5,000 square feet or greater, although some facilities of less than5,000 may be included.
■ Properties must have less than 80% office space to be included in the ODU survey.
■ Both owner-occupied and leased properties are included. Owner-occupied is defined as property that is 100% occu-pied by a business that is the same as or is related to the owner of the building.
■ All properties that are available and are listed for sale or lease regardless of whether they are occupied, unless theyare strictly available for sale as an investment property, for example, a property that is available for sale and is cur-rently occupied on a short term lease is included.
■ All properties that have commenced construction (foundations installed as a minimum).
The Survey excludes the following types of properties:
■ Land
■ Warehouse or shop facilities on shipyard properties.
■ Warehouse or industrial facilities on federal government property (e.g. military installations).
■ Industrial facilities on government property (e.g. Norfolk International Terminal or Newport News Marine Terminal).
Functional submarket delineations are determined with some regard to city boundaries but boundaries are not determi-native. The entire market is divided into 16 submarkets defined by industrial building concentrations, the transportationnetwork, and pertinent physical features. The area map included in this report provides a location for key reference.
The E.V. Williams Center for Real Estate and Economic Development (CREED) at Old Dominion University has been track-ing the inventory of the Hampton Roads industrial market since 1995. The results of this year’s survey (collected duringthe 4th quarter of 2011) indicate that the Hampton Roads industrial market currently encompasses 106,691,857 square
METHODOLOGY
2012 I N D U S T R I A L
his report analyzes the 2011 industrial real estate con-ditions within the Virginia Beach-Norfolk-Newport News,VA-NC Metropolitan Statistical Area (the MSA) that isalso known as Hampton Roads. It provides inventory,
vacancy, rent, sale and other data for the MSA. The surveyincludes properties in the cities of Chesapeake, Hampton,Newport News, Norfolk, Poquoson, Portsmouth, Suffolk, VirginiaBeach and Williamsburg, plus the counties of Gloucester, JamesCity, York and Isle of Wight.
General Overview
T
feet or space located in 2,866 buildings throughout the region. This is a decrease of2,030,258 square feet or 1.9% from last year’s survey. The decrease is primarily due to thedemolition of approximately 1 million square feet on the former Ford plant and increasedaccuracy of surveyors over previous years. Totals may differ from other market surveys dueto the self-imposed limitations established by the ODU CREED methodology described above.
INTRODUCTIONThe industrial market, while showing no improvement in the market below 50,000 squarefeet, fared better in 2011 than in 2010 for larger transactions. These major transactionsobscured the overall weakness in the general industrial market.
Prior to the current recession, the Hampton Roads region began a significant transitiontoward servicing global markets through the Port of Virginia. Developers purchased land andbegan construction of new cross-dock and deconsolidation centers. By 2008, over 20 millionsquare feet of industrial buildings were planned. Ultimately, less than half that total was built.
In 2011, the market saw absorption of much newly constructed Class A product. As aresult, there is very little remaining high cube warehousing space. Over the past few years,building design has continued to evolve. Companies entering the market are demanding
higher clear heights, larger truck courts,concrete construction, ESFR firesuppression and sustainable facilities. Asa result, older generation distributionspace will see greater vacancy anddeclining rental rates. Companies looking
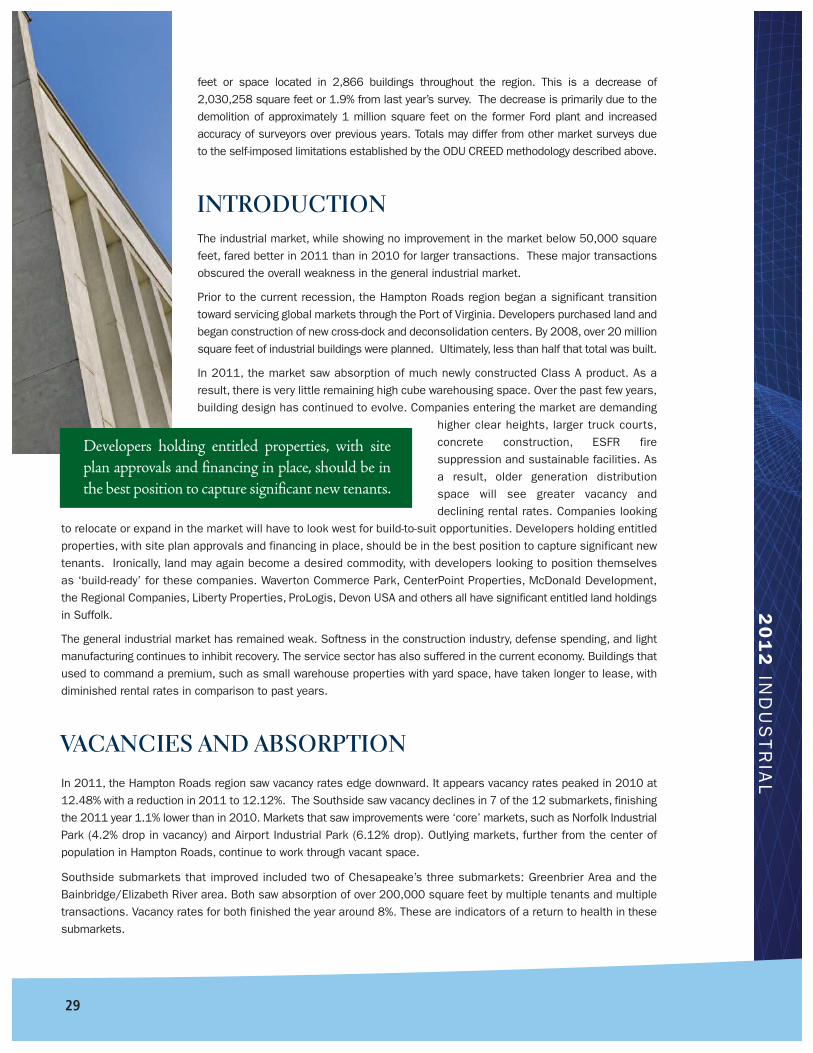
to relocate or expand in the market will have to look west for build-to-suit opportunities. Developers holding entitledproperties, with site plan approvals and financing in place, should be in the best position to capture significant newtenants. Ironically, land may again become a desired commodity, with developers looking to position themselvesas ‘build-ready’ for these companies. Waverton Commerce Park, CenterPoint Properties, McDonald Development,the Regional Companies, Liberty Properties, ProLogis, Devon USA and others all have significant entitled land holdingsin Suffolk.
The general industrial market has remained weak. Softness in the construction industry, defense spending, and lightmanufacturing continues to inhibit recovery. The service sector has also suffered in the current economy. Buildings thatused to command a premium, such as small warehouse properties with yard space, have taken longer to lease, withdiminished rental rates in comparison to past years.
VACANCIES AND ABSORPTIONIn 2011, the Hampton Roads region saw vacancy rates edge downward. It appears vacancy rates peaked in 2010 at12.48% with a reduction in 2011 to 12.12%. The Southside saw vacancy declines in 7 of the 12 submarkets, finishingthe 2011 year 1.1% lower than in 2010. Markets that saw improvements were ‘core’ markets, such as Norfolk IndustrialPark (4.2% drop in vacancy) and Airport Industrial Park (6.12% drop). Outlying markets, further from the center ofpopulation in Hampton Roads, continue to work through vacant space.
Southside submarkets that improved included two of Chesapeake’s three submarkets: Greenbrier Area and theBainbridge/Elizabeth River area. Both saw absorption of over 200,000 square feet by multiple tenants and multipletransactions. Vacancy rates for both finished the year around 8%. These are indicators of a return to health in thesesubmarkets.
20
12
IND
US
TR
IAL
29
Developers holding entitled properties, with siteplan approvals and financing in place, should be inthe best position to capture significant new tenants.
302012 Hampton Roads Real Estate Market Review
2012 I N D U S T R I A L
Suffolk also recorded a reduction in vacancy of 4.19%. Distribution and supply chain related companies accounted for thebulk of the leasing, with positive absorption of over 475,000 square feet in existing space. Suffolk also saw renewed activityin development, with CenterPoint Properties constructing two new build-to-suites totaling almost 700,000 square feet.
Markets that saw significant increases in vacancy rate include:
Lynnhaven +5.09%
Greenwich/Cleveland Street +3.2%
Portsmouth +4.14%
Isle of Wight +7.05%
The Peninsula submarkets were consistent in 2011 with virtually no change in the total vacancy rate. There were anumber of internal changes of note, including the demolition of the Hiden warehouses, a group of WWII vintage buildingsowned by the Huntington-Ingalls shipyard. These buildings totaled approximately 900,000 square feet, and reduced thesize of the Copeland/Lower Peninsula area Submarket substantially.
Copeland has historically had to carry Camp Morrison as a vacancy. At approximately 600,000 square feet, this hascontributed, perhaps unfairly, to the total vacancy of 17.73%. Also in Copeland, the former Speigel warehouse at 5201City Line Road came on the market in 2011, adding 352,000 square feet to vacancy, bringing the total to almost 2million square feet empty.
On the other side of the ledger, Oyster Point/Middle Peninsula and the Williamsburg Extended Submarkets both held tovacancy rates of less than 7%. These would be good rates in a healthy economy.
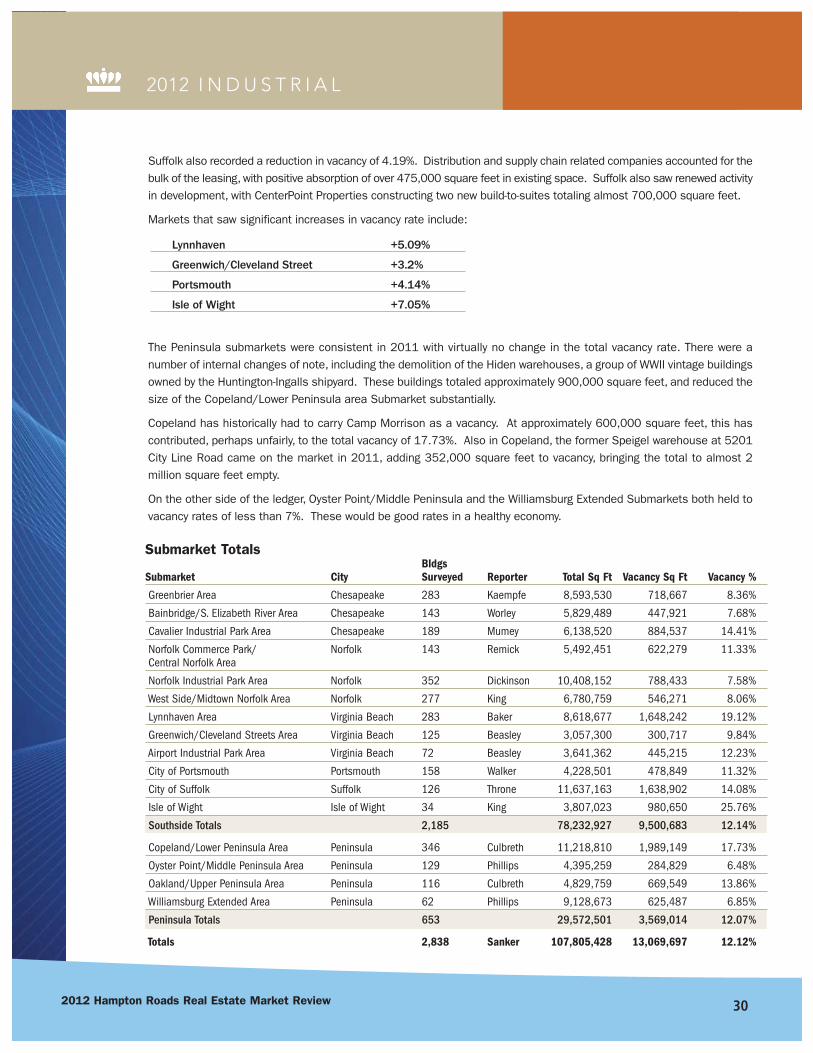
Submarket TotalsBldgs
Submarket City Surveyed Reporter Total Sq Ft Vacancy Sq Ft Vacancy %
Greenbrier Area Chesapeake 283 Kaempfe 8,593,530 718,667 8.36%
Bainbridge/S. Elizabeth River Area Chesapeake 143 Worley 5,829,489 447,921 7.68%
Cavalier Industrial Park Area Chesapeake 189 Mumey 6,138,520 884,537 14.41%
Norfolk Commerce Park/ Norfolk 143 Remick 5,492,451 622,279 11.33%Central Norfolk Area
Norfolk Industrial Park Area Norfolk 352 Dickinson 10,408,152 788,433 7.58%
West Side/Midtown Norfolk Area Norfolk 277 King 6,780,759 546,271 8.06%
Lynnhaven Area Virginia Beach 283 Baker 8,618,677 1,648,242 19.12%
Greenwich/Cleveland Streets Area Virginia Beach 125 Beasley 3,057,300 300,717 9.84%
Airport Industrial Park Area Virginia Beach 72 Beasley 3,641,362 445,215 12.23%
City of Portsmouth Portsmouth 158 Walker 4,228,501 478,849 11.32%
City of Suffolk Suffolk 126 Throne 11,637,163 1,638,902 14.08%
Isle of Wight Isle of Wight 34 King 3,807,023 980,650 25.76%
Southside Totals 2,185 78,232,927 9,500,683 12.14%
Copeland/Lower Peninsula Area Peninsula 346 Culbreth 11,218,810 1,989,149 17.73%
Oyster Point/Middle Peninsula Area Peninsula 129 Phillips 4,395,259 284,829 6.48%
Oakland/Upper Peninsula Area Peninsula 116 Culbreth 4,829,759 669,549 13.86%
Williamsburg Extended Area Peninsula 62 Phillips 9,128,673 625,487 6.85%
Peninsula Totals 653 29,572,501 3,569,014 12.07%
Totals 2,838 Sanker 107,805,428 13,069,697 12.12%
20
12
IND
US
TR
IAL
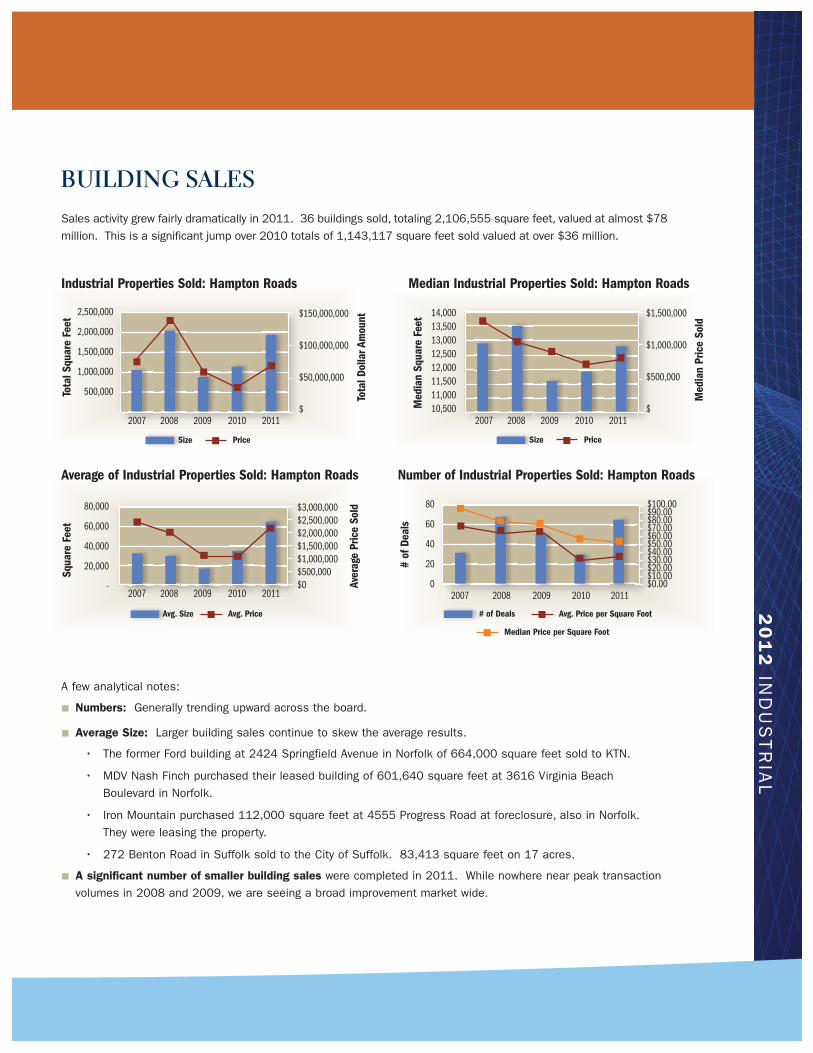
A few analytical notes:
■ Numbers: Generally trending upward across the board.
■ Average Size: Larger building sales continue to skew the average results.
• The former Ford building at 2424 Springfield Avenue in Norfolk of 664,000 square feet sold to KTN.
• MDV Nash Finch purchased their leased building of 601,640 square feet at 3616 Virginia BeachBoulevard in Norfolk.
• Iron Mountain purchased 112,000 square feet at 4555 Progress Road at foreclosure, also in Norfolk.They were leasing the property.
• 272 Benton Road in Suffolk sold to the City of Suffolk. 83,413 square feet on 17 acres.
■ A significant number of smaller building sales were completed in 2011. While nowhere near peak transactionvolumes in 2008 and 2009, we are seeing a broad improvement market wide.
2,500,000
2,000,000
1,500,000
1,000,000
500,000
$150,000,000
$100,000,000
$50,000,000
$
Industrial Properties Sold: Hampton Roads
Tota
l Squ
are
Feet
Tota
l Dol
lar A
mou
nt
2007 2008 2009 2010 2011
Size Price
14,00013,50013,00012,50012,00011,50011,00010,500
$1,500,000
$1,000,000
$500,000
$
Median Industrial Properties Sold: Hampton Roads
Med
ian
Squa
re F
eet
Med
ian
Pric
e So
ld
2007 2008 2009 2010 2011
Size Price
80,000
60,000
40,000
20,000
-
$3,000,000$2,500,000$2,000,000$1,500,000$1,000,000$500,000$0
Average of Industrial Properties Sold: Hampton Roads Number of Industrial Properties Sold: Hampton Roads
Squa
re F
eet
Aver
age
Pric
e So
ld
Avg. Size Avg. Price # of Deals Avg. Price per Square Foot
Median Price per Square Foot
2007 2008 2009 2010 2011
80
60
40
20
0
$100.00$90.00$80.00$70.00$60.00$50.00$40.00$30.00$20.00$10.00$0.00
# of
Dea
ls
2007 2008 2009 2010 2011
BUILDING SALESSales activity grew fairly dramatically in 2011. 36 buildings sold, totaling 2,106,555 square feet, valued at almost $78million. This is a significant jump over 2010 totals of 1,143,117 square feet sold valued at over $36 million.

322012 Hampton Roads Real Estate Market Review
2012 I N D U S T R I A L
OTHER REPRESENTATIVE BUILDING SALES
3527 Business Center Drive, ChesapeakeFebruary 2011 7,434 square feet $815,000 $109.63 per square foot
Fenced yard area.
2010 Amedeo Court, SuffolkAugust, 2011 30,000 square feet $1,272,000 $42.40 per square foot
New, tilt-concrete, no improvements, bank REO property.
1164 Kingwood Avenue, NorfolkApril, 2011 11,611 square feet $747,000 $64.34 per square foot
Older facility undergoing retrofit
230 Enterprise Drive, Newport NewsSeptember, 2011 83,413 square feet $1,900,000 $22.78 per square foot
805 Live Oak Drive, ChesapeakeJuly, 2011 22,645 square feet $1,650,000 $72.86 per square foot
46% office build-out
121 Old Aberdeen Road, HamptonJuly, 2011 5,440 square feet $435,000 $79.96 per square foot
Smaller building
2861 Crusader Circle, Virginia BeachDecember, 2011 23,000 square feet $1,650,000 $71.74 per square foot
Owner financing
LEASINGLease rates saw modest increases in 2011. CBRE Hampton Roads
reported in their 4th Quarter Hampton Roads Industrial Report that“Current average leasing rates rose from $4.41 per square foot triplenet to $4.62 per square foot triple net.” It is expected that rates willcontinue to increase in 2012 as absorption continues to remove qualityproduct from the market. The small space market and the large blockmarket are expected to experience increasing rents. Both can expectto experience shortages of available space.
Older generation distribution space will continue to have high vacancyrates, particularly those properties in the 50,000 to 100,000 squarefoot range. Functionally obsolete mid-size properties between 10,000-40,000 square feet in older environs will also face challenges fillingtheir space.
New speculative space should be received well in the market.
20
12
IND
US
TR
IAL
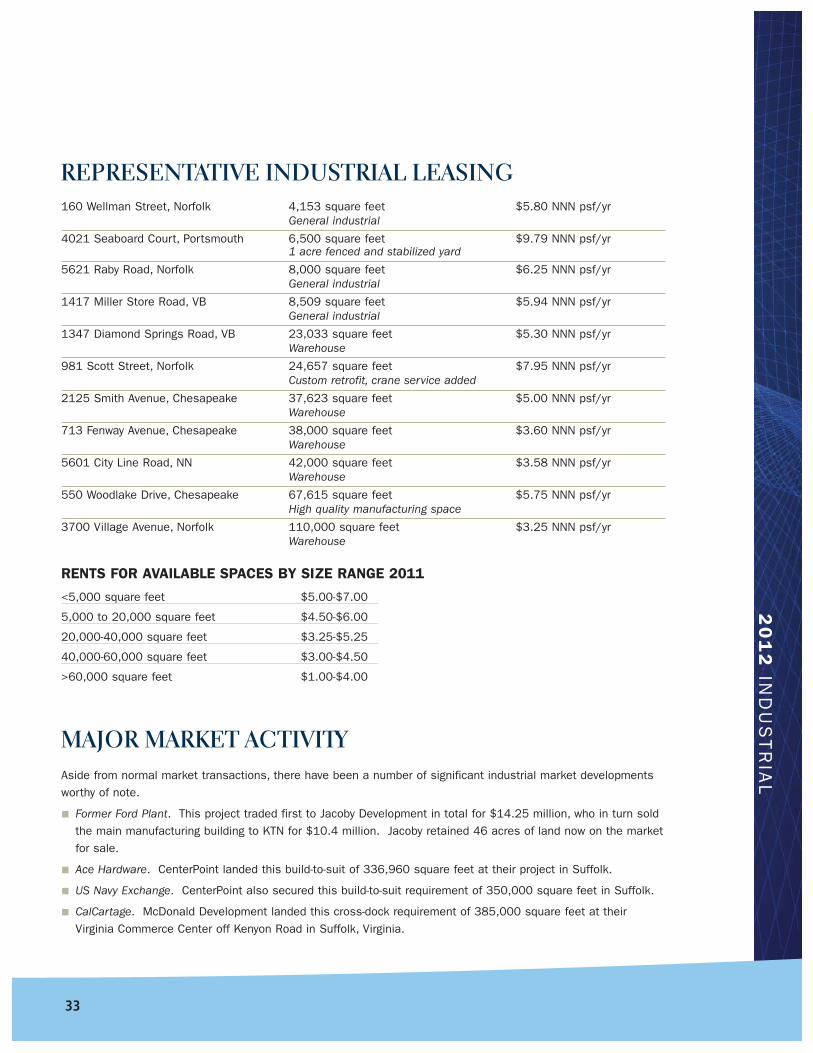
REPRESENTATIVE INDUSTRIAL LEASING160 Wellman Street, Norfolk 4,153 square feet $5.80 NNN psf/yr
General industrial
4021 Seaboard Court, Portsmouth 6,500 square feet $9.79 NNN psf/yr1 acre fenced and stabilized yard
5621 Raby Road, Norfolk 8,000 square feet $6.25 NNN psf/yrGeneral industrial
1417 Miller Store Road, VB 8,509 square feet $5.94 NNN psf/yrGeneral industrial
1347 Diamond Springs Road, VB 23,033 square feet $5.30 NNN psf/yrWarehouse
981 Scott Street, Norfolk 24,657 square feet $7.95 NNN psf/yrCustom retrofit, crane service added
2125 Smith Avenue, Chesapeake 37,623 square feet $5.00 NNN psf/yrWarehouse
713 Fenway Avenue, Chesapeake 38,000 square feet $3.60 NNN psf/yrWarehouse
5601 City Line Road, NN 42,000 square feet $3.58 NNN psf/yrWarehouse
550 Woodlake Drive, Chesapeake 67,615 square feet $5.75 NNN psf/yrHigh quality manufacturing space
3700 Village Avenue, Norfolk 110,000 square feet $3.25 NNN psf/yrWarehouse
RENTS FOR AVAILABLE SPACES BY SIZE RANGE 2011
<5,000 square feet $5.00-$7.00
5,000 to 20,000 square feet $4.50-$6.00
20,000-40,000 square feet $3.25-$5.25
40,000-60,000 square feet $3.00-$4.50
>60,000 square feet $1.00-$4.00
MAJOR MARKET ACTIVITYAside from normal market transactions, there have been a number of significant industrial market developmentsworthy of note.
■ Former Ford Plant. This project traded first to Jacoby Development in total for $14.25 million, who in turn soldthe main manufacturing building to KTN for $10.4 million. Jacoby retained 46 acres of land now on the marketfor sale.
■ Ace Hardware. CenterPoint landed this build-to-suit of 336,960 square feet at their project in Suffolk.
■ US Navy Exchange. CenterPoint also secured this build-to-suit requirement of 350,000 square feet in Suffolk.
■ CalCartage. McDonald Development landed this cross-dock requirement of 385,000 square feet at theirVirginia Commerce Center off Kenyon Road in Suffolk, Virginia.
33
342012 Hampton Roads Real Estate Market Review
2012 I N D U S T R I A L
■ DANA. Another build-to-suit project landed in Northern Suffolk at Liberty Properties Bridgeway CommerceCenter: 126,000 square feet.
■ Regional Commerce Center, the Regional Company. This building of 400,000 square feet in Suffolk off Rt. 460scored no less than four tenants for their new building: Art FX, 80,000 square feet; Caspari, 65,000 squarefeet; Massimo Zanetti, 67,500 square feet, and Best Brakes, 38,000 square feet.
■ Green Mountain Coffee. Johnson Development announced the pending sale of their 330,000 square footwarehouse building along with additional acreage for expansion.
■ IMS Gear. Miller Group in Virginia Beach will be providing a new facility for IMS Gear in the Lynnhaven area. Total square footage: 112,000 square feet.
■ Enviva LP purchased and opened their new 60 acre deep water terminal on the Elizabeth River to export over 3 million tons of wood chips and pellets per year to Europe.
A few thoughts on these major transactions:
First, the leasing and sales may be a precursor to activity in the market related to the Panama Canal expansion, withexpected completion in 2014. Second, we may be seeing the leading edge of an economic recovery, led by majorcorporations anticipating the upturn and need for space. Third, build-to-suits dominate the larger transactions. This is acommon occurrence nationwide. The absence of speculative building, coupled with a lack of remaining large facilities, hasforced large users to look to developers with entitled land to construct facilities to their specifications. Look for 2012 tocontinue this trend as long as large entitled sites are still available. Note the following comments from around the country:
Raleigh, North Carolina
“Vacancy rates continue to demonstrate disparate performance between Class A assets with clear heights above
24’ and ESFR sprinkler systems versus older facilities without these features. While the overall market vacancy
continues to hover around 20%, vacancy rates within Class A product continue to be relatively tight at 7% market
wide.”
— Christopher Norvell, Managing DirectorCassidy TurleySoutheast Real Estate Business, January 2012
Tampa, Florida
“We are beginning to see a shortage of Class A warehouse space for users 100,000 square feet or larger. With
the combined Tampa, Pinellas and Lakeland markets ending 2011 at 6.7% vacancy, you would think develop-
ers would start new construction.”
— Bruce K. Erhardt, Executive DirectorCushman and Wakefield of FloridaTampa Bay Land Market Overview 4Q 2011
Nationwide
“Industrial markets in the United States have also begun the recovery process. Integra Realty Resources research
indicates that the underlying fundamentals in the industrial sector have improved only slightly over the course
of the last three years, as a glut of speculative space built throughout the country prior to the crash is only now
beginning to be absorbed. With this space beginning to be absorbed and little speculative building adding supply
to the market in recent years, the sector could be poised for the strongest rebound in coming years as demand
for space recovers.”
— Integra Realty ResourcesReal Estate Value TrendsViewpoint 2012
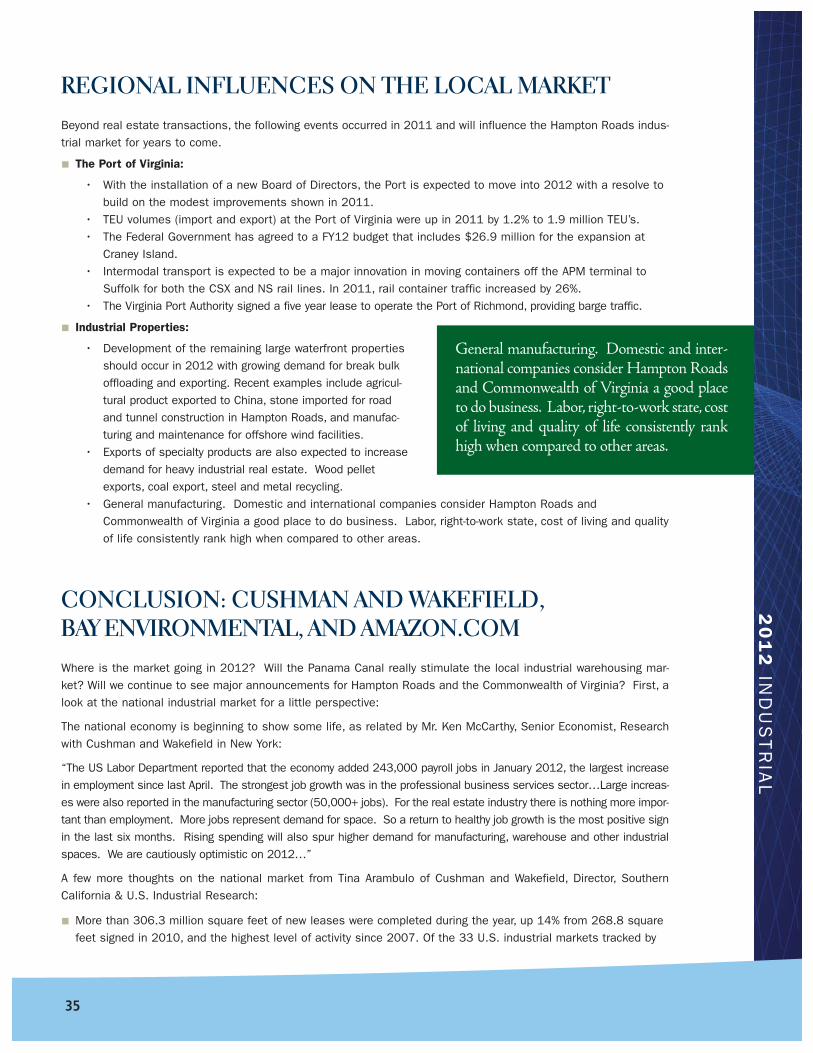
20
12
IND
US
TR
IAL
REGIONAL INFLUENCES ON THE LOCAL MARKET
Beyond real estate transactions, the following events occurred in 2011 and will influence the Hampton Roads indus-trial market for years to come.
■ The Port of Virginia:
• With the installation of a new Board of Directors, the Port is expected to move into 2012 with a resolve tobuild on the modest improvements shown in 2011.
• TEU volumes (import and export) at the Port of Virginia were up in 2011 by 1.2% to 1.9 million TEU’s.• The Federal Government has agreed to a FY12 budget that includes $26.9 million for the expansion at
Craney Island.• Intermodal transport is expected to be a major innovation in moving containers off the APM terminal to
Suffolk for both the CSX and NS rail lines. In 2011, rail container traffic increased by 26%.• The Virginia Port Authority signed a five year lease to operate the Port of Richmond, providing barge traffic.
■ Industrial Properties:
• Development of the remaining large waterfront propertiesshould occur in 2012 with growing demand for break bulkoffloading and exporting. Recent examples include agricul-tural product exported to China, stone imported for roadand tunnel construction in Hampton Roads, and manufac-turing and maintenance for offshore wind facilities.
• Exports of specialty products are also expected to increasedemand for heavy industrial real estate. Wood pelletexports, coal export, steel and metal recycling.
• General manufacturing. Domestic and international companies consider Hampton Roads andCommonwealth of Virginia a good place to do business. Labor, right-to-work state, cost of living and qualityof life consistently rank high when compared to other areas.
CONCLUSION: CUSHMAN AND WAKEFIELD, BAY ENVIRONMENTAL, AND AMAZON.COM Where is the market going in 2012? Will the Panama Canal really stimulate the local industrial warehousing mar-ket? Will we continue to see major announcements for Hampton Roads and the Commonwealth of Virginia? First, alook at the national industrial market for a little perspective:
The national economy is beginning to show some life, as related by Mr. Ken McCarthy, Senior Economist, Researchwith Cushman and Wakefield in New York:
“The US Labor Department reported that the economy added 243,000 payroll jobs in January 2012, the largest increasein employment since last April. The strongest job growth was in the professional business services sector…Large increas-es were also reported in the manufacturing sector (50,000+ jobs). For the real estate industry there is nothing more impor-tant than employment. More jobs represent demand for space. So a return to healthy job growth is the most positive signin the last six months. Rising spending will also spur higher demand for manufacturing, warehouse and other industrialspaces. We are cautiously optimistic on 2012…”
A few more thoughts on the national market from Tina Arambulo of Cushman and Wakefield, Director, SouthernCalifornia & U.S. Industrial Research:
■ More than 306.3 million square feet of new leases were completed during the year, up 14% from 268.8 squarefeet signed in 2010, and the highest level of activity since 2007. Of the 33 U.S. industrial markets tracked by
General manufacturing. Domestic and inter-national companies consider Hampton Roadsand Commonwealth of Virginia a good placeto do business. Labor, right-to-work state, costof living and quality of life consistently rankhigh when compared to other areas.
35
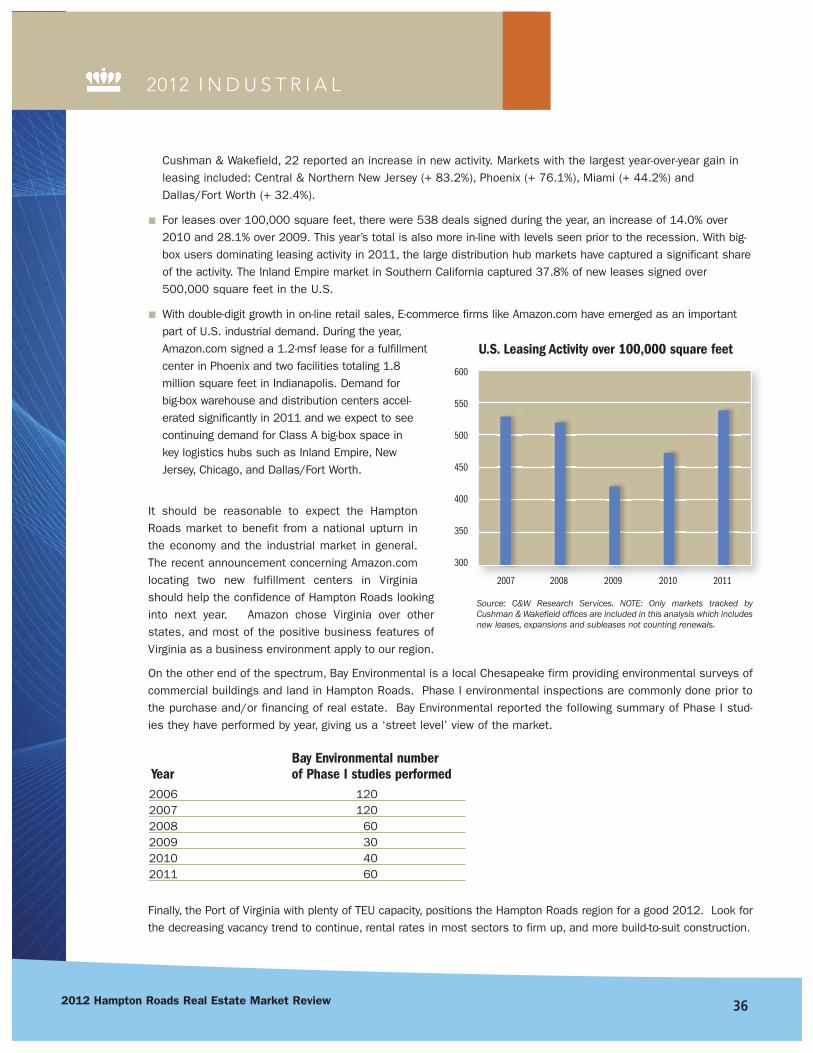
362012 Hampton Roads Real Estate Market Review
2012 I N D U S T R I A L
Cushman & Wakefield, 22 reported an increase in new activity. Markets with the largest year-over-year gain inleasing included: Central & Northern New Jersey (+ 83.2%), Phoenix (+ 76.1%), Miami (+ 44.2%) andDallas/Fort Worth (+ 32.4%).
■ For leases over 100,000 square feet, there were 538 deals signed during the year, an increase of 14.0% over2010 and 28.1% over 2009. This year’s total is also more in-line with levels seen prior to the recession. With big-box users dominating leasing activity in 2011, the large distribution hub markets have captured a significant shareof the activity. The Inland Empire market in Southern California captured 37.8% of new leases signed over500,000 square feet in the U.S.
■ With double-digit growth in on-line retail sales, E-commerce firms like Amazon.com have emerged as an importantpart of U.S. industrial demand. During the year,Amazon.com signed a 1.2-msf lease for a fulfillmentcenter in Phoenix and two facilities totaling 1.8million square feet in Indianapolis. Demand forbig-box warehouse and distribution centers accel-erated significantly in 2011 and we expect to seecontinuing demand for Class A big-box space inkey logistics hubs such as Inland Empire, NewJersey, Chicago, and Dallas/Fort Worth.
It should be reasonable to expect the HamptonRoads market to benefit from a national upturn inthe economy and the industrial market in general.The recent announcement concerning Amazon.comlocating two new fulfillment centers in Virginiashould help the confidence of Hampton Roads lookinginto next year. Amazon chose Virginia over otherstates, and most of the positive business features ofVirginia as a business environment apply to our region.
On the other end of the spectrum, Bay Environmental is a local Chesapeake firm providing environmental surveys ofcommercial buildings and land in Hampton Roads. Phase I environmental inspections are commonly done prior tothe purchase and/or financing of real estate. Bay Environmental reported the following summary of Phase I stud-ies they have performed by year, giving us a ‘street level’ view of the market.
Bay Environmental numberYear of Phase I studies performed2006 1202007 1202008 602009 302010 402011 60
Finally, the Port of Virginia with plenty of TEU capacity, positions the Hampton Roads region for a good 2012. Look forthe decreasing vacancy trend to continue, rental rates in most sectors to firm up, and more build-to-suit construction.
600
550
500
450
400
350
300
2007 2008 2009 2010 2011
U.S. Leasing Activity over 100,000 square feet
Source: C&W Research Services. NOTE: Only markets tracked byCushman & Wakefield offices are included in this analysis which includesnew leases, expansions and subleases not counting renewals.
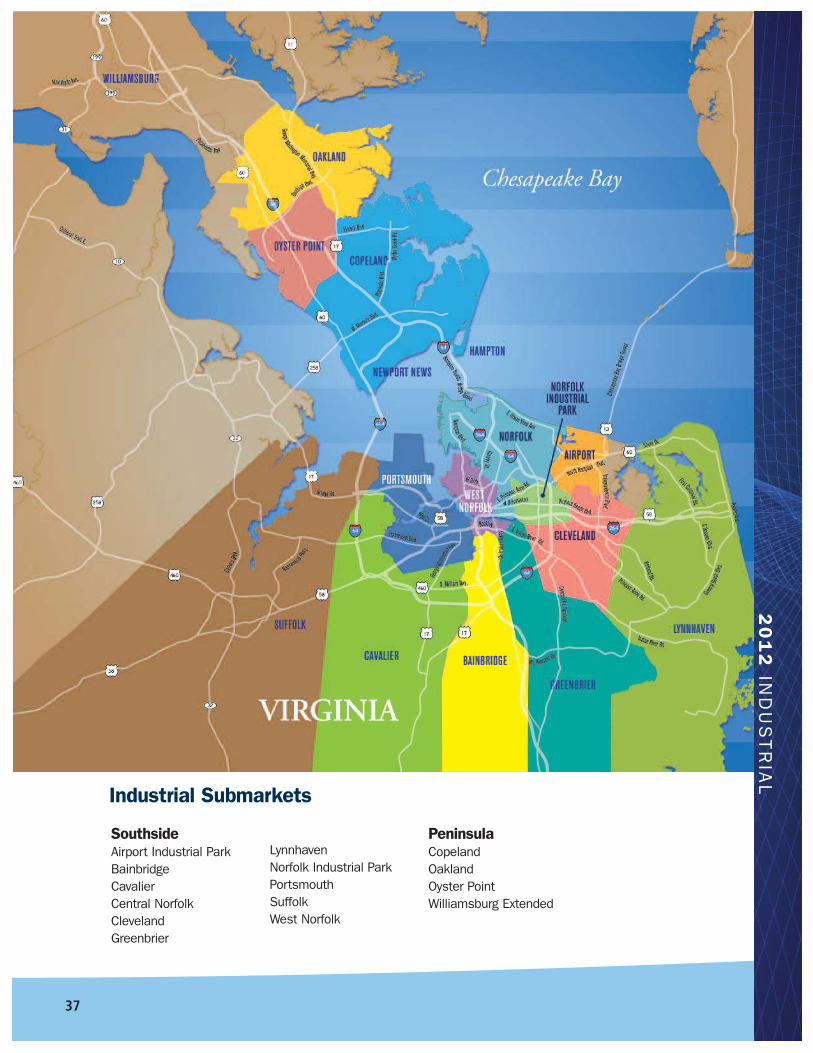
37
Industrial Submarkets
SouthsideAirport Industrial ParkBainbridgeCavalierCentral NorfolkClevelandGreenbrier
LynnhavenNorfolk Industrial ParkPortsmouthSuffolkWest Norfolk
PeninsulaCopelandOaklandOyster PointWilliamsburg Extended
20
12
IND
US
TR
IAL

From trade shows and meetings to receptions and holidayparties, our coastal facility is a wise investment for your
next meeting or event.
Proud Host of the Virginia Association of Realtors Annual Convention & Expo
500,000 Square Feet of Real Estatefor Your Next Meeting
A Division of the Virginia Beach Convention & Visitors Bureau1000 19th Street | Virginia Beach, VA 23451
(757) 385-2000 | [email protected] | vbconventioncenter.com
An
for500,000
oHostoudrP
coaourparties,showtradeomrF
n & Expo
r Your Next MeetingSquare Feet of Real Esta
ConventionnualRealtof oAssociationginiariVtheof
.eventormeetingnextyforinvestmentwiseaisfacilityastal
handeceptionsrtomeetingsands
ors
ate
ryouyolida
385-2000(757)11000
thofDivisionA
.comrvbconventioncente|.comvvbcc@vbgo|023451AVVABeach,giniariV | eetrSt19th
eaurBuisitorsV&ConventionBeachginiariVhe
u

39
Author Casey J. O’Hearn
Associate Vice President
Jones Lang LaSalle
Data Analysis Geoff Thomas
Research & Financial Analyst
Jones Lang LaSalle
Financial The E. V. Williams Center for Real Estate and Economic Support Development (CREED) functions and reports are funded by
donations from individuals, organizations and the CREED IPAC and Council Advisory Boards.
Disclosure The data used for this report are deemed reliable; however, neither Old Dominion University, the E. V. Williams Center for Real Estate and Economic Development, nor sponsoring companiesand/or individuals makes any representation or warranty as to itsaccuracy.
20
12
OFFIC
E
H A M P T O N
R O A D S
M A R K E T
R E V I E W
OFFICE
402012 Hampton Roads Real Estate Market Review
The information in this report relies on market reports from the RCAnalytics, REIS, the CoStar Group Inc., and individualinterviews of local office brokers. The methodology or parameters of building size included in the report for all of HamptonRoads were 20,000 SF and higher for the largest completed lease transactions in 2011; 5,000 SF and higher wereincluded for the top completed office building sales transactions in 2011; approximately five acres and higher were includ-ed for the top completed office land sales transactions in 2011; and 20,000 SF and higher were included for top newconstruction deliveries in 2011.
METHODOLOGY
2012 O F F I C E
he Hampton Roads office market ended
2011 with positive absorption year over year
but overall, the statistical performance
reflected another sluggish year end with a
luke warm outlook on potential growth through 2012.
Still representing a tenant-oriented marketplace driven
by economic incentives and stagnant leasing activity,
the Hampton Roads office market is forecasted to
have another year of sluggish growth with the 2012
elections on the horizon affecting the local core
defense industry.
The 4th quarter 2011 overall vacancy rate for
Hampton Roads decreased to 13.5% from the 4th
quarter 2010 rate of 14.6%. This positive absorption
can be credited to no new product being delivered to
the Hampton Roads office market in 2011. Hampton
Roads did outperform the national office market
vacancy rate which finished 2011 down twenty basis
points from the end of 2010 at 16.0% direct vacancy.
However, the total vacancy for the national office
market finished 2011 at 17.6% reflecting a significant
amount of sublease space throughout the market.
General Overview
T
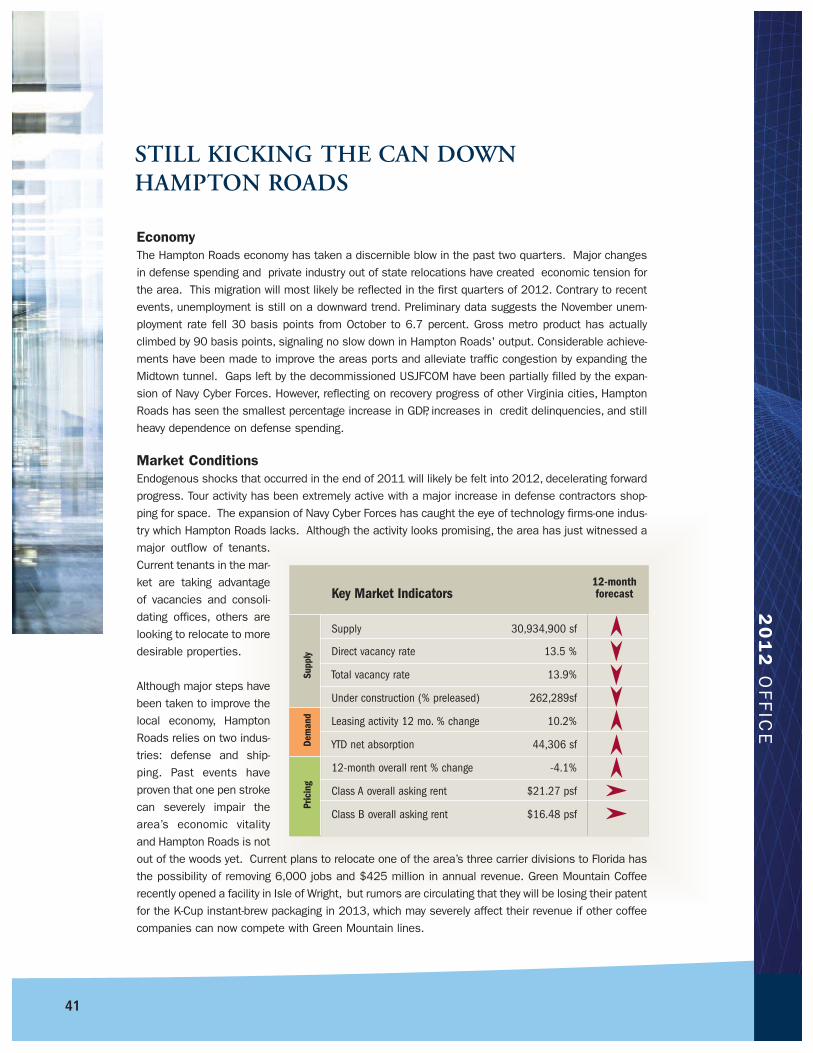
EconomyThe Hampton Roads economy has taken a discernible blow in the past two quarters. Major changesin defense spending and private industry out of state relocations have created economic tension forthe area. This migration will most likely be reflected in the first quarters of 2012. Contrary to recentevents, unemployment is still on a downward trend. Preliminary data suggests the November unem-ployment rate fell 30 basis points from October to 6.7 percent. Gross metro product has actuallyclimbed by 90 basis points, signaling no slow down in Hampton Roads' output. Considerable achieve-ments have been made to improve the areas ports and alleviate traffic congestion by expanding theMidtown tunnel. Gaps left by the decommissioned USJFCOM have been partially filled by the expan-sion of Navy Cyber Forces. However, reflecting on recovery progress of other Virginia cities, HamptonRoads has seen the smallest percentage increase in GDP, increases in credit delinquencies, and stillheavy dependence on defense spending.
Market ConditionsEndogenous shocks that occurred in the end of 2011 will likely be felt into 2012, decelerating forwardprogress. Tour activity has been extremely active with a major increase in defense contractors shop-ping for space. The expansion of Navy Cyber Forces has caught the eye of technology firms-one indus-try which Hampton Roads lacks. Although the activity looks promising, the area has just witnessed amajor outflow of tenants.Current tenants in the mar-ket are taking advantageof vacancies and consoli-dating offices, others arelooking to relocate to moredesirable properties.
Although major steps havebeen taken to improve thelocal economy, HamptonRoads relies on two indus-tries: defense and ship-ping. Past events haveproven that one pen strokecan severely impair thearea’s economic vitalityand Hampton Roads is notout of the woods yet. Current plans to relocate one of the area’s three carrier divisions to Florida hasthe possibility of removing 6,000 jobs and $425 million in annual revenue. Green Mountain Coffeerecently opened a facility in Isle of Wright, but rumors are circulating that they will be losing their patentfor the K-Cup instant-brew packaging in 2013, which may severely affect their revenue if other coffeecompanies can now compete with Green Mountain lines.
Key Market Indicators
Supply 30,934,900 sf
Direct vacancy rate 13.5 %
Total vacancy rate 13.9%
Under construction (% preleased) 262,289sf
Leasing activity 12 mo. % change 10.2%
YTD net absorption 44,306 sf
12-month overall rent % change -4.1%
Class A overall asking rent $21.27 psf
Class B overall asking rent $16.48 psf
12-month forecast
Pric
ing
Dem
and
Supp
ly
STILL KICKING THE CAN DOWNHAMPTON ROADS
20
12
OFFIC
E
41
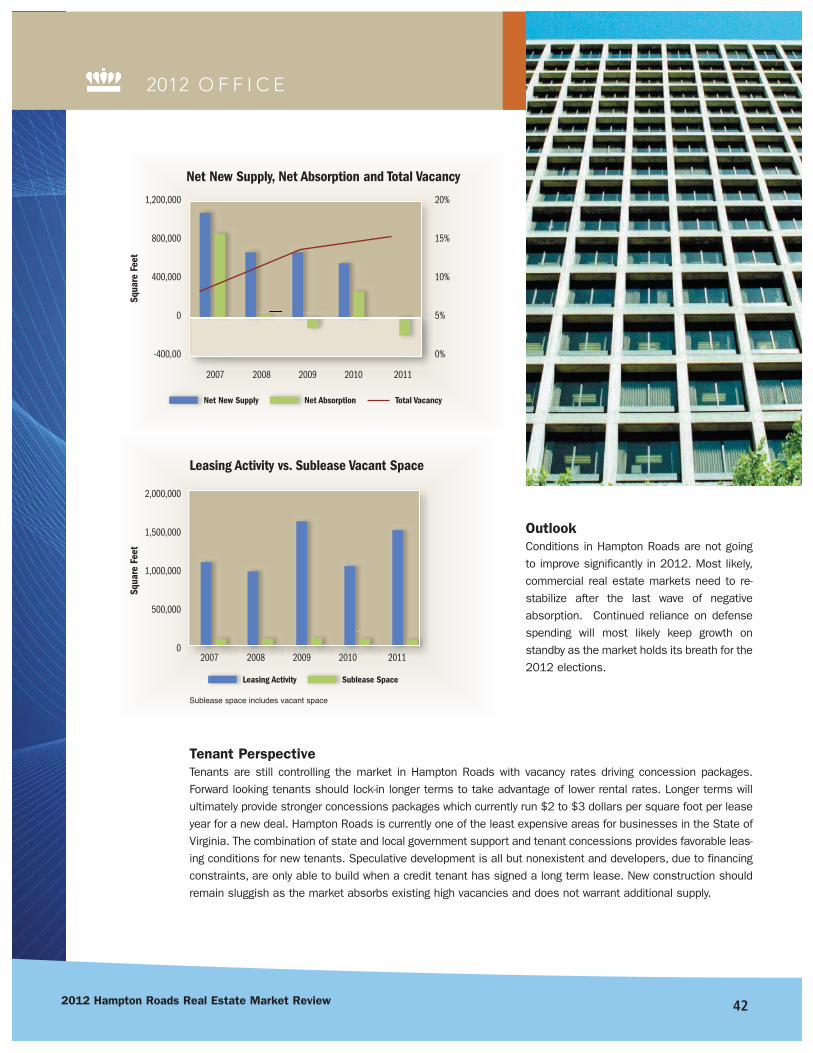
422012 Hampton Roads Real Estate Market Review
2012 O F F I C E
OutlookConditions in Hampton Roads are not goingto improve significantly in 2012. Most likely,commercial real estate markets need to re-stabilize after the last wave of negativeabsorption. Continued reliance on defensespending will most likely keep growth onstandby as the market holds its breath for the2012 elections.
Tenant PerspectiveTenants are still controlling the market in Hampton Roads with vacancy rates driving concession packages.Forward looking tenants should lock-in longer terms to take advantage of lower rental rates. Longer terms willultimately provide stronger concessions packages which currently run $2 to $3 dollars per square foot per leaseyear for a new deal. Hampton Roads is currently one of the least expensive areas for businesses in the State ofVirginia. The combination of state and local government support and tenant concessions provides favorable leas-ing conditions for new tenants. Speculative development is all but nonexistent and developers, due to financingconstraints, are only able to build when a credit tenant has signed a long term lease. New construction shouldremain sluggish as the market absorbs existing high vacancies and does not warrant additional supply.
20%
15%
10%
5%
0%
1,200,000
800,000
400,000
0
-400,00
Net New Supply, Net Absorption and Total Vacancy
2007 2008 2009 2010 2011
Net New Supply Net Absorption Total Vacancy
Squa
re F
eet
2,000,000
1,500,000
1,000,000
500,000
02007 2008 2009 2010 2011
Leasing Activity Sublease Space
Leasing Activity vs. Sublease Vacant Space
Squa
re F
eet
Sublease space includes vacant space
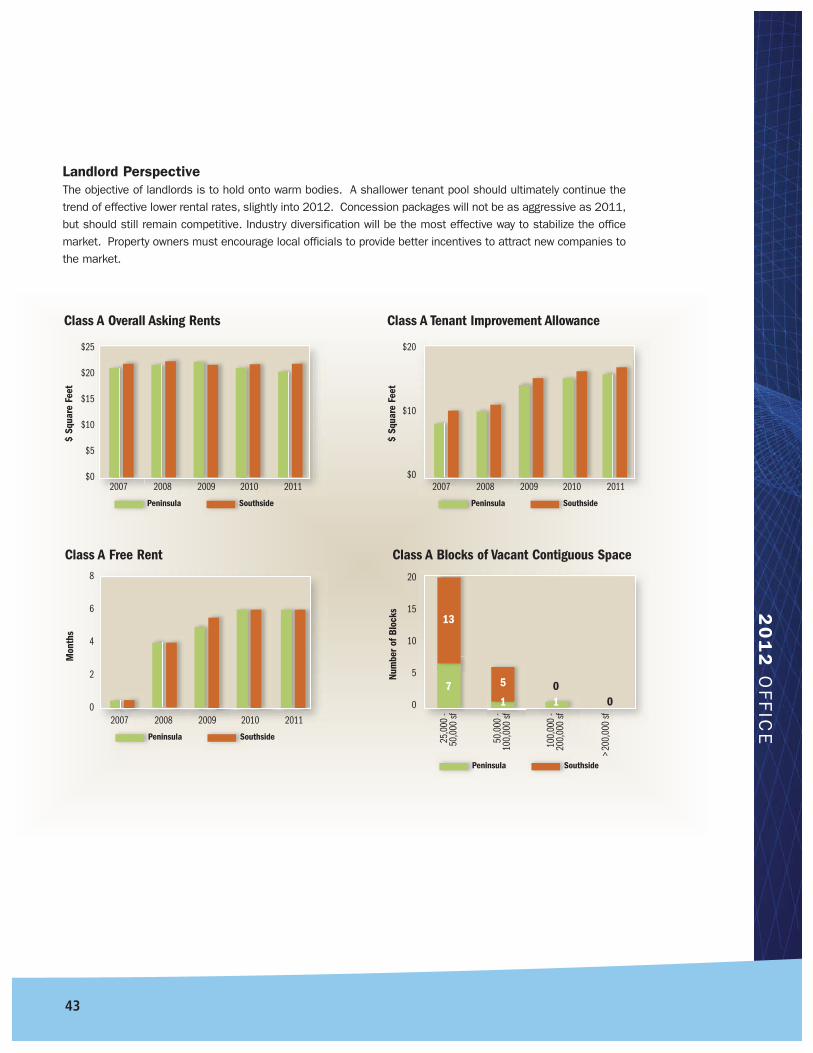
20
12
OFFIC
E
43
Landlord PerspectiveThe objective of landlords is to hold onto warm bodies. A shallower tenant pool should ultimately continue thetrend of effective lower rental rates, slightly into 2012. Concession packages will not be as aggressive as 2011,but should still remain competitive. Industry diversification will be the most effective way to stabilize the officemarket. Property owners must encourage local officials to provide better incentives to attract new companies tothe market.
$25
$20
$15
$10
$5
$0
$20
$10
$0
$ Sq
uare
Fee
t
$ Sq
uare
Fee
t
2007 2008 2009 2010 2011 2007 2008 2009 2010 2011
Peninsula Southside Peninsula Southside
Class A Overall Asking Rents Class A Tenant Improvement Allowance
8
6
4
2
0
20
15
10
5
0
Mon
ths
Num
ber o
f Blo
cks
2007 2008 2009 2010 2011
25,0
00 -
50,0
00 sf
50,0
00 -
100,
000
sf
100,
000
-20
0,00
0 sf
>200
,000
sf
Peninsula Southside
Peninsula Southside
Class A Free Rent Class A Blocks of Vacant Contiguous Space
13
7 5
10
01
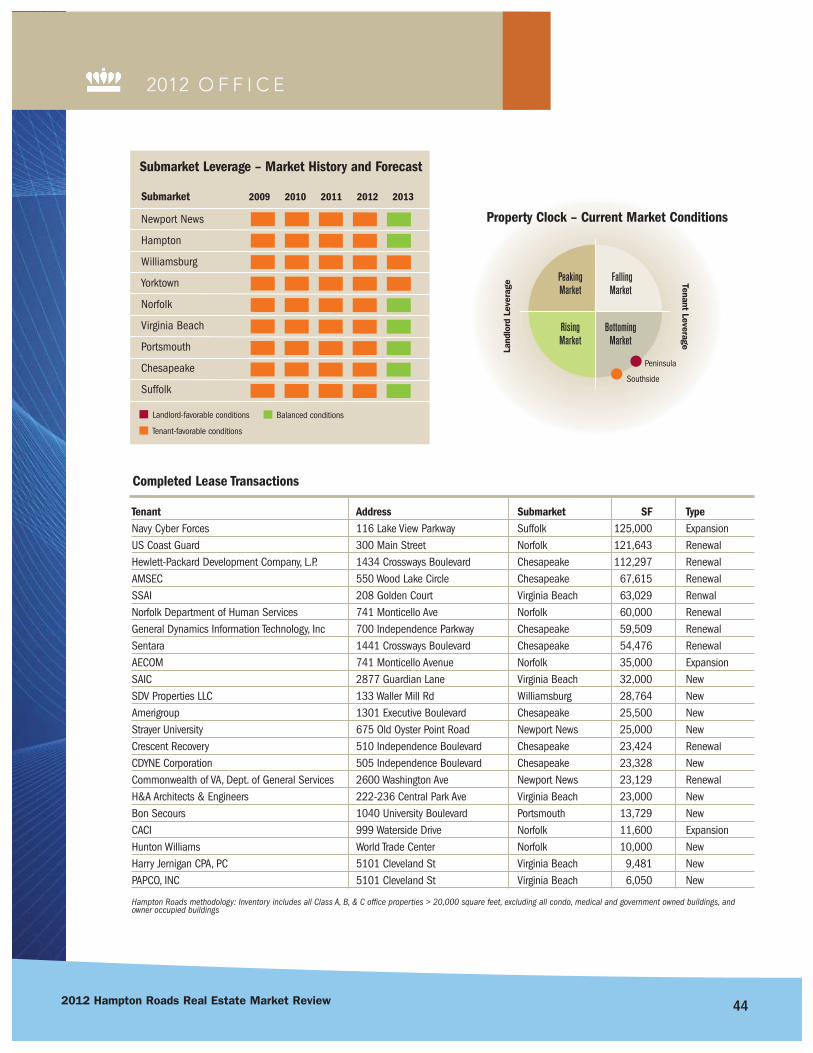
442012 Hampton Roads Real Estate Market Review
2012 O F F I C E
Submarket Leverage – Market History and Forecast
Landlord-favorable conditions
Tenant-favorable conditions
Balanced conditions
Property Clock – Current Market Conditions
Land
lord
Lev
erag
e Tenant Leverage
PeakingMarket
FallingMarket
RisingMarket
BottomingMarket
Peninsula
Southside
Submarket 2009 2010 2011 2012 2013
Newport News
Hampton
Williamsburg
Yorktown
Norfolk
Virginia Beach
Portsmouth
Chesapeake
Suffolk
Completed Lease Transactions
Tenant Address Submarket SF TypeNavy Cyber Forces 116 Lake View Parkway Suffolk 125,000 ExpansionUS Coast Guard 300 Main Street Norfolk 121,643 Renewal Hewlett-Packard Development Company, L.P. 1434 Crossways Boulevard Chesapeake 112,297 Renewal AMSEC 550 Wood Lake Circle Chesapeake 67,615 Renewal SSAI 208 Golden Court Virginia Beach 63,029 RenwalNorfolk Department of Human Services 741 Monticello Ave Norfolk 60,000 Renewal General Dynamics Information Technology, Inc 700 Independence Parkway Chesapeake 59,509 RenewalSentara 1441 Crossways Boulevard Chesapeake 54,476 RenewalAECOM 741 Monticello Avenue Norfolk 35,000 ExpansionSAIC 2877 Guardian Lane Virginia Beach 32,000 NewSDV Properties LLC 133 Waller Mill Rd Williamsburg 28,764 NewAmerigroup 1301 Executive Boulevard Chesapeake 25,500 NewStrayer University 675 Old Oyster Point Road Newport News 25,000 NewCrescent Recovery 510 Independence Boulevard Chesapeake 23,424 RenewalCDYNE Corporation 505 Independence Boulevard Chesapeake 23,328 NewCommonwealth of VA, Dept. of General Services 2600 Washington Ave Newport News 23,129 Renewal H&A Architects & Engineers 222-236 Central Park Ave Virginia Beach 23,000 NewBon Secours 1040 University Boulevard Portsmouth 13,729 NewCACI 999 Waterside Drive Norfolk 11,600 ExpansionHunton Williams World Trade Center Norfolk 10,000 New Harry Jernigan CPA, PC 5101 Cleveland St Virginia Beach 9,481 NewPAPCO, INC 5101 Cleveland St Virginia Beach 6,050 New
Hampton Roads methodology: Inventory includes all Class A, B, & C office properties > 20,000 square feet, excluding all condo, medical and government owned buildings, andowner occupied buildings
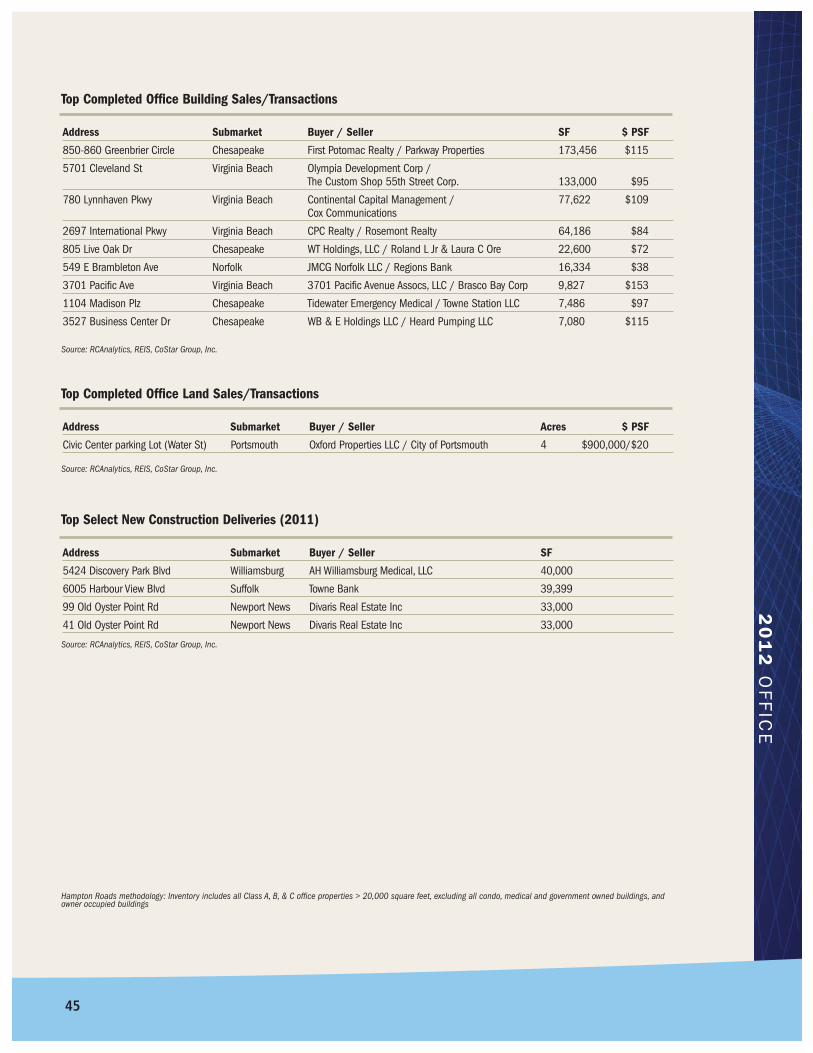
20
12
OFFIC
E
Top Completed Office Building Sales/Transactions
Address Submarket Buyer / Seller SF $ PSF
850-860 Greenbrier Circle Chesapeake First Potomac Realty / Parkway Properties 173,456 $115
5701 Cleveland St Virginia Beach Olympia Development Corp / The Custom Shop 55th Street Corp. 133,000 $95
780 Lynnhaven Pkwy Virginia Beach Continental Capital Management / 77,622 $109Cox Communications
2697 International Pkwy Virginia Beach CPC Realty / Rosemont Realty 64,186 $84
805 Live Oak Dr Chesapeake WT Holdings, LLC / Roland L Jr & Laura C Ore 22,600 $72
549 E Brambleton Ave Norfolk JMCG Norfolk LLC / Regions Bank 16,334 $38
3701 Pacific Ave Virginia Beach 3701 Pacific Avenue Assocs, LLC / Brasco Bay Corp 9,827 $153
1104 Madison Plz Chesapeake Tidewater Emergency Medical / Towne Station LLC 7,486 $97
3527 Business Center Dr Chesapeake WB & E Holdings LLC / Heard Pumping LLC 7,080 $115
Source: RCAnalytics, REIS, CoStar Group, Inc.
Top Completed Office Land Sales/Transactions
Address Submarket Buyer / Seller Acres $ PSF
Civic Center parking Lot (Water St) Portsmouth Oxford Properties LLC / City of Portsmouth 4 $900,000/$20
Top Select New Construction Deliveries (2011)
Address Submarket Buyer / Seller SF
5424 Discovery Park Blvd Williamsburg AH Williamsburg Medical, LLC 40,000
6005 Harbour View Blvd Suffolk Towne Bank 39,399
99 Old Oyster Point Rd Newport News Divaris Real Estate Inc 33,000
41 Old Oyster Point Rd Newport News Divaris Real Estate Inc 33,000
Source: RCAnalytics, REIS, CoStar Group, Inc.
Source: RCAnalytics, REIS, CoStar Group, Inc.
Hampton Roads methodology: Inventory includes all Class A, B, & C office properties > 20,000 square feet, excluding all condo, medical and government owned buildings, andowner occupied buildings
45
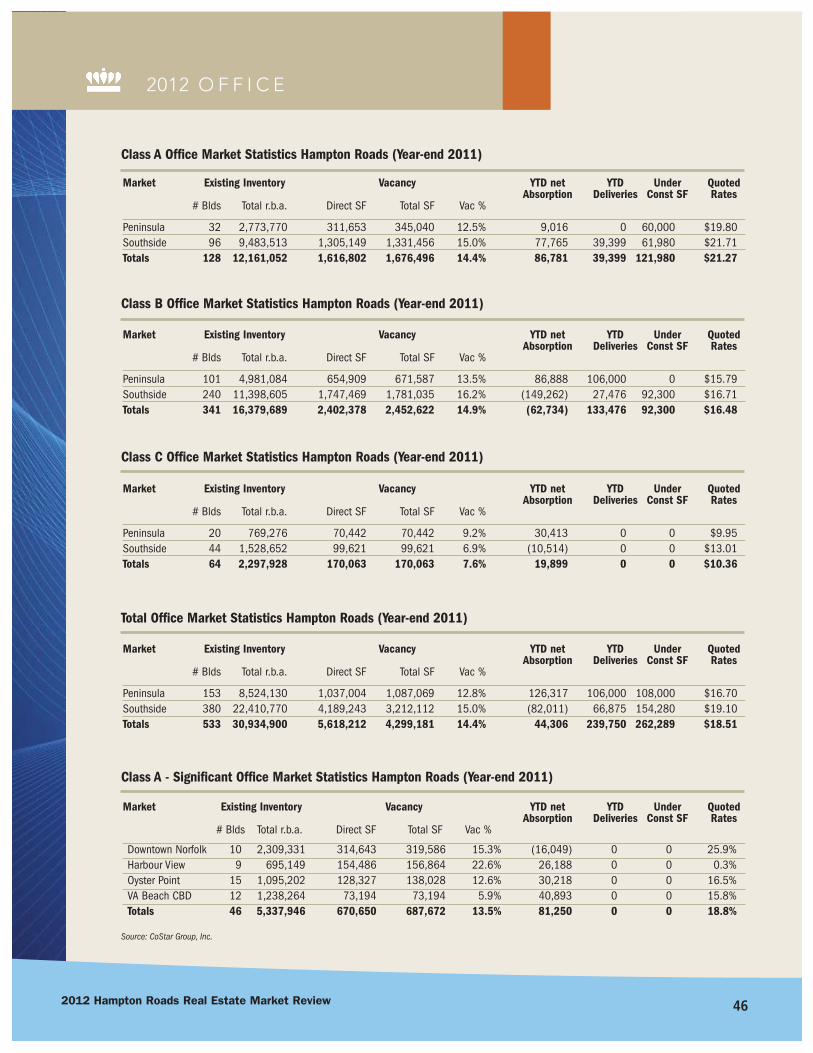
462012 Hampton Roads Real Estate Market Review
2012 O F F I C E
Class A Office Market Statistics Hampton Roads (Year-end 2011)
Market Existing Inventory Vacancy YTD net YTD Under QuotedAbsorption Deliveries Const SF Rates
# Blds Total r.b.a. Direct SF Total SF Vac %
Peninsula 32 2,773,770 311,653 345,040 12.5% 9,016 0 60,000 $19.80Southside 96 9,483,513 1,305,149 1,331,456 15.0% 77,765 39,399 61,980 $21.71Totals 128 12,161,052 1,616,802 1,676,496 14.4% 86,781 39,399 121,980 $21.27
Class B Office Market Statistics Hampton Roads (Year-end 2011)
Market Existing Inventory Vacancy YTD net YTD Under QuotedAbsorption Deliveries Const SF Rates
# Blds Total r.b.a. Direct SF Total SF Vac %
Peninsula 101 4,981,084 654,909 671,587 13.5% 86,888 106,000 0 $15.79Southside 240 11,398,605 1,747,469 1,781,035 16.2% (149,262) 27,476 92,300 $16.71Totals 341 16,379,689 2,402,378 2,452,622 14.9% (62,734) 133,476 92,300 $16.48
Class C Office Market Statistics Hampton Roads (Year-end 2011)
Market Existing Inventory Vacancy YTD net YTD Under QuotedAbsorption Deliveries Const SF Rates
# Blds Total r.b.a. Direct SF Total SF Vac %
Peninsula 20 769,276 70,442 70,442 9.2% 30,413 0 0 $9.95Southside 44 1,528,652 99,621 99,621 6.9% (10,514) 0 0 $13.01Totals 64 2,297,928 170,063 170,063 7.6% 19,899 0 0 $10.36
Total Office Market Statistics Hampton Roads (Year-end 2011)
Market Existing Inventory Vacancy YTD net YTD Under QuotedAbsorption Deliveries Const SF Rates
# Blds Total r.b.a. Direct SF Total SF Vac %
Peninsula 153 8,524,130 1,037,004 1,087,069 12.8% 126,317 106,000 108,000 $16.70Southside 380 22,410,770 4,189,243 3,212,112 15.0% (82,011) 66,875 154,280 $19.10Totals 533 30,934,900 5,618,212 4,299,181 14.4% 44,306 239,750 262,289 $18.51
Source: CoStar Group, Inc.
Class A - Significant Office Market Statistics Hampton Roads (Year-end 2011)
Market Existing Inventory Vacancy YTD net YTD Under QuotedAbsorption Deliveries Const SF Rates
# Blds Total r.b.a. Direct SF Total SF Vac %
Downtown NorfolkHarbour ViewOyster PointVA Beach CBDTotals
2,309,331695,149
1,095,2021,238,2645,337,946
314,643154,486128,327
73,194670,650
319,586156,864138,028
73,194687,672
15.3%22.6%12.6%
5.9%13.5%
(16,049)26,18830,21840,89381,250
00000
00000
25.9%0.3%
16.5%15.8%18.8%
109
151246

20
12
OFFIC
E
47
Source: CoStar Group, Inc.
Class B - Significant Office Market Statistics Hampton Roads (Year-end 2011)
Market Existing Inventory Vacancy YTD net YTD Under QuotedAbsorption Deliveries Const SF Rates
# Blds Total r.b.a. Direct SF Total SF Vac %
Downtown NorfolkHarbour ViewOyster PointVA Beach CBDTotals
2,185,124488,862
2,000,458708,701
5,383,145
565,7631,441
313,18192,888
973,273
566,9631,441
329,85996,929
995,192
25.9%0.3%
16.5%15.8%18.8%
(51,135)12,95928,374
(63,554)(73,356)
066,000
00
66,000
00000
$16.71$26.00$15.87$17.22$16.55
289
421897
Source: CoStar Group, Inc.
Class C - Significant Office Market Statistics Hampton Roads (Year-end 2011)
Market Existing Inventory Vacancy YTD net YTD Under QuotedAbsorption Deliveries Const SF Rates
# Blds Total r.b.a. Direct SF Total SF Vac %
Downtown NorfolkHarbour ViewOyster PointVA Beach CBDTotals
236,1990
171,6730
407,872
31,0000
5,9320
36,932
31,0000
5,9320
36,932
13.1%0.0%3.5%0.0%9.1%
00
2,6720
2,672
00000
00000
NANA
$14.75N/A
$14.75
6060
12
Source: CoStar Group, Inc.
Significant Office Market Statistics Hampton Roads (Year-end 2011)
Market Existing Inventory Vacancy YTD net YTD Under QuotedAbsorption Deliveries Const SF Rates
# Blds Total r.b.a. Direct SF Total SF Vac %
Downtown NorfolkHarbour ViewOyster PointVA Beach CBDTotals
4,730,6541,184,0113,267,3331,946,965
11,128,963
911,406155,927447,440166,082
1,680,855
917,549158,305473,819170,123
1,719,796
20.1%13.4%14.5%
9.5%15.9%
(67,184)39,13761,264
(22,661)10,566
00
66,0000
66,000
00000
$19.38$24.11$17.14$19.84$19.36
44186330
155
REGIONAL OFFICE MARKET COMPARISONThe relative vitality of the Hampton Roads office market can be more clearly illustrated by comparing the area’s2011 performance to the nearby Virginia markets of Richmond, the District of Columbia, as well as the NorthCarolina markets of Raleigh-Durham and Charlotte. Clearly our regional competitive areas fared well in compari-son to the United States’ national office vacancy rate.
Q4 2011 DATA — FROM COSTAR OFFICE MARKET REPORTThe office vacancy rate in the Richmond, VA office market area ended the year at a direct vacancy of 10.9% andtotal vacancy of 11.8%. In Raleigh-Durham, NC the market closed the year at 16.0% direct and 16.8% total. TheCharlotte, NC market finished at 16.8% direct and 18.1% total. And finally the office vacancy rate in the Districtof Columbia (Washington D.C.) office market finished 2011 at 13.0% direct vacancy and 14.2% total.
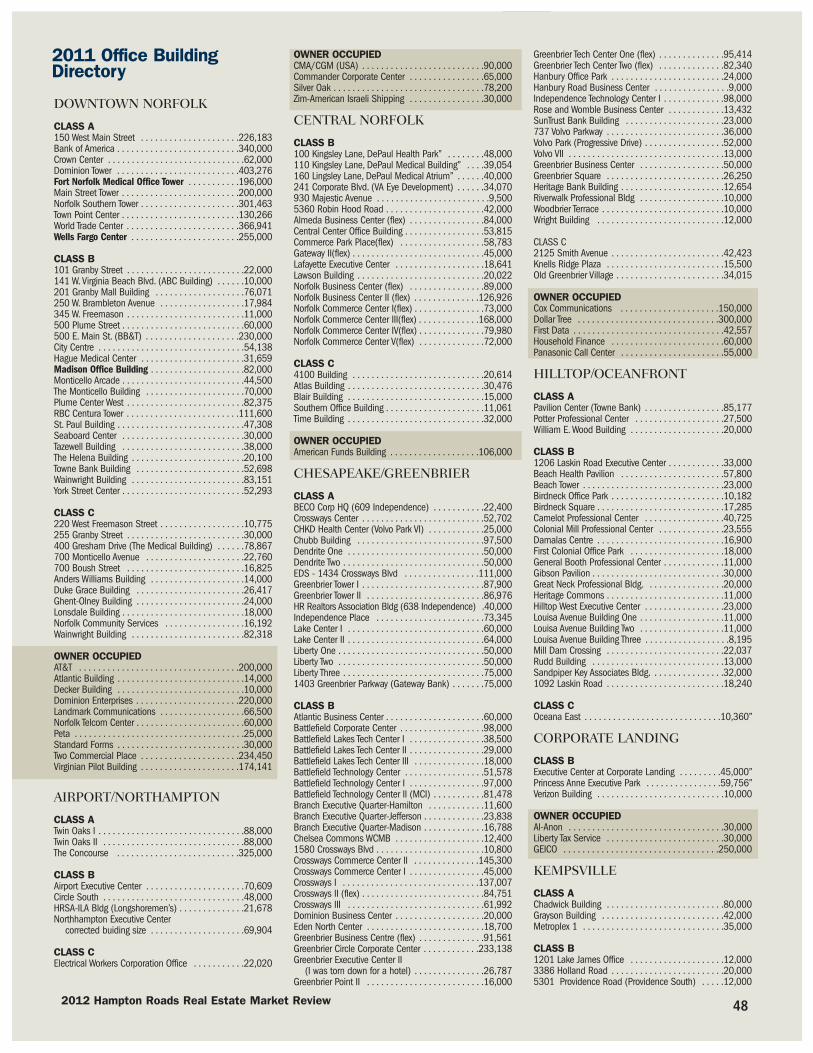
DOWNTOWN NORFOLK
CLASS A150 West Main Street . . . . . . . . . . . . . . . . . . . . .226,183 Bank of America . . . . . . . . . . . . . . . . . . . . . . . . . .340,000 Crown Center . . . . . . . . . . . . . . . . . . . . . . . . . . . . .62,000 Dominion Tower . . . . . . . . . . . . . . . . . . . . . . . . . .403,276 Fort Norfolk Medical Office Tower . . . . . . . . . . .196,000 Main Street Tower . . . . . . . . . . . . . . . . . . . . . . . . .200,000 Norfolk Southern Tower . . . . . . . . . . . . . . . . . . . . .301,463 Town Point Center . . . . . . . . . . . . . . . . . . . . . . . . .130,266 World Trade Center . . . . . . . . . . . . . . . . . . . . . . . .366,941 Wells Fargo Center . . . . . . . . . . . . . . . . . . . . . . .255,000
CLASS B101 Granby Street . . . . . . . . . . . . . . . . . . . . . . . . .22,000 141 W. Virginia Beach Blvd. (ABC Building) . . . . . .10,000 201 Granby Mall Building . . . . . . . . . . . . . . . . . . .76,071 250 W. Brambleton Avenue . . . . . . . . . . . . . . . . . .17,984 345 W. Freemason . . . . . . . . . . . . . . . . . . . . . . . . .11,000 500 Plume Street . . . . . . . . . . . . . . . . . . . . . . . . . .60,000 500 E. Main St. (BB&T) . . . . . . . . . . . . . . . . . . . .230,000 City Centre . . . . . . . . . . . . . . . . . . . . . . . . . . . . . . .54,138 Hague Medical Center . . . . . . . . . . . . . . . . . . . . . .31,659 Madison Office Building . . . . . . . . . . . . . . . . . . . .82,000 Monticello Arcade . . . . . . . . . . . . . . . . . . . . . . . . . .44,500 The Monticello Building . . . . . . . . . . . . . . . . . . . . .70,000 Plume Center West . . . . . . . . . . . . . . . . . . . . . . . . .82,375 RBC Centura Tower . . . . . . . . . . . . . . . . . . . . . . . .111,600 St. Paul Building . . . . . . . . . . . . . . . . . . . . . . . . . . .47,308 Seaboard Center . . . . . . . . . . . . . . . . . . . . . . . . . .30,000 Tazewell Building . . . . . . . . . . . . . . . . . . . . . . . . . .38,000 The Helena Building . . . . . . . . . . . . . . . . . . . . . . . .20,100 Towne Bank Building . . . . . . . . . . . . . . . . . . . . . . .52,698 Wainwright Building . . . . . . . . . . . . . . . . . . . . . . . .83,151 York Street Center . . . . . . . . . . . . . . . . . . . . . . . . . .52,293
CLASS C220 West Freemason Street . . . . . . . . . . . . . . . . . .10,775 255 Granby Street . . . . . . . . . . . . . . . . . . . . . . . . .30,000 400 Gresham Drive (The Medical Building) . . . . . .78,867 700 Monticello Avenue . . . . . . . . . . . . . . . . . . . . .22,760 700 Boush Street . . . . . . . . . . . . . . . . . . . . . . . . .16,825 Anders Williams Building . . . . . . . . . . . . . . . . . . . .14,000 Duke Grace Building . . . . . . . . . . . . . . . . . . . . . . .26,417 Ghent-Olney Building . . . . . . . . . . . . . . . . . . . . . . .24,000 Lonsdale Building . . . . . . . . . . . . . . . . . . . . . . . . . .18,000 Norfolk Community Services . . . . . . . . . . . . . . . . .16,192 Wainwright Building . . . . . . . . . . . . . . . . . . . . . . . .82,318
OWNER OCCUPIEDAT&T . . . . . . . . . . . . . . . . . . . . . . . . . . . . . . . . . .200,000 Atlantic Building . . . . . . . . . . . . . . . . . . . . . . . . . . .14,000 Decker Building . . . . . . . . . . . . . . . . . . . . . . . . . . .10,000 Dominion Enterprises . . . . . . . . . . . . . . . . . . . . . .220,000 Landmark Communications . . . . . . . . . . . . . . . . . .66,500 Norfolk Telcom Center . . . . . . . . . . . . . . . . . . . . . . .60,000 Peta . . . . . . . . . . . . . . . . . . . . . . . . . . . . . . . . . . . .25,000 Standard Forms . . . . . . . . . . . . . . . . . . . . . . . . . . .30,000 Two Commercial Place . . . . . . . . . . . . . . . . . . . . .234,450 Virginian Pilot Building . . . . . . . . . . . . . . . . . . . . .174,141
AIRPORT/NORTHAMPTON
CLASS ATwin Oaks I . . . . . . . . . . . . . . . . . . . . . . . . . . . . . . .88,000 Twin Oaks II . . . . . . . . . . . . . . . . . . . . . . . . . . . . . .88,000 The Concourse . . . . . . . . . . . . . . . . . . . . . . . . . .325,000
CLASS BAirport Executive Center . . . . . . . . . . . . . . . . . . . . .70,609 Circle South . . . . . . . . . . . . . . . . . . . . . . . . . . . . . .48,000 HRSA-ILA Bldg (Longshoremen’s) . . . . . . . . . . . . . .21,678 Northhampton Executive Center
corrected buiding size . . . . . . . . . . . . . . . . . . . .69,904
CLASS CElectrical Workers Corporation Office . . . . . . . . . . .22,020
OWNER OCCUPIEDCMA/CGM (USA) . . . . . . . . . . . . . . . . . . . . . . . . . .90,000 Commander Corporate Center . . . . . . . . . . . . . . . .65,000 Silver Oak . . . . . . . . . . . . . . . . . . . . . . . . . . . . . . . .78,200 Zim-American Israeli Shipping . . . . . . . . . . . . . . . .30,000
CENTRAL NORFOLK
CLASS B100 Kingsley Lane, DePaul Health Park” . . . . . . . .48,000 110 Kingsley Lane, DePaul Medical Building” . . . .39,054 160 Lingsley Lane, DePaul Medical Atrium” . . . . . .40,000 241 Corporate Blvd. (VA Eye Development) . . . . . .34,070 930 Majestic Avenue . . . . . . . . . . . . . . . . . . . . . . . .9,500 5360 Robin Hood Road . . . . . . . . . . . . . . . . . . . . .42,000 Almeda Business Center (flex) . . . . . . . . . . . . . . . .84,000 Central Center Office Building . . . . . . . . . . . . . . . . .53,815 Commerce Park Place(flex) . . . . . . . . . . . . . . . . . .58,783 Gateway II(flex) . . . . . . . . . . . . . . . . . . . . . . . . . . . .45,000 Lafayette Executive Center . . . . . . . . . . . . . . . . . . .18,641 Lawson Building . . . . . . . . . . . . . . . . . . . . . . . . . . .20,022 Norfolk Business Center (flex) . . . . . . . . . . . . . . . .89,000 Norfolk Business Center II (flex) . . . . . . . . . . . . . .126,926 Norfolk Commerce Center I(flex) . . . . . . . . . . . . . . .73,000 Norfolk Commerce Center III(flex) . . . . . . . . . . . . .168,000 Norfolk Commerce Center IV(flex) . . . . . . . . . . . . . .79,980 Norfolk Commerce Center V(flex) . . . . . . . . . . . . . .72,000
CLASS C4100 Building . . . . . . . . . . . . . . . . . . . . . . . . . . . .20,614 Atlas Building . . . . . . . . . . . . . . . . . . . . . . . . . . . . .30,476 Blair Building . . . . . . . . . . . . . . . . . . . . . . . . . . . . .15,000 Southern Office Building . . . . . . . . . . . . . . . . . . . . .11,061 Time Building . . . . . . . . . . . . . . . . . . . . . . . . . . . . .32,000
OWNER OCCUPIEDAmerican Funds Building . . . . . . . . . . . . . . . . . . .106,000
CHESAPEAKE/GREENBRIER
CLASS ABECO Corp HQ (609 Independence) . . . . . . . . . . .22,400 Crossways Center . . . . . . . . . . . . . . . . . . . . . . . . . .52,702 CHKD Health Center (Volvo Park VI) . . . . . . . . . . . .25,000 Chubb Building . . . . . . . . . . . . . . . . . . . . . . . . . . .97,500 Dendrite One . . . . . . . . . . . . . . . . . . . . . . . . . . . . .50,000 Dendrite Two . . . . . . . . . . . . . . . . . . . . . . . . . . . . . .50,000 EDS - 1434 Crossways Blvd . . . . . . . . . . . . . . . .111,000 Greenbrier Tower I . . . . . . . . . . . . . . . . . . . . . . . . . .87,900 Greenbrier Tower II . . . . . . . . . . . . . . . . . . . . . . . . .86,976 HR Realtors Association Bldg (638 Independence) .40,000 Independence Place . . . . . . . . . . . . . . . . . . . . . . .73,345 Lake Center I . . . . . . . . . . . . . . . . . . . . . . . . . . . . .60,000 Lake Center II . . . . . . . . . . . . . . . . . . . . . . . . . . . . .64,000 Liberty One . . . . . . . . . . . . . . . . . . . . . . . . . . . . . . .50,000 Liberty Two . . . . . . . . . . . . . . . . . . . . . . . . . . . . . . .50,000 Liberty Three . . . . . . . . . . . . . . . . . . . . . . . . . . . . . .75,000 1403 Greenbrier Parkway (Gateway Bank) . . . . . . .75,000
CLASS BAtlantic Business Center . . . . . . . . . . . . . . . . . . . . .60,000 Battlefield Corporate Center . . . . . . . . . . . . . . . . . .98,000 Battlefield Lakes Tech Center I . . . . . . . . . . . . . . . .38,500 Battlefield Lakes Tech Center II . . . . . . . . . . . . . . . .29,000 Battlefield Lakes Tech Center III . . . . . . . . . . . . . . .18,000 Battlefield Technology Center . . . . . . . . . . . . . . . . .51,578 Battlefield Technology Center I . . . . . . . . . . . . . . . .97,000 Battlefield Technology Center II (MCI) . . . . . . . . . . .81,478 Branch Executive Quarter-Hamilton . . . . . . . . . . . .11,600 Branch Executive Quarter-Jefferson . . . . . . . . . . . . .23,838 Branch Executive Quarter-Madison . . . . . . . . . . . . .16,788 Chelsea Commons WCMB . . . . . . . . . . . . . . . . . . .12,400 1580 Crossways Blvd . . . . . . . . . . . . . . . . . . . . . . .10,800 Crossways Commerce Center II . . . . . . . . . . . . . .145,300 Crossways Commerce Center I . . . . . . . . . . . . . . . .45,000 Crossways I . . . . . . . . . . . . . . . . . . . . . . . . . . . . .137,007 Crossways II (flex) . . . . . . . . . . . . . . . . . . . . . . . . . .84,751 Crossways III . . . . . . . . . . . . . . . . . . . . . . . . . . . . .61,992 Dominion Business Center . . . . . . . . . . . . . . . . . . .20,000 Eden North Center . . . . . . . . . . . . . . . . . . . . . . . . .18,700 Greenbrier Business Centre (flex) . . . . . . . . . . . . . .91,561 Greenbrier Circle Corporate Center . . . . . . . . . . . .233,138 Greenbrier Executive Center II
(I was torn down for a hotel) . . . . . . . . . . . . . . .26,787 Greenbrier Point II . . . . . . . . . . . . . . . . . . . . . . . . .16,000
Greenbrier Tech Center One (flex) . . . . . . . . . . . . . .95,414 Greenbrier Tech Center Two (flex) . . . . . . . . . . . . . .82,340 Hanbury Office Park . . . . . . . . . . . . . . . . . . . . . . . .24,000 Hanbury Road Business Center . . . . . . . . . . . . . . . .9,000 Independence Technology Center I . . . . . . . . . . . . .98,000 Rose and Womble Business Center . . . . . . . . . . . .13,432 SunTrust Bank Building . . . . . . . . . . . . . . . . . . . . .23,000 737 Volvo Parkway . . . . . . . . . . . . . . . . . . . . . . . . .36,000 Volvo Park (Progressive Drive) . . . . . . . . . . . . . . . . .52,000 Volvo VII . . . . . . . . . . . . . . . . . . . . . . . . . . . . . . . . .13,000 Greenbrier Business Center . . . . . . . . . . . . . . . . . .50,000 Greenbrier Square . . . . . . . . . . . . . . . . . . . . . . . . .26,250 Heritage Bank Building . . . . . . . . . . . . . . . . . . . . . .12,654 Riverwalk Professional Bldg . . . . . . . . . . . . . . . . . .10,000 Woodbrier Terrace . . . . . . . . . . . . . . . . . . . . . . . . . .10,000 Wright Building . . . . . . . . . . . . . . . . . . . . . . . . . . .12,000
CLASS C2125 Smith Avenue . . . . . . . . . . . . . . . . . . . . . . . .42,423 Knells Ridge Plaza . . . . . . . . . . . . . . . . . . . . . . . . .15,500 Old Greenbrier Village . . . . . . . . . . . . . . . . . . . . . . .34,015
OWNER OCCUPIEDCox Communications . . . . . . . . . . . . . . . . . . . . .150,000 Dollar Tree . . . . . . . . . . . . . . . . . . . . . . . . . . . . . .300,000 First Data . . . . . . . . . . . . . . . . . . . . . . . . . . . . . . . .42,557 Household Finance . . . . . . . . . . . . . . . . . . . . . . . .60,000 Panasonic Call Center . . . . . . . . . . . . . . . . . . . . . .55,000
HILLTOP/OCEANFRONT
CLASS APavilion Center (Towne Bank) . . . . . . . . . . . . . . . . .85,177 Potter Professional Center . . . . . . . . . . . . . . . . . . .27,500 William E. Wood Building . . . . . . . . . . . . . . . . . . . .20,000
CLASS B1206 Laskin Road Executive Center . . . . . . . . . . . .33,000 Beach Health Pavilion . . . . . . . . . . . . . . . . . . . . . .57,800 Beach Tower . . . . . . . . . . . . . . . . . . . . . . . . . . . . . .23,000 Birdneck Office Park . . . . . . . . . . . . . . . . . . . . . . . .10,182 Birdneck Square . . . . . . . . . . . . . . . . . . . . . . . . . . .17,285 Camelot Professional Center . . . . . . . . . . . . . . . . .40,725 Colonial Mill Professional Center . . . . . . . . . . . . . .23,555 Damalas Centre . . . . . . . . . . . . . . . . . . . . . . . . . . .16,900 First Colonial Office Park . . . . . . . . . . . . . . . . . . . .18,000 General Booth Professional Center . . . . . . . . . . . . .11,000 Gibson Pavilion . . . . . . . . . . . . . . . . . . . . . . . . . . . .30,000 Great Neck Professional Bldg. . . . . . . . . . . . . . . . .20,000 Heritage Commons . . . . . . . . . . . . . . . . . . . . . . . . .11,000 Hilltop West Executive Center . . . . . . . . . . . . . . . . .23,000 Louisa Avenue Building One . . . . . . . . . . . . . . . . . .11,000 Louisa Avenue Building Two . . . . . . . . . . . . . . . . . .11,000 Louisa Avenue Building Three . . . . . . . . . . . . . . . . . .8,195 Mill Dam Crossing . . . . . . . . . . . . . . . . . . . . . . . . .22,037 Rudd Building . . . . . . . . . . . . . . . . . . . . . . . . . . . .13,000 Sandpiper Key Associates Bldg. . . . . . . . . . . . . . . .32,000 1092 Laskin Road . . . . . . . . . . . . . . . . . . . . . . . . .18,240
CLASS COceana East . . . . . . . . . . . . . . . . . . . . . . . . . . . . .10,360”
CORPORATE LANDING
CLASS BExecutive Center at Corporate Landing . . . . . . . . .45,000”Princess Anne Executive Park . . . . . . . . . . . . . . . .59,756”Verizon Building . . . . . . . . . . . . . . . . . . . . . . . . . . .10,000
OWNER OCCUPIEDAl-Anon . . . . . . . . . . . . . . . . . . . . . . . . . . . . . . . . .30,000 Liberty Tax Service . . . . . . . . . . . . . . . . . . . . . . . . .30,000 GEICO . . . . . . . . . . . . . . . . . . . . . . . . . . . . . . . . .250,000
KEMPSVILLE
CLASS AChadwick Building . . . . . . . . . . . . . . . . . . . . . . . . .80,000 Grayson Building . . . . . . . . . . . . . . . . . . . . . . . . . .42,000 Metroplex 1 . . . . . . . . . . . . . . . . . . . . . . . . . . . . . .35,000
CLASS B1201 Lake James Office . . . . . . . . . . . . . . . . . . . .12,000 3386 Holland Road . . . . . . . . . . . . . . . . . . . . . . . .20,000 5301 Providence Road (Providence South) . . . . .12,000
2011 Office Building Directory
2012 Hampton Roads Real Estate Market Review 48

Arrowhead Office Court . . . . . . . . . . . . . . . . . . . . . .10,000 Atrium of College Park Square . . . . . . . . . . . . . . . .36,379 Central Park I (552 Central Dr) . . . . . . . . . . . . . . . .18,000 Central Park II (544 Central) . . . . . . . . . . . . . . . . .43,000 College Park Square III . . . . . . . . . . . . . . . . . . . . . .30,150 Courtyard at Providence . . . . . . . . . . . . . . . . . . . .17,879 Fairfield Square . . . . . . . . . . . . . . . . . . . . . . . . . . .12,933 Holland South . . . . . . . . . . . . . . . . . . . . . . . . . . . .14,843 Holland/Taft Professional Center . . . . . . . . . . . . . .11,850 Kempsville Office Park . . . . . . . . . . . . . . . . . . . . . .30,722 Oxford Square . . . . . . . . . . . . . . . . . . . . . . . . . . . .13,544 Woolpert Building . . . . . . . . . . . . . . . . . . . . . . . . . .36,700
LYNNHAVEN
CLASS AChase Building . . . . . . . . . . . . . . . . . . . . . . . . . . . .31,910 Lynnhaven Commons Complex . . . . . . . . . . . . . . .25,000 Lynnhaven Commons (office bldg) . . . . . . . . . . . . .26,000 Lynnhaven II . . . . . . . . . . . . . . . . . . . . . . . . . . . . . .36,000 Lynnwood Plaza . . . . . . . . . . . . . . . . . . . . . . . . . . .87,157 Marsh Landing . . . . . . . . . . . . . . . . . . . . . . . . . . . .62,117 Oceana Center One . . . . . . . . . . . . . . . . . . . . . . . .39,928 Oceana Place . . . . . . . . . . . . . . . . . . . . . . . . . . . . .75,369 Park West AMSEC . . . . . . . . . . . . . . . . . . . . . . . . .66,180 Pinehurst Centre . . . . . . . . . . . . . . . . . . . . . . . . .103,000 Reflections I . . . . . . . . . . . . . . . . . . . . . . . . . . . . . .62,924 Reflections II . . . . . . . . . . . . . . . . . . . . . . . . . . . . .73,676 Reflections III . . . . . . . . . . . . . . . . . . . . . . . . . . . . .67,000 Reflections IV . . . . . . . . . . . . . . . . . . . . . . . . . . . . .80,000 Viking Building . . . . . . . . . . . . . . . . . . . . . . . . . . . .18,900 Windwood Center . . . . . . . . . . . . . . . . . . . . . . . . . .78,348
CLASS B2700 International Parkway . . . . . . . . . . . . . . . . . .53,000 Advanced Technology Building . . . . . . . . . . . . . . . .32,000 Basgier Bldg. I . . . . . . . . . . . . . . . . . . . . . . . . . . . .18,200 Basgier Bldg. II . . . . . . . . . . . . . . . . . . . . . . . . . . . .20,000 Bennett Office Building (120 S. Lynnhaven) . . . . . .10,522 Commercial Place . . . . . . . . . . . . . . . . . . . . . . . . .36,400 Gateway Bank Building (641 Lynnhaven) . . . . . . . .18,000 Lynnhaven Corporate Center I . . . . . . . . . . . . . . . .36,046 Lynnhaven Corporate Center II . . . . . . . . . . . . . . . .40,300 Lynnhaven Executive Center . . . . . . . . . . . . . . . . . .18,000 Lynnhaven Five . . . . . . . . . . . . . . . . . . . . . . . . . . . .24,549 Lynnhaven North . . . . . . . . . . . . . . . . . . . . . . . . . .10,000 Lynnhaven Professional Center . . . . . . . . . . . . . . . .12,000 Lynnhaven Station . . . . . . . . . . . . . . . . . . . . . . . . .26,226 Parkway Center 3 and 4 . . . . . . . . . . . . . . . . . . . . .64,567 Parkway Center I & II . . . . . . . . . . . . . . . . . . . . . . .32,112 Parkway III (Unisys) . . . . . . . . . . . . . . . . . . . . . . . .50,428 Parkway West (flex) . . . . . . . . . . . . . . . . . . . . . . . . .41,563 RBM Building . . . . . . . . . . . . . . . . . . . . . . . . . . . . .14,170 Sabre Street I . . . . . . . . . . . . . . . . . . . . . . . . . . . . .68,000 Sabre Street II . . . . . . . . . . . . . . . . . . . . . . . . . . . .60,000 Sabre Street III . . . . . . . . . . . . . . . . . . . . . . . . . . . .40,000 Sabre Street IV . . . . . . . . . . . . . . . . . . . . . . . . . . . .40,000 South Lynnhaven Business Park . . . . . . . . . . . . . . .40,000 U.S. Commerce Center (Tidewater Tech) . . . . . . . . .26,819 Yorktown Commerce Center
(228 N. Lynnhaven) . . . . . . . . . . . . . . . . . . . . . .30,529
OWNER OCCUPIEDCenit Bank Bldg . . . . . . . . . . . . . . . . . . . . . . . . . . .40,000 Global Technical Systems . . . . . . . . . . . . . . . . . . . .46,000 Hall Automotive . . . . . . . . . . . . . . . . . . . . . . . . . . .29,865 SAIC . . . . . . . . . . . . . . . . . . . . . . . . . . . . . . . . . . . .60,000
LITTLE NECK
CLASS B3300 Building (Virginia Beach Blvd.) . . . . . . . . . . .11,000 King’s Grant Office Building . . . . . . . . . . . . . . . . . .13,000 Little Neck Office Park (3300 Bldg) . . . . . . . . . . . .33,000 Little Neck Office Park (3300 South) . . . . . . . . . . .50,000 Little Neck Office Park (3400 Bldg) . . . . . . . . . . . .22,000 Little Neck Towers . . . . . . . . . . . . . . . . . . . . . . . . . .48,860 Lynnhaven Station 101 North Lynnhaven ( . . . . . . .28,000 NEXCOM Building . . . . . . . . . . . . . . . . . . . . . . . . . .75,000 NEXCOM Expansion . . . . . . . . . . . . . . . . . . . . . . . .18,000 Plaza Trail Office Building . . . . . . . . . . . . . . . . . . . .15,975 Rose Hall Commons . . . . . . . . . . . . . . . . . . . . . . . .12,266 Rose Hall Professional Center . . . . . . . . . . . . . . . .20,000 Rosemont Interstate Center I . . . . . . . . . . . . . . . . .41,400
Rosemont Interstate Center II . . . . . . . . . . . . . . . . .51,835 Rosemont Interstate Center III* . . . . . . . . . . . . . . .38,000 Sun Building . . . . . . . . . . . . . . . . . . . . . . . . . . . . .11,600 Transouth Building (3615 VB Blvd) . . . . . . . . . . . .12,500
CLASS CBirchwood Office Park . . . . . . . . . . . . . . . . . . . . . .11,688 Byler Building . . . . . . . . . . . . . . . . . . . . . . . . . . . . .16,592
OWNER OCCUPIEDPlan-It Building . . . . . . . . . . . . . . . . . . . . . . . . . . . .24,000
MILITARY CIRCLE
CLASS ARiverside Commerce Center (120 Corporate Blvd.) 70,000 Riverside Corporate Center . . . . . . . . . . . . . . . . . . .86,682
CLASS BCentura Bank Building . . . . . . . . . . . . . . . . . . . . . .40,442 Circle East . . . . . . . . . . . . . . . . . . . . . . . . . . . . . . .41,047 College Park Executive Center . . . . . . . . . . . . . . . . .20,000 FBI Building . . . . . . . . . . . . . . . . . . . . . . . . . . . . . .50,000 I.T.T. Building . . . . . . . . . . . . . . . . . . . . . . . . . . . . . .49,379
CLASS CExecutive Office - Janaf . . . . . . . . . . . . . . . . . . . . .28,800 Janaf Office Building . . . . . . . . . . . . . . . . . . . . . . . .37,329
OWNER OCCUPIEDPortfolio Recovery Building . . . . . . . . . . . . . . . . . . .34,850 Sentara . . . . . . . . . . . . . . . . . . . . . . . . . . . . . . . . .45,000 Union Mission (former VA Natural Gas) . . . . . . . . .75,403
NEWTOWN/WITCHDUCK
CLASS AAAA Headquarters . . . . . . . . . . . . . . . . . . . . . . . . .47,045 Amelia Building . . . . . . . . . . . . . . . . . . . . . . . . . . .64,660 Amerigroup Building I . . . . . . . . . . . . . . . . . . . . . .106,000 Amerigroup Building II . . . . . . . . . . . . . . . . . . . . .106,000 BB&T Building . . . . . . . . . . . . . . . . . . . . . . . . . . . .30,000 Expressway Corporate Center . . . . . . . . . . . . . . . . .85,658 Gallery I . . . . . . . . . . . . . . . . . . . . . . . . . . . . . . . . .30,000 Gallery II . . . . . . . . . . . . . . . . . . . . . . . . . . . . . . . . .30,000 Greenwich Center . . . . . . . . . . . . . . . . . . . . . . . . . .56,000 Greenwich Commons . . . . . . . . . . . . . . . . . . . . . . .55,000 Greenwich Station . . . . . . . . . . . . . . . . . . . . . . . . .29,000 Halifax Building . . . . . . . . . . . . . . . . . . . . . . . . . . .71,100 Mass Mutual Building . . . . . . . . . . . . . . . . . . . . . . .45,500 Smithfield Building . . . . . . . . . . . . . . . . . . . . . . . .145,000 Verizon Center . . . . . . . . . . . . . . . . . . . . . . . . . . .135,000 Westmoreland Building . . . . . . . . . . . . . . . . . . . . .83,436
CLASS B144 Business Park Drive . . . . . . . . . . . . . . . . . . . .17,000 168 Business Park Drive . . . . . . . . . . . . . . . . . . . .19,300 184 Business Park Drive . . . . . . . . . . . . . . . . . . . .27,784 209 Business Park Drive . . . . . . . . . . . . . . . . . . . .11,250 232 Business Park Drive . . . . . . . . . . . . . . . . . . . .14,000 396 Witchduck Road . . . . . . . . . . . . . . . . . . . . . . .12,000 6330 Newtown Road . . . . . . . . . . . . . . . . . . . . . . .55,181 American Teleservices Building . . . . . . . . . . . . . . . .12,232 Azalea Village . . . . . . . . . . . . . . . . . . . . . . . . . . . . .20,000 BCF Building . . . . . . . . . . . . . . . . . . . . . . . . . . . . .24,000 BPC Building . . . . . . . . . . . . . . . . . . . . . . . . . . . . .29,074 Colonial Corporate Center . . . . . . . . . . . . . . . . . . .41,772 Commerce Centre (200-259 Expressway Ct) . . . . .35,500 Commonwealth Building . . . . . . . . . . . . . . . . . . . .10,000 Interstate Corporate Center . . . . . . . . . . . . . . . . .430,000 Parliament Drive Professional Bldg . . . . . . . . . . . . .10,000 TRC Center I . . . . . . . . . . . . . . . . . . . . . . . . . . . . . .62,000 TRC Center II . . . . . . . . . . . . . . . . . . . . . . . . . . . . .36,884 TRC Center III . . . . . . . . . . . . . . . . . . . . . . . . . . . . .52,000 Witchduck Crossing . . . . . . . . . . . . . . . . . . . . . . . .15,326
CLASS CWitchduck Office Court . . . . . . . . . . . . . . . . . . . . . .18,000
OWNER OCCUPIEDCox Cable Building . . . . . . . . . . . . . . . . . . . . . . . . .45,000 Cox Expansion . . . . . . . . . . . . . . . . . . . . . . . . . . . .25,000
Copy Data (Ikon) . . . . . . . . . . . . . . . . . . . . . . . . . .20,000 Lendman . . . . . . . . . . . . . . . . . . . . . . . . . . . . . . . .10,000 Newtown Square . . . . . . . . . . . . . . . . . . . . . . . . . .78,000
PEMBROKE/CENTRAL BUSINESS DISTRICT
CLASS A249 Central Park Avenue . . . . . . . . . . . . . . . . . . . .59,000 Convergence Center . . . . . . . . . . . . . . . . . . . . . . . .85,000 Convergence Center II . . . . . . . . . . . . . . . . . . . . . . .85,000 Convergence Center III . . . . . . . . . . . . . . . . . . . . . .99,000 Corporate Center VI . . . . . . . . . . . . . . . . . . . . . . . .59,000 Five Columbus Center . . . . . . . . . . . . . . . . . . . . . .20,000 Fulton Bank Plaza . . . . . . . . . . . . . . . . . . . . . . . . .90,315 One Columbus Center . . . . . . . . . . . . . . . . . . . . .134,000 OSS Building (former Ticketmaster) . . . . . . . . . . . .30,000 Six Columbus Center . . . . . . . . . . . . . . . . . . . . . . .36,000 Southport Center . . . . . . . . . . . . . . . . . . . . . . . . . .65,000 Town Center (222 Central Park) . . . . . . . . . . . . . .256,900 Town Center North Tower . . . . . . . . . . . . . . . . . . . . .53,000 Two Columbus Center . . . . . . . . . . . . . . . . . . . . . .109,000
CLASS B4701 Columbus . . . . . . . . . . . . . . . . . . . . . . . . . . .32,000 4705 Columbus Street . . . . . . . . . . . . . . . . . . . . .33,000 4801 Columbus Street . . . . . . . . . . . . . . . . . . . . .40,000 Corporate Center I . . . . . . . . . . . . . . . . . . . . . . . . .51,000 Corporate Center II . . . . . . . . . . . . . . . . . . . . . . . . .52,475 Corporate Center III . . . . . . . . . . . . . . . . . . . . . . . .51,000 Corporate Center IV . . . . . . . . . . . . . . . . . . . . . . . .76,012 Holland Commerce Center . . . . . . . . . . . . . . . . . . .30,000 Holland Office Park . . . . . . . . . . . . . . . . . . . . . . . . .32,000 Independence Business Center . . . . . . . . . . . . . . .62,000 Independence Technology Center - Technocenter I .50,000 Independent Plaza . . . . . . . . . . . . . . . . . . . . . . . . .36,655 Pembroke Commercial Bldg. (4425 Corporation Lane)
70,760 Pembroke Office Park . . . . . . . . . . . . . . . . . . . . . .294,000 Prism Plaza . . . . . . . . . . . . . . . . . . . . . . . . . . . . . .32,000 Southgate Centre . . . . . . . . . . . . . . . . . . . . . . . . . .43,200 Southport Business Center(flex) (Baskin Bldg) . . . .20,683 Southport Trade Center(flex) . . . . . . . . . . . . . . . . . .30,883 Thalia One . . . . . . . . . . . . . . . . . . . . . . . . . . . . . . .18,408 Thalia Professional Center . . . . . . . . . . . . . . . . . . .15,000 The Meadows . . . . . . . . . . . . . . . . . . . . . . . . . . . . .32,433 VST Building . . . . . . . . . . . . . . . . . . . . . . . . . . . . .25,000
CLASS C4224 Holland Road . . . . . . . . . . . . . . . . . . . . . . . .10,104 Dragas Office Park . . . . . . . . . . . . . . . . . . . . . . . . .30,896 Haygood Buildings . . . . . . . . . . . . . . . . . . . . . . . . .22,392 Haygood Executive Park . . . . . . . . . . . . . . . . . . . . .36,472 Holland Plaza Office Building . . . . . . . . . . . . . . . . .14,513 Old Donation Executive Park . . . . . . . . . . . . . . . . . .20,347 Larkspur Village . . . . . . . . . . . . . . . . . . . . . . . . . . .16,184 Pocahontas Center . . . . . . . . . . . . . . . . . . . . . . . . .17,800
OWNER OCCUPIEDAlantec Financial Fed Credit Union . . . . . . . . . . . . .12,000 AVIS . . . . . . . . . . . . . . . . . . . . . . . . . . . . . . . . . . .168,000 Coastal Training Technologies . . . . . . . . . . . . . . . . .60,000 Commonwealth College . . . . . . . . . . . . . . . . . . . . .30,000 Electronic Systems Building . . . . . . . . . . . . . . . . . .10,000 ISC . . . . . . . . . . . . . . . . . . . . . . . . . . . . . . . . . . . . .40,000 QED Building . . . . . . . . . . . . . . . . . . . . . . . . . . . . .30,000 REIN Building . . . . . . . . . . . . . . . . . . . . . . . . . . . . .24,500 Virginia Natural Gas Building . . . . . . . . . . . . . . . . .48,242
PORTSMOUTH
CLASS ABB&T Building (500 Crawford) . . . . . . . . . . . . . . . .35,327 Harbourfront Corporate Center (801 Water St) . . . .53,000
CLASS B307 County Street . . . . . . . . . . . . . . . . . . . . . . . . .13,475 355 Crawford Street Building . . . . . . . . . . . . . . . . .79,367 600 Crawford Street . . . . . . . . . . . . . . . . . . . . . . . .16,171 Boyette Professional Center . . . . . . . . . . . . . . . . . .13,000 Bristol Square . . . . . . . . . . . . . . . . . . . . . . . . . . . .10,800
49

Towne Bank Building (200 High St) . . . . . . . . . . . .34,000 JJH Building . . . . . . . . . . . . . . . . . . . . . . . . . . . . . .17,563 New Kirn Building . . . . . . . . . . . . . . . . . . . . . . . . . .44,000 PortCentre I (flex) . . . . . . . . . . . . . . . . . . . . . . . . .100,000 Port Trade Center . . . . . . . . . . . . . . . . . . . . . . . . . .14,223 The Seaboard Building . . . . . . . . . . . . . . . . . . . . . .65,000 Wachovia Bank . . . . . . . . . . . . . . . . . . . . . . . . . . .48,000
CLASS CCrawford Executive Center . . . . . . . . . . . . . . . . . . .20,340
SUFFOLK
CLASS AMAST One . . . . . . . . . . . . . . . . . . . . . . . . . . . . . . .60,000 JTASC Building . . . . . . . . . . . . . . . . . . . . . . . . . . .408,365
CLASS BBridgeway Technology Center I . . . . . . . . . . . . . . .125,000 Bridgeway Technology Center II . . . . . . . . . . . . . . . .67,500 Bridgeway Technology Center III . . . . . . . . . . . . . . .72,384 Brinkley Building . . . . . . . . . . . . . . . . . . . . . . . . . . .20,500 Brinkley Building II . . . . . . . . . . . . . . . . . . . . . . . . .21,000 Harbour Breeze Professional Center . . . . . . . . . . . .52,265 Harbour View Medical Arts Center . . . . . . . . . . . . .47,000 Harbor View Professional Center (1033 & 1035) .23,000”Konikoff Medical Office Building . . . . . . . . . . . . . .22,675”Lakeview Technology GSA Center . . . . . . . . . . . . .110,000 Lakeview Tech Center II . . . . . . . . . . . . . . . . . . . . .86,400”Main Street Center . . . . . . . . . . . . . . . . . . . . . . . . .13,800 Washington Street Center . . . . . . . . . . . . . . . . . . . .12,000
OWNER OCCUPIEDRubicon NGP - Lakeview Technical Center . . . . . .351,075 Lockheed Martin . . . . . . . . . . . . . . . . . . . . . . . . . .50,000 Overton Building . . . . . . . . . . . . . . . . . . . . . . . . . . .12,940 Rose & Womble Building . . . . . . . . . . . . . . . . . . . .25,000 Towne Bank Center . . . . . . . . . . . . . . . . . . . . . . . . .19,318
DOWNTOWN HAMPTON
CLASS AHarbour Centre . . . . . . . . . . . . . . . . . . . . . . . . . . .158,855
CLASS B10-16 W. Queens Way . . . . . . . . . . . . . . . . . . . . . .11,238 47 W. Queens Way . . . . . . . . . . . . . . . . . . . . . . . . .12,500 Mill Point Center . . . . . . . . . . . . . . . . . . . . . . . . . . .10,000 One Mallory Street . . . . . . . . . . . . . . . . . . . . . . . . .14,000
CLASS C55 W. Queens Way . . . . . . . . . . . . . . . . . . . . . . . . .12,132
DOWNTOWN NEWPORT NEWS
CLASS B2600 Building . . . . . . . . . . . . . . . . . . . . . . . . . . .118,018 Wachovia Bank Building . . . . . . . . . . . . . . . . . . . . .17,846
OWNER OCCUPIEDNewport News Shipbuilding, Bldg 520-521” . . . . .50,000
HAMPTON ROADS CENTER
CLASS A6 Manhattan Square . . . . . . . . . . . . . . . . . . . . . . .30,106 1001 N Campus Parkway . . . . . . . . . . . . . . . . . . .19,000 Allstate Building . . . . . . . . . . . . . . . . . . . . . . . . . . .17,000 HealthNet Building . . . . . . . . . . . . . . . . . . . . . . . . .60,482 Lakefront Plaza I . . . . . . . . . . . . . . . . . . . . . . . . . . .77,442 Morgan Marrow Building . . . . . . . . . . . . . . . . . . . .12,000 Olympia Place . . . . . . . . . . . . . . . . . . . . . . . . . . . .72,395 Oxford Plaza . . . . . . . . . . . . . . . . . . . . . . . . . . . . . .64,297 Parkway Executive Center . . . . . . . . . . . . . . . . . . . .45,000 Research Quad - Building One . . . . . . . . . . . . . . . .60,000 Research Quad - Building Three . . . . . . . . . . . . . .100,000
CLASS B400 Butler Farm Road . . . . . . . . . . . . . . . . . . . . . .96,446 404 Butler Farm Road . . . . . . . . . . . . . . . . . . . . . .54,715 421 Butler Farm Road . . . . . . . . . . . . . . . . . . . . . .56,515 Hampton I . . . . . . . . . . . . . . . . . . . . . . . . . . . . . . .68,532 Hampton II . . . . . . . . . . . . . . . . . . . . . . . . . . . . . . .67,000 Hampton III . . . . . . . . . . . . . . . . . . . . . . . . . . . . . .45,000 Hampton Technology Center I . . . . . . . . . . . . . . . . .56,575
NDS Building . . . . . . . . . . . . . . . . . . . . . . . . . . . .35,000 Raytheon . . . . . . . . . . . . . . . . . . . . . . . . . . . . . . . .50,000 Research Office Building . . . . . . . . . . . . . . . . . . . .30,000
CLASS CNASA Langley Research Center . . . . . . . . . . . . . . .11,790 3217 Armistead Avenue . . . . . . . . . . . . . . . . . . . . .24,043
COLISEUM CENTRAL
CLASS AClaiborne Building (Regional Mall Office) . . . . . . .150,000 Executive Tower . . . . . . . . . . . . . . . . . . . . . . . . . . .134,164 Pinewood Plaza . . . . . . . . . . . . . . . . . . . . . . . . . . .77,500
CLASS B2115 Executive Drive . . . . . . . . . . . . . . . . . . . . . . .62,000 2310 Tower Place . . . . . . . . . . . . . . . . . . . . . . . . . .10,500 Bank of America Building . . . . . . . . . . . . . . . . . . . .14,434 Colony Square of Hampton . . . . . . . . . . . . . . . . . .30,050 Riverdale Complex . . . . . . . . . . . . . . . . . . . . . . . .168,000 Sheraton Office Bldg. . . . . . . . . . . . . . . . . . . . . . . .12,673 Todds Lane Professional Center . . . . . . . . . . . . . . .12,500 West Telemarketing . . . . . . . . . . . . . . . . . . . . . . . . .55,855
OWNER OCCUPIEDLangley Federal Credit Union . . . . . . . . . . . . . . . . .72,800
NEWMARKET
CLASS BNewmarket Building . . . . . . . . . . . . . . . . . . . . . . . .21,262 NetCenter . . . . . . . . . . . . . . . . . . . . . . . . . . . . . . .546,171 UPS Call Center . . . . . . . . . . . . . . . . . . . . . . . . . .103,000
CLASS CRouse Tower . . . . . . . . . . . . . . . . . . . . . . . . . . . . .150,000
OWNER OCCUPIEDNN Shipbuilding Employee Credit Union . . . . . . . . .15,000
OYSTER POINT
CLASS A601 Thimble Shoals Boulevard . . . . . . . . . . . . . . . .30,000 Atrium At Oyster Point . . . . . . . . . . . . . . . . . . . . . .62,971 Cedar One . . . . . . . . . . . . . . . . . . . . . . . . . . . . . . .15,467 Cedar Two . . . . . . . . . . . . . . . . . . . . . . . . . . . . . . . .27,000 Contemporary Cybernetics . . . . . . . . . . . . . . . . . . .60,000 Ferguson Corporate Center II . . . . . . . . . . . . . . . .150,000 Fountain Plaza One . . . . . . . . . . . . . . . . . . . . . . .100,000 Fountain Plaza Two . . . . . . . . . . . . . . . . . . . . . . . . .80,000 Fountain Plaza Three . . . . . . . . . . . . . . . . . . . . . . .80,000 Langley Federal Centre . . . . . . . . . . . . . . . . . . . . . .51,982 Merchants Walk . . . . . . . . . . . . . . . . . . . . . . . . . . .28,000 One City Center . . . . . . . . . . . . . . . . . . . . . . . . . . .70,000 One Oyster Point . . . . . . . . . . . . . . . . . . . . . . . . . .36,226 Oyster Point Interstate Center . . . . . . . . . . . . . . . . .64,000 Patrick Henry Corporate Center . . . . . . . . . . . . . . .98,883 Riverside Health Center Building (Warwick) . . . . .104,500 Peninsula Professional Building . . . . . . . . . . . . . . .30,800 Rock Landing Corporate Center II . . . . . . . . . . . . . .33,476 SunTrust Building . . . . . . . . . . . . . . . . . . . . . . . . .100,955 Symantec Corp. Building . . . . . . . . . . . . . . . . . . .100,000 Tower Park (733 &735 Thimble Shoals) . . . . . . . . .31,667 Town Center One . . . . . . . . . . . . . . . . . . . . . . . . . .60,000 TowneBank Center . . . . . . . . . . . . . . . . . . . . . . . . .60,000 Two City Center . . . . . . . . . . . . . . . . . . . . . . . . . . . .63,600 Two Oyster Point . . . . . . . . . . . . . . . . . . . . . . . . . . .39,137 Turner Bldg (1060 Loftis) . . . . . . . . . . . . . . . . . . .21,000”Wachovia Building . . . . . . . . . . . . . . . . . . . . . . . . .42,921 William E Wood Building (1030 Loftis) . . . . . . . . . .26,000
CLASS B11790 Jefferson Avenue . . . . . . . . . . . . . . . . . . . .20,662 745 Bluecrab (flex) . . . . . . . . . . . . . . . . . . . . . . . .16,000 BB&T Plaza (603 Pilot House) . . . . . . . . . . . . . . . .37,348 Cale Colony 17 . . . . . . . . . . . . . . . . . . . . . . . . . . .17,000 Canon Place . . . . . . . . . . . . . . . . . . . . . . . . . . . . . .26,000 Comb-Bay Park . . . . . . . . . . . . . . . . . . . . . . . . . . .32,000 Dunwoody Place . . . . . . . . . . . . . . . . . . . . . . . . . . .19,798 Executive Center . . . . . . . . . . . . . . . . . . . . . . . . . . .95,399 Fishing Point Complex(flex) . . . . . . . . . . . . . . . . . .50,000 International Distribution Center . . . . . . . . . . . . . . .36,000 McCale Professional Park . . . . . . . . . . . . . . . . . . . .40,000
Middle Ground Business Center . . . . . . . . . . . . . . .62,000 Oyster Point Center . . . . . . . . . . . . . . . . . . . . . . . . .44,000 Oyster Point Business Center . . . . . . . . . . . . . . . . .25,000 Oyster Point Place (flex) . . . . . . . . . . . . . . . . . . . . .38,000 Oyster Point West . . . . . . . . . . . . . . . . . . . . . . . . .176,560 Park Central Executive Center . . . . . . . . . . . . . . . . .54,425 Park Place (751 & 753 Thimble Shoals) . . . . . . . .25,000 Peninsula Business Center I (flex) . . . . . . . . . . . . .21,817 Peninsula Business Centre II (flex) . . . . . . . . . . . . .40,475 Peninsula Business Centre III (flex) . . . . . . . . . . . . .60,000 Rock Landing Corporate Center IV . . . . . . . . . . . . .18,125 Rock Landing Corporate Center V . . . . . . . . . . . . . .18,125 Technology Center (flex) . . . . . . . . . . . . . . . . . . . . .81,000 Thimble Shoals Business Center (flex) . . . . . . . . . .55,377 Thimble Shores Lakefront . . . . . . . . . . . . . . . . . . . .25,000
CLASS C714-716-718 J.Clyde Morris Blvd. . . . . . . . . . . . . .15,000 Drucker & Falk Building . . . . . . . . . . . . . . . . . . . . .30,000 Pilgrim Landing . . . . . . . . . . . . . . . . . . . . . . . . . . . .10,650 Regent Park . . . . . . . . . . . . . . . . . . . . . . . . . . . . . .25,000
OWNER OCCUPIEDApplied Research Center . . . . . . . . . . . . . . . . . . .121,000 Fountain Plaza Two . . . . . . . . . . . . . . . . . . . . . . . . .80,000 Muller Martini Building . . . . . . . . . . . . . . . . . . . . . .24,000 Peninsula Retail Credit . . . . . . . . . . . . . . . . . . . . . .30,000
SUBURBAN NEWPORT NEWS
CLASS BBay Savings Bank Building . . . . . . . . . . . . . . . . . . .18,000 Colony Square of Denbigh II . . . . . . . . . . . . . . . . . .26,100 Denbigh Professional Park . . . . . . . . . . . . . . . . . . .40,598 Ferguson Enterprises . . . . . . . . . . . . . . . . . . . . . . .75,800 MCI Building . . . . . . . . . . . . . . . . . . . . . . . . . . . . . .60,000 Tidewater Tech (616 Denbigh Blvd) . . . . . . . . . . . .15,778
CLASS CMariner Building . . . . . . . . . . . . . . . . . . . . . . . . . . .26,000 Teagle Building . . . . . . . . . . . . . . . . . . . . . . . . . . . .22,000
OWNER OCCUPIEDCNU Building . . . . . . . . . . . . . . . . . . . . . . . . . . . . .40,000
WILLIAMSBURG/JAMES CITY/YORKCOUNTY
CLASS A263 McLaws Circle . . . . . . . . . . . . . . . . . . . . . . . . .26,967 Atrium Building . . . . . . . . . . . . . . . . . . . . . . . . . . . .24,000 Casey New Town - SunTrust . . . . . . . . . . . . . . . . . .60,000 Courthouse Green . . . . . . . . . . . . . . . . . . . . . . . . .30,000 Design Center . . . . . . . . . . . . . . . . . . . . . . . . . . . . .13,700 First Union Center . . . . . . . . . . . . . . . . . . . . . . . . .32,000 Langley Federal Credit Union . . . . . . . . . . . . . . . . .20,000 Williamsburg Commerce Center . . . . . . . . . . . . . . .32,000 Palladian Office Building . . . . . . . . . . . . . . . . . . . .21,000 Patriot Park Business Center . . . . . . . . . . . . . . . . .24,000 Sentara New Town Medical Building . . . . . . . . . . . .50,000 Sun Trust (Courthouse St.) . . . . . . . . . . . . . . . . . . .60,000 William E. Wood Building . . . . . . . . . . . . . . . . . . .20,000”
CLASS B104 Bypass Road . . . . . . . . . . . . . . . . . . . . . . . . .11,100 7601 George Washington Memorial Highway . . . . .10,000 Chartertowne Professional Center . . . . . . . . . . . . . .12,800 Greens Springs Office Park . . . . . . . . . . . . . . . . . . .37,000 Kristinsand Office Park . . . . . . . . . . . . . . . . . . . . . .15,221 Packets Executive Center . . . . . . . . . . . . . . . . . . . .23,000 Quarterland Commons Office Condos . . . . . . . . .120,000 Rivergate Center . . . . . . . . . . . . . . . . . . . . . . . . . . .36,000 Wachovia Bank . . . . . . . . . . . . . . . . . . . . . . . . . . .10,500 Williamsburg Office Park . . . . . . . . . . . . . . . . . . . . .79,600
Disclaimer: The information in this report is deemed reliable.The Old Dominion University E. V. Williams Center for RealEstate and Economic Development makes no representationor warranty as to its accuracy. . . . . . . . . . . . . . . . . . . . . . . . . . . . . . . . . . . . . . . . . . . . . . .BOLD indicates change/addition from last year.
502012 Hampton Roads Real Estate Market Review

OFFICE SUBMARKETS
Southside1 Airport/Northampton
2 Chesapeake/Greenbrier
3 Downtown Norfolk
4 Central Norfolk
5 Hilltop/Oceanfront
6 Corporate Landing
7 Kempsville
8 Little Neck
9 Lynnhaven
10 Military Circle
11 Newtown/Witchduck
12 Northern Suffolk
13 Pembroke
14 Portsmouth
Peninsula15 Downtown Hampton
16 Hampton Roads Center
17 Coliseum Central
18 Downtown Newport News
19 Newmarket
20 Oyster Point
21 Suburban Newport News
22 Williamsburg/
James City Co./
York County
20
12
OFFIC
E
51

53
New Residential Market
Authors Ron Wildermuth and Blair Hardesty
Data Analysis/ Residential DataBank
Layouts
Existing Residential Market
Author James Pritchard
Data Analysis/ Manager, Data & Analytics
Layouts Real Estate Information Network, Inc.
Hampton Roads MLS
Financial The E. V. Williams Center for Real Estate and Economic Support Development (CREED) functions and reports are funded by donations
from individuals, organizations and the CREED IPAC and CouncilAdvisory Boards.
Disclosure The data used for this report are deemed reliable; however, neither Old Dominion University, the E. V. Williams Center for Real Estate and Economic Development, nor sponsoring companiesand/or individuals makes any representation or warranty as to itsaccuracy.
20
12
RE
SID
EN
TIA
L
H A M P T O N
R O A D S
M A R K E T
R E V I E W
RESIDENTIAL
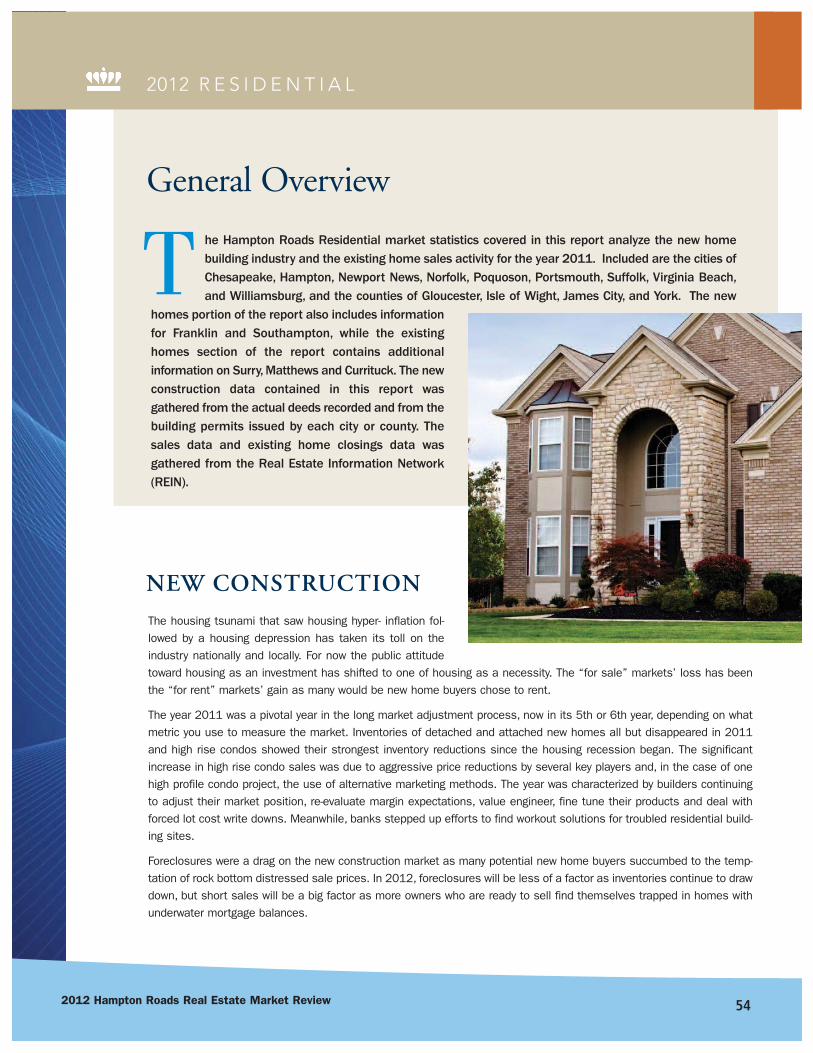
542012 Hampton Roads Real Estate Market Review
The housing tsunami that saw housing hyper- inflation fol-lowed by a housing depression has taken its toll on theindustry nationally and locally. For now the public attitudetoward housing as an investment has shifted to one of housing as a necessity. The “for sale” markets’ loss has beenthe “for rent” markets’ gain as many would be new home buyers chose to rent.
The year 2011 was a pivotal year in the long market adjustment process, now in its 5th or 6th year, depending on whatmetric you use to measure the market. Inventories of detached and attached new homes all but disappeared in 2011and high rise condos showed their strongest inventory reductions since the housing recession began. The significantincrease in high rise condo sales was due to aggressive price reductions by several key players and, in the case of onehigh profile condo project, the use of alternative marketing methods. The year was characterized by builders continuingto adjust their market position, re-evaluate margin expectations, value engineer, fine tune their products and deal withforced lot cost write downs. Meanwhile, banks stepped up efforts to find workout solutions for troubled residential build-ing sites.
Foreclosures were a drag on the new construction market as many potential new home buyers succumbed to the temp-tation of rock bottom distressed sale prices. In 2012, foreclosures will be less of a factor as inventories continue to drawdown, but short sales will be a big factor as more owners who are ready to sell find themselves trapped in homes withunderwater mortgage balances.
NEW CONSTRUCTION
2012 R E S I D E N T I A L
he Hampton Roads Residential market statistics covered in this report analyze the new homebuilding industry and the existing home sales activity for the year 2011. Included are the cities ofChesapeake, Hampton, Newport News, Norfolk, Poquoson, Portsmouth, Suffolk, Virginia Beach,and Williamsburg, and the counties of Gloucester, Isle of Wight, James City, and York. The new
homes portion of the report also includes informationfor Franklin and Southampton, while the existinghomes section of the report contains additionalinformation on Surry, Matthews and Currituck. The newconstruction data contained in this report wasgathered from the actual deeds recorded and from thebuilding permits issued by each city or county. Thesales data and existing home closings data wasgathered from the Real Estate Information Network(REIN).
General Overview
T
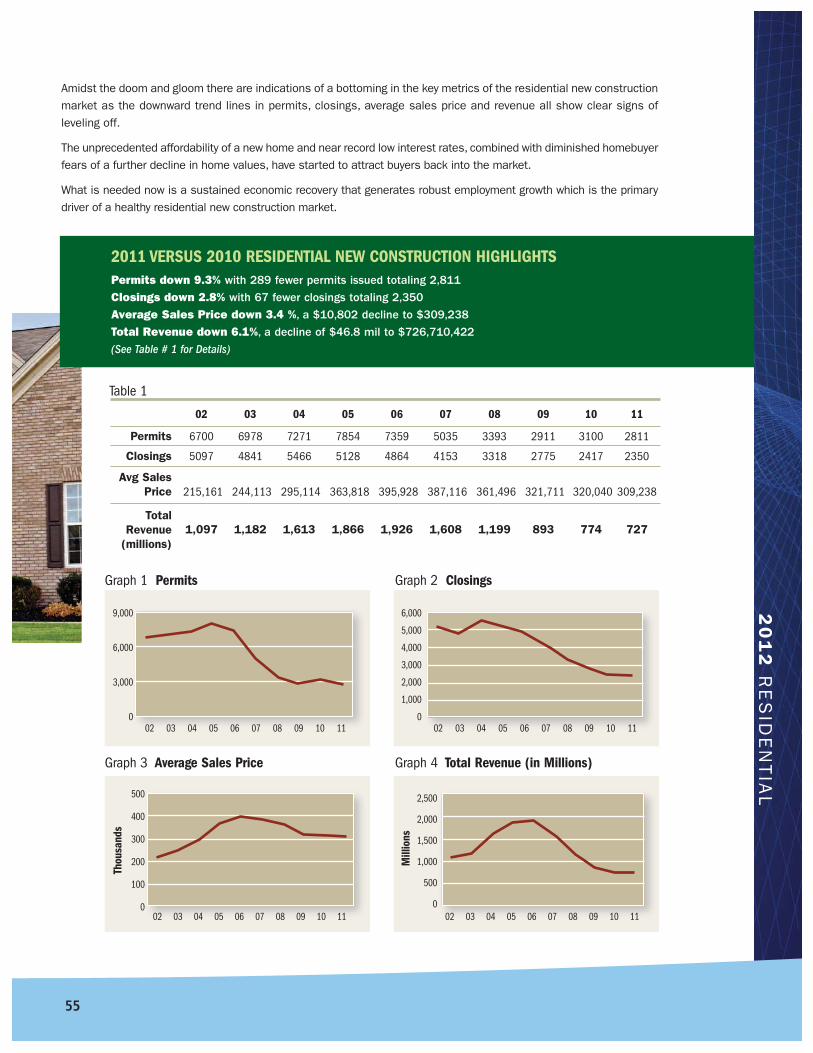
Amidst the doom and gloom there are indications of a bottoming in the key metrics of the residential new constructionmarket as the downward trend lines in permits, closings, average sales price and revenue all show clear signs ofleveling off.
The unprecedented affordability of a new home and near record low interest rates, combined with diminished homebuyerfears of a further decline in home values, have started to attract buyers back into the market.
What is needed now is a sustained economic recovery that generates robust employment growth which is the primarydriver of a healthy residential new construction market.
20
12
RE
SID
EN
TIA
L
55
2011 VERSUS 2010 RESIDENTIAL NEW CONSTRUCTION HIGHLIGHTSPermits down 9.3% with 289 fewer permits issued totaling 2,811
Closings down 2.8% with 67 fewer closings totaling 2,350
Average Sales Price down 3.4 %, a $10,802 decline to $309,238
Total Revenue down 6.1%, a decline of $46.8 mil to $726,710,422
(See Table # 1 for Details)
Table 1
02 03 04 05 06 07 08 09 10 11
Permits 6700 6978 7271 7854 7359 5035 3393 2911 3100 2811
Closings 5097 4841 5466 5128 4864 4153 3318 2775 2417 2350
Avg SalesPrice 215,161 244,113 295,114 363,818 395,928 387,116 361,496 321,711 320,040 309,238
TotalRevenue
(millions)1,097 1,182 1,613 1,866 1,926 1,608 1,199 893 774 727
Graph 1 Permits Graph 2 Closings
Graph 3 Average Sales Price Graph 4 Total Revenue (in Millions)
6,000
5,000
4,000
3,000
2,000
1,000
0
2,500
2,000
1,500
1,000
500
0
9,000
6,000
3,000
0
500
400
300
200
100
0
02 03 04 05 06 07 08 09 10 11 02 03 04 05 06 07 08 09 10 11
02 03 04 05 06 07 08 09 10 11 02 03 04 05 06 07 08 09 10 11
Thou
sand
s
Mill
ions

562012 Hampton Roads Real Estate Market Review
The run-up to the market peak that occurred from 2002 to 2004 and 2005 was followed by several years of decline inpermits, closings, sales price and revenue. But in 2010 and 2011, there were clear signs that the downward trend wasleveling off to create a market bottom from which a recovery can take place.
THE TEN YEAR TREND . . . .
DetachedDetached permits were down 3.4% to 2,044. Closings increased by 2.2% to 1,509 due to an increase in the availabilityof value priced detached homes in communities like Turtle Creek in Newport News, Hampshire Glen in Hampton andRose Glen Manor in Virginia Beach. The average sales price declined 3.6% to $345,368 and detached revenue declinedby 1.5% to $521.1 mil.
Attached — MultistoryMultistory permits were down 14.6% to 105. Closings increased by 11.1% to 160 due to dramatic price concessionsat several condominiums. The average sales price declined 6% to $261,194. Multistory condos were the only prod-uct type with increased revenues which was due to the significant increase in closings. Multistory revenues totalednearly $41.8 mil.
Attached — MultiplexMultiplex permits were down 35% to 160. This portion of the residential market was hit hardest and is attributed to firsttime homebuyers that continue to stay away and those that chose to purchase distressed properties. Closings were down15% to 198, the largest decline of the four product types. Average prices were down 5.7% to $216,140 as a result ofincreased competition in this market segment. This group experienced the largest revenue decline of 19.9% to just under$42.8 mil.
Attached — Townhouse/DuplexTownhouse/Duplex permits were down 18.4% to 502 as many buyers opted for detached foreclosure and short sale prop-erties. Closings were down 14.2% to 483 and average sales prices were down 6.5% to $250,440. Revenues experiencedthe 2nd largest decline of the four product types down 19.8% to $120.9 mil.
(See Table # 2 and Graphs # 5 - # 9 for details)
2011 VERSUS 2010 CONSTRUCTION ACTIVITYBY PRODUCT TYPE
2012 R E S I D E N T I A L
FROM PEAK TO TROUGH . . . . Permits down 64.2% with 5,043 fewer permits issued in 2011 versus 2005
Closings down 57% with 3,116 fewer closings in 2011 versus 2004
Average Sales Price down 21.9%, an $86,690 decline from 2006 to 2011
Total Revenue down 62.3%, a decline of $1.2 billion in 2011 compared to 2006
(See Table # 1 and Graph #’s 1 – 4 for details)

20
12
RE
SID
EN
TIA
L
57
Table 2 NEW CONSTRUCTION ACTIVITY 2010 vs 2011Hampton Roads, Va - by Product Type
Product Type * Permits Closings Avg Sales Price Revenue 2010 2011 % Change 2010 2011 % Change 2010 2011 % Change 2010 2011 % Change
Detached 2116 2044 -3.4% 1477 1509 2.2% 358,378 345,368 -3.6% 529,323,913 521,160,889 -1.5%
Multistory 123 105 -14.6% 144 160 11.1% 277,805 261,194 -6.0% 40,003,969 41,791,119 4.5%
MultiPlex 246 160 -35.0% 233 198 -15.0% 229,325 216,140 -5.7% 53,432,711 42,795,705 -19.9%
Town/Dup 615 502 -18.4% 563 483 -14.2% 267,807 250,440 -6.5% 150,775,239 120,962,709 -19.8%
Totals/Avgs: 3100 2811 -9.3% 2417 2350 -2.8% 320,040 309,238 -3.4% 773,535,832 726,710,422 -6.1%
Graph 5 Permits Graph 6 Average Sales Price
Graph 7 Closings Graph 8 Total Revenue
Town/Dup
Multiplex
Multistory
Detached
Town/Dup
Multiplex
Multistory
Detached
Town/Dup
Multiplex
Multistory
Detached
Town/Dup
Multiplex
Multistory
Detached
0 500 1000 1500 200 2500
0 200 400 600 800 1000 1200 1400 1600 0 50 100 150
0 100 200 300 400 500
2011 Permits
2011 Permits
2010 Permits
2010 Permits
2011 Ave.Sales Prices
2010 Ave.Sales Prices
2011 Revenue
2010 Revenue
Thousands
Millions
Graph 9 Product Mix 2011 Closings
64%
7% 8%
21%
Detached Multistory Multiplex Town/Dup
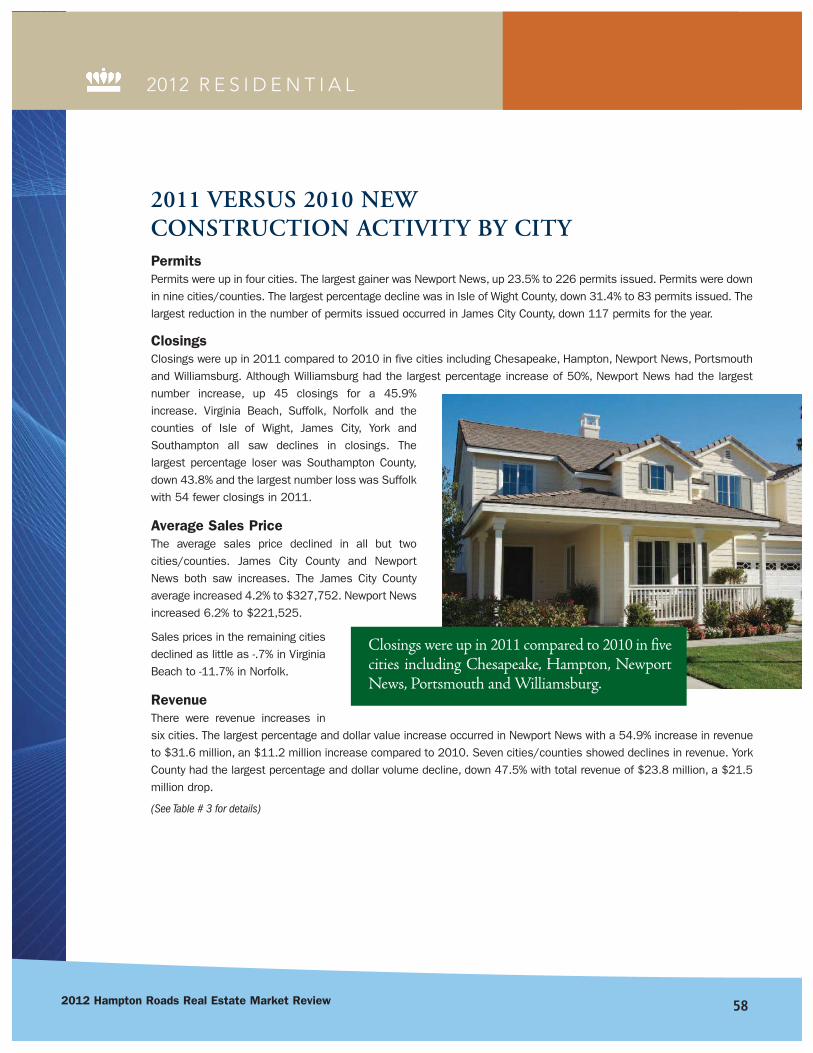
582012 Hampton Roads Real Estate Market Review
2012 R E S I D E N T I A L
PermitsPermits were up in four cities. The largest gainer was Newport News, up 23.5% to 226 permits issued. Permits were downin nine cities/counties. The largest percentage decline was in Isle of Wight County, down 31.4% to 83 permits issued. Thelargest reduction in the number of permits issued occurred in James City County, down 117 permits for the year.
ClosingsClosings were up in 2011 compared to 2010 in five cities including Chesapeake, Hampton, Newport News, Portsmouthand Williamsburg. Although Williamsburg had the largest percentage increase of 50%, Newport News had the largestnumber increase, up 45 closings for a 45.9%increase. Virginia Beach, Suffolk, Norfolk and thecounties of Isle of Wight, James City, York andSouthampton all saw declines in closings. Thelargest percentage loser was Southampton County,down 43.8% and the largest number loss was Suffolkwith 54 fewer closings in 2011.
Average Sales PriceThe average sales price declined in all but twocities/counties. James City County and NewportNews both saw increases. The James City Countyaverage increased 4.2% to $327,752. Newport Newsincreased 6.2% to $221,525.
Sales prices in the remaining citiesdeclined as little as -.7% in VirginiaBeach to -11.7% in Norfolk.
RevenueThere were revenue increases insix cities. The largest percentage and dollar value increase occurred in Newport News with a 54.9% increase in revenueto $31.6 million, an $11.2 million increase compared to 2010. Seven cities/counties showed declines in revenue. YorkCounty had the largest percentage and dollar volume decline, down 47.5% with total revenue of $23.8 million, a $21.5million drop.
(See Table # 3 for details)
2011 VERSUS 2010 NEW CONSTRUCTION ACTIVITY BY CITY
Closings were up in 2011 compared to 2010 in fivecities including Chesapeake, Hampton, NewportNews, Portsmouth and Williamsburg.
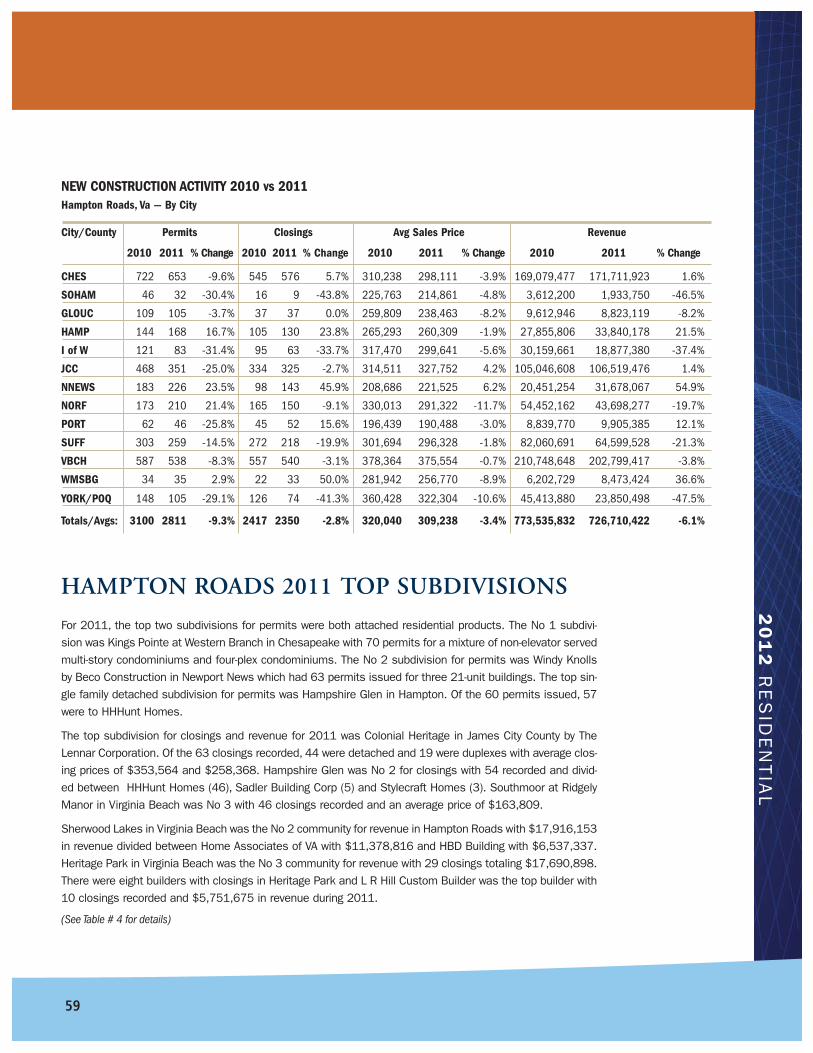
20
12
RE
SID
EN
TIA
L
NEW CONSTRUCTION ACTIVITY 2010 vs 2011Hampton Roads, Va — By City
City/County Permits Closings Avg Sales Price Revenue
2010 2011 % Change 2010 2011 % Change 2010 2011 % Change 2010 2011 % Change
CHES 722 653 -9.6% 545 576 5.7% 310,238 298,111 -3.9% 169,079,477 171,711,923 1.6%
SOHAM 46 32 -30.4% 16 9 -43.8% 225,763 214,861 -4.8% 3,612,200 1,933,750 -46.5%
GLOUC 109 105 -3.7% 37 37 0.0% 259,809 238,463 -8.2% 9,612,946 8,823,119 -8.2%
HAMP 144 168 16.7% 105 130 23.8% 265,293 260,309 -1.9% 27,855,806 33,840,178 21.5%
I of W 121 83 -31.4% 95 63 -33.7% 317,470 299,641 -5.6% 30,159,661 18,877,380 -37.4%
JCC 468 351 -25.0% 334 325 -2.7% 314,511 327,752 4.2% 105,046,608 106,519,476 1.4%
NNEWS 183 226 23.5% 98 143 45.9% 208,686 221,525 6.2% 20,451,254 31,678,067 54.9%
NORF 173 210 21.4% 165 150 -9.1% 330,013 291,322 -11.7% 54,452,162 43,698,277 -19.7%
PORT 62 46 -25.8% 45 52 15.6% 196,439 190,488 -3.0% 8,839,770 9,905,385 12.1%
SUFF 303 259 -14.5% 272 218 -19.9% 301,694 296,328 -1.8% 82,060,691 64,599,528 -21.3%
VBCH 587 538 -8.3% 557 540 -3.1% 378,364 375,554 -0.7% 210,748,648 202,799,417 -3.8%
WMSBG 34 35 2.9% 22 33 50.0% 281,942 256,770 -8.9% 6,202,729 8,473,424 36.6%
YORK/POQ 148 105 -29.1% 126 74 -41.3% 360,428 322,304 -10.6% 45,413,880 23,850,498 -47.5%
Totals/Avgs: 3100 2811 -9.3% 2417 2350 -2.8% 320,040 309,238 -3.4% 773,535,832 726,710,422 -6.1%
For 2011, the top two subdivisions for permits were both attached residential products. The No 1 subdivi-sion was Kings Pointe at Western Branch in Chesapeake with 70 permits for a mixture of non-elevator servedmulti-story condominiums and four-plex condominiums. The No 2 subdivision for permits was Windy Knollsby Beco Construction in Newport News which had 63 permits issued for three 21-unit buildings. The top sin-gle family detached subdivision for permits was Hampshire Glen in Hampton. Of the 60 permits issued, 57were to HHHunt Homes.
The top subdivision for closings and revenue for 2011 was Colonial Heritage in James City County by TheLennar Corporation. Of the 63 closings recorded, 44 were detached and 19 were duplexes with average clos-ing prices of $353,564 and $258,368. Hampshire Glen was No 2 for closings with 54 recorded and divid-ed between HHHunt Homes (46), Sadler Building Corp (5) and Stylecraft Homes (3). Southmoor at RidgelyManor in Virginia Beach was No 3 with 46 closings recorded and an average price of $163,809.
Sherwood Lakes in Virginia Beach was the No 2 community for revenue in Hampton Roads with $17,916,153in revenue divided between Home Associates of VA with $11,378,816 and HBD Building with $6,537,337.Heritage Park in Virginia Beach was the No 3 community for revenue with 29 closings totaling $17,690,898.There were eight builders with closings in Heritage Park and L R Hill Custom Builder was the top builder with10 closings recorded and $5,751,675 in revenue during 2011.
(See Table # 4 for details)
HAMPTON ROADS 2011 TOP SUBDIVISIONS
59
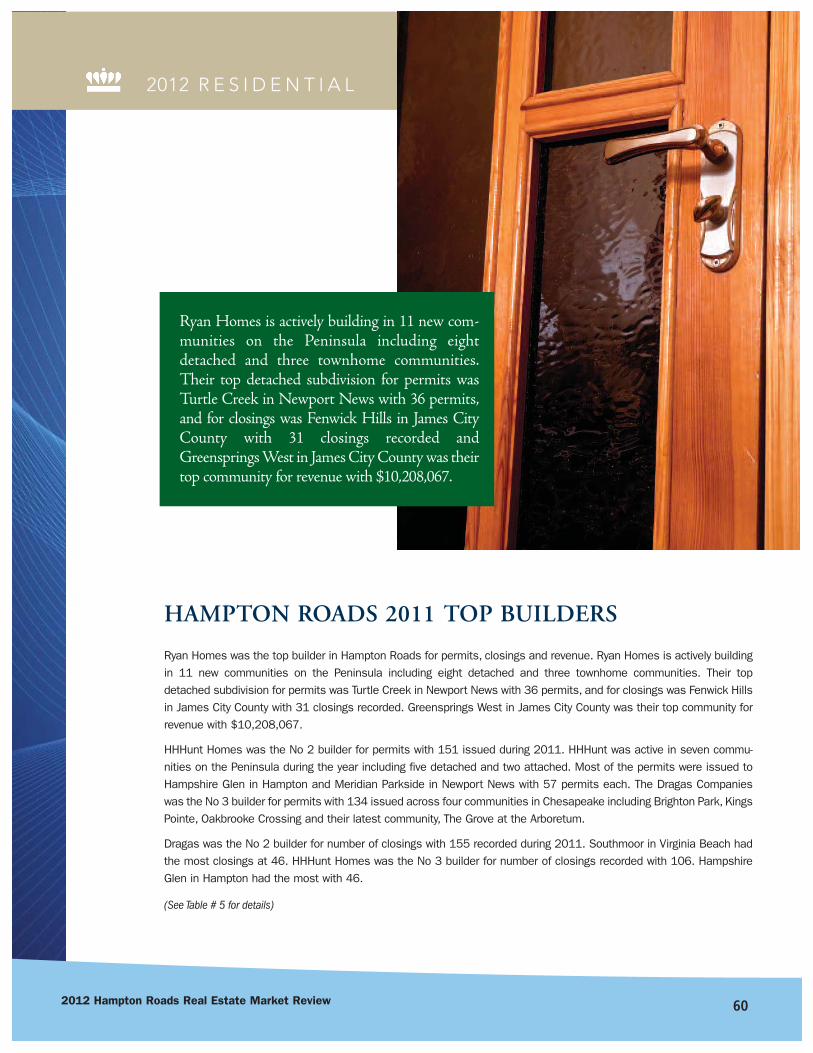
602012 Hampton Roads Real Estate Market Review
2012 R E S I D E N T I A L
HAMPTON ROADS 2011 TOP BUILDERS
Ryan Homes was the top builder in Hampton Roads for permits, closings and revenue. Ryan Homes is actively buildingin 11 new communities on the Peninsula including eight detached and three townhome communities. Their topdetached subdivision for permits was Turtle Creek in Newport News with 36 permits, and for closings was Fenwick Hillsin James City County with 31 closings recorded. Greensprings West in James City County was their top community forrevenue with $10,208,067.
HHHunt Homes was the No 2 builder for permits with 151 issued during 2011. HHHunt was active in seven commu-nities on the Peninsula during the year including five detached and two attached. Most of the permits were issued toHampshire Glen in Hampton and Meridian Parkside in Newport News with 57 permits each. The Dragas Companieswas the No 3 builder for permits with 134 issued across four communities in Chesapeake including Brighton Park, KingsPointe, Oakbrooke Crossing and their latest community, The Grove at the Arboretum.
Dragas was the No 2 builder for number of closings with 155 recorded during 2011. Southmoor in Virginia Beach hadthe most closings at 46. HHHunt Homes was the No 3 builder for number of closings recorded with 106. HampshireGlen in Hampton had the most with 46.
(See Table # 5 for details)
Ryan Homes is actively building in 11 new com-munities on the Peninsula including eightdetached and three townhome communities.Their top detached subdivision for permits wasTurtle Creek in Newport News with 36 permits,and for closings was Fenwick Hills in James CityCounty with 31 closings recorded andGreensprings West in James City County was theirtop community for revenue with $10,208,067.
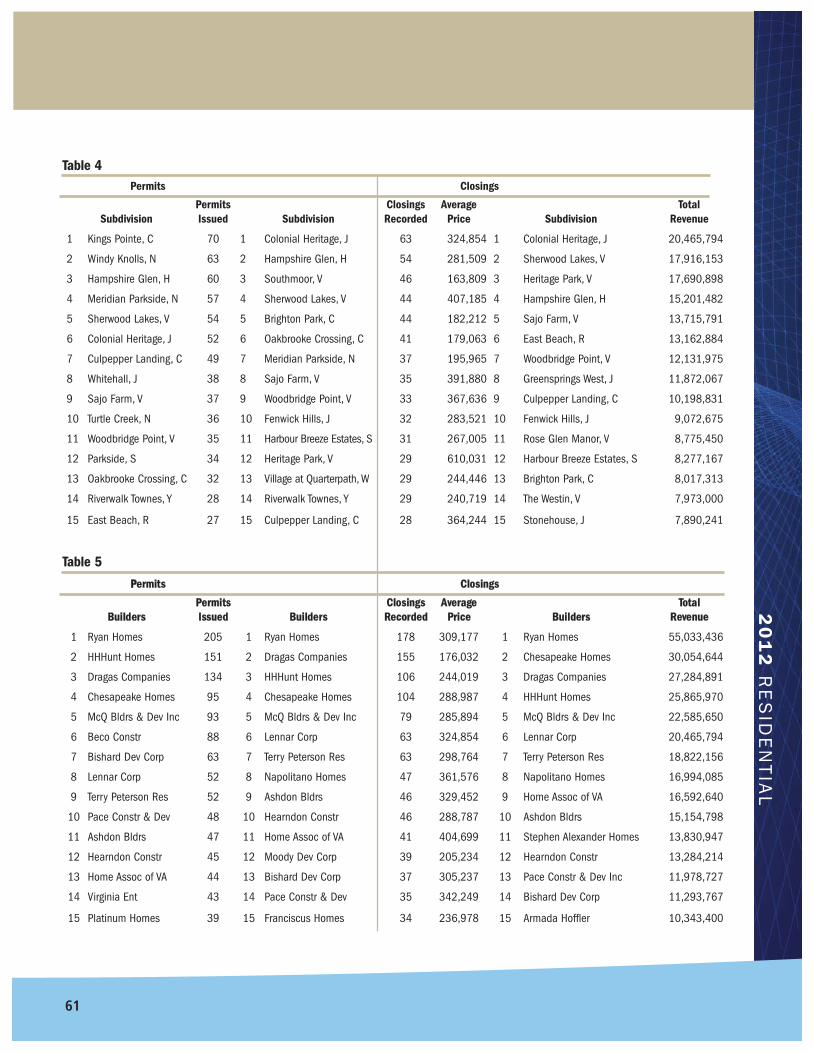
20
12
RE
SID
EN
TIA
L
Permits Closings
SubdivisionPermitsIssued Subdivision
ClosingsRecorded
AveragePrice Subdivision
TotalRevenue
1 Kings Pointe, C 70 1 Colonial Heritage, J 63 324,854 1 Colonial Heritage, J 20,465,794
2 Windy Knolls, N 63 2 Hampshire Glen, H 54 281,509 2 Sherwood Lakes, V 17,916,153
3 Hampshire Glen, H 60 3 Southmoor, V 46 163,809 3 Heritage Park, V 17,690,898
4 Meridian Parkside, N 57 4 Sherwood Lakes, V 44 407,185 4 Hampshire Glen, H 15,201,482
5 Sherwood Lakes, V 54 5 Brighton Park, C 44 182,212 5 Sajo Farm, V 13,715,791
6 Colonial Heritage, J 52 6 Oakbrooke Crossing, C 41 179,063 6 East Beach, R 13,162,884
7 Culpepper Landing, C 49 7 Meridian Parkside, N 37 195,965 7 Woodbridge Point, V 12,131,975
8 Whitehall, J 38 8 Sajo Farm, V 35 391,880 8 Greensprings West, J 11,872,067
9 Sajo Farm, V 37 9 Woodbridge Point, V 33 367,636 9 Culpepper Landing, C 10,198,831
10 Turtle Creek, N 36 10 Fenwick Hills, J 32 283,521 10 Fenwick Hills, J 9,072,675
11 Woodbridge Point, V 35 11 Harbour Breeze Estates, S 31 267,005 11 Rose Glen Manor, V 8,775,450
12 Parkside, S 34 12 Heritage Park, V 29 610,031 12 Harbour Breeze Estates, S 8,277,167
13 Oakbrooke Crossing, C 32 13 Village at Quarterpath, W 29 244,446 13 Brighton Park, C 8,017,313
14 Riverwalk Townes, Y 28 14 Riverwalk Townes, Y 29 240,719 14 The Westin, V 7,973,000
15 East Beach, R 27 15 Culpepper Landing, C 28 364,244 15 Stonehouse, J 7,890,241
PPermits Closings
BuildersPermitsIssued Builders
ClosingsRecorded
AveragePrice Builders
TotalRevenue
1 Ryan Homes 205 1 Ryan Homes 178 309,177 1 Ryan Homes 55,033,436
2 HHHunt Homes 151 2 Dragas Companies 155 176,032 2 Chesapeake Homes 30,054,644
3 Dragas Companies 134 3 HHHunt Homes 106 244,019 3 Dragas Companies 27,284,891
4 Chesapeake Homes 95 4 Chesapeake Homes 104 288,987 4 HHHunt Homes 25,865,970
5 McQ Bldrs & Dev Inc 93 5 McQ Bldrs & Dev Inc 79 285,894 5 McQ Bldrs & Dev Inc 22,585,650
6 Beco Constr 88 6 Lennar Corp 63 324,854 6 Lennar Corp 20,465,794
7 Bishard Dev Corp 63 7 Terry Peterson Res 63 298,764 7 Terry Peterson Res 18,822,156
8 Lennar Corp 52 8 Napolitano Homes 47 361,576 8 Napolitano Homes 16,994,085
9 Terry Peterson Res 52 9 Ashdon Bldrs 46 329,452 9 Home Assoc of VA 16,592,640
10 Pace Constr & Dev 48 10 Hearndon Constr 46 288,787 10 Ashdon Bldrs 15,154,798
11 Ashdon Bldrs 47 11 Home Assoc of VA 41 404,699 11 Stephen Alexander Homes 13,830,947
12 Hearndon Constr 45 12 Moody Dev Corp 39 205,234 12 Hearndon Constr 13,284,214
13 Home Assoc of VA 44 13 Bishard Dev Corp 37 305,237 13 Pace Constr & Dev Inc 11,978,727
14 Virginia Ent 43 14 Pace Constr & Dev 35 342,249 14 Bishard Dev Corp 11,293,767
15 Platinum Homes 39 15 Franciscus Homes 34 236,978 15 Armada Hoffler 10,343,400
Table 5
Table 4
61

622012 Hampton Roads Real Estate Market Review
2012 R E S I D E N T I A L
The Hampton Roads existing residential real estate market showed signs of stability throughout the year 2011.Existing home closings picked up from where the leading indicators left off at the end of 2010. Even without the influ-ence of the federal first-time home-buyer’s tax credit, closings on existing homes rose, though many of those closingswere of distressed homes. Not all quarters of 2011 were positive. Although the first, third and fourth quarters expe-rienced growth in closings of existing homes each month, the second quarter was negative when compared to the sec-ond quarter of 2010. Overall, the region flourished as inventory levels dropped and closings rose for the vast majori-ty of local cities and counties.
The active inventory of existing homes for sale in the region for 2011 fell as measured at year end 12% when com-pared to 2010. There were 8,614 existing homes for sale at the end of 2011 whereas there were 9,809 existinghomes for sale at the end of 2010. The sharp drop in existing homes for sale and the consistent growth of closingsduring the majority of 2011 caused the months’ supply of inventory in the Hampton Roads region to fall to 6.9 months.A measure between six to eight months inventory is within most experts’ ideal range of supply to signify a healthy mar-ket. However, this particular measure does not account for the added inventory new construction homes contributeto the entire real estate market supply.
EXISTING HOMES
25,000
20,000
15,000
10,000
5,000
0
$250,000
$200,000
$150,000
$100,000
$50,000
$02000 2001 2002 2003 2004 2005 2006 2007 2008 2009 2010 2011
5,53
816
,612
$99,999
$49,300
$64,100
$109,900$117,050
$130,000
$157,900
$194,500
$215,000
$60,300$65,100 68,200
$59,100$56,600$55,200$53,800$51,000
$224,900
$219,900
$208,000 $205,000$194,000
4,87
318
,430
3,83
119
,604
2,80
120
,881
2,01
523
,209
2,09
324
,207
4,31
321
,890
6,98
2
18,5
72
9,05
514
,517
10,0
7715
,526
9,80
914
,265
8,61
415
,017
Existing Active Homes for Sale Existing Home Closings Existing Home Median SP HUD Median Household Income
$68,200
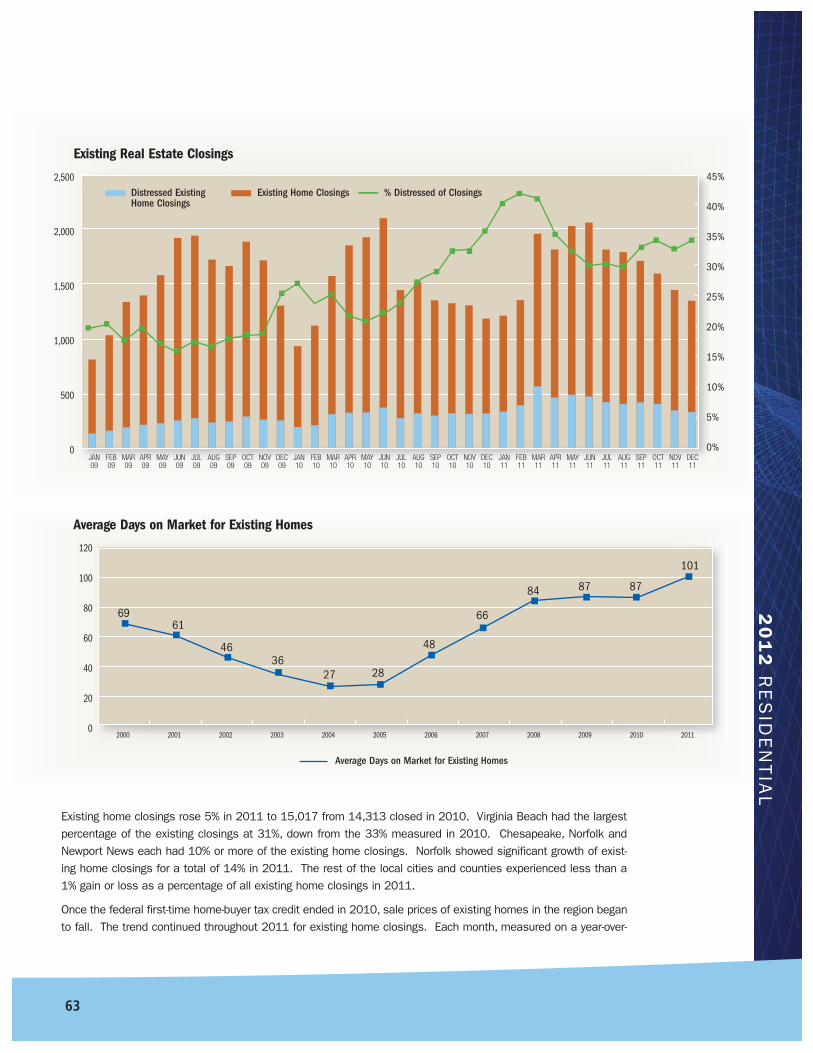
20
12
RE
SID
EN
TIA
L
45%
40%
35%
30%
25%
20%
15%
10%
5%
0%
2,500
2,000
1,500
1,000
500
0
Existing Real Estate Closings
Average Days on Market for Existing Homes
JAN09
FEB09
MAR09
APR09
MAY09
JUN09
JUL09
AUG09
SEP09
OCT09
NOV09
DEC09
JAN10
FEB10
MAR10
APR10
MAY10
JUN10
JUL10
AUG10
SEP10
OCT10
NOV10
DEC10
JAN11
FEB11
MAR11
APR11
MAY11
JUN11
JUL11
AUG11
SEP11
OCT11
NOV11
DEC11
Distressed ExistingHome Closings
Existing Home Closings % Distressed of Closings
120
100
80
60
40
20
02000 2001 2002 2003 2004 2005 2006 2007 2008 2009 2010 2011
6961
4636
27 28
48
66
84 87 87
101
Average Days on Market for Existing Homes
Existing home closings rose 5% in 2011 to 15,017 from 14,313 closed in 2010. Virginia Beach had the largestpercentage of the existing closings at 31%, down from the 33% measured in 2010. Chesapeake, Norfolk andNewport News each had 10% or more of the existing home closings. Norfolk showed significant growth of exist-ing home closings for a total of 14% in 2011. The rest of the local cities and counties experienced less than a1% gain or loss as a percentage of all existing home closings in 2011.
Once the federal first-time home-buyer tax credit ended in 2010, sale prices of existing homes in the region beganto fall. The trend continued throughout 2011 for existing home closings. Each month, measured on a year-over-
63
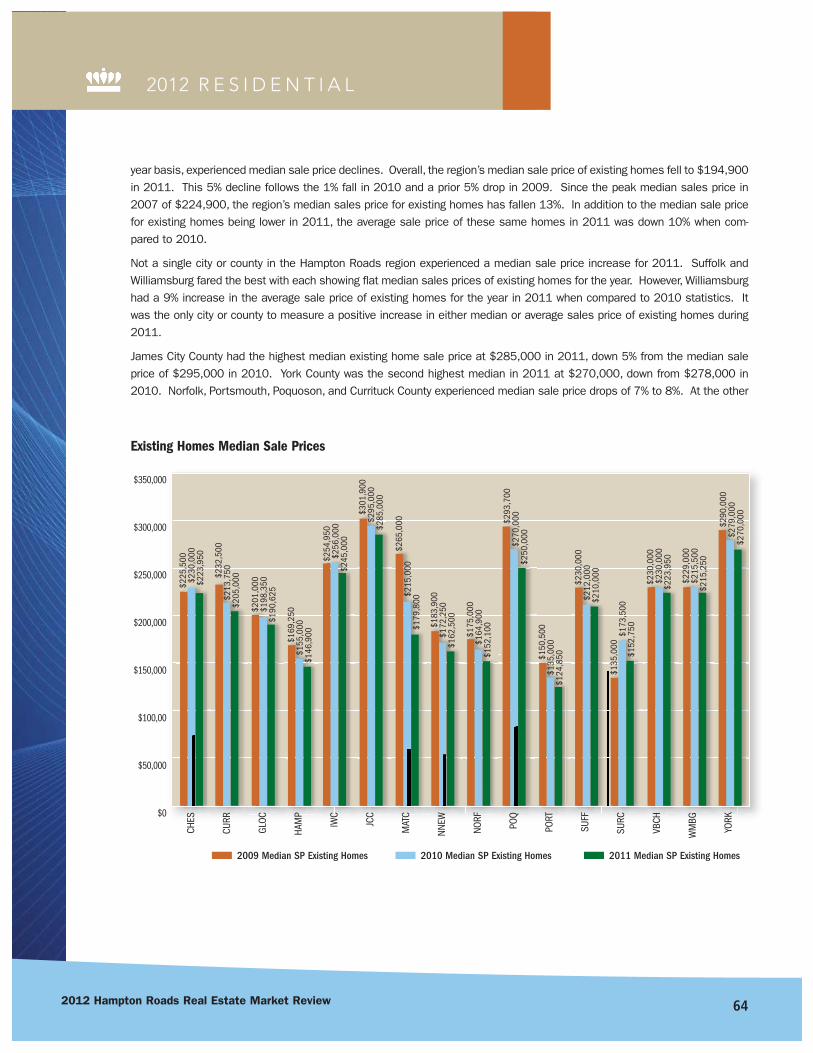
642012 Hampton Roads Real Estate Market Review
2012 R E S I D E N T I A L
year basis, experienced median sale price declines. Overall, the region’s median sale price of existing homes fell to $194,900in 2011. This 5% decline follows the 1% fall in 2010 and a prior 5% drop in 2009. Since the peak median sales price in2007 of $224,900, the region’s median sales price for existing homes has fallen 13%. In addition to the median sale pricefor existing homes being lower in 2011, the average sale price of these same homes in 2011 was down 10% when com-pared to 2010.
Not a single city or county in the Hampton Roads region experienced a median sale price increase for 2011. Suffolk andWilliamsburg fared the best with each showing flat median sales prices of existing homes for the year. However, Williamsburghad a 9% increase in the average sale price of existing homes for the year in 2011 when compared to 2010 statistics. Itwas the only city or county to measure a positive increase in either median or average sales price of existing homes during2011.
James City County had the highest median existing home sale price at $285,000 in 2011, down 5% from the median saleprice of $295,000 in 2010. York County was the second highest median in 2011 at $270,000, down from $278,000 in2010. Norfolk, Portsmouth, Poquoson, and Currituck County experienced median sale price drops of 7% to 8%. At the other
$225
,500
$230
,000
$223
,950
$232
,500
$213
,750
$205
,000
$201
,000
$198
,350
$190
,625
$169
,250
$155
,000
$146
,900
$254
,950
$256
,000
$245
,000
$301
,900
$295
,000
$285
,000
$265
,000
$215
,000
$179
,800
$183
,900
$172
,250
$162
,500
$175
,000
$164
,900
$152
,100
$293
,700
$270
,000
$250
,000
$150
,500
$135
,000
$124
,850
$230
,000
$212
,000
$210
,000
$135
,000
$173
,500
$152
,750
$230
,000
$230
,000
$223
,950
$229
,000
$215
,500
$215
,250
$290
,000
$279
,000
$270
,000
$350,000
$300,000
$250,000
$200,000
$150,000
$100,00
$50,000
$0
CHES
CURR
GLOC
HAM
P
IWC
JCC
MAT
C
NNEW
NORF
POQ
PORT
SUFF
SURC
VBCH
WM
BG
YORK
2009 Median SP Existing Homes 2010 Median SP Existing Homes 2011 Median SP Existing Homes
Existing Homes Median Sale Prices
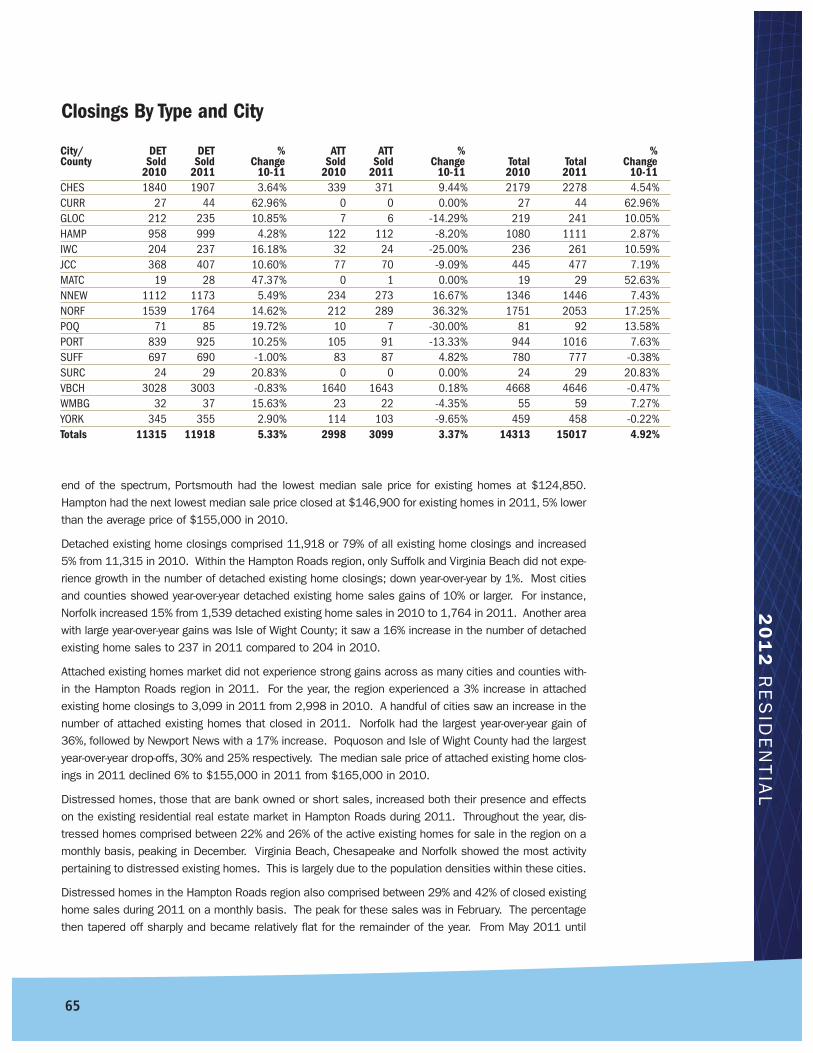
20
12
RE
SID
EN
TIA
L
end of the spectrum, Portsmouth had the lowest median sale price for existing homes at $124,850.Hampton had the next lowest median sale price closed at $146,900 for existing homes in 2011, 5% lowerthan the average price of $155,000 in 2010.
Detached existing home closings comprised 11,918 or 79% of all existing home closings and increased5% from 11,315 in 2010. Within the Hampton Roads region, only Suffolk and Virginia Beach did not expe-rience growth in the number of detached existing home closings; down year-over-year by 1%. Most citiesand counties showed year-over-year detached existing home sales gains of 10% or larger. For instance,Norfolk increased 15% from 1,539 detached existing home sales in 2010 to 1,764 in 2011. Another areawith large year-over-year gains was Isle of Wight County; it saw a 16% increase in the number of detachedexisting home sales to 237 in 2011 compared to 204 in 2010.
Attached existing homes market did not experience strong gains across as many cities and counties with-in the Hampton Roads region in 2011. For the year, the region experienced a 3% increase in attachedexisting home closings to 3,099 in 2011 from 2,998 in 2010. A handful of cities saw an increase in thenumber of attached existing homes that closed in 2011. Norfolk had the largest year-over-year gain of36%, followed by Newport News with a 17% increase. Poquoson and Isle of Wight County had the largestyear-over-year drop-offs, 30% and 25% respectively. The median sale price of attached existing home clos-ings in 2011 declined 6% to $155,000 in 2011 from $165,000 in 2010.
Distressed homes, those that are bank owned or short sales, increased both their presence and effectson the existing residential real estate market in Hampton Roads during 2011. Throughout the year, dis-tressed homes comprised between 22% and 26% of the active existing homes for sale in the region on amonthly basis, peaking in December. Virginia Beach, Chesapeake and Norfolk showed the most activitypertaining to distressed existing homes. This is largely due to the population densities within these cities.
Distressed homes in the Hampton Roads region also comprised between 29% and 42% of closed existinghome sales during 2011 on a monthly basis. The peak for these sales was in February. The percentagethen tapered off sharply and became relatively flat for the remainder of the year. From May 2011 until
Closings By Type and City
City/ DET DET % ATT ATT % %County Sold Sold Change Sold Sold Change Total Total Change
2010 2011 10-11 2010 2011 10-11 2010 2011 10-11CHES 1840 1907 3.64% 339 371 9.44% 2179 2278 4.54%CURR 27 44 62.96% 0 0 0.00% 27 44 62.96%GLOC 212 235 10.85% 7 6 -14.29% 219 241 10.05%HAMP 958 999 4.28% 122 112 -8.20% 1080 1111 2.87%IWC 204 237 16.18% 32 24 -25.00% 236 261 10.59%JCC 368 407 10.60% 77 70 -9.09% 445 477 7.19%MATC 19 28 47.37% 0 1 0.00% 19 29 52.63%NNEW 1112 1173 5.49% 234 273 16.67% 1346 1446 7.43%NORF 1539 1764 14.62% 212 289 36.32% 1751 2053 17.25%POQ 71 85 19.72% 10 7 -30.00% 81 92 13.58%PORT 839 925 10.25% 105 91 -13.33% 944 1016 7.63%SUFF 697 690 -1.00% 83 87 4.82% 780 777 -0.38%SURC 24 29 20.83% 0 0 0.00% 24 29 20.83%VBCH 3028 3003 -0.83% 1640 1643 0.18% 4668 4646 -0.47%WMBG 32 37 15.63% 23 22 -4.35% 55 59 7.27%YORK 345 355 2.90% 114 103 -9.65% 459 458 -0.22%Totals 11315 11918 5.33% 2998 3099 3.37% 14313 15017 4.92%
65
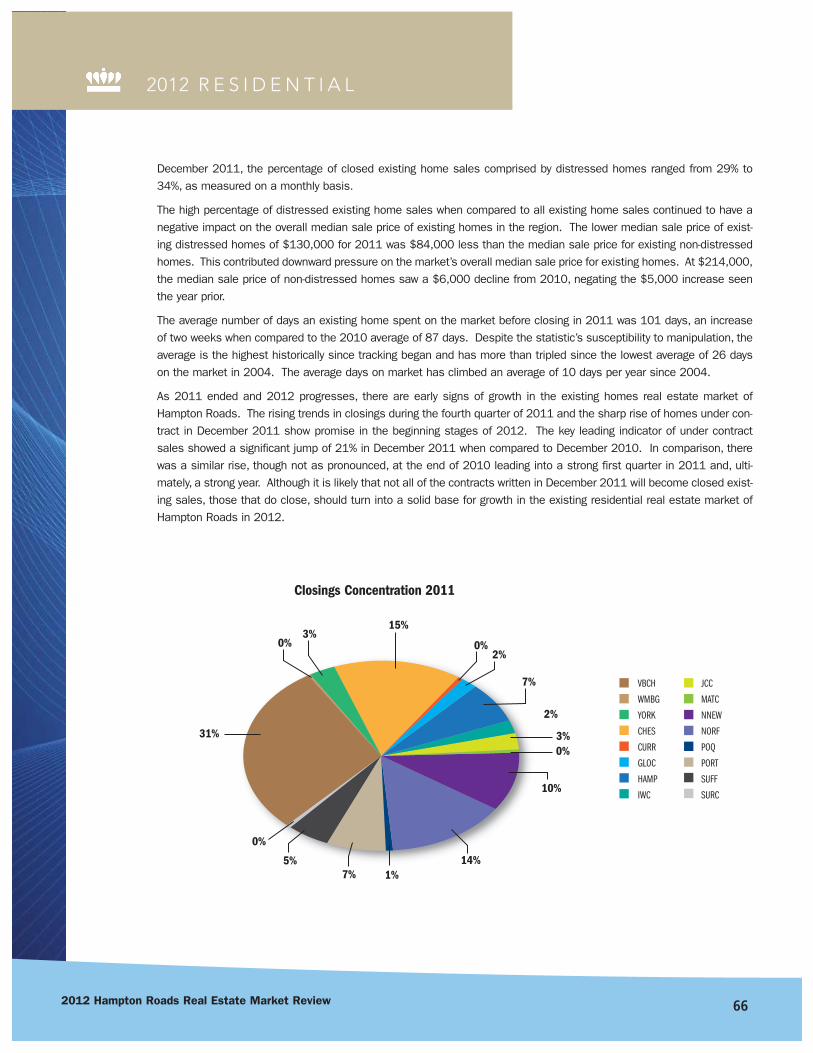
662012 Hampton Roads Real Estate Market Review
2012 R E S I D E N T I A L
December 2011, the percentage of closed existing home sales comprised by distressed homes ranged from 29% to34%, as measured on a monthly basis.
The high percentage of distressed existing home sales when compared to all existing home sales continued to have anegative impact on the overall median sale price of existing homes in the region. The lower median sale price of exist-ing distressed homes of $130,000 for 2011 was $84,000 less than the median sale price for existing non-distressedhomes. This contributed downward pressure on the market’s overall median sale price for existing homes. At $214,000,the median sale price of non-distressed homes saw a $6,000 decline from 2010, negating the $5,000 increase seenthe year prior.
The average number of days an existing home spent on the market before closing in 2011 was 101 days, an increaseof two weeks when compared to the 2010 average of 87 days. Despite the statistic’s susceptibility to manipulation, theaverage is the highest historically since tracking began and has more than tripled since the lowest average of 26 dayson the market in 2004. The average days on market has climbed an average of 10 days per year since 2004.
As 2011 ended and 2012 progresses, there are early signs of growth in the existing homes real estate market ofHampton Roads. The rising trends in closings during the fourth quarter of 2011 and the sharp rise of homes under con-tract in December 2011 show promise in the beginning stages of 2012. The key leading indicator of under contractsales showed a significant jump of 21% in December 2011 when compared to December 2010. In comparison, therewas a similar rise, though not as pronounced, at the end of 2010 leading into a strong first quarter in 2011 and, ulti-mately, a strong year. Although it is likely that not all of the contracts written in December 2011 will become closed exist-ing sales, those that do close, should turn into a solid base for growth in the existing residential real estate market ofHampton Roads in 2012.
Closings Concentration 2011
15%3%
2%
7%
2%
3%
10%
14%1%7%
5%
0%
31%
0% 0%
0%
VBCH
WMBG
YORK
CHES
CURR
GLOC
HAMP
IWC
JCC
MATC
NNEW
NORF
POQ
PORT
SUFF
SURC

20
12
RE
SID
EN
TIA
L
ABOUT THE DATA:
The underlying data the resale home closing statistics are based upon is the col-
lection of those closings belonging to Real Estate Information Network, Inc. (REIN)
members only. The data for each sales transaction was input by hand and therefore may
contain some errors at the individual home sale level. But, as a collection, this data rep-
resents the timeliest and most accurate dataset of resale homes for the entire Hampton
Roads region.
The strength of the dataset lies within its proximity to origin and depth. The MLS
(Multiple Listing Service) data is considered the deepest of any resale home database
due to the sheer number of rich data fields within the database and the information con-
tained within. The information is also being keyed by either the actual listing agent or
administrative staff of the same real estate firm. The combination of these two key ele-
ments allows the MLS data to be more precise than many other information reposito-
ries and vastly timelier.
But, MLS data does have weaknesses. Most notably is the portion of the dataset
at the edges of the MLS’s boundaries. Usually, MLS membership wanes around the bor-
ders of the coverage area, due to overlapping MLSes. In such overlap areas, any given
real estate broker may choose to join only one of the two or more MLSes that cover the
particular area. For the local MSA and the region covered by REIN, this translates into
less than ideal accountability for sales in North Carolina, Northern Neck areas of
Virginia, and the Williamsburg area.
As for REIN, it is an independent MLS owned by broker stockholder members.
Currently, there are approximately 500 real estate firms with over 5,800 real estate
agents serving the entire Hampton Roads region.
67
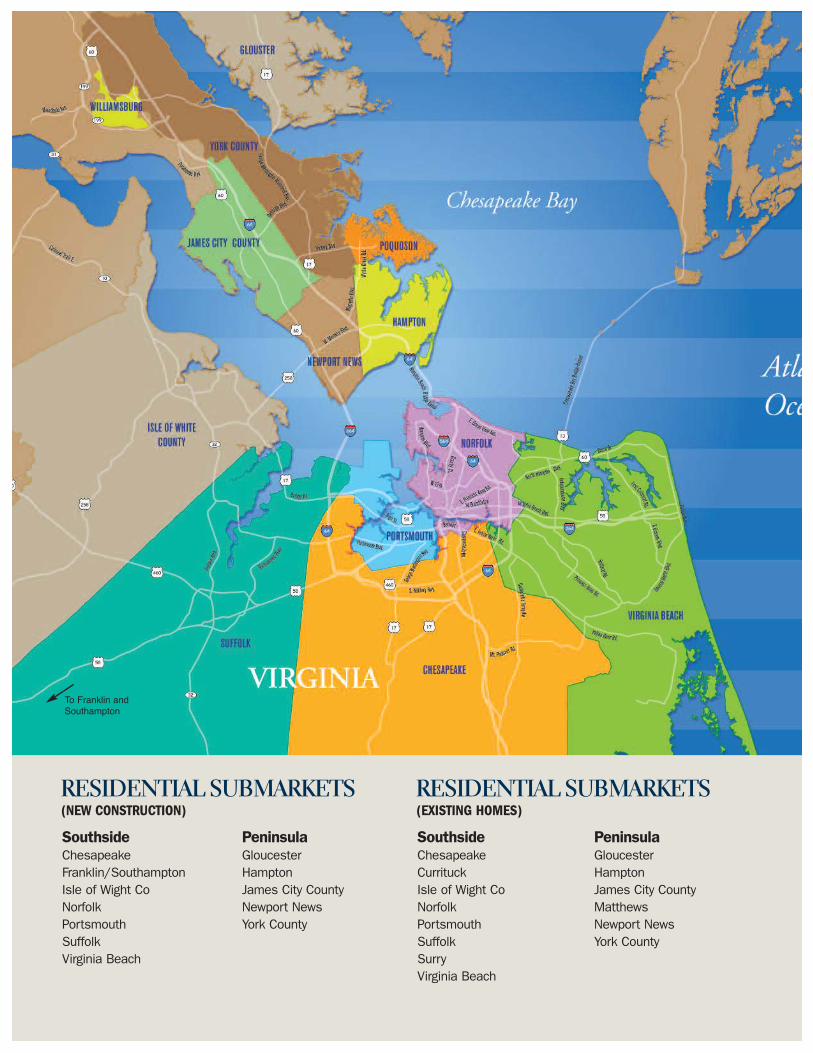
RESIDENTIAL SUBMARKETS(NEW CONSTRUCTION)
SouthsideChesapeakeFranklin/SouthamptonIsle of Wight CoNorfolkPortsmouthSuffolkVirginia Beach
PeninsulaGloucesterHamptonJames City CountyNewport NewsYork County
RESIDENTIAL SUBMARKETS (EXISTING HOMES)
SouthsideChesapeakeCurrituckIsle of Wight CoNorfolkPortsmouthSuffolkSurryVirginia Beach
PeninsulaGloucesterHamptonJames City CountyMatthews Newport NewsYork County
To Franklin andSouthampton
69
Author Charles Dalton
Data Analysis Real Data
Financial The E. V. Williams Center for Real Estate and Economic Support Development (CREED) functions and reports are funded by
donations from CREED IPAC and Council Advisory Boards,organizations and individuals.
Disclosure The data used for this report are deemed reliable; however, neither Old Dominion University, the E. V. Williams Center for Real Estate and Economic Development, nor sponsoring companiesand/or individuals makes any representation or warranty as to itsaccuracy.
20
12
MU
LTI-FA
MILY
H A M P T O N
R O A D S
M A R K E T
R E V I E W
MULTIFAMILY

702012 Hampton Roads Real Estate Market Review
2012 M U LT I - F A M I LY
he Norfolk-Virginia Beach-Newport News ApartmentReport, published by Real Data, is a detailed analy-sis of the rental market within conventional apart-ment communities in the Hampton Roads region.The area has been divided into nine submarkets:
Chesapeake, Hampton, Newport News, Norfolk, Portsmouth,Suffolk, Virginia Beach, Williamsburg and York County.Combined, these areas contain a survey base of over 95,000units within conventional apartment communities of 50 ormore units each.
The Norfolk-Virginia Beach-Newport News market is dividedinto two portions by the James River. The Peninsula area isnorth of the James River and contains Hampton, NewportNews, Williamsburg and York County. The Tidewater area is south of the James River and contains Chesapeake,Norfolk, Portsmouth, Suffolk and Virginia Beach; also known as South Hampton Roads. The cities with the high-est concentration of units are Virginia Beach and Newport News, which accounts for nearly one half of theregion’s apartment units.
The Hampton Roads apartment market hasremained stable over the past 18-24 months.Occupancy rates for the overall market are94% which is higher than most major metrosin the southeast. Looking ahead, apartmentsshould see improving fundamentals due tostrengthening demand for rentals in lieu ofhome ownership.
Development activity increased over the sec-ond half of 2010 as investors and developerslooked to take advantage of a reboundingrental market. As of October 2010, there werenearly 2,000 units under construction; however,this equates to only a 2% growth rate in supplyover the next 12-24 months which will helpkeep occupancies at or above current levels.
The average quoted rental rate is $926, with one-bedroom rents averaging $825 per month, two-bedroom unitsaveraging $932 per month, and three-bedroom units reporting an average rental rate of $1,103 per month.Average rental rates from existing inventory increased by $14.60 in the last twelve months. Although rents haverisen in each of the last three years, rent growth over the past 18 months has lagged the larger increases record-ed in many other cities.
General Overview
T
Submarket Percentages
Hampton12%
Newport News22%
Portsmouth8%
VirginiaBeach25%
Norfolk15%
Chesapeake11%
Suffolk1%
Williamsburg4%
York County2%
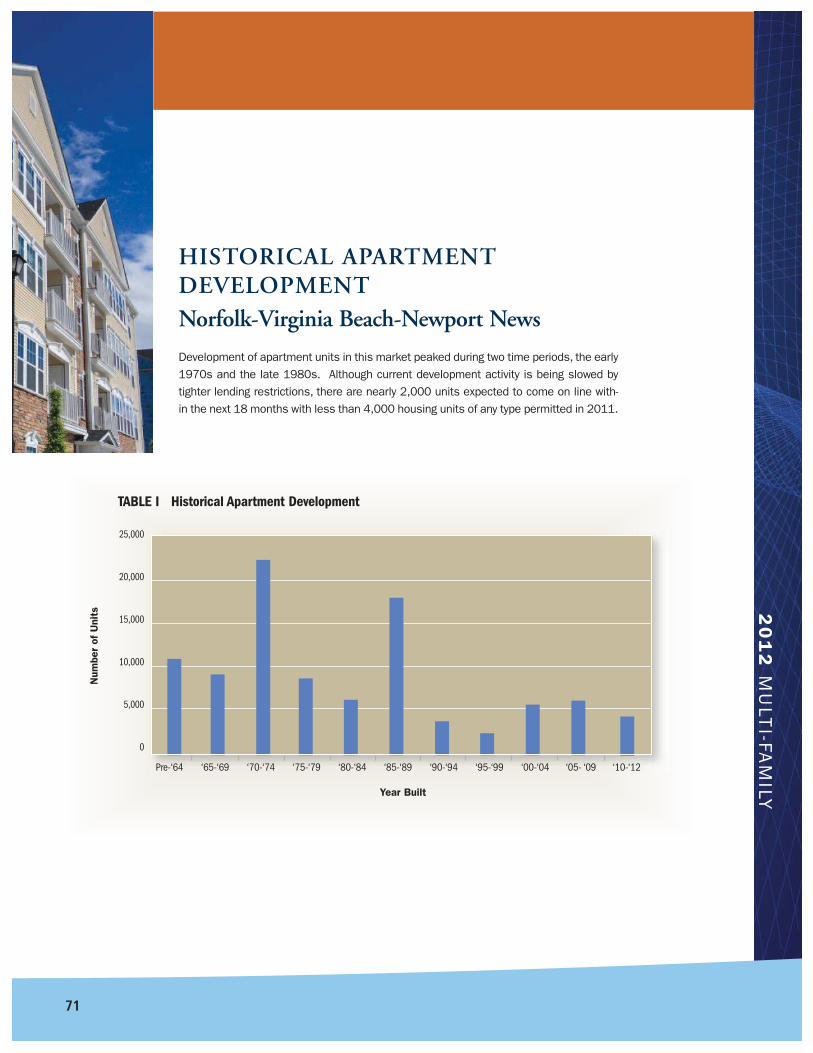
Development of apartment units in this market peaked during two time periods, the early1970s and the late 1980s. Although current development activity is being slowed bytighter lending restrictions, there are nearly 2,000 units expected to come on line with-in the next 18 months with less than 4,000 housing units of any type permitted in 2011.
HISTORICAL APARTMENT DEVELOPMENTNorfolk-Virginia Beach-Newport News
20
12
MU
LTI-FA
MILY
71
25,000
20,000
15,000
10,000
5,000
0
Pre-‘64 ‘65-‘69 ‘70-‘74 ‘75-‘79 ‘80-‘84 ‘85-‘89 ‘90-‘94 ‘95-‘99 ‘00-‘04 ‘05- ‘09 ‘10-‘12
Num
ber
of U
nits
Year Built
TABLE I Historical Apartment Development
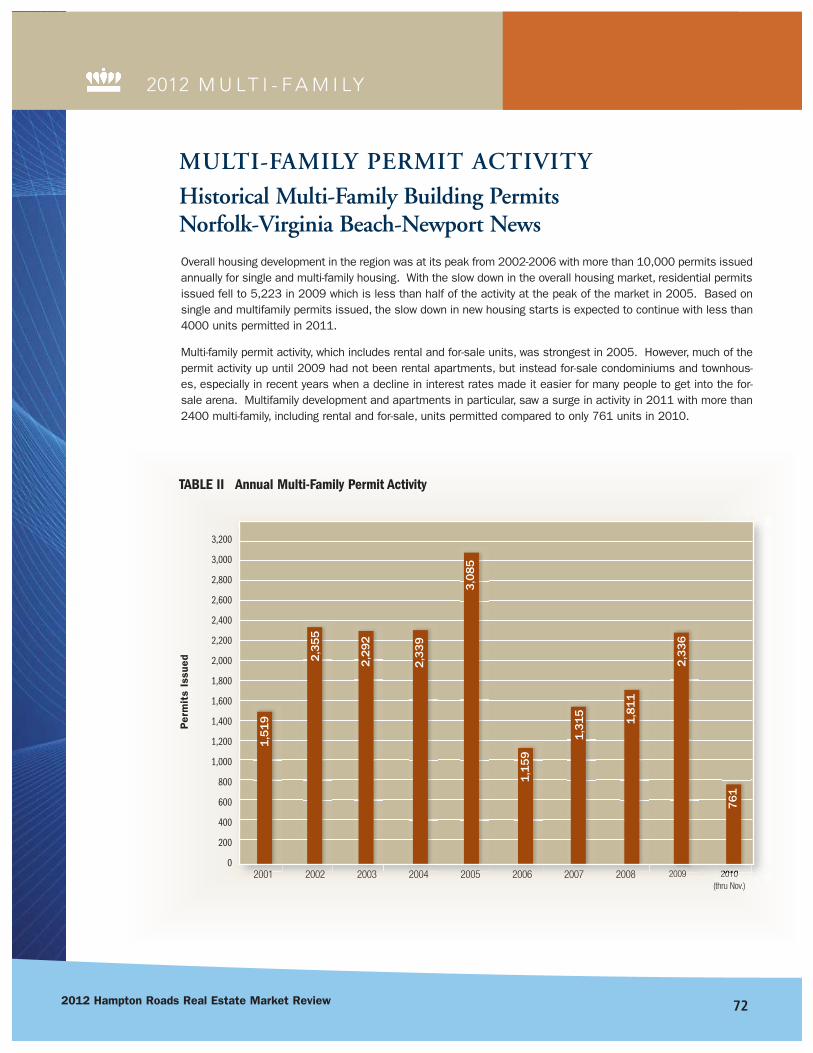
722012 Hampton Roads Real Estate Market Review
2012 M U LT I - F A M I LY
Overall housing development in the region was at its peak from 2002-2006 with more than 10,000 permits issuedannually for single and multi-family housing. With the slow down in the overall housing market, residential permitsissued fell to 5,223 in 2009 which is less than half of the activity at the peak of the market in 2005. Based onsingle and multifamily permits issued, the slow down in new housing starts is expected to continue with less than4000 units permitted in 2011.
Multi-family permit activity, which includes rental and for-sale units, was strongest in 2005. However, much of thepermit activity up until 2009 had not been rental apartments, but instead for-sale condominiums and townhous-es, especially in recent years when a decline in interest rates made it easier for many people to get into the for-sale arena. Multifamily development and apartments in particular, saw a surge in activity in 2011 with more than2400 multi-family, including rental and for-sale, units permitted compared to only 761 units in 2010.
MULTI-FAMILY PERMIT ACTIVITY
Historical Multi-Family Building Permits Norfolk-Virginia Beach-Newport News
3,200
3,000
2,800
2,600
2,400
2,200
2,000
1,800
1,600
1,400
1,200
1,000
800
600
400
200
0
Per
mit
s Is
sued
1,3
15
1,8
11
1,5
19
2,3
55
2,2
92
2,3
39
3,0
85
1,1
59
2001 2002 2003 2004 2005 2006 2007 2008 2009 2010(thru Nov.)
2,3
36
761
TABLE II Annual Multi-Family Permit Activity
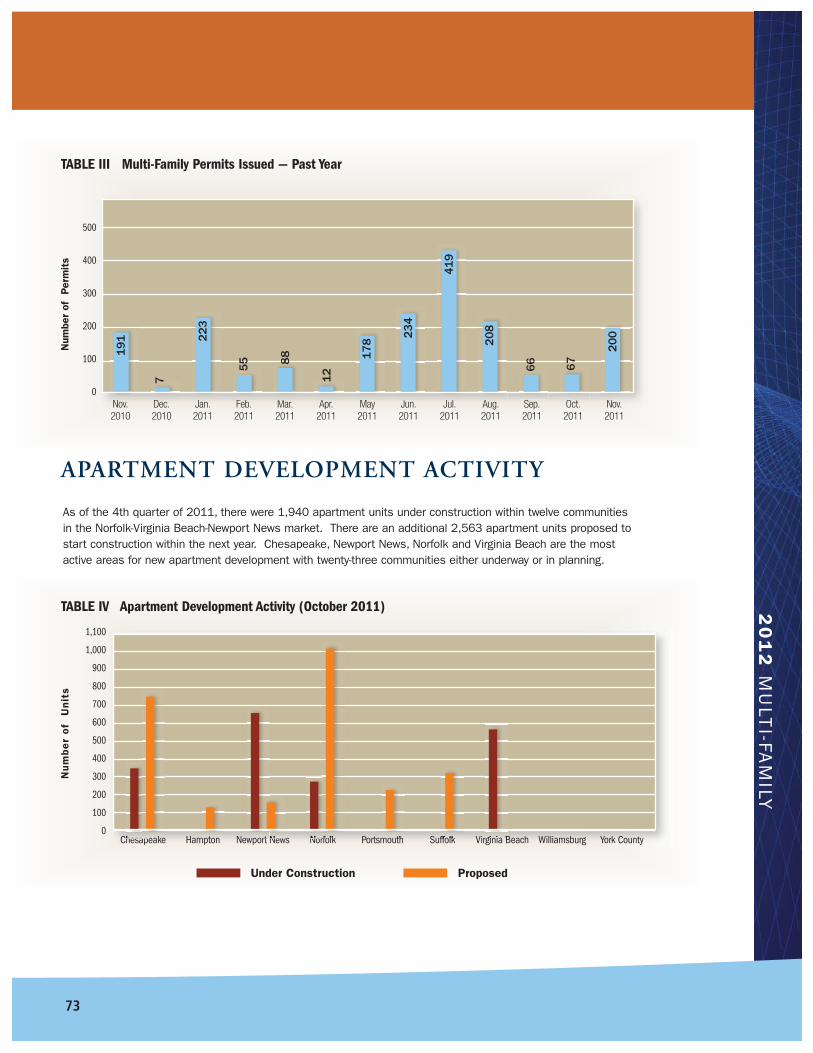
20
12
MU
LTI-FA
MILY
As of the 4th quarter of 2011, there were 1,940 apartment units under construction within twelve communitiesin the Norfolk-Virginia Beach-Newport News market. There are an additional 2,563 apartment units proposed tostart construction within the next year. Chesapeake, Newport News, Norfolk and Virginia Beach are the mostactive areas for new apartment development with twenty-three communities either underway or in planning.
APARTMENT DEVELOPMENT ACTIVITY
500
400
300
200
100
0
Num
ber
of
Per
mit
s
Nov. 2010
Dec. 2010
Jan. 2011
Feb. 2011
Mar. 2011
Apr. 2011
May 2011
Jun. 2011
Jul. 2011
Aug. 2011
Sep. 2011
Oct. 2011
Nov.2011
TABLE III Multi-Family Permits Issued — Past Year
TABLE IV Apartment Development Activity (October 2011)
191
7
223
55 88
12
178
234
419
208
66 67
200
1,100
1,000
900
800
700
600
500
400
300
200
100
0
Num
ber
of
Unit
s
Chesapeake Hampton Newport News Norfolk Portsmouth Suffolk Virginia Beach Williamsburg York County
Under Construction Proposed
73
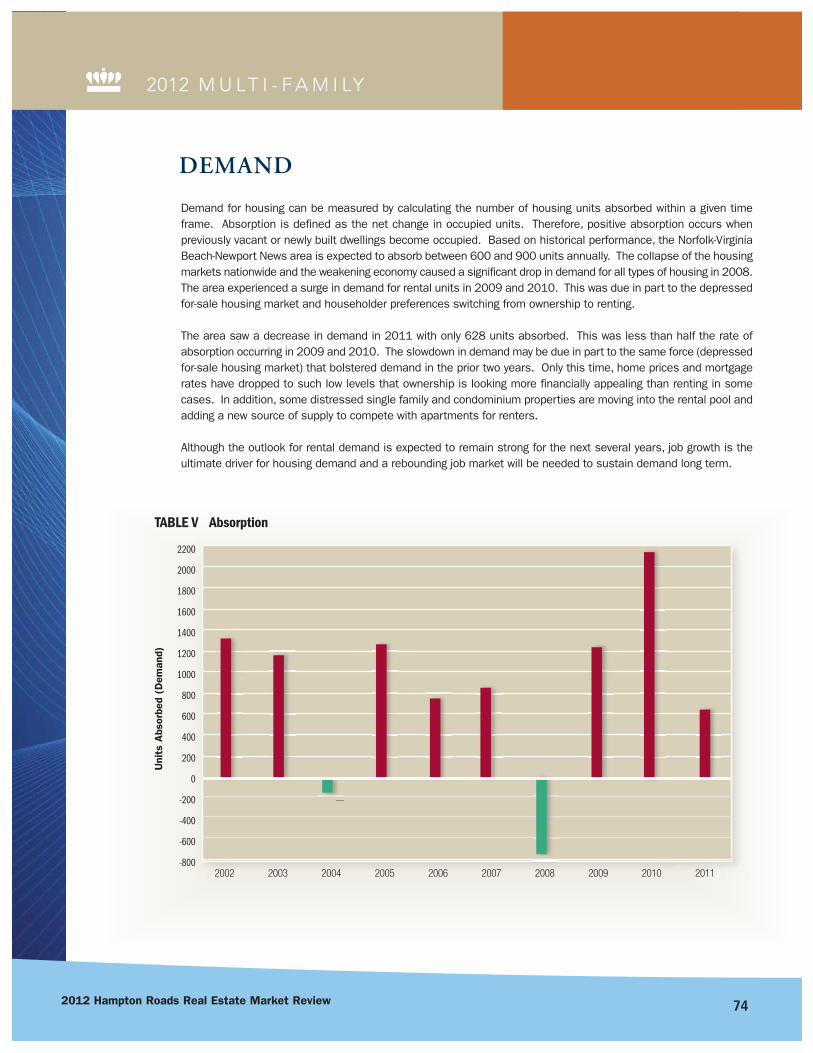
742012 Hampton Roads Real Estate Market Review
2012 M U LT I - F A M I LY
Demand for housing can be measured by calculating the number of housing units absorbed within a given timeframe. Absorption is defined as the net change in occupied units. Therefore, positive absorption occurs whenpreviously vacant or newly built dwellings become occupied. Based on historical performance, the Norfolk-VirginiaBeach-Newport News area is expected to absorb between 600 and 900 units annually. The collapse of the housingmarkets nationwide and the weakening economy caused a significant drop in demand for all types of housing in 2008.The area experienced a surge in demand for rental units in 2009 and 2010. This was due in part to the depressedfor-sale housing market and householder preferences switching from ownership to renting.
The area saw a decrease in demand in 2011 with only 628 units absorbed. This was less than half the rate ofabsorption occurring in 2009 and 2010. The slowdown in demand may be due in part to the same force (depressedfor-sale housing market) that bolstered demand in the prior two years. Only this time, home prices and mortgagerates have dropped to such low levels that ownership is looking more financially appealing than renting in somecases. In addition, some distressed single family and condominium properties are moving into the rental pool andadding a new source of supply to compete with apartments for renters.
Although the outlook for rental demand is expected to remain strong for the next several years, job growth is theultimate driver for housing demand and a rebounding job market will be needed to sustain demand long term.
DEMAND
2200
2000
1800
1600
1400
1200
1000
800
600
400
200
0
-200
-400
-600
-800
Uni
ts A
bsor
bed
(Dem
and)
2002 2003 2004 2005 2006 2007 2008 2009 2010 2011
TABLE V Absorption
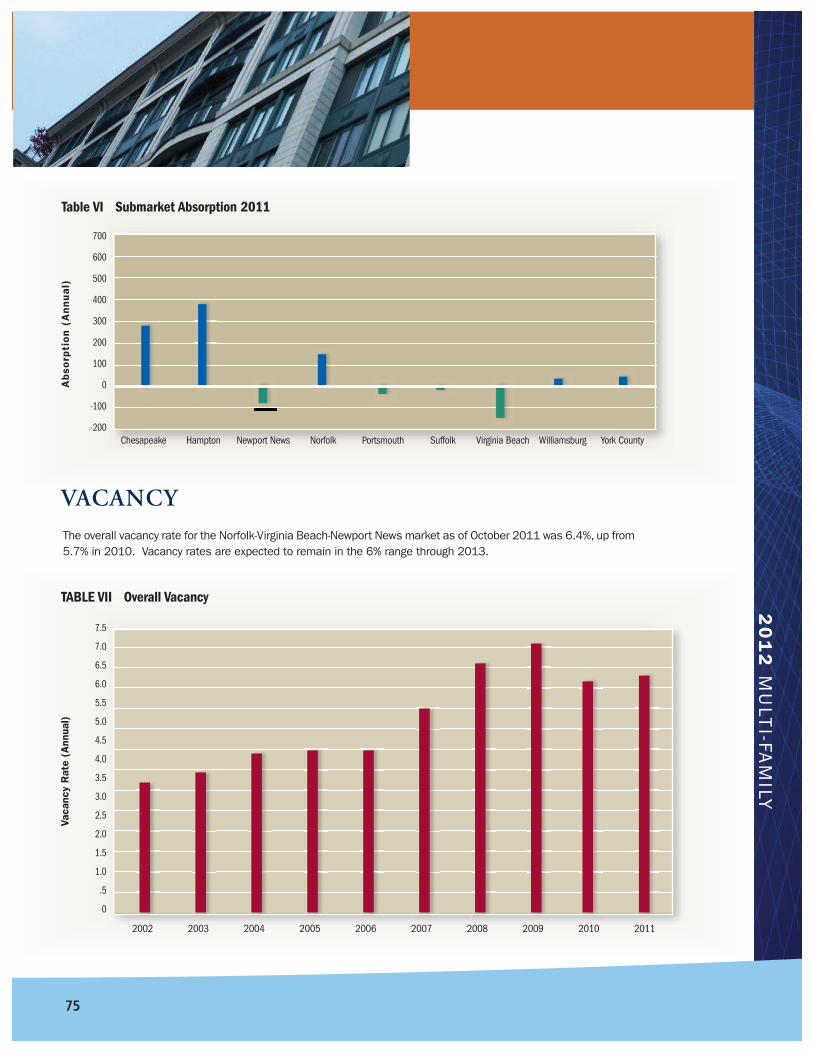
Table VI Submarket Absorption 2011
700
600
500
400
300
200
100
0
-100
-200
Abso
rpti
on (
Annual)
Chesapeake Hampton Newport News Norfolk Portsmouth Suffolk Virginia Beach Williamsburg York County
20
12
MU
LTI-FA
MILY
The overall vacancy rate for the Norfolk-Virginia Beach-Newport News market as of October 2011 was 6.4%, up from5.7% in 2010. Vacancy rates are expected to remain in the 6% range through 2013.
VACANCY
7.5
7.0
6.5
6.0
5.5
5.0
4.5
4.0
3.5
3.0
2.5
2.0
1.5
1.0
.5
0
Vaca
ncy
Rat
e (A
nnua
l)
2002 2003 2004 2005 2006 2007 2008 2009 2010 2011
TABLE VII Overall Vacancy
75
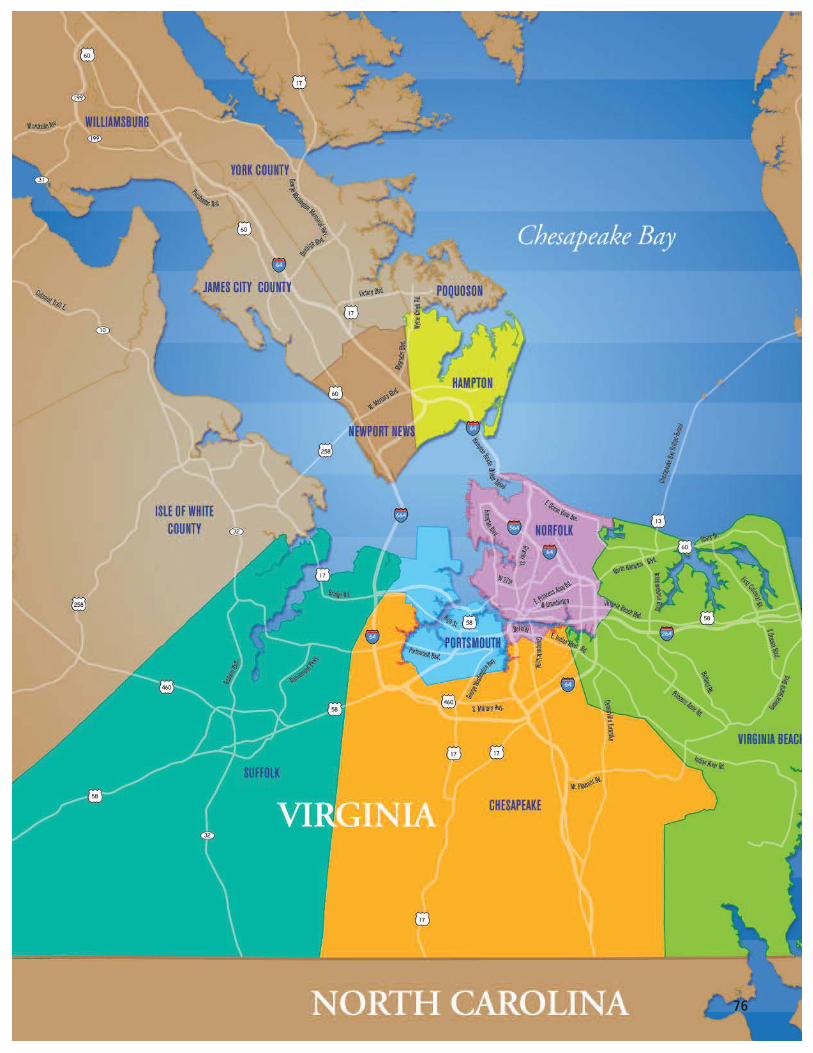
76
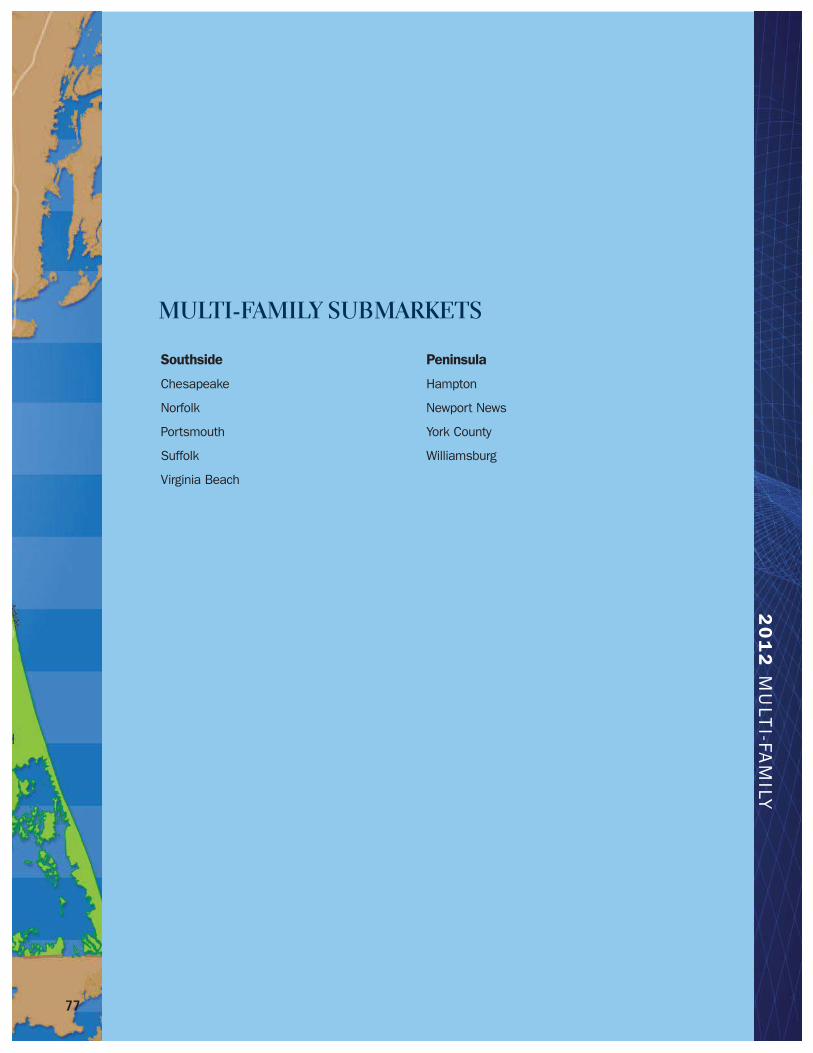
20
12
MU
LTI-FA
MILY
MULTI-FAMILY SUBMARKETS
Southside
Chesapeake
Norfolk
Portsmouth
Suffolk
Virginia Beach
Peninsula
Hampton
Newport News
York County
Williamsburg
77
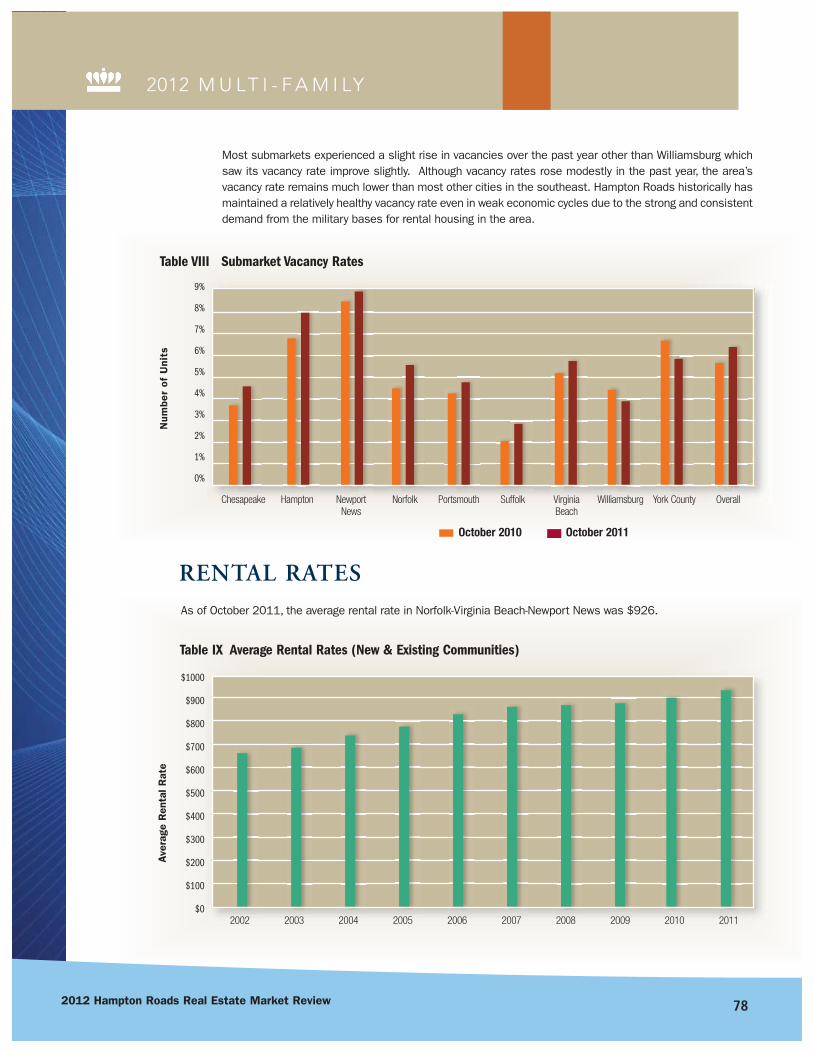
782012 Hampton Roads Real Estate Market Review
2012 M U LT I - F A M I LY
Table VIII Submarket Vacancy Rates
9%
8%
7%
6%
5%
4%
3%
2%
1%
0%
Num
ber
of U
nits
Chesapeake Hampton NewportNews
Norfolk Portsmouth Suffolk VirginiaBeach
Williamsburg York County Overall
October 2010 October 2011
As of October 2011, the average rental rate in Norfolk-Virginia Beach-Newport News was $926.
RENTAL RATES
$1000
$900
$800
$700
$600
$500
$400
$300
$200
$100
$0
Ave
rage
Ren
tal R
ate
2002 2003 2004 2005 2006 2007 2008 2009 2010 2011
Table IX Average Rental Rates (New & Existing Communities)
Most submarkets experienced a slight rise in vacancies over the past year other than Williamsburg whichsaw its vacancy rate improve slightly. Although vacancy rates rose modestly in the past year, the area’svacancy rate remains much lower than most other cities in the southeast. Hampton Roads historically hasmaintained a relatively healthy vacancy rate even in weak economic cycles due to the strong and consistentdemand from the military bases for rental housing in the area.
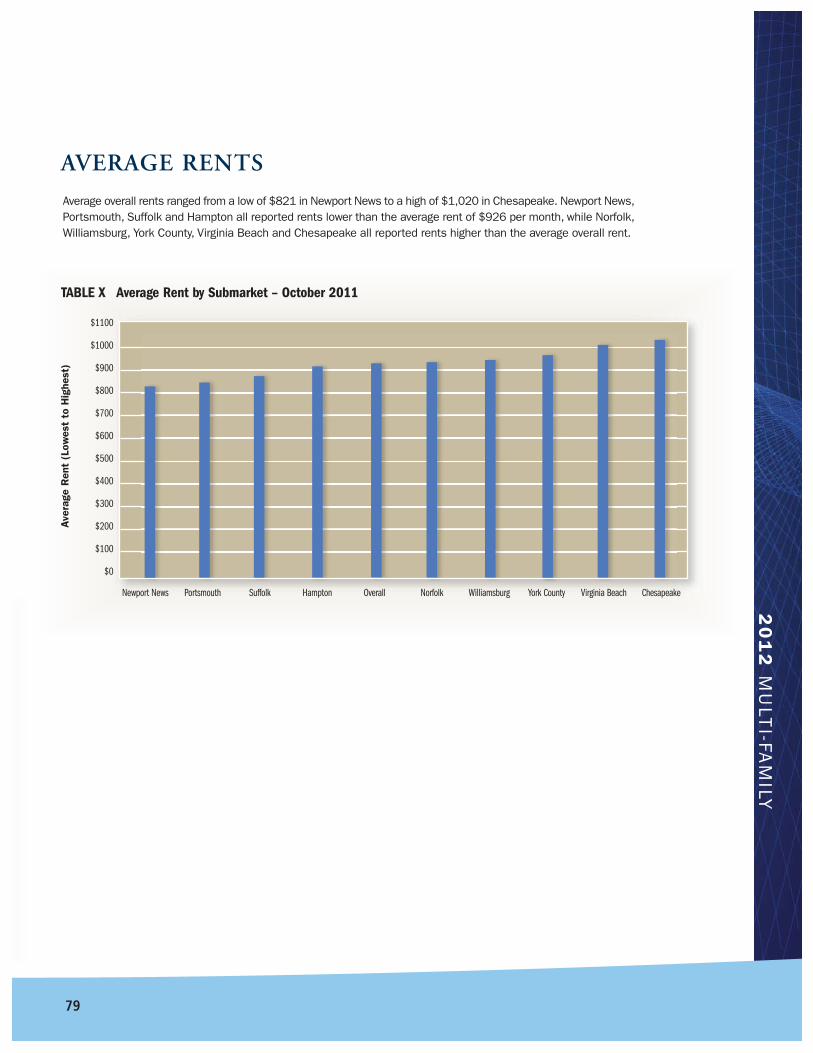
20
12
MU
LTI-FA
MILY
Average overall rents ranged from a low of $821 in Newport News to a high of $1,020 in Chesapeake. Newport News,Portsmouth, Suffolk and Hampton all reported rents lower than the average rent of $926 per month, while Norfolk,Williamsburg, York County, Virginia Beach and Chesapeake all reported rents higher than the average overall rent.
AVERAGE RENTS
$1100
$1000
$900
$800
$700
$600
$500
$400
$300
$200
$100
$0
Newport News Portsmouth Suffolk Hampton Overall Norfolk Williamsburg York County Virginia Beach Chesapeake
Ave
rage
Ren
t (L
owes
t to
Hig
hest
)
TABLE X Average Rent by Submarket – October 2011
79

802012 Hampton Roads Real Estate Market Review
2012 M U LT I - F A M I LY
There were over 470 conventional apartment communities with more than 50 units surveyed in the HamptonRoads region. Of the 92,000+ apartment units surveyed, the top five firms manage one-third of these units.The majority of the management firms oversee one or two apartment communities and have 500 or less unitsunder management.
MANAGEMENT
RichmondRichmond has over 60,000 conventional apartment units within communities of at least 50 units. The area’sapartments hit bottom in the fourth quarter of 2009 and first quarter of 2010 when occupancies fell to 90%and rents declined by (-3.5%) for the year. Since that time Richmond has seen a strong resurgence in rentaldemand and occupancies reached nearly 93% in 2011. Rents also showed modest growth over the past twoyears with rents now averaging $855 per month.
RoanokeRoanoke has fewer than 10,000 conventional apartment units among communities of at least 30 units.Roanoke’s apartment market coped better than most markets during the past recession. This was due in largepart to the fact that there has been minimal new apartment development in Roanoke over the past several yearswhich has kept the rental supply at a manageable level. Occupancy rates in 2011 were 93.9% with rentaveraging $693 per month.
REGIONAL TRENDS
S.L. Nusbaum Realty Co.
Harbor Group Management Co.
Drucker & Falk Real Estate
Lawson Companies Inc.
Breeden Management Company
Weinstein Properties Real Estate
Kotarides Companies Property Management
Ripley-Heatwole Company, Inc.
Perrel Management Company, Inc.
Bonaventure Group Inc.
0% 1% 2% 3% 4% 5% 6% 7% 8% 9% 10%
Table XI Top 10 Management Companies

Author Victor L. PickettSenior Vice President, Regional ManagerGrandbridge Real Estate Capital LLC
Financial The E. V. Williams Center for Real Estate and Economic Support Development (CREED) functions and reports are funded by donations
from the CREED IPAC and Council Advisory Boards, individuals andorganizations.
Disclosure The data used for this report are deemed reliable; however, neither Old Dominion University, the E. V. Williams Center for Real Estate and Economic Development, nor sponsoring companiesand/or individuals makes any representation or warranty as to itsaccuracy.
20
12
CA
PITA
L MA
RK
ETS
& R
EA
L ES
TATE FIN
AN
CE
H A M P T O N
R O A D S
M A R K E T
R E V I E W
CAPITAL MARKETS & REAL ESTATE FINANCE
81
822012 Hampton Roads Real Estate Market Review
The fundamentals of commercial real estate (CRE) turned more positive in 2011. First mortgage debt placements werehigher for life insurance companies than any other time. Agency lenders continue to have success in originating multi-family loans. Commercial real estate trends have rebounded significantly since reaching bottom in 2009. Most all prop-erty types showed economic stability and growth in 2011. Both 2012 and 2013 should be positive transitional years asoccupancies increase and rent growth continues to improve. Supply and demand will stay in check, with no new majordevelopments in process, and fundamentals will continue to improve, albeit slowly.
Commercial real estate finance, as it relates to permanent first mortgage debt, had its best year since the bubble of2006 and 2007. Production or origination volume was up with lender participation having included life insurance com-panies, commercial mortgage-backed securities (CMBS) participants, banking institutions, HUD and the governmentsponsored entities (GSE) of Fannie Mae and Freddie Mac. With fundamentals improving across all sectors, CRE financelenders will continue to be very active in 2012 with equal or increased allocations.
COMMERCIAL REAL ESTATE FINANCE
ontrary to popular belief, there is pent up demand by commercial real estate
lenders to make commercial real estate loans.
For the first time in the history of the Mortgage Bankers Association (MBA),
the Association is forecasting commercial/multifamily origination volume. In
2012, the MBA is forecasting CRE loan origination to be $230 billion.
This production volume forecasted by the MBA, when compared to maturing mortgages
on multifamily/commercial real estate in 2012 alone, falls very short of the $400 billion
that will be maturing this year.
While interest rates remain at historically low levels, lenders are reluctant to take on addi-
tional risk or relax their current underwriting standards to meet this refinance volume.
The pent up demand for quality loans (capital) by the commercial real estate lenders will
far exceed the availability of stabilized quality assets. The question then remains, will
lenders be forced to take on more risk for more yield, thus filling the capital needs of borrowers to refinance
the large number of maturing loans in 2012 and beyond?
Hampton Roads has been a stable market throughout recent history for institutional lenders and banks that
make investments in commercial real estate. As the market continues to stabilize and basic fundamentals
for all asset classes of commercial real estate trend positive, this capital will seek real estate investments
in our region.
General Overview
C
2012 CAPITAL MARKETS & REAL ESTATE FINANCE
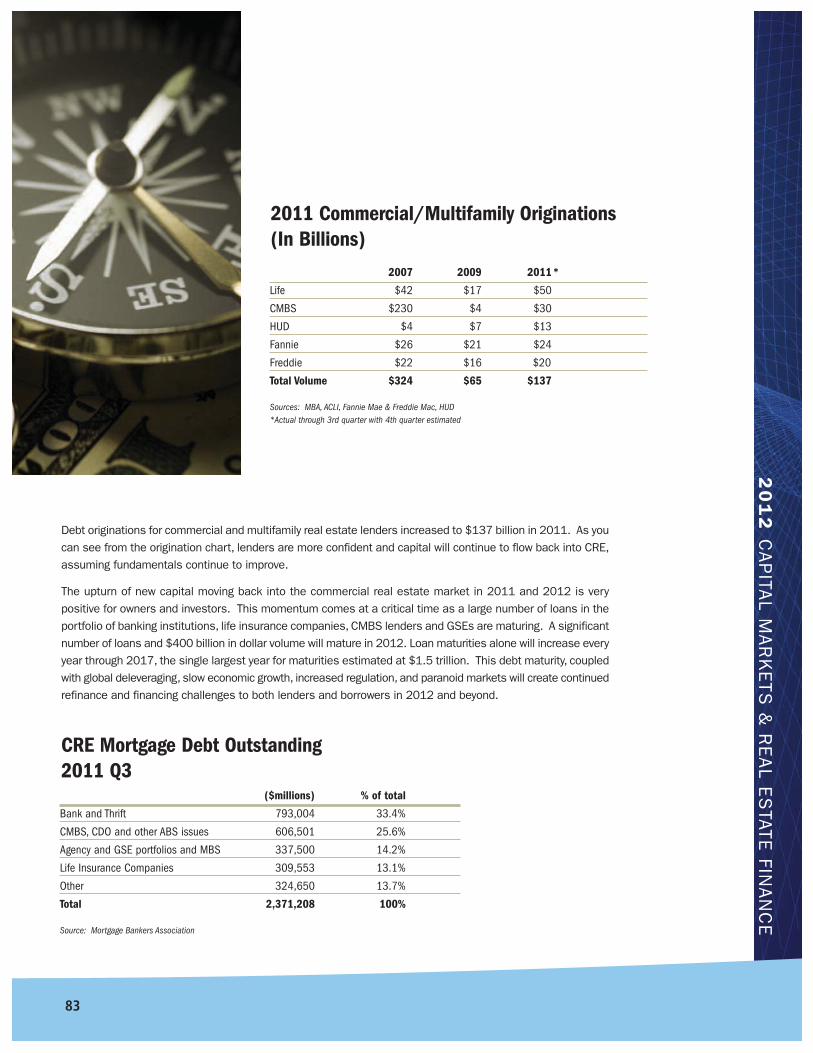
20
12
CA
PITA
L MA
RK
ETS
& R
EA
L ES
TATE FIN
AN
CE
83
2011 Commercial/Multifamily Originations(In Billions)
2007 2009 2011*
Life $42 $17 $50
CMBS $230 $4 $30
HUD $4 $7 $13
Fannie $26 $21 $24
Freddie $22 $16 $20
Total Volume $324 $65 $137
Sources: MBA, ACLI, Fannie Mae & Freddie Mac, HUD*Actual through 3rd quarter with 4th quarter estimated
CRE Mortgage Debt Outstanding 2011 Q3
($millions) % of total
Bank and Thrift 793,004 33.4%
CMBS, CDO and other ABS issues 606,501 25.6%
Agency and GSE portfolios and MBS 337,500 14.2%
Life Insurance Companies 309,553 13.1%
Other 324,650 13.7%
Total 2,371,208 100%
Source: Mortgage Bankers Association
Debt originations for commercial and multifamily real estate lenders increased to $137 billion in 2011. As youcan see from the origination chart, lenders are more confident and capital will continue to flow back into CRE,assuming fundamentals continue to improve.
The upturn of new capital moving back into the commercial real estate market in 2011 and 2012 is verypositive for owners and investors. This momentum comes at a critical time as a large number of loans in theportfolio of banking institutions, life insurance companies, CMBS lenders and GSEs are maturing. A significantnumber of loans and $400 billion in dollar volume will mature in 2012. Loan maturities alone will increase everyyear through 2017, the single largest year for maturities estimated at $1.5 trillion. This debt maturity, coupledwith global deleveraging, slow economic growth, increased regulation, and paranoid markets will create continuedrefinance and financing challenges to both lenders and borrowers in 2012 and beyond.
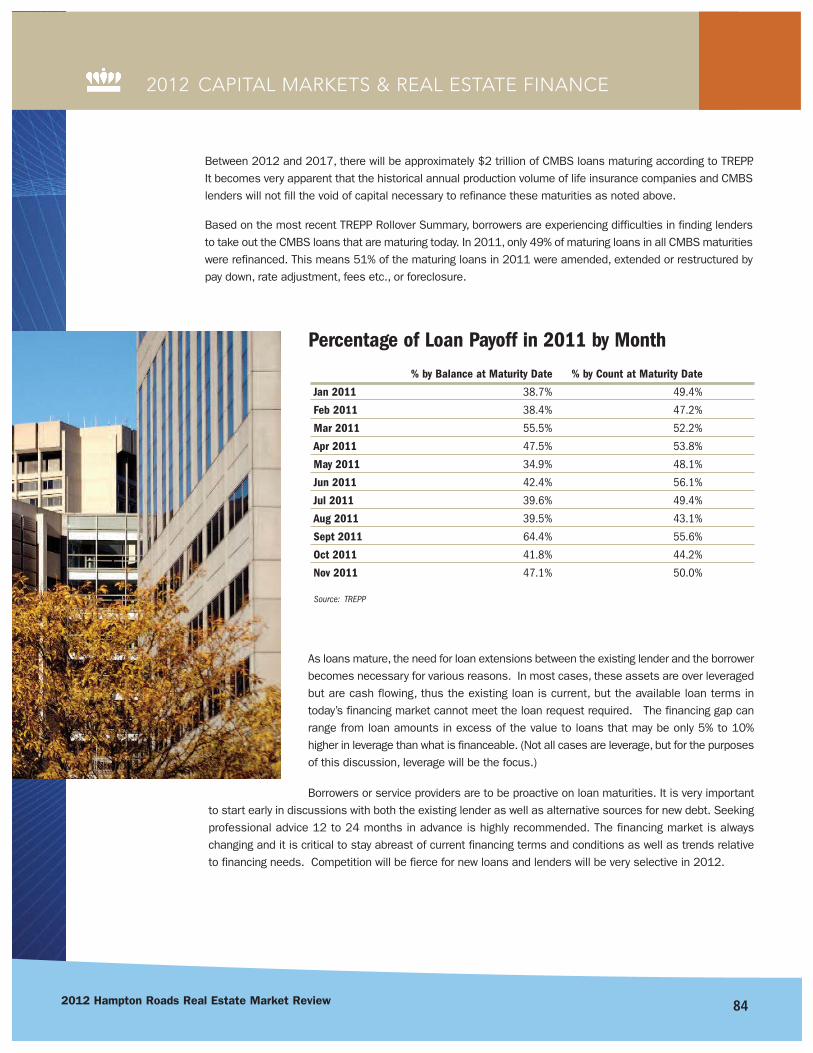
842012 Hampton Roads Real Estate Market Review
2012 CAPITAL MARKETS & REAL ESTATE FINANCE
Between 2012 and 2017, there will be approximately $2 trillion of CMBS loans maturing according to TREPP.It becomes very apparent that the historical annual production volume of life insurance companies and CMBSlenders will not fill the void of capital necessary to refinance these maturities as noted above.
Based on the most recent TREPP Rollover Summary, borrowers are experiencing difficulties in finding lendersto take out the CMBS loans that are maturing today. In 2011, only 49% of maturing loans in all CMBS maturitieswere refinanced. This means 51% of the maturing loans in 2011 were amended, extended or restructured bypay down, rate adjustment, fees etc., or foreclosure.
Percentage of Loan Payoff in 2011 by Month
% by Balance at Maturity Date % by Count at Maturity Date
Jan 2011 38.7% 49.4%
Feb 2011 38.4% 47.2%
Mar 2011 55.5% 52.2%
Apr 2011 47.5% 53.8%
May 2011 34.9% 48.1%
Jun 2011 42.4% 56.1%
Jul 2011 39.6% 49.4%
Aug 2011 39.5% 43.1%
Sept 2011 64.4% 55.6%
Oct 2011 41.8% 44.2%
Nov 2011 47.1% 50.0%
Source: TREPP
As loans mature, the need for loan extensions between the existing lender and the borrowerbecomes necessary for various reasons. In most cases, these assets are over leveragedbut are cash flowing, thus the existing loan is current, but the available loan terms intoday’s financing market cannot meet the loan request required. The financing gap canrange from loan amounts in excess of the value to loans that may be only 5% to 10%higher in leverage than what is financeable. (Not all cases are leverage, but for the purposesof this discussion, leverage will be the focus.)
Borrowers or service providers are to be proactive on loan maturities. It is very importantto start early in discussions with both the existing lender as well as alternative sources for new debt. Seekingprofessional advice 12 to 24 months in advance is highly recommended. The financing market is alwayschanging and it is critical to stay abreast of current financing terms and conditions as well as trends relativeto financing needs. Competition will be fierce for new loans and lenders will be very selective in 2012.
Outlined below are the basic terms and conditions available in the multifamily and commercial real estate debtmarket today. It should be noted and understood that every real estate asset is different and each loan situationwill vary as to the final terms.
LOAN-TO-VALUEA major improvement over the past 24 months between all lenders is their willingness to extend higher loan proceedsrelative to value. In 2009, the maximum loan-to-value (LTV) for CRE by the life insurance company lenders was onaverage around 50% to 60%. CMBS lenders were not in the market during this time. In 2011, CMBS lenders cameback in and pushed loan-to-value back to 75% on most property types. Life insurance companies followed in 2011and the average leverage was 65% loan-to-value and insurance lenders stretched to 70% to 75% LTV for “best inclass assets”. In 2012 and going forward, increased competition will exist in the market amongst all capital sourcesfor top quality multifamily, retail and industrial properties. Borrowers will see loan-to-value increase to 75% for theseassets. For less than top tier assets, most insurance companies will continue to limit loans to 65% loan-to-value.In 2012, look for insurance companies to stay the course at 65% to 70% loan-to-value and CMBS lenders to dropdown to 70% LTV. The GSE multifamily lenders can lend up to 80% loan-to-value with caveats.
INTEREST RATESThe initiative by the Federal Reserve to keep base interest rates low has helped drive mortgage rates for commercialreal estate to historical lows. Mortgage rates are derived by taking an index, in most cases the 10-year U.S. Treasuryrate, and adding a spread or credit adjustment to the base rate for an overall interest rate. During 2009 and mostof 2010, lenders charged a high spread due to the perceived risk, and consequently, spreads were at an all timehigh. During the second half of 2010 and all of 2011, spreads generally contracted and the yield on the 10-yearTreasury rate dropped from the mid 3% level to around 2% today.
In 2011, we saw overall interest rates for 10-year term money fall below 4% on “best in class” assets for the firsttime. First mortgage interest rates are at historically low rates and demand by lenders is very high. At the time ofthis narrative, the 10-year Treasury rate was 2%. The generally quoted interest rate today for a 65% leveraged assetmeeting the underwriting standards for the reported asset classes would be as follows:
Apartments 3.50% – 4.50%
Commercial Real Estate 4.00% – 5.00%
Hotels 4.75% – 6.00%
Self-Storage 4.50% – 5.00%
PROPERTY TYPES IN ORDER OF PREFERENCE TO THE LENDER:
Apartments
Grocery Anchored Shopping Centers
Credit, Single-Tenant Properties on long-term leases
Shadow Anchored Retail
Medical Office
Industrial
CBD Office
Suburban Office
Self-Storage
Well flagged limited- or full-service hotels
20
12
CA
PITA
L MA
RK
ETS
& R
EA
L ES
TATE FIN
AN
CE
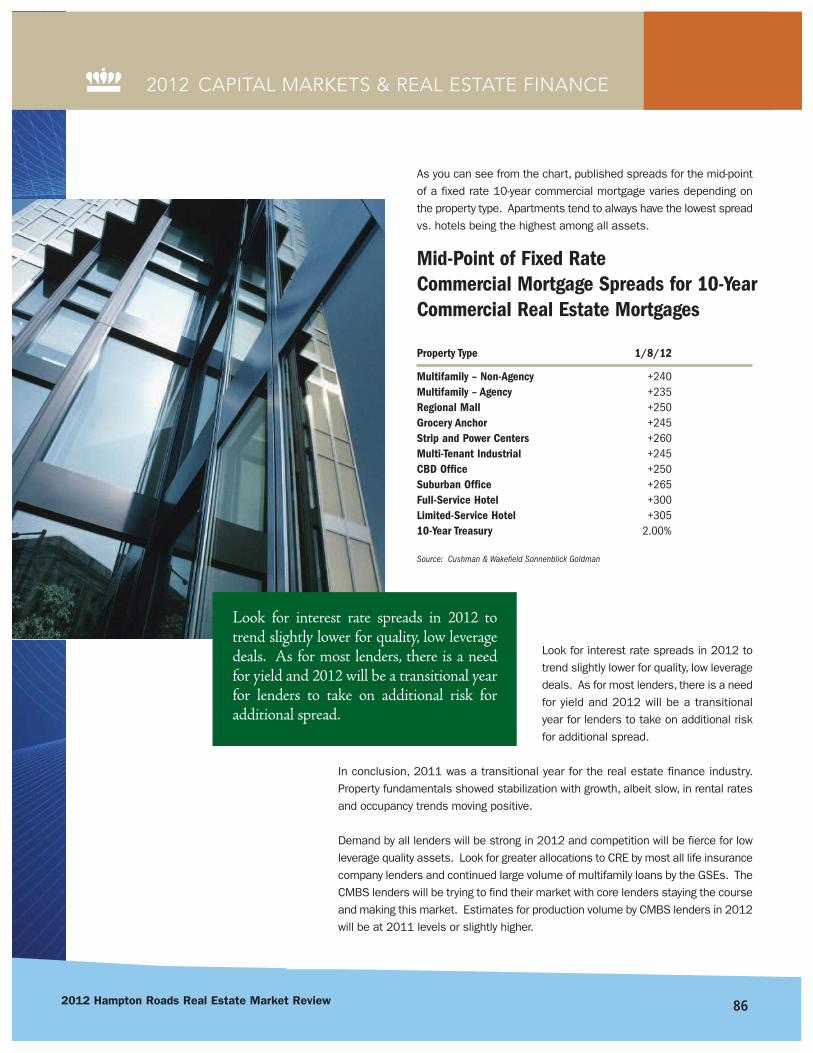
862012 Hampton Roads Real Estate Market Review
2012 CAPITAL MARKETS & REAL ESTATE FINANCE
As you can see from the chart, published spreads for the mid-pointof a fixed rate 10-year commercial mortgage varies depending onthe property type. Apartments tend to always have the lowest spreadvs. hotels being the highest among all assets.
Property Type 1/8/12
Multifamily – Non-Agency +240Multifamily – Agency +235Regional Mall +250Grocery Anchor +245Strip and Power Centers +260Multi-Tenant Industrial +245CBD Office +250Suburban Office +265Full-Service Hotel +300Limited-Service Hotel +30510-Year Treasury 2.00%
Source: Cushman & Wakefield Sonnenblick Goldman
Look for interest rate spreads in 2012 totrend slightly lower for quality, low leveragedeals. As for most lenders, there is a needfor yield and 2012 will be a transitionalyear for lenders to take on additional riskfor additional spread.
In conclusion, 2011 was a transitional year for the real estate finance industry.Property fundamentals showed stabilization with growth, albeit slow, in rental ratesand occupancy trends moving positive.
Demand by all lenders will be strong in 2012 and competition will be fierce for lowleverage quality assets. Look for greater allocations to CRE by most all life insurancecompany lenders and continued large volume of multifamily loans by the GSEs. TheCMBS lenders will be trying to find their market with core lenders staying the courseand making this market. Estimates for production volume by CMBS lenders in 2012will be at 2011 levels or slightly higher.
Look for interest rate spreads in 2012 totrend slightly lower for quality, low leveragedeals. As for most lenders, there is a needfor yield and 2012 will be a transitional yearfor lenders to take on additional risk foradditional spread.
Mid-Point of Fixed Rate Commercial Mortgage Spreads for 10-YearCommercial Real Estate Mortgages