halogens role in volcanic sulphur oxidation: pho
TRANSCRIPT

Halogens role in volcanic sulphur oxidation: pho-tochemical modelling and isotopic constraintsIn preparation
Abstract: The photochemical box-model CiTTyCAT is used to simulate volcanic sulphuroxidation and the resulting volcanic sulphate oxygen isotopic composition within thecore of volcanic plumes. The focus is on volcanic halogens role in volcanic sulphurchemistry during small volcanic eruptions or passive degassing. The model accountsfor SO2 oxidation by OH in the gas phase, and by H2O2, O3, O2 catalysed by transitionmetal ions (TMI), and HOX (HOX = HOBr + HOCl) in the liquid phase of either volcanicwater droplets (referred here as condensing plume), or sulphate aerosols (referred hereas non-condensing plume). It also describes transfer of oxygen mass-independentanomalies (O-MIF) from atmospheric oxidants to sulphate.
For condensing plumes (liquid water), the first finding is that ozone depletionevents (ODEs) triggered by halogens heterogeneous chemistry may also occur inplumes cores in presence of water droplets. The second finding is that, halogenspresence does not affect the hierarchy of oxidation pathways. The O2 /TMI sulphuroxidation pathway remains dominant even for relatively low TMI aqueous concentrations,generating volcanic sulphates with low O-MIF (≈ 0 h), this result is comparable toisotopic measurements on sulphates collected from volcanic ash-deposits. For non-condensing plumes (only sulphate aerosols), the first finding is that ODEs can occureven at very low halogen loadings (≈50 ppbv). The rate of sulphur oxidation is muchlower than for condensing plumes, and sulphur oxidation is dominated by H2O2 onsulphate aerosols and by OH in the gas phase. The second finding is that, the relativecontributions of H2O2 and OH is determined by halogens loading, and that the higherthe halogens concentration is, the higher is the H2O2 contribution to sulphate production.The third finding for non-condensing plumes is that halogens presence does not impactsignificantly the final sulphate O-MIF, which remains between the range of 0.8 - 1.4 h.The latter result is in contrast with the lack of O-MIF measured in sulphates collectedfrom volcanic ash, suggesting different hierarchy of oxidation pathways might be activefor different plume environments. The condensing and non-condensing simulationsresults suggest that the sulphate found on volcanic ash-deposits is likely to be formedvia SO2 oxidation in water-rich phases and not in the gas phase or on sulphate aerosolsduring passive degassing.
1 Introduction
Volcanoes release vast amounts of particles and reactive gases into the at-mosphere and they are a significant natural source of atmospheric pollutants,notably sulphur (Textor et al., 2004; Ayris and Delmelle, 2012; Mather, 2015).Tropospheric volcanic emissions are mostly limited to local and regional scales(Robock, 2000), but they can have significant environmental impacts, such as:acid rain formation, crop destruction, or severe air traffic perturbation (Delmelleet al., 2001; Delmelle, 2003; Schumann et al., 2011; Schmidt et al., 2014). Ex-posure to high concentrations of sulphate particles and sulphur bearing gasseshas also detrimental effects on human health (Durand and Grattan, 2001; Longoet al., 2008; Longo, 2013). Volcanic sulphur, indeed, can lead to "vog" (volcanic
1

smog) and SO2 pollution events formation in neighbouring urban areas, asfrequently observed in Mexico City or on the island of Hawai’i (Raga et al., 1999;de Foy et al., 2009). Nonetheless, volcanic emissions have also a significantinfluence on the chemistry of the atmosphere and therefore on climate (Stockeret al., 2013). In the atmosphere volcanic sulphur is easily converted into sul-phate aerosols, which can cool the Earth’s surface via scattering and absorptionof solar and terrestrial radiation (LeGrande et al., 2010; Robock, 2013; Stoffelet al., 2015; Zanchettin et al., 2016). Notably, observations and climate modelshave demonstrated that stratospheric volcanic eruptions have caused majorchanges in atmospheric composition and climate of both present-day and pastgeological eras (Stocker et al., 2013). In more details, stratospheric sulphuraerosols can impact global climate for several years typically, as observed afterthe stratospheric eruption of Mount Pinatubo in June 1991 (Minnis et al., 1993;McCormick et al., 1995; Robock, 2002).
Current regional and global models used to assess volcanic emissions im-pacts are limited in their chemistry description (Schmidt et al., 2014, 2015). Mostmodels, indeed, do not include the full chemical complexity of volcanic emis-sions, potentially underestimating their overall environmental impacts. Volcanicemissions are a rich chemical cocktail composed by a mix of very reactive gases.The most abundant volcanic gas is water vapour, followed by CO2, sulphur(i.e. SO2 and H2S), and halogens (i.e. chlorine, bromine, iodine) respectively.Volcanic sulphur and halogen gases are the most reactive species releasedwithin the plume, where they react in the gas and in the liquid phase of waterdroplets and sulphate aerosols. The chemistry of a plume is driven, indeed, bythe rich multiphase reactions of sulphur and halogens gases.
Most of last decades investigations have focused predominantly on theatmospheric and climatic impacts of volcanic sulphur. Volcanic halogens, indeed,are initially released at the magma surface mostly as hydrogen halides (i.e. HX= HCl + HBr mostly), which are rather unreactive species in the gas phase. Asa result, volcanic halogens impacts on the atmosphere have been neglectedfor long times, mostly because it was assumed that hydrogen halides werevery efficiently washed out from plumes by particles, water droplets, and ash.Nowadays, however, there is growing evidence that large concentrations of highlyreactive halogen compounds are present in tropospheric volcanic plumes frompassive degassing. Multiple observations report, indeed, very large amounts ofbromine radicals (BrO) within tropospheric plumes of various volcanoes. Thesemeasurements also represent the highest BrO concentrations ever observedin the atmosphere so far (Bobrowski et al., 2003; Bobrowski and Platt, 2007;Bobrowski et al., 2007).
Volcanic HX can be converted into reactive halogen radicals either via hightemperature chemistry in volcanic vents (Gerlach, 2004; Martin et al., 2006;Roberts et al., 2009), or via multi-phase chemistry within young volcanic plumes,the latter being a process called "halogens activation" (Oppenheimer et al., 2006,2010; von Glasow, 2010). Since halogen radicals are generally less soluble than
2
HX in both water and sulphate aerosols (Sander et al., 2006; Sander, 2015),HX conversion into halogen radicals prevents their washing-out from volcanicplumes and the atmosphere. It follows that radicals formation within volcanicplumes can extend halogens atmospheric residence time, therefore affectingalso the temporal and spatial extension of their atmospheric impacts, includingpossibly the transport to the stratosphere (Zuev et al., 2015).
Halogen radicals are very reactive species, destroying atmospheric ozonevia auto-catalytic chemical cycles (von Glasow, 2010). Ozone depletion events(ODEs), indeed, are a relatively common feature of halogen-rich environments,and they are frequently observed over sea-salt lakes, in the polar and marineboundary layer, and recently also in tropospheric volcanic plumes (Saiz-Lopez,2004; Stutz, 2002; Hönninger, 2004; Millard et al., 2006; Vance et al., 2010;Kelly et al., 2013). Within volcanic plumes very high BrO concentrations arefrequently coupled to massive ODEs (Millard et al., 2006; Vance et al., 2010;Boichu et al., 2011; Kelly et al., 2013), suggesting that volcanic halogens caninfluence the oxidative state of the plume. Atmospheric ozone, indeed, is amajor source of hydroxyl radical (OH), the dominant atmospheric oxidant (vonGlasow and Crutzen, 2013). In particular, recent investigations suggest thathalogens activation could influence volcanic sulphur processing within plumes,notably with regards to volcanic SO2 oxidation (Jourdain et al., 2016). Moreover,halogens mobilization from the condensed phase requires the production ofHOX (i.e. hypohalous acids, HOX = HOBr + HOCl) (von Glasow, 2010), whichis also a major SO2 oxidant in the liquid phase. It has been suggested thatHOX concentrations as low as 0.1 pptv could drive SO2 oxidation in the marineatmosphere (Chen et al., 2016). Notably, isotopic investigations on marineatmosphere sulphates and their oxygen isotopes compositions have highlightedthat up to 30% of sulphate can be produced via SO2 oxidation by HOX in themarine boundary layer (MBL) (Vogt et al., 1996; Von Glasow et al., 2002a,b;Chen et al., 2016).
It is difficult to investigate chemical processing within volcanic plumes, dueto the very optically dense environment and highly reactive nature of volcanicemissions. Among post-processing investigations, isotopic studies are a verypowerful tool to the interpretation of chemical budgets. During the last decadesan increasing number of studies have used oxygen isotopes of atmospheric com-pounds to constrain chemical oxidation fluxes (Michalski et al., 2003; Alexanderet al., 2005; Morin et al., 2008; Gromov et al., 2010; Michalski and Xu, 2010).Notably, several chemical reactions generate specific isotopic distributions alsodefined as isotopic fractions. Most chemical processes maintain the elementalisotopic relative mass abundances during reactions, thus generating productscharacterised by mass-dependent isotopic fractions. For instance, oxygen massdependent fractions are characterised by a change in the 17O/16O ratio which ishalf the magnitude of the respective change in the 18O/16O ratio. Nonetheless,some processes can generate non-mass dependent anomalous isotopic distri-butions, also defined as mass-independent fractionations (MIFs). The oxygen
3

mass-independent fractionation (O-MIF = ∆17 O) is defined with respect to amass-dependent reference line, and for its linear approximation is expressed as:
∆17O = δ17O− 0.52× δ18O (1)
Where δ17 O and δ18 O are the deviations from the isotopic ratios of a standardof reference (Rstd):
Rx =xO16O
x = 17− 18 (2)
And:δxO =
Rx
Rstd− 1 (3)
Oxygen mass-independent fractionations are particularly useful to inves-tigate atmospheric oxidation mechanisms, since most atmospheric oxidantsare characterised by peculiar O-MIFs. In particular, these anomalous isotopicfractionations are directly or indirectly inherited from ozone, the atmosphericmolecule with the largest intrinsically generated O-MIF (Thiemens, 2006). Dur-ing oxidation reactions, O-MIFs can be further transmitted from oxidants to theirreaction products, typically in relation to the number of oxygen atoms transferredduring the reaction. For instance, when SO2 is oxidised via a specific oxida-tion pathway, a fraction of the oxidant-specific ∆17 O is found into the productmolecule. It results that the overall sulphate oxygen isotopic composition is thelinear combination of the oxidant-specific isotopic signatures, weighted by theirrespective contributions to total sulphate production. Therefore, oxygen isotopicinvestigations are very useful to track the formation of secondary sulphates, (i.e.formed by SO2 processing in the atmosphere). Obviously, the specific ∆17 Osignatures transmitted to sulphate by the different oxidants have all to be knownif different oxidation pathways are to be constrained simply, and even inferred insome cases.
Generally, a combination of several reactions is involved during secondarysulphate production in the background troposphere: radical OH in the gasphase, H2O2, O3, O2 catalysed by Transition Metal Ions (TMI), and HOX inthe liquid phase (Vogt et al., 1996; Seinfeld and Pandis, 2016). In additionwithin fogs and polluted air masses, SO2 can be oxidised also by NO2 (Heet al., 2014). However, because of the high acidity of volcanic water dropletsand sulphate aerosols, the NO2 contribution to volcanic sulphate productionshould be negligible (Seinfeld and Pandis, 2016). During SO2 oxidation, thetransfer of isotopic anomalies from ozone and H2O2 produces sulphates withvery significant O-MIF (∆17O 6= 0± 0.1h), whereas SO2 oxidation by OH in thegas phase, and by O2 /TMI and HOX in the liquid phase, are thought to producesulphate without significant O-MIF (∆17O = 0± 0.1h) (Savarino and Thiemens,1999b,a; Savarino et al., 2000; Martin et al., 2014; Chen et al., 2016).
On average, most sulphates collected in the troposphere have a ∆17O ofabout 1 h typically (Lee et al., 2001; Lee and Thiemens, 2001), reflecting the
4

Figure 1: Left panel: Oxygen isotopic composition of tropospheric volcanicsulphates from small tropospheric volcanic eruptions of the present geologicalera. Right: Oxygen isotopic composition of volcanic sulphates from stratosphericand tropospheric eruptions of present and past geological eras. For a full reviewsee Martin, 2018.
importance of ozone and H2O2 as global sulphur oxidants. In contrast, volcanicsulphates are characterised by peculiar oxygen isotopes compositions. Mosttropospheric volcanic sulphates extracted from volcanic ashes of historical andpresent tropospheric small eruptions have no O-MIF (-0.1< ∆17O< 0.1h) (Baoet al., 2003; Mather et al., 2006; Martin et al., 2014; Martin, 2018) (see: Fig.:1).Remarkably, it is a feature observed for volcanic sulphates in ash-deposits thatare also far from the point of emission (5-400 km), where secondary volcanicsulphates are the most abundant (Martin et al., 2014). On the other hand,volcanic sulphates collected from ice cores tend to have very positive O-MIF(see Fig.:1-2) (Bao et al., 2008). Notably, these sulphates are formed andtransported within the stratosphere, or have originated from tropospheric supereruptions (Baroni et al., 2008; Gautier et al., 2019). The chemistry of a densevolcanic plume is certainly very different from the chemistry of the surroundingbackground atmosphere because of the intensity and composition of volcanicemissions. Therefore, volcanic sulphate production is expected to be verydifferent from average tropospheric sulphur oxidation in terms of the mix ofoxidants. Isotopic measurements suggest, indeed, that for different eruptionstages and styles peculiar oxidation pathways might dominate volcanic SO2
oxidation in the atmosphere.The present work is a follow-on of a detailed photochemical modelling study
on sulphur oxidation in volcanic plumes and on the implications for oxygen iso-topic compositions of tropospheric volcanic sulphate (Galeazzo et al., 2018). Arange of conditions and scenarios were previously explored, but the model couldnot reproduce most volcanic sulphate isotopic composition measurements (i.e.a negligible O-MIF). Potentially important elements were previously neglected,
5

notably the presence of volcanic halogens and heterogeneous chemistry onsulphate particles. The purpose of the present work is to address these limita-tions. It aims at gauging the role of halogens in sulphur oxidation within volcanicplumes. Some volcanic plumes contain, indeed, very high levels of halogens,which, in some cases, can be as high as sulphur levels (Aiuppa et al., 2009;Cadoux et al., 2015). The implications for the isotopic composition of volcanicsecondary sulphate are analysed here, and this is particularly useful for probingeruptions from the distant past, or when no optical measurements are available.Notably, so far halogen chemistry has mostly been ignored when dealing withisotopic investigations on tropospheric volcanic sulphate formation (Savarinoet al., 2000; Martin et al., 2014).
The main tool of the present study is a photochemical box-model (CiTTy-CAT) which already describes standard tropospheric chemistry and sulphurchemistry in cloud water droplets (Galeazzo et al., 2018). It also contains a sul-phur isotopic scheme tracking O-MIF anomalies during sulphur oxidation. Thischemical scheme is here extended to include sulphur heterogeneous chemistryon sulphate aerosols, and halogen heterogeneous chemistry on both sulphateparticles and water droplets. Diverse model simulations are carried out for arange of environmental conditions and scenarios. Model results are then usedto investigate in details the chemistry of volcanic halogen-rich plumes, and toelucidate the role of halogens in tropospheric plumes chemistry, notably duringsulphur oxidation. Model-calculated sulphate O-MIFs are compared to volcanicsulphate isotopic measurements, collected either in proximity of volcanic ventsor from volcanic ash-deposits (Bao et al., 2003; Mather et al., 2006; Martinet al., 2014) (see Fig.:1). Note, however, that oxygen isotopic measurementtechniques are characterised commonly by a ∆17 O uncertainty value of at least0.1 h (Bao et al., 2003; Martin and Bindeman, 2009), and here only valuesabove 0.1 h are therefore considered as O-MIFs. Results enable to assessdominant volcanic sulphur oxidation pathways in presence of varying levels ofhalogens.
The following second section of this work describes halogens gas phaseand heterogeneous chemistry operating in volcanic plumes. Successively, thethird section presents the modelling methodology adopted for simulating thein-plume halogens and sulphur chemistry. This section also covers the extensionof the chemistry scheme (i.e. heterogeneous chemistry on sulphate aerosols),and of the isotopic balance equations implemented in CiTTyCAT to cover theSO2 oxidation by halogens. The fourth section presents and discusses modelresults for typical plume conditions (here called standard), when only specificprocesses are considered (i.e. sulphate particles or cloud droplets, with orwithout halogens). Here the focus is on the role of heterogeneous chemistry andhalogens during sulphur oxidation, and the resulting implications for sulphateO-MIF. The fifth section is devoted to sensitivity studies where a range of plumecases are considered. Notably, they are conducted to investigate how sensitivesulphate O-MIF is to different in-plume parameters. Here, dominant SO2 oxi-
6

dation pathways are identified for the two main liquid phase model scenarios(i.e. cloud droplets, sulphate aerosols). The model ability to reproduce observedisotopic compositions from volcanic sulphate ash-deposits and from volcanicsulphate aerosols is also further discussed. Finally, the main findings from thestudy are recalled in the conclusive section. More in-depth descriptions onmodel set-up and on model sensitivity to different initial parameters are reportedin the Supplementary material section.
2 Volcanic halogens and sulphur chemistry
The most abundant volcanic halogen species are chlorine, fluorine and bromine,emitted at the vent as HCl, HF, and HBr respectively (Aiuppa et al., 2009;Oppenheimer et al., 2013). Fluorine is not significantly involved in troposphericchemistry because of its very low reactivity. Small amounts of iodine are alsopresent among volcanic emissions (Aiuppa et al., 2005), but as the effects ofvolcanic iodine chemistry are still poorly characterised its chemistry is mostlyneglected. In conclusion, bromine and chlorine are the most relevant halogenspecies among volcanic emissions and the ones that can directly interact withvolcanic sulphur.
A thorough description of tropospheric volcanic plumes chemistry has beencovered by modelling simulations and experimental observations (Bobrowskiand Platt, 2007; Roberts et al., 2009; von Glasow and Crutzen, 2013). In moredetails, these investigations highlight that halogens mobilization from plumesparticles liquid phase to the gas phase (i.e. halogens activation), and volcanicbromine radical chain reactions in the gas phase (i.e. bromine explosion) arefundamental in-plume chemical mechanisms. In addition, modelling simulationssuggest that during the first stages of young plumes development the interactionof halogens radicals emitted from the vent and HOx species from the backgroundatmosphere results in the formation of sulphur oxidizing species: hypohalousacids (HOX), in particular HOBr.
2.0.1 Oxidation of SO2 by hypohalous acids (HOX)
Recently, significant attention has been devoted to HOX and their role duringsulphate production in the MBL. HOX are produced via reactions R?? and R??during the first stages of young plume development, and potentially they canlead to secondary sulphate production via oxidation of both SO2 –
3 and HSO–3 in
the plume liquid phase (Fogelman et al., 1989; Troy and Margerum, 1991; Vogtet al., 1996; Von Glasow et al., 2002a,b):
SO2−3 + HOX→ XSO−3 + OH− (4)
HSO−3 + HOX→ XSO−3 + H2O (5)
7

XSO−3 + H2O→ SO2−4 + X− + 2 H+ (6)
Notably, it has been observed that HOX can drive SO2 oxidation in the gasphase even at very low concentrations (≈0.01-0.1 pptv) (Chen et al., 2016,2017). Remarkably, so far current regional models have not explored HOXinfluence on volcanic sulphate production.
3 Modelling approach
The chosen model to pursue the investigation is the Cambridge TroposphericTrajectory model of Chemistry and Transport (CiTTyCAT). The model describesstandard tropospheric gas-phase photochemistry (bimolecular, termolecular,and photodissociation reactions), emissions and deposition fluxes (Evans et al.,2000; Real et al., 2007; Arnold et al., 2007). The reaction rate constants andphotolysis cross-sections are taken from JPL’s datasheets (Sander et al., 2006),and photolysis rates are evaluated via the Fast-J code (Wild et al., 2000). Thechemistry scheme has been recently extended with aqueous sulphur chemistry,a parametrization of cloud water droplets acidity, and oxygen isotopes transfersoccurring during sulphate production (Galeazzo et al., 2018). Hereby, thescheme is further extended through the parametrization of SO2 oxidation byO3, H2O2, HOX and O2 /TMI on sulphate aerosols, and via the addition of SO2
oxidation by HOX in cloud water droplets. Moreover, new reactions have beenimplemented to account also for halogens heterogeneous chemistry in bothsulphate aerosols and cloud water droplets.
Volcanic plumes from passive degassing can take multiple forms, and twomain plume subcategories can be defined by the nature of plumes particlesliquid phase: non-condensing plumes (i.e. primary sulphate aerosols) andcondensing plumes (i.e. cloud water droplets). If the relative humidity of thebackground atmosphere is low and water saturation is not reached, sulphateaerosols constitute the bulk of in-plume liquid phase. Meanwhile, when largeamounts of water vapour are emitted and relative humidity is high, volcanic watercan condense into cloud droplets, either on the surface of primary sulphateaerosols, or on ash particles surfaces when some solid emissions are alsopresent.
Reaction rates are strongly influenced by chemical activity of water and sul-phuric acid, and therefore, heterogeneous chemistry is implemented through dif-ferent modules for the two plume scenarios (i.e. condensing vs. non-condensingplume). Notably, large uncertainties are still pertaining to chemistry within sul-phate aerosols, since the elementary aqueous reactions that drive halogensheterogeneous chemistry are not well characterized experimentally. As a re-sult, in this study halogens heterogeneous chemistry, and all heterogeneousreactions on sulphate aerosols (i.e. also SO2 heterogeneous oxidation) areimplemented via reactive uptake coefficients. In contrast, sulphur aqueousreactions occurring within cloud droplets are explicitly modelled, accounting for
8

all the elementary reactions occurring in the liquid phase. The non-condensingplume chemical scheme is schematically represented and summarised in Fig.:2.
Figure 2: A diagram representing the new chemistry scheme implementedin CiTTyCAT for sulphate aerosols, including: SO2 oxidation, and halogensheterogeneous reactions within sulphate aerosols.
3.1 General continuity equations
CiTTyCAT resolves coupled differential mass balance equations (continuityequations) describing the time evolution of atmospheric species concentrations(Evans et al., 2000; Real et al., 2007; Pugh et al., 2012). For given concentrationsand environmental conditions (e.g. pressure, temperature), continuity equationsare solved considering chemical production and loss terms, and deposition andmixing fluxes with background air:
d[Ci]
dt=∑k
Pk −∑j
Lj −Di −Mi (7)
where Ci is species i concentration in the plume, Pk the sum of gas phase andheterogeneous chemical production channels for species i, Lj is the sum ofgas phase and heterogeneous chemical loss rates for species i, and finally Di
and Mi represent respectively species i deposition and mixing fluxes. Note that,heterogeneous chemistry production and loss terms include also mass-transferbetween the gas and liquid phases.
Deposition only applies to liquid phase species dissolved in cloud waterdroplets or in sulphate aerosols. It is implemented as a first order loss process,
9

where rate coefficients (kdep) are assumed to be proportional to the mean lifetimeof cloud droplets and sulphate aerosols in the free troposphere (Stevenson et al.,2003b). Deposition fluxes are defined as:
Di = −kdep · [C]i (8)
Exchange of species between volcanic plumes and background air due toatmospheric mixing is also accounted for. Mixing is parametrised via a simplelinear relaxation scheme, inducing an exponential decay of plume concentrationstowards background concentrations (Methven et al., 2006; Real et al., 2007;Arnold et al., 2007):
M(i) = Kmix ·([C]i − [C](i,bck)
)(9)
where Kmix is a first-order mixing rate coefficient quantifying volcanic air mixingwith the background atmosphere, and [C(i,bck)] is the concentration of species iin the background air. Kmix is set to 0.4 day−1, a value more representative ofmixing in the lower atmosphere and equivalent to a 2.5 days dilution timescale.
Mass-transfer fluxes between gas phase and condensed phase are modelledconsidering trace gases non-reactive and reactive uptake to cloud water dropletsand sulphate aerosols respectively. The general uptake rate on a particle isdefined by the following kinetic regime expression (Hanson et al., 1994):
−d[Ci]
dt= γi ·
νi4· SA · [Ci] (10)
where γi is species i uptake coefficient onto the condensed phase, νi representsthe average molecular speed of i in the gas phase, and SA is the surface areadensity of the considered condensed phase (the condensed phase surfacearea per unit volume of air). Molecular uptake coefficient is not constant formost atmospheric gases, and it varies with time depending on the chemicalcomposition of condensed phase and air. The uptake into a liquid particle,indeed, encompasses into a single variable multiple physical and chemicalprocesses (Davidovits et al., 2006; Ammann et al., 2013).
The uptake coefficient can encompass in a single variable the physical up-take and reactions of molecules, notably for those reactions whose individualreaction mechanisms are not well constrained. In this case the molecular uptakebecomes effectively a reactive uptake coefficient (γr). Its formulation is basedon a resistor model, where the different processes driving the heterogeneousreaction are expressed as separate resistances in series (Hanson et al., 1994;Davidovits et al., 2006) (see the Supplementary Material section for more infor-mation). Notably, halogens reactions in sulphate aerosols are extremely fast andmostly parametrised via experimental measurement of species reactive uptakes.Therefore, in the new version of CiTTyCAT halogens reactions are modelledusing reactive uptake values from IUPAC datasheets. On the other hand, thereare very few studies covering the reactive uptake of halogens on water droplets.
10

Therefore, two different scenarios are investigated to explore halogens reactionsin condensing plumes. The first one assumes no significant halogens reactivityin water (i.e. γr = 0), while the second one considers very slow reactivity inwater droplets (i.e. γr = 10−5). The latter value is at the lower bound of knownreactive uptake values (Ammann et al., 2013). The values of γr for halogensheterogeneous reactions in condensing and non-condensing volcanic plumesare illustrated in Table:1.
Table 1: Values of γr used for halogens heterogeneous reactions in condensingplumes (WD) and non-condensing plumes (SA) (Sander et al., 2006).
Reaction γi (SA) γi (WD)HOCl + Br–
(aq.) + H+ −−→ BrCl(aq.) + H2O 0.002 0 - 10−5
HOBr + Cl–(aq.) + H+ −−→ BrCl(aq.) + H2O 0.2 · [BrCl]aq.
[BrCl]aq. + [Br2]aq.0 - 10−5
HOBr + Br–(aq.) + H+ −−→ Br2(aq.) + H2O 0.2 · [Br2]aq.
[BrCl]aq. + [Br2]aq.0 - 10−5
BrONO2 + H2O −−→ HOBr(aq.) + HNO3(aq.) 0.8 3· 10−2
ClONO2 + H2O −−→ HOCl(aq.) + HNO3(aq.) - 2.5· 10−2
N2O5 + H2O −−→ 2 HNO3(aq.) 0.03 0 - 10−5
3.2 Final continuity equations
Based on the physico-chemical framework described above, the mass-balanceequation (also defined as continuity equation) for volcanic SO2 oxidation isexpressed differently for the condensing and non-condensing plume scenarios.Retain that, wet deposition of S(IV) species (S(IV) = SO2(g) + SO2(aq) + HSO–
3 +SO2 –
3 ) is ignored in non-condensing plumes, because very little S(IV) speciesare dissolved in sulphate particles due to the extreme pH of solution. Therefore,SO2(g) represents all S(IV) family when working in non-condensing plumes. Forinstance, it is assumed that the mass-balance equation for S(IV) oxidation canbe approximated to the one of SO2, expressed as:
d[S(IV)]
dt=d[SO2]
dt= −kOH+SO2 · [SO2][OH]−
−
∑j
γj ·νSO2
4· SA · [SO2]
−Kmix ·([SO2]− [SO2](bck)
) (11)
where [SO2] and [SO2](bck) are respectively SO2 concentrations of volcanicplumes and background atmosphere.
Generally, SO2 chemical reactions within concentrated sulphuric acid solu-tions are not well constrained in kinetic databases. However, within sulphate
11

aerosols, liquid reactions between SO2 and O3, H2O2, O2 /TMI, or HOX canoccur in principle, since all species can still partition between gas and sulphuricacid solution. As a result, volcanic SO2 uptake in non-condensing plume parti-cles (γj) in Eq.:11 are expressed via an effective reactive uptake coefficient. Thevalues are extrapolated via empirical laboratory observations (DeMore et al.,1997; Rattigan et al., 2000) (for more details refer to the Supplementary materialsection).
The S(IV) continuity equation for condensing volcanic plumes is more com-plex, and it is expressed as:
d[S(IV)]
dt= −kOH+SO2 · [SO2][OH]−
∑j
K l−gj · [S(IV)]l−gaq. [Cj ]
l−gaq.
−−kdep · [S(IV)]−Kmix ·
([S(IV)]− [S(IV)](bck)
)(12)
where [S(IV)] and [S(IV)](bck) are respectively S(IV) concentrations in volcanicplumes and in the background atmosphere.
The same approach is used to define continuity equations for sulphateproduction, in presence of sulphate aerosols (R13), or in presence of waterdroplets (R14):
d[S(VI)]
dt= kOH+SO2 · [SO2][OH] +
∑j
γj ·νSO2
4· SA · [SO2]
−−kdep · [S(VI)]−Kmix ·
([S(VI)]− [S(VI)](bck)
) (13)
d[S(VI)]
dt= kOH+SO2 · [SO2][OH] +
∑j
K l−gj · [S(IV)]l−gaq. [Cj ]
l−gaq.
−−kdep · [S(VI)]−Kmix ·
([S(VI)]− [S(VI)](bck)
) (14)
where K l−gj is the gas phase equivalent (meaning conversion into gas-phase
units) of the aqueous rate constant of reaction j, [S(IV)]l−g is the gas-phaseequivalent of the S(IV) aqueous species concentration, [Cj ]
l−g is the gas phaseequivalent of the oxidant j aqueous concentration.
In both model scenarios deposited S(VI) (S(VI)dep) is a prognostic variableof the system, and it is parametrised as:
d
dt[S(VI)]dep = kdep · [S(VI)] (15)
For both plume conditions, the value of kdep is a first-order loss constant derivedfrom the average lifetime of sulphate in the free troposphere (Stevenson et al.,2003a).
12

3.3 Tracking S(VI) oxygen isotopic signatures
3.3.1 Isotopic chemistry equations
Sulphate mass balance equations of CiTTyCAT are limited to mass tracking ofatoms, not isotopes. As a result, they cannot monitor S(VI) and S(VI)dep evolv-ing concentrations. In order to track sulphate ∆17O, the continuity equationsdescribing sulphate production are combined to isotopic transfer equations, anda new variable called anomaly product ([S(VI)]·∆17O(S(VI))) is introduced in themodel. Its continuity equation is given by (Morin et al., 2008, 2011; Galeazzoet al., 2018):
d
dt
([S(VI)] ·∆17O(S(VI))
)=∑j
[Pj ·∆17O(S(VI)prd)j ]− kdep ·∆17O(S(VI))
(16)where ∆17O(S(VI)) is the O-MIF of S(VI), Pj is the S(VI) production via oxidationpathway j, and ∆17O(S(VI)prd)j is the specific transfer of O-MIF to S(VI) duringthe oxidation of S(IV) via reaction j.
As S(VI)dep is also a variable in the model, the [S(VI)dep]·∆17O(S(VI)) anomalyproduct is also a prognostic variable, whose continuity equation is given by:
d
dt
([S(VI)dep] ·∆
17O(S(VI)))
= kdep · [S(VI)] ·∆17O(S(VI)) (17)
The isotopic balance equations define the isotopic anomaly acquired byS(VI) molecules during their production. Each reaction pathway generates,indeed, a specific O-MIF on the specific produced sulphate. Peculiar signa-tures for each oxidation pathway are determined by the isotopic anomalies ofreactants and the number of oxygen atoms transferred to sulphate during S(IV)oxidation. As a result, the overall sulphate isotopic composition reflects therelative contribution of different sulphate production pathways (Pj) weighted bytheir specific transferred isotopic anomaly ∆17O(S(VI))j).
On top of the oxygen isotopes scheme recently implemented in CiTTyCATfor S(IV) oxidation in cloud water droplets (Galeazzo et al., 2018), the isotopiccontinuity equations for S(IV) and S(VI) are modified to account for halogenschemistry, including SO2 oxidation by HOX on sulphate particles and clouddroplets. An HOX isotopic balance equation is derived and the isotopic balanceequation for OH is also modified to account for halogens presence. Isotopicbalance equations determine sulphate products O-MIF considering the originsof oxygen atoms inherited by S(VI) during S(IV) oxidation. Therefore, O-MIFs ofreactants involved in S(VI) production are constrained very precisely.
It is worth stressing that in the model the continuity equations of S(VI) andS(VI)dep anomaly products are integrated with an external 4th order Runge-Kuttamethod algorithm, instead of through CiTTyCAT chemistry solver. Preliminarysimulations have shown that model results are not significantly affected by the
13
external integration method, with the advantage that while using this approachthe chemistry module is totally independent from the oxygen isotopic scheme.
3.3.2 Oxidation by O3, H2O2, O2 /TMI, and HOX
In a first place, it is important to assess the isotopic signatures and fractionationsgenerated by single SO2 oxidation pathways. It is assumed that volcanic SO2
and H2O do not carry any significant O-MIF. The oxygen isotopic compositionof magmatic SO2, indeed, is mass-dependent and no ∆17O (SO2) has beenobserved so far in volcanic SO2 (Eiler, 2001; Martin, 2018). Finally, to our knowl-edge no study covering the isotopic composition of volcanic water emissionshas been conducted. Therefore, it is assumed that volcanic water has the sameisotopic composition as atmospheric water, whose ∆17O(H2O) is about 0h(Uemura et al., 2010).
Ozone is a key atmospheric reactant, characterised by an intrinsic highO-MIF generated during its formation in the atmosphere (Marcus, 2013). Tropo-spheric ozone has a large ∆17O(O3, bulk) of about 26 h (Vicars and Savarino,2014), but the isotopes distribution within the molecular structure is not stochas-tic. It has been suggested, indeed, that heavier oxygen isotopes are located atits molecular extremities which are therefore isotopically enriched (Bhattacharyaet al., 2008; Marcus, 2013). Assuming that generally terminal atoms are morelikely to be involved in chemical reactions (i.e.. only one chemical bond needs tobe broken) a mean reactive ozone MIF (∆17O (O*3)) can be defined. This termencompasses the isotopic enrichments of ozone terminal sites (i.e. about 40 h)and their enhanced reactivity. In relation to typical tropospheric ozone O-MIF,a ∆17O (O*3) of about 36 h is derived (Morin et al., 2007, 2008; Bhattacharyaet al., 2008; Savarino et al., 2008; Vicars and Savarino, 2014). This methodfor ozone evaluation was also used in previous modelling simulations, whoseoutcomes were in good agreement with experimental observations (Morin et al.,2008). As ozone reacts in the atmosphere part of its isotopic anomaly canbe transmitted to the reaction products, hence generating a reaction specificisotopic signature on final products. In the case of SO2 oxidation by O3, oneout of four S(IV) oxygen atoms is inherited on sulphate during the oxidation.Therefore, the final sulphate product has a ∆17O (S(VI))O3+S(IV) = 9 h.
Remarkably, other atmospheric oxidants can inherit O-MIF directly or indi-rectly from atmospheric ozone via photochemical reactions (Thiemens, 2006).Notably, among SO2 atmospheric oxidants, H2O2 carries a significant O-MIF(∆17O (H2O2) equal to 1.75h (Savarino and Thiemens, 1999a). H2O2 transferstwo oxygen atoms to S(IV) via a nucleophilic substitution, resulting in a producedsulphate with ∆17O (S(VI))H2O2+S(IV)) equal to 0.87h. Atmospheric O2 is an-other SO2 oxidant characterised by a peculiar O-MIF equal to -0.34 h (Younget al., 2002; Barkan and Luz, 2003). The oxidation of S(IV) by O2 occurs via achain of radical reactions catalysed by TMI. It is assumed here that only oneoxygen atom is transferred from O2 to S(IV), since there are large uncertainties
14

regarding the mechanism of S(IV) oxidation. The resulting final sulphate producthas a ∆17O (S(VI))O2 /TMI+S(IV) ≈ −0.09h. This value is within errors intervalof experimental oxygen isotopes measurements, thus being classified possiblyas mass-dependent in relation to experimental measurements.
No investigation regarding ∆17O(HOX) has been conducted so far. Nonethe-less, it is suggested that any potential O-MIF carried by HOX would not affect thefinal isotopic signature of S(VI), since the new oxygen atom transferred to HSO–
3and SO2 –
3 originates from water and not from hypohalous acids (Fogelman et al.,1989; Troy and Margerum, 1991; Chen et al., 2016). Therefore, the isotopicmass-balance equation for HOX oxidation takes the following form:
∆17O(S(VI))HOX+S(IV) =1
2·∆17O(SO2) +
1
2·∆17O(H2O) (18)
Assuming that no isotopic anomaly is carried by volcanic H2O and SO2, it isexpected that sulphates generated via S(IV) oxidation by HOX would be mass-dependent and with O-MIF equal to 0 h (Chen et al., 2016). A summary of theisotopic signatures of different oxidation channels is reported in Table:2.
Table 2: O-MIF signatures of S(IV) oxidation pathways in the model
Oxidant O-MIF pathway (h)OH calculated (0 to a maximum of 4.5)H2O2 0.87O3 9O2 /TMI -0.09HOX 0
3.3.3 Oxidation by OH
In the atmosphere OH is a major oxidant generated mostly by ozone photochem-istry. Specifically it is produced by the reaction between O1(D) and H2O. OHis initially formed with a relatively high O-MIF because it has a 50% chance ofinheriting an oxygen atom from O3. However, OH MIF is the result of the compe-tition between OH rates of destruction (i.e. reaction with CH4 and CO) and theisotopic exchange with H2O, which depends, notably, on specific environmen-tal and atmospheric conditions (Dubey et al., 1997; Lyons, 2001). Commonly,it is assumed that for average tropospheric conditions the inherited isotopicanomaly is rapidly lost by the quick O-isotopic exchange between OH and H2O,which usually happens before the hydroxyl radical could have the time to reactwith other species. In the core of volcanic plumes, however, large amountsof volcanic SO2 and HCl can react with OH, thus pushing significantly the OHdestruction rate. In contrast to background atmospheric conditions, OH formed
15

in volcanic plume may conserve some of its initial O-MIF, which then could befurther transmitted to its reaction products. As a result, in the model ∆17O(OH)is considered a prognostic variable, and it is evaluated by the following equation(Morin et al., 2011; Galeazzo et al., 2018):
∆17O(OH) = x ·∆17O(OH∗prod.) (19)
with∆17O(OH∗prod.) =
1
2·∆17O(O∗3) (20)
andx =
D
D + k∗OH+H2O· [H2O]
(21)
D = kOH+CO ·[CO]+kOH+CH4 ·[CH4]+kOH+SO2 ·[SO2]+kOH+HCl ·[HCl] (22)
The isotopic signature transmitted to sulphate via this channel of oxidation istherefore given by (Savarino et al., 2000):
∆17O(S(VI))OH+SO2 =1
2·∆17O(SO2)+
1
4·∆17O(OH)+
1
4·∆17O(H2O) (23)
Since ∆17O(H2O) and ∆17O(SO2) are thought to be negligible the equation isfinally simplified to:
∆17O(S(VI))OH+SO2 =1
4·∆17O(OH) (24)
As a result, in volcanic plumes the OH O-MIF (∆17O(OH)) can vary between 0h and 18 h. Finally, depending on HCl, SO2 and water vapour levels withinthe plume product sulphate can have an O-MIF spanning from 0 h to a maxvalue of 4.5 h.
In order to illustrate how ∆17O(OH) can vary in relation to SO2 and HClloadings, OH O-MIF is investigated at standard conditions for increasing SO2
and/or HCl concentration. As shown in Fig.:3. ∆17O(OH) is calculated for 3different conditions. The first two cases are rather hypothetical because oneconcerns a volcanic plume with varying sulphur levels but no halogens, andthe other case concerns a volcanic plume with varying halogen levels but nosulphur. Nonetheless, the results give some idea about the levels of SO2 andHCl required to affect significantly the OH O-MIF. The third case is more realistic,and it is about a plume with varying halogen levels and 1 ppmv of SO2.
The first two cases show that only when SO2 or HCl concentration is greaterthan tens of ppbv OH carries an O-MIF sufficiently high (O-MIF > 0.4 h)to generate sulphate with an O-MIF greater than 0.1 h (i.e. typical marginof error for oxygen isotopic measurement). This result implies that OH lossby reaction with SO2 or HCl can compete to the isotopic exchange with H2Oat concentrations ≈ 0.1 ppmv. Finally, the last case scenario shows that, inpresence of 1 ppmv of SO2, HCl needs to be above 50 ppbv to influence
16
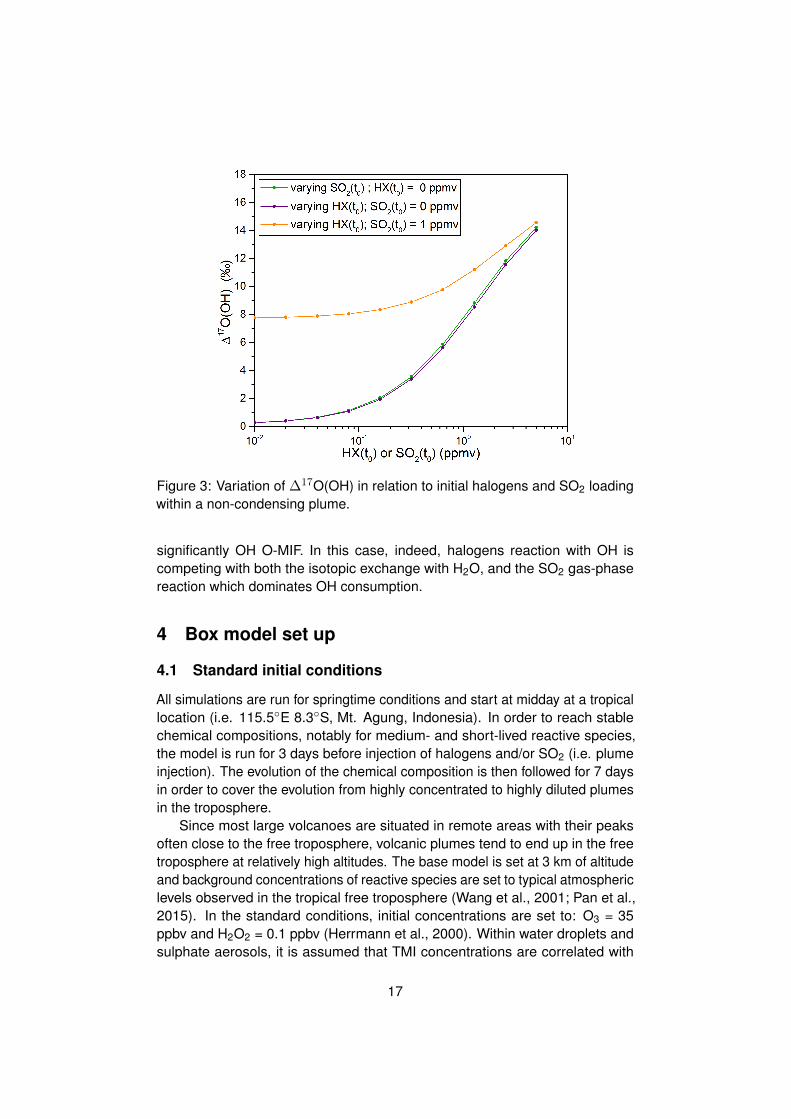
Figure 3: Variation of ∆17O(OH) in relation to initial halogens and SO2 loadingwithin a non-condensing plume.
significantly OH O-MIF. In this case, indeed, halogens reaction with OH iscompeting with both the isotopic exchange with H2O, and the SO2 gas-phasereaction which dominates OH consumption.
4 Box model set up
4.1 Standard initial conditions
All simulations are run for springtime conditions and start at midday at a tropicallocation (i.e. 115.5◦E 8.3◦S, Mt. Agung, Indonesia). In order to reach stablechemical compositions, notably for medium- and short-lived reactive species,the model is run for 3 days before injection of halogens and/or SO2 (i.e. plumeinjection). The evolution of the chemical composition is then followed for 7 daysin order to cover the evolution from highly concentrated to highly diluted plumesin the troposphere.
Since most large volcanoes are situated in remote areas with their peaksoften close to the free troposphere, volcanic plumes tend to end up in the freetroposphere at relatively high altitudes. The base model is set at 3 km of altitudeand background concentrations of reactive species are set to typical atmosphericlevels observed in the tropical free troposphere (Wang et al., 2001; Pan et al.,2015). In the standard conditions, initial concentrations are set to: O3 = 35ppbv and H2O2 = 0.1 ppbv (Herrmann et al., 2000). Within water droplets andsulphate aerosols, it is assumed that TMI concentrations are correlated with
17

each other, i.e. that [Mn(II)] = 0.1 · [Fe(III)], as observed in tropospheric aerosolsand atmospheric hydrometeors (Seinfeld and Pandis, 2016).
Typical halogens emissions within volcanic plumes are not well characterised,because they vary from one volcanic system to another, and even betweendifferent phases of the same erupting event. Modelling and field observationssuggest typical HCl/SO2 ratios of about 0.5, and mean HBr/SO2 ratio of about≈ 1×10⁻³ for arc-volcanoes (Gerlach, 2004; Witt et al., 2008; Roberts et al.,2009). These initial ratios (HCl/SO2, HBr/SO2) are used in almost all simulationswhen halogens are injected, except when sensitivity to SO2 or halogens loadingis explored.
In both condensing (water droplets) and non-condensing (sulphate aerosols)plume standard simulations SO2 concentration is set to 1.5 ppmv, a valuecommonly observed at the proximity of volcanic vents during passive degassing(Robock, 2000; Rose et al., 2006; Mather et al., 2006; Roberts et al., 2012; DeMoor et al., 2013; Voigt et al., 2014).
4.1.1 Specific input parameters: condensing volcanic plumes
In all condensing plume simulations, volcanic water is assumed to condenseeither forming water droplets, or coating ash particles. It constitutes the bulkof the liquid phase, quantified by the liquid water content (LWC). At standardconditions the LWC is set to 0.3 gm−3, a value commonly observed for tropo-spheric clouds (Korolev et al., 2007; Carey et al., 2008). It is assumed that waterdroplets have a fixed radius of 5 µm. The droplets concentration is then derivedfrom the specific LWC. The initial pH of the aqueous phase is set to 4.5, but ithas no impact on the overall model results, since water droplets pH is almostimmediately driven by SO2, HBr and HCl uptake, and by S(IV) oxidation.
Large uncertainties are pertaining to iron release from volcanic ashes inaqueous phase (Hoshyaripour et al., 2015; Maters et al., 2016). At standardconditions, TMI concentrations in water droplets are set to: [Fe(III)] = 0,5 µM,and hence [Mn(II)] = 0,05 µM. Standard TMI concentrations correspond to thelower range of tropospheric conditions (Herrmann et al., 2000; Parazols et al.,2006). This value is also within the range of model calculations regarding ironrelease within volcanic plumes (Hoshyaripour et al., 2015).
4.1.2 Specific input parameters: non-condensing volcanic plumes
In all non-condensing plume simulations, the radius of primary volcanic sulphateaerosols is fixed at 0.5 µm in the accumulation mode, while aerosols concentra-tion is fixed at 1000 particles per cm3 of air. Both values are chosen in relationto atmospheric observations of primary sulphate emissions at volcanic vents(Mather et al., 2003).
In non-condensing volcanic plumes, the liquid phase is composed by sul-phuric acid, as it is assumed that water vapour pressure does not reach the
18

point of saturation. The relative humidity (RH) is fixed and sulphate aerosolcomposition (i.e. sulphuric acid weight percentage, wt) is calculated dependingon values of RH, temperature, and pressure (DeMore et al., 1997). The aerosolcomposition is a critical factor for gas-liquid partitioning of species and also forthe liquid phase chemistry. During non-condensing plume simulations, RH isset to 45%, the average value observed for volcanic plumes degassing (Matheret al., 2006; Kroll et al., 2015).
Aerosols TMI concentration is set to 0.001 µM, the lowest iron mobilizationvalue suggested by volcanic plumes model simulations (Hoshyaripour et al.,2015).
4.2 Model experiments
4.2.1 Standard simulations
The objective of the first set of numerical experiments is to assess the competi-tion among SO2 oxidants in presence or absence of halogens. Seven simulations(Cgas, Chet, Chalo
0 , Chalohet , and Ngas, Nhet, Nhalo
het ) are run with oxidation schemesof increasing complexity for both condensing and non-condensing volcanicplumes. The different SO2 oxidation schemes considered in the simulations areoxidation by: only OH in gas phase (Cgas; Ngas), OH in gas phase, and H2O2, O3
and O2 /TMI in liquid phase (Chet; Nhet), and by OH in gas phase, and H2O2, O3,O2 /TMI and HOX in liquid phase (Chalo
0 -Chalohet ; Nhalo
het ). Cgas, Ngas, Chet and Nhet
do not have halogens within their chemical scheme, whereas Chalo0 , Chalo
het andNhalohet include halogens injection with plumes. Chalo
0 and Chalohet simulations differ
between each other: during Chalo0 halogens heterogeneous chemistry is not
active (i.e. γr = 0), while in Chalohet halogens heterogeneous chemistry in water
droplets is activated (i.e γr ≈ 10−5). The standard simulations are designed toexplore the effect of different chemical reactions on the plume environment.
4.2.2 Sensitivity simulations
Initial SO2 levels, LWC, TMI and halogens concentrations are key model inputs,but they are subjected to large uncertainties and variability. The sensitivity of themodel to input conditions varying within plausible ranges is explored in additionalsimulations. Notably, preliminary simulations have shown that TMI catalysedoxidation is negligible in non-condensing plumes, while it is a key parameter forcondensing plumes chemistry.
The sensitivity studies for condensing plumes focus (S1) on the sensitivity ofSO2 oxidation to TMI concentrations. It is supposed to cover the possible rangeof TMI aqueous concentrations resulting from mineral dissolution. Volcaniceruptions can inject some solid material (i.e. ash), which commonly is composedby minerals with different proportions of Fe(II) and Fe(III) within their crystallinestructure (Rose and Durant, 2009; Langmann, 2014). Depending on ash content
19

and plume chemical composition, TMI concentrations can vary for differentvolcanic plumes (Hoshyaripour et al., 2015). However, the extent to whichhalogen halides and sulphate can promote iron dissolution is rather uncertain.During S1, [Fe(III)] varies from 0.1 to 2 µM, based on model simulations andlaboratory experiments on iron release from volcanic ash (Hoshyaripour et al.,2015; Maters et al., 2016, 2017). Further sensitivity studies exploring plumesmodel sensitivity to LWC and RH values, and initial SO2 loadings are exploredin the Supplementary Material section.
The sensitivity studies for non-condensing plumes (H1) concern plumeschemistry responses to the initial halogens loading. The amounts of halogensemitted vary greatly from one volcanic system to another, and it influencessignificantly non-condensing plumes gas phase chemistry and therefore SO2
oxidation in presence of sulphate aerosols. Major differences in halogensemissions are observed for between rift and arc volcanoes (Aiuppa et al., 2009).Intraplate systems (e.g. rift and hotspot volcanic systems) are characterised,indeed, by HBr/SO2 emission ratios of the order of 10−5, while arc volcanicsystems exhibit HBr/SO2 ratios as high as 10−2 (Aiuppa, 2009; Aiuppa et al.,2009; Mather et al., 2012). Finally, halogens rich emissions can reach HCl/SO2
ratios of about 1, such in the case of peculiar arc volcanoes (Aiuppa et al.,2005; Witt et al., 2008). As a result, the H1 sensitivity set explores HX/SO2
ratios between 0.01 and 0.8. Initial SO2 remains at 1 ppmv, HBr and Br radicalsconcentrations are varied considering average HBr/HCl ratios of about ≈ 10−2.In the supplementary material section, further sensitivity studies investigatenon-condensing plume model responses to initial SO2 loading.
A summary of all simulations, and relative specific conditions, is reported inTable: 3-4.
Table 3: Standard input parameters for the condensing and non condensingplume scenario; T = 283.15 K, p = 691 mbar.
Input Parameters Condensing plume Non-condensing plumeLWC (gm−3) 0.3 < 0.005RH (%) 100 40Radius (µM) 5 0.5N (particles cm−3) ≈550 1000[TMI] (µM) 0.5 < 0.01[SO2](0) (ppmv) 1.5 1.5[HX](0) (ppmv) 0.75 0.75[O3](0) (ppmv) 35 35[H2O2](0) (ppmv) 0.12 0.12
20

Tabl
e4:
Inve
stig
ated
stan
dard
and
sens
itivi
tysi
mul
atio
ns(p
aram
eter
s,re
late
dox
idat
ion
path
way
s,an
dra
nge
ofin
vest
igat
ions
).
Sta
ndar
dse
tw
ater
drop
lets
sulp
hate
aero
sols
OH
O3
H2O
2O
2/TM
IH
OX
Cgas
xx
Chet
xx
xx
xChalo
0x
xx
xx
x(γ
r=
0)Chalo
het
xx
xx
xx
(γr≈
10−5)
Ngas
xx
Nhet
xx
xx
xNhalo
het
xx
xx
xx
Sen
sitiv
ityse
t∗w
ater
drop
lets
sulp
hate
aero
sols
LWC
(gm−3)
TMI(µM
)[S
O2] 0
(ppm
v)[H
X] 0
/[SO
2] 0
rang
eS
1x
x0.
1-2
([TM
I])
S2†
xx
0.05
-5(S
O2
load
ing)
S3†
xx
0.2
-2(L
WC
)
Z1x
x0.
05-0
.8(H
X/S
O2
ratio
)
Z2†
xx
0.05
-5(S
O2
load
ing)
∗D
urin
gse
nsiti
vity
sim
ulat
ions
alls
ulph
urox
idat
ion
chan
nels
are
activ
ein
both
cond
ensi
ngan
dno
n-co
nden
sing
plum
es.
†M
odel
sens
itivi
tyto
the
form
erpa
ram
eter
sar
ein
vest
igat
edin
the
Sup
plem
enta
ryM
ater
ials
ectio
n.
21

5 Results and discussion
5.1 Isotopic constraints on S(IV) oxidation: condensing volcanicplumes (water droplets)
5.1.1 Standard simulations
The Cgas standard simulation investigates O-MIF transfer to sulphate in absenceof heterogeneous chemistry (with only activated gas-phase SO2 oxidation byOH). The Chet standard simulation has the same scheme as Cgas, but on topit includes also the liquid phase oxidation of S(IV) by O3, H2O2, and O2 /TMI.For Chet simulation, TMI concentration is fixed at 0.5 µM, and LWC is setto 0.3 g ·m−3. Cgas and Chet simulations do not include halogens in theirchemical scheme, the results and isotopic signatures reproduce correctly theones obtained previously with CiTTyCAT for the halogens-poor condensingplume scenario (Galeazzo et al., 2018).
The evolution of SO2, O3, H2O2, and S(VI) concentrations during Cgas andChet simulations are shown in Fig.:4. In Cgas S(VI) production follows a diurnalcycle, and H2O2 concentration increases throughout the run, reaching a finalvalue of about 10 ppbv. Within 7 days from injection SO2 concentration dropsfrom 1.5 ppmv to 0.05 ppmv, and both produced and deposited S(VI) are equal toabout 0.3 ppmv. In Chet H2O2 concentration drops immediately below pptv levelsfollowing plume injection and SO2 dissolution in the liquid phase. It reachesagain significant concentration (> 50 pptv) after 4 days from plume injectionand only during daytime hours. The H2O2 concentration drop is due to the fastreaction with S(IV), which is largely in excess in the liquid phase of the plume.Notably, S(VI) production still follows a diurnal cycle, suggesting significantcontribution of gas-phase SO2 oxidation to the overall S(VI) production.
The evolution of ∆17O(S(VI)prd.) and ∆17O(S(VI)dep.) for standard simula-tions Cgas and Chet are reported in Fig.:5. During Cgas simulation S(VI) isformed only via SO2 gas-phase oxidation by OH. Consequently, S(VI) O-MIFdepends only on the ∆17OH generated within the plume, and therefore mostlyon SO2 dilution. Deposited sulphate is initially formed with ∆17O(S(VI)dep.) ofabout 1.4 h, and during the simulation it decreases steadily to a final valueof 0.75 h. Afterwards, as the pH of the water phase decreases due to S(VI)production, less S(VI) dissolves into the liquid phase. From the third day onward,S(IV) chemical consumption is significantly driven by gas-phase oxidation withOH, and by aqueous oxidation with H2O2. However, by the time OH becomes amain pathway of in-plume oxidation, ∆17O(OH) has decreased from its initialvalue because of SO2 dilution, S(IV) deposition and in-plume reactions. Overall,in presence of 0.5 µM of TMI and in absence of halogens chemistry, H2O2 andOH contribute the most to S(VI) production, thus ∆17O(S(VI)dep) is equal to 0.7h.
Simulation Chalo0 is the same of Chet but it includes halogen injection and
22

Figure 4: Gas-phase concentrations of atmospheric species during the Cgas,Chet, Chalo
0 , Chalohet simulations. The runs start at 0:00 p.m.; Cgas, no halogens
and no heterogeneous chemistry is active in the system; Chet no halogens,S(IV) heterogeneous oxidation included in the chemical scheme; Chalo
0 , S(IV)heterogeneous chemistry, no halogens heterogeneous chemistry (γr = 0);HX/SO2 = 0.5; Chalo
het , S(IV) heterogeneous chemistry, halogens heterogeneouschemistry activated (γr = 10−5); HX/SO2 = 0.5.
all the major pathways of sulphur oxidation, including S(IV) aqueous reactionswith HOX. Due to the large uncertainty linked to the values of halogens reactiveuptakes on water droplets, Chalo
0 includes halogens injection but no halogensactivation reactions (i.e. γr = 0). For this scenario, it is assumed that halogensheterogeneous reactions would be rather slow and that halogens mobilizationfrom the liquid phase would be very inefficient in cloud droplets. The evolutionof SO2, O3, H2O2, and S(VI) concentrations during Chalo
0 simulation is shownin Fig.:4. There is no significant difference in species concentration trendsbetween Chet and Chalo
0 . By the end of the simulation SO2 concentration dropsfrom 1.5 ppmv to 0.07 ppmv, while atmospheric S(VI) is around 0.04 ppmv anddeposited sulphate is about 0.03 ppmv. Once again most of initial SO2 is lost dueto washing out and mixing with background atmosphere. The major differenceswith Chet are observed for O3 and H2O2 concentrations. Ozone concentration is
23
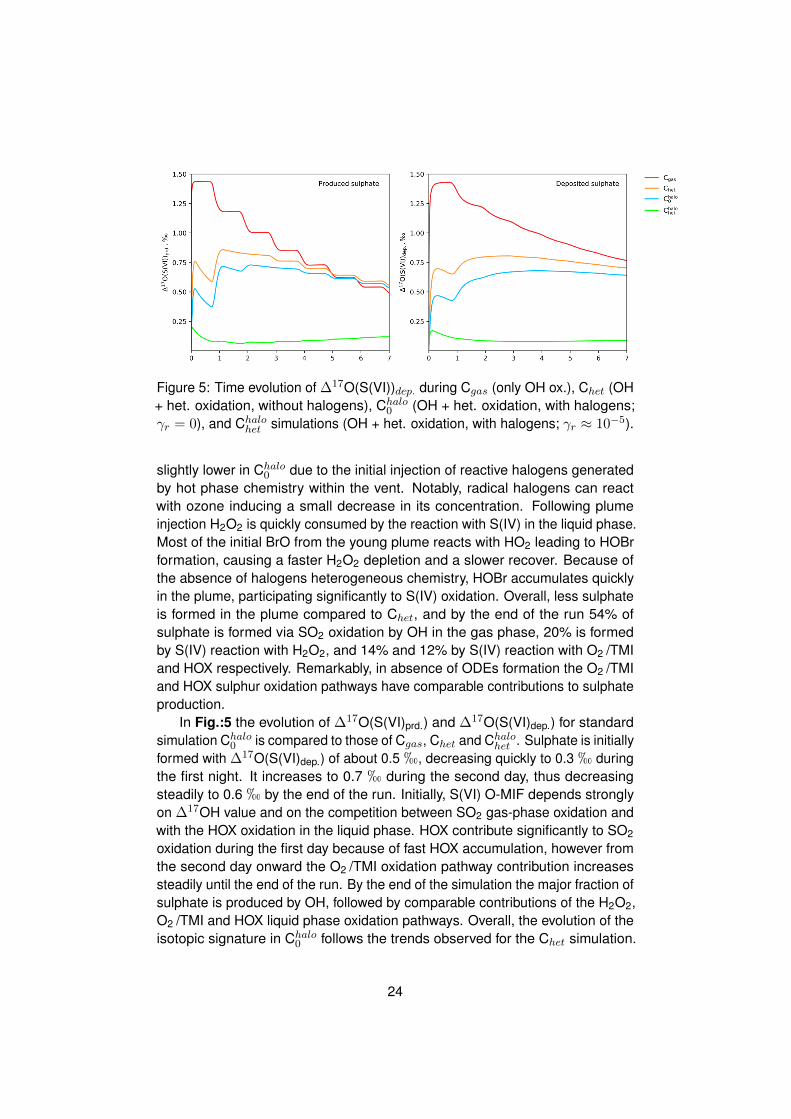
Figure 5: Time evolution of ∆17O(S(VI))dep. during Cgas (only OH ox.), Chet (OH+ het. oxidation, without halogens), Chalo
0 (OH + het. oxidation, with halogens;γr = 0), and Chalo
het simulations (OH + het. oxidation, with halogens; γr ≈ 10−5).
slightly lower in Chalo0 due to the initial injection of reactive halogens generated
by hot phase chemistry within the vent. Notably, radical halogens can reactwith ozone inducing a small decrease in its concentration. Following plumeinjection H2O2 is quickly consumed by the reaction with S(IV) in the liquid phase.Most of the initial BrO from the young plume reacts with HO2 leading to HOBrformation, causing a faster H2O2 depletion and a slower recover. Because ofthe absence of halogens heterogeneous chemistry, HOBr accumulates quicklyin the plume, participating significantly to S(IV) oxidation. Overall, less sulphateis formed in the plume compared to Chet, and by the end of the run 54% ofsulphate is formed via SO2 oxidation by OH in the gas phase, 20% is formedby S(IV) reaction with H2O2, and 14% and 12% by S(IV) reaction with O2 /TMIand HOX respectively. Remarkably, in absence of ODEs formation the O2 /TMIand HOX sulphur oxidation pathways have comparable contributions to sulphateproduction.
In Fig.:5 the evolution of ∆17O(S(VI)prd.) and ∆17O(S(VI)dep.) for standardsimulation Chalo
0 is compared to those of Cgas, Chet and Chalohet . Sulphate is initially
formed with ∆17O(S(VI)dep.) of about 0.5 h, decreasing quickly to 0.3 h duringthe first night. It increases to 0.7 h during the second day, thus decreasingsteadily to 0.6 h by the end of the run. Initially, S(VI) O-MIF depends stronglyon ∆17OH value and on the competition between SO2 gas-phase oxidation andwith the HOX oxidation in the liquid phase. HOX contribute significantly to SO2
oxidation during the first day because of fast HOX accumulation, however fromthe second day onward the O2 /TMI oxidation pathway contribution increasessteadily until the end of the run. By the end of the simulation the major fraction ofsulphate is produced by OH, followed by comparable contributions of the H2O2,O2 /TMI and HOX liquid phase oxidation pathways. Overall, the evolution of theisotopic signature in Chalo
0 follows the trends observed for the Chet simulation.
24

Figure 6: The evolution of the BrO/SO2 ratios during Chalohet (purple) and Nhalo
het
(orange) simulations following plume injection and halogens activation.
The initial lower O-MIF value is due to major contribution of HOX and O2 /TMI toSO2 oxidation.
Simulation Chalohet is the same of Chalo
0 , it includes halogen injection and allthe major pathways of sulphur oxidation. However, this time halogens hetero-geneous chemistry and activation within water droplets are operational (i.e.γr ≈ 10−5). In this scenario, it is assumed that halogens heterogeneous reac-tions would be slow but faster enough to mobilize some halogens from the liquidphase. The evolution of SO2, O3, H2O2, and S(VI) concentrations during Chalo
het
simulation is shown in Fig:.4. By the end of the simulation SO2 concentrationdrops from 1.5 ppmv to 0.09 ppmv, while atmospheric S(VI) is around 0.02 ppmvand deposited sulphate is about 0.01 ppmv. Once again most of initial SO2 islost due to washing out and mixing with background atmosphere.
Remarkably, this time S(VI) is produced in significantly less amounts com-pared to Cgas, Chet and Chalo
0 simulations. Furthermore, in Chalohet S(VI) produc-
tion does not follow a diurnal cycle, indicating that HOx compounds producedby photochemistry are not major sulphur oxidants in the plume. After halogensinjection, the O3 concentration drops dramatically due to injection of radicalbromine and HBr activation. A first ODE (ozone depletion event) is observedwithin half an hour from plume release. O3 reaches less than ppbv levels duringthe first day when the plume is very concentrated, and massive drops in OH andH2O2 concentrations are also observed. OH is reformed in significant amountsonly after 5 days from plume injection, while H2O2 concentration recovers topptv levels only after 3.5 days. Within 30 minutes from plume injection onlyvery small HOX concentrations are formed in the plume, because of massive
25

depletion of HOx species and halogens mobilization. As a result, HOX (HOX =HOCl + HOBr) is found in extremely low concentrations in both aqueous andgas phases, remaining well below pptv levels throughout Chalo
het simulation. InFig.:6 the evolution of BrO/SO2 ratio during the Chalo
het simulation is reported.Following halogens injection, BrO/SO2 ratio keeps increasing during the firstminutes of plume development, reaching a maximum value of about 2.3× 10⁻⁴
after 30 minutes from plume release. Throughout Chalohet , BrO/SO2 ratio fluctuates
significantly following a diurnal cycle. However, for the whole simulation the ratioremains within the range of experimental measurements and previous modellingsimulations, reaching a max value of 9×10⁻⁴ after 7 days from plume injection(Bobrowski et al., 2003; Oppenheimer et al., 2006; Bobrowski and Platt, 2007;Bobrowski et al., 2007).
In Fig.:5 the isotopic composition of atmospheric and deposited sulphatesof simulation Chalo
het are compared to those of Cgas, Chet and Chalohet . During the
first minutes of simulation atmospheric sulphate carries an O-MIF of about 0.2h.However, within the first 24 hours from plume injection the isotopic anomalydrops to about 0.05h, and by the end of the simulation ∆17O(S(VI)dep.) is equalto 0.08h. The low ∆17O(S(VI)prd) value indicates that sulphate production ispredominantly driven by aqueous phase oxidation pathways, producing sulphatewith ∆17O≈0h. The only S(IV) oxidation channel which does not exhibit diurnalvariation and independent from HOx concentration in the plume is the O2 /TMIoxidation pathway. This oxidation pathway is responsible for most of sulphateproduction during Chalo
het simulation, because of very low HOX concentrations.The results from these simulations indicate that in condensing plumes halo-
gens activation results in a quick decay of H2O2, O3, and OH concentrations. Inthis scenario, the main pathway of SO2 oxidation is the reaction with O2 /TMI inthe liquid phase. Without halogens activation SO2 oxidation depends stronglyon OH gas phase oxidation, and on H2O2, O2 /TMI liquid phase oxidation path-ways. Meanwhile, more sulphate is produced in the plume when no ODEs occur.Sensitivity studies have been carried to investigate model responses to the mostcritical inputs: the amount of SO2 injected, the assumed TMI concentrationsand the LWC of the condensing plume. In occurrence of halogens activation,sulphate isotopic signatures are not significantly influenced by the plume LWCand by the overall SO2 concentration of halogens rich and sulphur rich plumes(i.e. HX/SO2 ≈ 0.5).Preliminary results suggest, indeed, that volcanic sulphateisotopic signatures are particularly sensitive to [TMI] concentrations. For thisreason, here further sensitivity studies are conducted to investigate the im-pact of different dissolved iron concentrations on the final sulphate signatures.Other sensitivity studies regarding volcanic SO2 and LWC influence on sulphateisotopic signature are illustrated in the Supplementary Material section.
26
5.1.2 Influence of TMI concentration
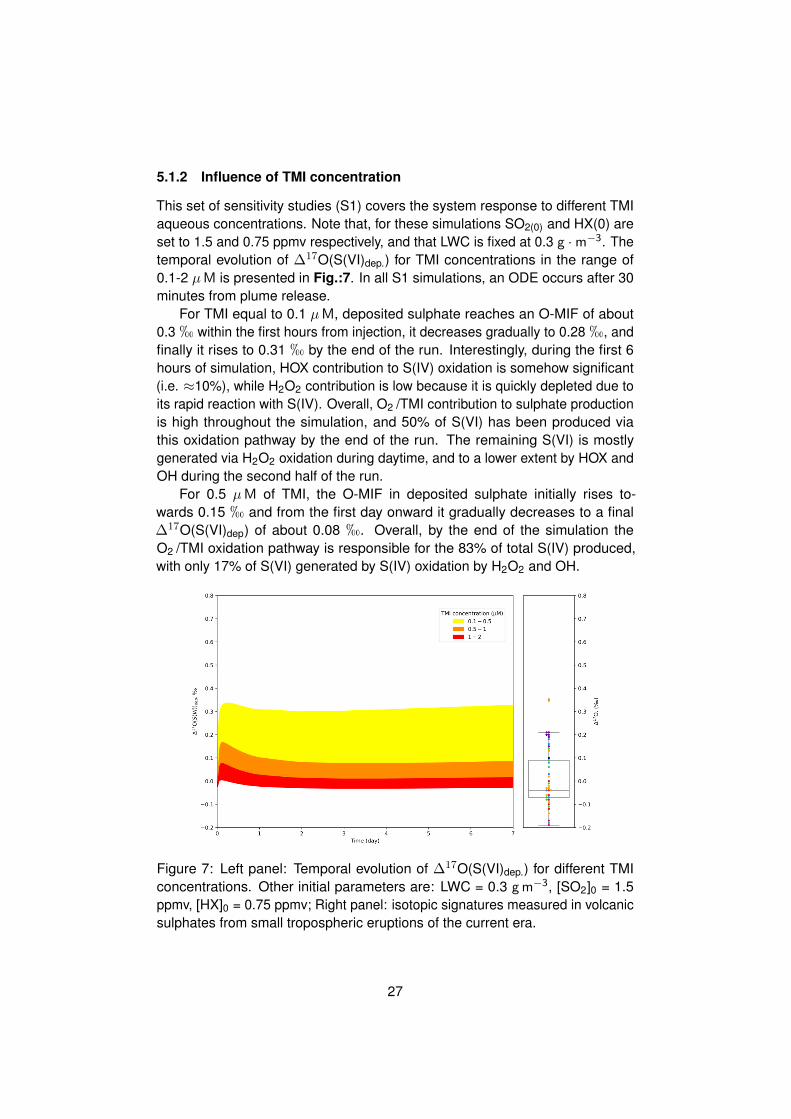
This set of sensitivity studies (S1) covers the system response to different TMIaqueous concentrations. Note that, for these simulations SO2(0) and HX(0) areset to 1.5 and 0.75 ppmv respectively, and that LWC is fixed at 0.3 g ·m−3. Thetemporal evolution of ∆17O(S(VI)dep.) for TMI concentrations in the range of0.1-2 µM is presented in Fig.:7. In all S1 simulations, an ODE occurs after 30minutes from plume release.
For TMI equal to 0.1 µM, deposited sulphate reaches an O-MIF of about0.3 h within the first hours from injection, it decreases gradually to 0.28 h, andfinally it rises to 0.31 h by the end of the run. Interestingly, during the first 6hours of simulation, HOX contribution to S(IV) oxidation is somehow significant(i.e. ≈10%), while H2O2 contribution is low because it is quickly depleted due toits rapid reaction with S(IV). Overall, O2 /TMI contribution to sulphate productionis high throughout the simulation, and 50% of S(VI) has been produced viathis oxidation pathway by the end of the run. The remaining S(VI) is mostlygenerated via H2O2 oxidation during daytime, and to a lower extent by HOX andOH during the second half of the run.
For 0.5 µM of TMI, the O-MIF in deposited sulphate initially rises to-wards 0.15 h and from the first day onward it gradually decreases to a final∆17O(S(VI)dep) of about 0.08 h. Overall, by the end of the simulation theO2 /TMI oxidation pathway is responsible for the 83% of total S(IV) produced,with only 17% of S(VI) generated by S(IV) oxidation by H2O2 and OH.
Figure 7: Left panel: Temporal evolution of ∆17O(S(VI)dep.) for different TMIconcentrations. Other initial parameters are: LWC = 0.3 gm−3, [SO2]0 = 1.5ppmv, [HX]0 = 0.75 ppmv; Right panel: isotopic signatures measured in volcanicsulphates from small tropospheric eruptions of the current era.
27

For TMI concentrations above 0.5 µM, the O-MIF in deposited sulphatesremains mostly below 0.05 h for the whole duration of the runs. By the end ofsimulations more than 90% of S(VI) have been produced by the reaction withO2 /TMI, and remaining sulphates are produced by a mix of OH, H2O2 and HOXoxidants. Notably, at TMI concentration of 2 µM the final ∆17O(S(VI)dep) has anegative O-MIF equal to -0.02 h.
Results from these simulations indicate that when TMI concentration ishigher than 0.5 µM, O2 /TMI oxidation vastly dominates sulphur oxidation. Theresulting O-MIF is lower than 0.1 h, in agreement with measurements observedin tropospheric tropospheric volcanic sulphates from ash-deposits (Martin, 2018).For TMI concentrations below 0.2 µM, only half of the sulphate is produced viathe O2 /TMI oxidation pathway. The remaining sulphate product is generated viaS(IV) oxidation by H2O2 and OH mostly, and the corresponding O-MIF is around0.3 h. Remarkably, when in presence of TMI, SO2 oxidation by HOX is alwaysnegligible with regards to overall sulphate production. This result suggests thatin the long term, even for low TMI concentrations (i.e. ≈ 0.1 µM), the HOXoxidation pathway cannot drive sulphate production.
In conclusion, results from this set of simulations suggest that in a tropo-spheric condensing plume the only way to generate volcanic sulphate withnegative O-MIF is via dominant contribution of O2 /TMI to S(IV) oxidation.Nonetheless, more detailed investigations are needed to assess the role ofiron dissolution from volcanic ash and to assess in-plume TMI concentrations.Physico-chemical processing of suspended ash and mineral particles can vary,indeed, depending on multiple factors, such as ash mineral composition and/oraqueous phase evaporation and condensation cycles. In particular, transportto the upper troposphere and low temperatures can promote major iron mo-bilization from the solid phase, and possibly an overall enhanced contributionof the O2 /TMI sulphur oxidation pathway to volcanic SO2 processing in theatmosphere (Jeong et al., 2012; Langmann, 2014).
5.2 Non-condensing volcanic plumes (sulphate aerosols)
5.2.1 Standard simulations
Simulations Ngas, Nhet, and Nhalohet reproduce the same sulphur and halogens
chemical schemes of simulations Cgas, Chet and Chalohet respectively. This time,
however, volcanic particles are composed by concentrated sulphuric acid (pri-mary volcanic sulphate aerosols), and SO2 heterogeneous reactions are mod-elled via reactive uptake coefficients.
The time evolution of SO2, O3, H2O2, and S(VI) concentrations for Ngas
and Nhet are presented in Fig.:8. In simulation Ngas heterogeneous chemistryis not activated and halogens are absent from the plume. In simulation Nhet
heterogeneous chemistry is active and halogens are absent from the chemicalscheme (see Table:4). In both simulations, SO2 is depleted from 1.5 ppmv to
28

Figure 8: Gas-phase concentrations of atmospheric species during the Ngas,Nhet and Nhalo simulations. The simulations start at 0:00 p.m., and SO2 isinjected after 3 days; Ngas, only the OH oxidation pathway activated; Nhet, het-erogeneous and gas-phase oxidation pathways activated, no halogens; Nhalo,heterogeneous and gas-phase oxidation pathways activated, halogens emis-sions and chemistry included.
0.06 ppmv. Deposited S(VI) and atmospheric S(VI) reach roughly 0.06 ppmveach, with the latter following a diurnal pattern of production. The total producedsulphate in Ngas is 120 ppbv, while for Nhet it is around 130 ppbv. Remarkably,only 10 ppbv more of S(VI) is produced when in Nhet heterogeneous chemistryis activated. Therefore, in Nhet the heterogeneous SO2 oxidation has a rathernegligible contribution to sulphur oxidation. The only noticeable differencebetween Ngas and Nhet is a small depletion in H2O2 observed during the first 3days of the Nhet simulation. This result contrasts significantly with results fromCgas and Chet simulations, where in Chet a sharp drop in H2O2 is observed dueto the fast reaction with S(IV) in the aqueous phase. The temporal evolutionof O-MIFs of atmospheric and deposited S(VI) from Ngas and Nhet simulationsare reported in 9. As expected, there are no significant differences between
29

Figure 9: Time evolution of ∆17O(S(VI))dep. during Ngas (only OH ox.), Nhet (OH+ het. oxidation, without halogens), Nhalo
het (OH + het. oxidation, with halogens).
∆17O(S(VI)prd) and ∆17O(S(VI)dep) of the first two standard simulations. Initially,produced sulphate carries a large O-MIF at ≈ 2.3 h, which declines to about1.2 h towards the end of Ngas and Nhet. For both Ngas and Nhet simulationsthe main SO2 oxidant is OH, and sulphate O-MIFs reflect mostly the isotopicanomaly carried by OH during the reaction.
Simulation Nhalohet , includes heterogeneous chemistry but this time halogens
are also included within the plume chemical scheme. The evolution of SO2, O3,H2O2, and S(VI) in Nhalo
het is shown in Fig.:8. Like Ngas and Nhet simulations,during Nhalo
het simulation the concentration of SO2 decays below 1 ppmv, reachingroughly 0.85-0.9 ppmv by the end of the run. Remarkably, this time much lesssulphate is produced: only 1.9 ppbv of sulphate compared to at least 120ppbv generated during other standard simulations (Cgas, Chet, Chalo
0 , Ngas andNhet). Notably, in Nhalo
het about half of sulphate is also produced within the firsthour from plume injection. The first ODE develops in Nhalo
het only after ≈15min. from halogens and SO2 release, being triggered by very efficient halogensmobilization and bromine activation on sulphuric acid aerosols. The BrO/SO2
ratio reaches a value of about 1× 10⁻⁴ within 5-10 minutes from plume release,in agreement with BrO/SO2 experimental observations in volcanic plumes frompassive degassing (Bobrowski et al., 2003; Oppenheimer et al., 2006; Bobrowskiand Platt, 2007; Bobrowski et al., 2007). Within half an hour from plume releaseO3 levels drop to roughly 0.01 ppbv, inducing the deactivation of the HOx cycleand, notably, blocking OH production. Throughout the simulation the BrO/SO2
values remain within the range of observed measurements, as shown in Fig.:6.After 2 days from plume injection, ozone levels recover to more apprecia-
ble concentrations, reaching ≈ 4-5 ppbv during daytime. By this time, OH isproduced again in the plume because of ozone recover. From the third dayonward, the gas-phase sulphur oxidation by OH drives sulphate production.During the first day H2O2 decreases slowly to 0.1 ppbv, and from the second
30

day onward its concentration remains quite stable for the whole run. From thesecond day onward the photochemical production of H2O2 is prevented dueto O3 destruction, and the only significant source of H2O2 is mixing with thebackground atmosphere. The influx of background air, however, is sufficientto maintain reasonable H2O2 levels within the plume (≈ 0.2 ppbv). Remark-ably, much higher H2O2 concentrations are maintained in Nhalo
het if compared toChalo0 , where the very fast S(IV) oxidation in water droplets results in immediate
H2O2 consumption. Meanwhile, HOx destruction is also responsible for very lowHOX (HOCl+HOBr) production. Notably, hypohalous acids are formed in verynegligible amounts, and they react immediately with X– (Cl– +Br– ) to promotehalogens mobilization. As a result, during Nhalo
het there is no direct contribution ofHOX to the overall S(VI) production.
The atmospheric and deposited sulphate O-MIF evolution during Nhalohet is
shown in Fig.:9, along with those of simulations Ngas and Nhet. In Nhalohet , initially
atmospheric sulphate is produced with an O-MIF of about 1.5 h, a slightly lowervalue if compared to Ngas and Nhet simulations. This time, indeed, OH is quicklydepleted from the gas-phase and a much higher fraction of SO2 is oxidised byH2O2 before the 1st ODE full development. Since the H2O2 O-MIF is lower thanthe one carried by OH in a dense volcanic plume, sulphate O-MIF is smallerduring the first few days of Nhalo
het . Within few days from plume injection OHbecomes again the main SO2 oxidant within the plume. By this time SO2 andHX levels have declined because of plume dilution and chemical reactions. As aresult, ∆17O(OH) and sulphate O-MIF decline according to Eq.:19 and Eq.:24.During Nhalo
het ∆17O(OH) varies from an initial value of 11.2 h to a final value of1.7 h, which correspond to ∆17(S(VI)prd.) values of 2.8 and 0.4 h respectively.By the end of Nhalo
het , both atmospheric and deposited sulphates carry an O-MIFof≈ 1 h. Overall, after 7 days from plume injection 59% of S(VI) is produced viaSO2 heterogeneous oxidation by H2O2 on sulphate aerosols, and the remaining41% is generated in the gas phase via oxidation by OH.
Results from these simulations indicate that in non-condensing volcanicplumes H2O2 and OH are major SO2 oxidants. Unlike condensing plume sim-ulations, the oxidation of SO2 on sulphuric acid is very slow because of lowH2O2 and SO2 solubilities in highly concentrated sulphuric acid solutions. Dur-ing daytime, halogens concentrations can cause fast ODEs via fast bromineactivation on sulphate aerosols. Meanwhile, halogens contribution to sulphateproduction via SO2 oxidation by HOX is negligible, because there is no sufficientaccumulation of hypohalous acids due to the HOx cycle suppression.
Notably, it is possible to distinguish three different phases of SO2 oxidation inpresence of halogens. The first stage corresponds to SO2 oxidation before the1st ODE full development and it is dominated by the gas-phase oxidation by OH.The second phase extends for the time of the 1st ODE and it is characterised bythe SO2 oxidation by H2O2. The third and last phase covers from O3 recover indiluted plumes to the end of simulation, and it is marked by SO2 oxidation byboth H2O2 and OH. Overall, sulphate O-MIF is relatively high and close to 1 h,
31

suggesting that sulphates formed in volcanic plumes during passive degassingshould have 17O-anomalies very close to anthropogenic sulphates O-MIFs (Leeet al., 2001; Lee and Thiemens, 2001). Similarly to the condensing plumescenario, sensitivity studies are conducted in order to assess the variabilityof results to key input parameters, and to explore the ability of the model toreproduce measured O-MIF in sulphate.
5.2.2 Influence of initial halogens concentration (H1)
The second set of sensitivity studies (H1) concerns model sensitivity to the initialhalogens loading. It investigates mostly the impacts of in-plume [HX](0)/[SO2]0ratios on ∆17O(OH), and on sulphate O-MIF. In addition, it also explores theimpacts of HX(0) loadings on ODE formation within the core of non-condensingplumes. In the H1 sensitivity set, [SO2]0 is fixed at 1 ppmv, while [HX]0 ischanged progressively from 0 to 0.8 ppmv, hence covering halogen-to-sulphurratio varying from 0 to 0.8.
The evolutions of ∆17O(S(VI)dep) for six different initial [HX]0 (0, 0.05, 0.1,0.2, 0.4, 0.8 ppmv) are shown in Fig.:10. Note that, the reported simulationwithout halogens (i.e. [HX]0 = 0) is the Nhet standard simulation. Moreover,recall that for such scenario there is no ODE, and that OH is the dominant SO2
in-plume oxidant throughout the simulation. Consequently, it is important toremark that sulphate O-MIF reflects mostly the evolution of OH O-MIF in relationto SO2 loading, and in particular in relation to plume dilution (see Eq.:24). Thissimulation is used as a parameter of comparison for halogens influence onsulphate O-MIF.
The model responses to low halogens loadings (i.e. below 0.2 ppmv) arevery similar. The low halogens loadings simulations include H1a ([HX]0 = 0.05ppmv) and H1b ([HX]0 = 0.1 ppmv). Remarkably, already 50 pbbv of halogensare sufficient to generate an ODE within 2 and a half hours from halogensinjection, as observed in H1a. A doubling in initial halogens loading (i.e. H1b)induce faster ODE formation, with ozone destruction occurring within an hourfrom plume injection. In H1a and H1b the initial stage of SO2 oxidation is drivenby the reaction with OH. In both simulations, initially deposited sulphates carryan O-MIFs of about 1.95 h. These O-MIFs are very close to the 1.9 h valuefound in the no-halogen simulation (Nhet), hence confirming that in presence ofSO2 concentrations of≈ 1 ppmv, low halogens loadings do not affect significantlyin-plume OH O-MIF (see Fig.:3). In more details, in H1a and H1b ∆17O(OH)is equal to 7.8 and 8 h respectively, resulting in sulphates with 1.95 and 2h O-MIFs respectively. By the time the ODEs are fully developed (i.e. 1 and3 hours roughly), OH formation is suppressed and the second stage of SO2
oxidation begins. At this stage SO2 oxidation by H2O2 becomes the dominantpathway of sulphate production, tehrefore generating sulphate with lower O-MIFat 0.87 h. Obviously, in H1b the faster formation of the 1st ODE results in aslightly enhanced contribution of H2O2 to sulphate production during the first
32

day. In both H1a and H1b simulations, large amounts of sulphates are producedby OH oxidation before the formation of the first ODEs. As a result, during thesecond phase the addition of brand new sulphate produced via oxidation byH2O2 affects weakly the overall O-MIFs of deposited sulphates. From the secondday onward, O3 concentrations and OH formations resume, and a third phasefor SO2 oxidation begins. This third last SO2 oxidation stage is characterisedby prevailing oxidation by OH in the gas-phase. By this time in both H1a andH1b ∆17O(OH) have decreased from early peak values, generating sulphateswith O-MIF of about 1.6 and h (see Eq.:19-21). The overall effect on depositedsulphates O-MIFs, however, is moderate, since the rate of sulphate production inthis third phase drops continuously because of decreasing SO2 concentrationsdue to dilution. Remarkably, in H1a and H1b simulations the amount of sulphateproduced during the third stage is much smaller than during the first stage ofSO2 oxidation. In H1b less sulphate is also produced initially by OH because offaster 1st ODE development. Overall, the final sulphate O-MIF for H1b is slightlylower compared to H1a, because of the faster 1st ODE formation. The finalO-MIFs is about 1.75 and 1.7 h for H1a and H1b respectively. By the end of theH1a run, 13% of the sulphate is produced by H2O2 oxidation and the remaining87% by OH. Meanwhile, by the end of the H1b 19% of S(VI) is formed by SO2
oxidation via H2O2, and the remaining 81% by SO2 oxidation via OH.For [HX]0 = 0.2 ppmv (H1c), the first ODE occurs within half an hour from
plume injection, significantly faster than H1a and H1b simulations. Duringthe first phase of oxidation, deposited sulphate carries a high O-MIF of about1.95 h, like H1a and H1b simulations. However, this time the second phase
Figure 10: Left panel: Temporal evolution of ∆17O(S(VI)dep) at different valuesof [HX]0 in non-condensing plumes; Right panel: isotopic signatures measuredin volcanic sulphates from small tropospheric eruptions of the current era.
33

of oxidation begins earlier, hence H2O2 becoming faster the dominant SO2
oxidant. Remarkably, in H1c the first ODE is considerably stronger and morepervasive than previous H1 simulations, therefore H2O2 contribution to sulphateproduction is larger compared to H1a and H1b simulations. Consequently,this second SO2 oxidation phase corresponds to a steep decline in sulphateO-MIF. Within 3 days from plume injection sulphate production enters finallyits third stage. As expected, like previous simulations OH becomes again themain SO2 oxidant. By this time, however, OH O-MIF has considerably lowered(i.e. ∆17O(OH)≈ 0.7h) because of the dilution-driven decline in SO2 andHCl concentrations. Meanwhile, compared to previous H1 simulations, ozonerecover is lower, so is the overall rate of OH formation. As a result, less sulphateis produced in this third phase of SO2 oxidation, and the relative decrease inO-MIF is less stark, resulting in a final O-MIF of about 1.3 h. Overall, 42% ofS(VI) is formed by SO2 oxidation via H2O2 and the remaining 58% is formed bySO2 oxidation via OH.
The model response to high halogens loadings above 0.2 ppmv are verysimilar. The high halogens loading simulations include H1d ([HX]0 = 0.4 ppmv)and H1e ([HX]0 = 0.8 ppmv). For H1d the first ODE fully develops in 20 minutes,while in H1e the first ODE occurs within 15 minutes from plume injection. The firststages of SO2 oxidation are significantly shorter compared to the ones observedat low halogens loadings. In both simulations, the initial deposited sulphateO-MIFs peak at about 1.4 h, a markedly lower level than what observed in lowH1a and H1b simulations. While the initial OH O-MIF is higher than low halogenssimulations, ozone destruction is very fast and SO2 heterogeneous oxidationby H2O2 becomes quickly the main SO2 oxidation pathway. Remarkably, theamounts of sulphate produced in H1d and H1e in this first phase of oxidation arevery small. Within an hour H2O2 becomes the overwhelmingly dominant SO2
oxidant, inducing a sharp O-MIFs drop towards 1.1 h during the second phaseof oxidation. Finally, by the third day the final phase of SO2 oxidation begins forboth H1c and H1d. Once again, OH becomes the dominant pathway of SO2
oxidation, but OH formation is weaker due to more pervasive ODEs. Meanwhile,∆17O(OH) values have significantly decreased because of plume dilution. As aresult, the combination of lower OH O-MIFs and plume dilution produces littlevariation in sulphate O-MIFs, which stabilizes at 1.1 h during this final stage ofSO2 oxidation. Finally, for H1d ([HX]0 = 0.4 ppmv), 51% of S(VI) is formed byH2O2 oxidation, and the remaining 49% by OH oxidation; while for H1e ([HX]0 =0.8 ppmv), 56% of S(VI) is formed by H2O2 oxidation and the remaining 44% isformed by OH oxidation.
Results from the H1 set of sensitivity simulations suggest that volcanic halo-gens concentrations have multiple effects on the plume chemical development.Remarkably, even relatively small halogen loadings (i.e. 50 ppbv) induce ODEs,and suppression of in-plume OH production. Notably, the speed of formation,amplitude and duration of in-plume ODEs increase with halogens loading. Atthe same time stronger ODEs result in enhanced H2O2 contribution to sulphate
34

production, and, overall in lower amounts of sulphate produced within the plume.As for the H1 sensitivity simulations, halogens loading does not have a majorimpact on the O-MIF of volcanic sulphate produced in non-condensing plumes.The final deposited sulphate O-MIF, indeed, varies between 1 and 1.4 h forhalogen-to-sulphur ratio between 0 and 1. Notably, the sulphate O-MIF is onlymarginally affected by increasing halogens concentrations because, while OHO-MIF increases proportionally with halogens loading, the overall contributionof OH to SO2 oxidation is inversely proportional to halogens concentrations.Finally, like all previous non-condensing plume simulations, modelled sulphateO-MIF of H1 are not at all consistent with most O-MIF measurements in sulphatecollected on volcanic ash.
6 Summary and concluding remarks
Volcanic plumes are peculiar chemical environments, radically different frombackground air. They are mostly composed by a mix of water, sulphur andhalogens species. While sulphur is almost entirely emitted as SO2, with a verysmall fraction (typically 1%) emitted at vents as primary sulphate aerosols, mosttropospheric volcanic sulphate is produced in the atmosphere as a result of SO2
processing. Remarkably, most tropospheric volcanic sulphates extracted fromvolcanic ash-deposits of small tropospheric eruptions of the current geologicalera have an oxygen mass-independent fractionation equal to 0 h (Martin, 2018),indicating that peculiar SO2 oxidation pathways should take place within theplume.
The tropospheric photochemical box-model CiTTyCAT is used to simulatesulphur oxidation in presence of halogens in the core of volcanic plumes, andthe resulting oxygen isotopic compositions in produced and deposited sulphates.An heterogeneous chemistry scheme for halogens has been implemented inthe model. In addition, a new heterogeneous chemistry scheme has beenadded to account also for SO2 oxidation on sulphate aerosols. This work is afollow-on of a modelling study on sulphur oxidation in a volcanic plume and theresulting secondary sulphate isotopic composition (Galeazzo et al., 2018). Thepresent study aims at extending the investigation to cover previously missingprocesses. Here, the focus is on the role of halogens in plume chemistry andthe implications for the isotopic composition of volcanic secondary sulphate.In more details, two typical volcanic plumes scenarios are investigated: thecondensing plume (i.e. made of water droplets) and the non-condensing plume(i.e. made of sulphate aerosols) scenarios. Interestingly, very different resultsand conclusions are drawn from these two situations.
With regards to condensing plumes, the first finding is that ozone depletionevents (ODE) catalysed by halogens might occur in presence of water dropletseven for very slow halogens reactions (γr ≈ 10−5). The ODE is initiated byemitted bromine and chlorine radicals, and then it develops via heterogeneous
35

chemistry and halogens mobilization from water droplets. The second salientfinding is that, in presence of halogens activation, SO2 oxidation by both H2O2
in water droplets and OH in the gas-phase are negligible. Within a condensingplume, indeed, H2O2 is immediately consumed by sulphur reaction betweenSO2 and S(IV) in the aqueous phase, while the gas-phase OH concentration isseverely depressed by ozone destruction. At the same time, O3 is a negligibleoxidant because the ozone concentration is very low and, more importantly,because the aqueous phase is much too acidic. In addition, HOCl and HOBr(i.e. HOX) do not contribute significantly to sulphur oxidation because theirconcentrations are very low under the effects of the fast halogens heteroge-neous reactions. Consequently, according to model calculations, in condensingplumes SO2 oxidation is dominated by S(IV) aqueous reaction with O2 /TMI,even for relatively low TMI aqueous concentrations. As the plume mixes with thebackground air and becomes more diluted, halogens radical cycling weakensand the O3, OH and H2O2 concentrations increase substantially. Nonetheless,the O2 /TMI oxidation remains the overall dominant oxidation pathway. Notably,even in absence of halogens, this sulphate production channel can be dominantfor TMI concentrations around 2 µM (i.e. high spectrum of typical atmosphericconcentrations) (Galeazzo et al., 2018). As a result, volcanic sulphate carriesa low oxygen mass-independent isotopic anomaly, and in some cases, the sul-phate O-MIF is equal to 0 h (i.e. mass-dependent sulphate). These results areconsistent with most isotopic measurements on sulphate collected on volcanicash, which indicate mass-dependent sulphate within the typical measurementerror (0.1 h). Finally, the model calculates sulphate O-MIF below 0.1 h onlyif the concentration of TMI is significant (i.e. above 0.5 µM). Model calcula-tions, however, would be much better constrained, if more information on TMIconcentrations in volcanic water phases would be available.
With regards to non-condensing plumes (i.e. only sulphate aerosols), thefirst finding is that even for relatively low halogen loadings (about 50 ppbv)an ODE occurs; the speed of formation, amplitude and duration of the ODEdepend on the initial halogens loading. In addition, the rate of SO2 oxidation,and hence the amount of sulphate produced, is much lower in non-condensingplume simulations than in condensing plume ones. Overall, sulphate productionis found to be inversely correlated to in-plume halogens concentrations, becauseof ODEs magnitude and duration. The second finding is that, the SO2 reactionswith O2 /TMI and HOX on sulphate aerosols are totally negligible, and thatsulphur oxidation is dominated by H2O2 oxidation on sulphate aerosols andOH oxidation in the gas-phase. The H2O2 contribution to SO2 oxidation is verysignificant because, contrary to a condensing plume, the H2O2 concentrationdoes not drop instantaneously. Notably, H2O2 is consumed very slowly becauseof the low solubility of H2O2 in concentrated sulphuric acid solutions. Within anon-condensing volcanic plume gas-phase SO2 oxidation is severely reducedafter the formation of the 1st ODE (within 15 min. to 2-3 hr. depending on thehalogens loading), in particular because of the OH concentration drop generated
36

by the ozone depletion. The relative contributions of OH and H2O2 to the totalsulphur oxidation vary depending on the initial sulphur and halogens loadings.When the sulphur loading is small and the halogens loading is large, the relativecontribution of H2O2 to sulphur oxidation increases to the detriment of the OHoxidation. Typically, at low halogens loading, the contribution of OH oxidation ishigher than the H2O2 contribution and, at high halogens loading, it is the reverse.As a result, the third finding is that the O-MIFs of sulphates formed withina non-condensing plume is high. For all non-condensing plume simulations(including the sensitivity), the final deposited sulphate O-MIF varies between0.8 and 1.4 h. It is not at all consistent with most isotopic measurement onsulphate collected on volcanic ash. Recently, it has been demonstrated that OH∆17 O is large within volcanic plumes in presence of large SO2 concentrations(Galeazzo et al., 2018). The present model calculations indicate that OH MIF isfurther enhanced by typical HCl in-plume concentrations. Overall, the net effecton the final ∆17O on sulphate is affected by the relative contribution of OH andH2O2 on sulphur oxidation. However, while sulphur oxidation by H2O2 generatessulphate with O-MIF of 0.87 h, the ∆17 O in sulphate generated by OH variesstrongly with the sulphur and halogen loadings, hence in relation to plumedilution. Recall that, however, the rate of SO2 heterogeneous oxidation by H2O2
on sulphate particles is quite uncertain, but that model calculated O-MIF wouldbe considerably higher for non-condensing plumes without considering thissulphur oxidation pathway. In conclusion, these results suggest that sulphatescollected in volcanic ash-deposits are not produced in non-condensing plumes,and it is possibly generated in condensing plumes or within water phases at thesurface of ash.
There are a number of uncertainties associated with the present modellingwork, arising notably from the chosen model inputs, such as kinetic data and theisotopic signatures of SO2 oxidation pathways. In a first place, a certain degreeof uncertainty is related to the SO2 liquid phase oxidation by O2 catalysed bytransition metal ions. The oxidation, indeed, results form a series of complexradical reactions, and a significant limit is imposed by the number of oxygenatoms transferred to final sulphate product via the reaction. In this study, indeed,it has been assumed that only one oxygen atom would be transferred duringSO2 oxidation out of the two oxygen atoms of O2. Therefore sulphate isotopicsignatures might be slightly overestimated. Another source of uncertainty arisefrom the values of kinetic data used for the SO2 + OH and the H2O + OH reac-tions. The reaction rate constants for both reactions are quite outdated (Calvertet al., 1978; Dubey et al., 1997), and new kinetic data from laboratory experi-ments or ab-initio calculations would provide better constraints for modelled OHO-MIF signature, hence for secondary volcanic sulphate modelled signatures.Another limit of current model simulations is related to halogens chemistry. Inthis study, similar halogens reactive uptakes have been used to cover all halo-gens heterogeneous reactions in sulphate aerosols. All reactive uptakes havebeen set to a rather low value of γr ≈ 10−5, but this assumption is a quite crude
37

approximation. However, it is challenging to treat differently halogens chemistryin model simulations, notably because of the lack of experimental data on thesubject, and in particular for atmospheric temperatures above 273.15 K andwater droplets. Ideally, the results from this study would gain in robustness inpresence of a qualitative and significant revision of current kinetic data, notablywith regards to halogens chemistry and sulphur oxidation in liquid phase.
There are, however, several ways of testing these model predictions. Firstof all, the occurrence of a high ∆17 O in volcanic sulphate produced by OHoxidation should be first tested. In principle, laboratory chamber experimentsshould be able to do it, notably in a controlled setting (i.e. humidity, ozone,SO2 or halogen loadings) where OH chemical sources and losses are well con-strained. It would also be desired to collect sulphate aerosols in the atmosphereduring field campaigns, preferably far from volcanic vents (where the secondarysulphate dominates the composition of sulphate), and analyse their isotopic com-position. A designated field campaign should take place in a location where thecontribution of background non-volcanic sulphur aerosols (e.g. anthropogenicor sea-salt sulphates) to the total sulphate budget can be subtracted. This canbe done easily for sea-salt sulphate; therefore, a campaign around a stronghalogen and sulphur-rich degassing volcano in the middle of an ocean (such ason Ambrym, Vanuatu) would be the ideal location.
References
Aiuppa, A. (2009). Degassing of halogens from basaltic volcanism: Insightsfrom volcanic gas observations. Chem. Geol., 263(1-4):99–109.
Aiuppa, A., Baker, D. R., and Webster, J. D. (2009). Halogens in volcanicsystems. Chem. Geol., 263(1-4):1–18.
Aiuppa, A., Federico, C., Franco, A., Giudice, G., Gurrieri, S., Inguaggiato, S.,Liuzzo, M., McGonigle, A. J., and Valenza, M. (2005). Emission of bromineand iodine from Mount Etna volcano. Geochemistry, Geophys. Geosystems,6(8):1–8.
Alexander, B., Park, R. J., Jacob, D. J., Li, Q. B., Yantosca, R. M., Savarino,J., Lee, C. C. W., and Thiemens, M. H. (2005). Sulfate formation in sea-saltaerosols: Constraints from oxygen isotopes. J. Geophys. Res. D Atmos.,110(10):1–12.
Ammann, M., Cox, R. A., Crowley, J. N., Jenkin, M. E., Mellouki, A., Rossi, M. J.,Troe, J., and Wallington, T. J. (2013). Evaluated kinetic and photochemicaldata for atmospheric chemistry: Volume VI – heterogeneous reactions withliquid substrates. Atmos. Chem. Phys., 13(16):8045–8228.
38

Arnold, S. R., Methven, J., Evans, M. J., Chipperfield, M. P., Lewis, A. C.,Hopkins, J. R., McQuaid, J. B., Watson, N., Purvis, R. M., Lee, J. D., Atlas,E. L., Blake, D. R., and Rappenglück, B. (2007). Statistical inference of OHconcentrations and air mass dilution rates from successive observations ofnonmethane hydrocarbons in single air masses. J. Geophys. Res. Atmos.,112(10):1–15.
Ayris, P. and Delmelle, P. (2012). Volcanic and atmospheric controls on ash ironsolubility: A review. Phys. Chem. Earth, 45-46(August 2008):103–112.
Bao, H., Lyons, J. R., and Zhou, C. (2008). Triple oxygen isotope evidence forelevated CO2 levels after a Neoproterozoic glaciation. Nature, 453(7194):504–506.
Bao, H., Thiemens, M. H., Loope, D. B., and Yuan, X. L. (2003). Sulfate oxygen-17 anomaly in an Oligocene ash bed in mid-North America: Was it the dryfogs? Geophys. Res. Lett., 30(16).
Barkan, E. and Luz, B. (2003). High-precision measurements of 17O/16O and18O/16O of O2 and O2/Ar ratio in air. Rapid Commun. Mass Spectrom.,17(24):2809–2814.
Baroni, M., Savarino, J., Cole-Dai, J., Rai, V. K., and Thiemens, M. H. (2008).Anomalous sulfur isotope compositions of volcanic sulfate over the last millen-nium in Antarctic ice cores. J. Geophys. Res., 113(D20):D20112.
Bhattacharya, S. K., Pandey, A., and Savarino, J. (2008). Determination ofintramolecular isotope distribution of ozone by oxidation reaction with silvermetal. J. Geophys. Res., 113(D3):D03303.
Bobrowski, N., Hönninger, G., Galle, B., and Platt, U. (2003). Detection ofbromine monoxide in a volcanic plume. Nature, 423(6937):273–276.
Bobrowski, N. and Platt, U. (2007). SO2/BrO ratios studied in five volcanicplumes. J. Volcanol. Geotherm. Res., 166(3-4):147–160.
Bobrowski, N., von Glasow, R., Aiuppa, A., Inguaggiato, S., Louban, I., Ibrahim,O. W., and Platt, U. (2007). Reactive halogen chemistry in volcanic plumes. J.Geophys. Res. Atmos., 112(6):1–17.
Boichu, M., Oppenheimer, C., Roberts, T. J., Tsanev, V., and Kyle, P. R. (2011).On bromine, nitrogen oxides and ozone depletion in the tropospheric plumeof Erebus volcano (Antarctica). Atmos. Environ., 45(23):3856–3866.
Cadoux, A., Scaillet, B., Bekki, S., Oppenheimer, C., and Druitt, T. H. (2015).Stratospheric Ozone destruction by the Bronze-Age Minoan eruption (San-torini Volcano, Greece). Sci. Rep., 5(November 2014):1–12.
39

Calvert, J. G., Su, F., Bottenheim, J. W., and Strausz, O. P. (1978). Mechanismof the homogeneous oxidation of sulfur dioxide in the troposphere. Atmos.Environ., 12(1-3):197–226.
Carey, L. D., Niu, J., Yang, P., Kankiewicz, J. A., Larson, V. E., and VonderHaar, T. H. (2008). The vertical profile of liquid and ice water content inmidlatitude mixed-phase altocumulus clouds. J. Appl. Meteorol. Climatol.,47(9):2487–2495.
Chen, Q., Geng, L., Schmidt, J. A., Xie, Z., Kang, H., Dachs, J., Cole-Dai, J.,Schauer, A. J., Camp, M. G., and Alexander, B. (2016). Isotopic constraintson the role of hypohalous acids in sulfate aerosol formation in the remotemarine boundary layer. Atmos. Chem. Phys., 16(17):11433–11450.
Chen, Q., Schmidt, J. A., Shah, V., Jaeglé, L., Sherwen, T., and Alexander, B.(2017). Sulfate production by reactive bromine: Implications for the globalsulfur and reactive bromine budgets. Geophys. Res. Lett., 44(13):7069–7078.
Davidovits, P., Kolb, C. E., Williams, L. R., Jayne, J. T., and Worsnop, D. R.(2006). Mass accommodation and chemical reactions at gas-liquid interfaces.Chem. Rev., 106(4):1323–1354.
de Foy, B., Krotkov, N. A., Bei, N., Herndon, S. C., Huey, L. G., Martínez, A.-P.,Ruiz-Suárez, L. G., Wood, E. C., Zavala, M., and Molina, L. T. (2009). Hitfrom both sides: tracking industrial and volcanic plumes in Mexico City withsurface measurements and OMI SO_{2} retrievals during the MILAGRO fieldcampaign. Atmos. Chem. Phys., 9(24):9599–9617.
De Moor, J. M., Fischer, T. P., Sharp, Z. D., King, P. L., Wilke, M., Botcharnikov,R. E., Cottrell, E., Zelenski, M., Marty, B., Klimm, K., Rivard, C., Ayalew, D.,Ramirez, C., and Kelley, K. A. (2013). Sulfur degassing at Erta Ale (Ethiopia)and Masaya (Nicaragua) volcanoes: Implications for degassing processes andoxygen fugacities of basaltic systems. Geochemistry, Geophys. Geosystems,14(10):4076–4108.
Delmelle, P. (2003). Environmental impacts of tropospheric volcanic gas plumes.Geol. Soc. London, Spec. Publ., 213(1):381–399.
Delmelle, P., Stix, J., Bourque, C. P. A., Baxter, P. J., Garcia-Alvarea, J., andBarqueror, J. (2001). Dry deposition and heavy acid loading in the vicinity ofMasaya Volcano, a major sulfur and chlorine source in Nicaragua. Environ.Sci. Technol., 35(7):1289–1293.
DeMore, W. B., Sander, S. P., Golden, D. M., Hampson, R. F., Kurylo, M. J.,Howard, C. J., Ravishankara, A. R., Kolb, C. E., and Molina, M. J. (1997).Chemical Kinetics and Photochemical Data for Use in Stratospheric ModelingSupplement to Evaluation 12: Update of Key Reactions. Evaluation Number13. JPL Publ., 00-3(13):74.
40

Dubey, M. K., Mohrschladt, R., Donahue, N. M., and Anderson, J. G. (1997).Isotope Specific Kinetics of Hydroxyl Radical (OH) with Water (H 2 O): TestingModels of Reactivity and Atmospheric Fractionation. J. Phys. Chem. A,101(8):1494–1500.
Durand, M. and Grattan, J. (2001). Effects of volcanic air pollution on health.Lancet, 357(9251):164.
Eiler, J. M. (2001). Oxygen Isotope Variations of Basaltic Lavas and UpperMantle Rocks. Rev. Mineral. Geochemistry, 43:319–364.
Evans, M., Shallcross, D., Law, K., Wild, J., Simmonds, P., Spain, T., Berrisford,P., Methven, J., Lewis, A., McQuaid, J., Pilling, M., Bandy, B., Penkett, S.,and Pyle, J. (2000). Evaluation of a Lagrangian box model using field mea-surements from EASE (Eastern Atlantic Summer Experiment) 1996. Atmos.Environ., 34(23):3843–3863.
Fogelman, K. D., Walker, D. M., and Margerum, D. W. (1989). Nonmetal redoxkinetics: hypochlorite and hypochlorous acid reactions with sulfite. Inorg.Chem., 28(6):986–993.
Galeazzo, T., Bekki, S., Martin, E., Savarino, J., and Arnold, S. R. (2018).Photochemical box-modelling of volcanic SO2 oxidation: isotopic constraints.Atmos. Chem. Phys. Discuss., (April):1–38.
Gautier, E., Savarino, J., Hoek, J., Erbland, J., Caillon, N., Hattori, S., Yoshida, N.,Albalat, E., Albarede, F., and Farquhar, J. (2019). 2600-years of stratosphericvolcanism through sulfate isotopes. Nat. Commun., 10(1):466.
Gerlach, T. M. (2004). Volcanic sources of tropospheric ozone-depleting tracegases. Geochemistry, Geophys. Geosystems, 5(9).
Gromov, S., Joeckel, P., Sander, R., and Brenninkmeijer, C. A. M. (2010).A kinetic chemistry tagging technique and its application to modelling thestable isotopic composition of atmospheric trace gases. Geosci. Model Dev.,3(2):337–364.
Hanson, D. R., Ravishankara, a. R., and Solomon, S. (1994). Heterogeneousreactions in sulfuric acid aerosols: A framework for model calculations. J.Geophys. Res., 99(D2):3615.
He, H., Wang, Y., Ma, Q., Ma, J., Chu, B., Ji, D., Tang, G., Liu, C., Zhang, H.,and Hao, J. (2014). Mineral dust and NOx promote the conversion of SO2 tosulfate in heavy pollution days. Sci. Rep., 4(2):1–6.
Herrmann, H., Ervens, B., Jacobi, H. W., Wolke, R., Nowacki, P., and Zellner,R. (2000). CAPRAM2.3: A chemical aqueous phase radical mechanism fortropospheric chemistry. J. Atmos. Chem., 36(3):231–284.
41

Hönninger, G. (2004). Reactive bromine and sulfur emissions at Salar de Uyuni,Bolivia. Geophys. Res. Lett., 31(4):L04101.
Hoshyaripour, G. A., Hort, M., and Langmann, B. (2015). Ash iron mobilizationthrough physicochemical processing in volcanic eruption plumes: a numericalmodeling approach. Atmos. Chem. Phys., 15(16):9361–9379.
Jeong, D., Kim, K., and Choi, W. (2012). Accelerated dissolution of iron oxidesin ice. Atmos. Chem. Phys., 12(22):11125–11133.
Jourdain, L., Roberts, T. J., Pirre, M., and Josse, B. (2016). Modeling thereactive halogen plume from Ambrym and its impact on the troposphere withthe CCATT-BRAMS mesoscale model. Atmos. Chem. Phys., 16(18):12099–12125.
Kelly, P. J., Kern, C., Roberts, T. J., Lopez, T., Werner, C., and Aiuppa, A. (2013).Rapid chemical evolution of tropospheric volcanic emissions from RedoubtVolcano, Alaska, based on observations of ozone and halogen-containinggases. J. Volcanol. Geotherm. Res., 259:317–333.
Korolev, A. V., Isaac, G. A., Strapp, J. W., Cober, S. G., and Barker, H. W. (2007).In situ measurements of liquid water content profiles in midlatitude stratiformclouds. Q. J. R. Meteorol. Soc., 133(628):1693–1699.
Kroll, J. H., Cross, E. S., Hunter, J. F., Pai, S., Wallace, L. M., Croteau, P. L.,Jayne, J. T., Worsnop, D. R., Heald, C. L., Murphy, J. G., and Frankel, S. L.(2015). Atmospheric evolution of sulfur emissions from Kilauea: Real-timemeasurements of oxidation, dilution, and neutralization within a volcanicplume. Environ. Sci. Technol., 49(7):4129–4137.
Langmann, B. (2014). On the role of climate forcing by volcanic sulphate andvolcanic ash. Adv. Meteorol., 2014.
Lee, C. C. W., Savarino, J., and Thiemens, M. H. (2001). Mass independentoxygen isotopic composition of atmospheric sulfate: Origin and implicationsfor the present and past atmosphere of Earth and Mars. Geophys. Res. Lett.,28(9):1783–1786.
Lee, C. C.-W. and Thiemens, M. H. (2001). The delta 17 O and delta 18O measurements of atmospheric sulfate from a coastal and high alpineregion: A mass-independent isotopic anomaly. J. Geophys. Res. Atmos.,106(D15):17359–17373.
LeGrande, A. N., Anchuikaitis, K., von Gunten, L., and Goodwin, L. (2010).Volcanoes and climate. Technical Report 6.
Longo, B. M. (2013). Adverse Health Effects Associated with Increased Activityat Kı̄lauea Volcano: A Repeated Population-Based Survey. ISRN PublicHealth, 2013(April 2008):1–10.
42

Longo, B. M., Rossignol, A., and Green, J. B. (2008). Cardiorespiratory healtheffects associated with sulphurous volcanic air pollution. Public Health,122(8):809–820.
Lyons, J. R. (2001). Transfer of mass-independent fractionation in ozone toother oxygen-containing radicals in the atmosphere. Geophys. Res. Lett.,28(17):3231–3234.
Marcus, R. A. (2013). Theory of mass-independent fractionation of isotopes,phase space accessibility, and a role of isotopic symmetry. Proc. Natl. Acad.Sci., 110(44):17703–17707.
Martin, E. (2018). Volcanic Plume Impact on the Atmosphere and Climate : O-and S-Isotope Insight into Sulfate Aerosol Formation. 1991:1–23.
Martin, E., Bekki, S., Ninin, C., and Bindeman, I. (2014). Volcanic sulfate aerosolformation in the troposphere. J. Geophys. Res. Atmos., 119(22):12,660–12,673.
Martin, E. and Bindeman, I. (2009). Mass-independent isotopic signaturesof volcanic sulfate from three supereruption ash deposits in Lake Tecopa,California. Earth Planet. Sci. Lett., 282(1-4):102–114.
Martin, R. S., Mather, T. A., and Pyle, D. M. (2006). High-temperature mixturesof magmatic and atmospheric gases. Geochemistry, Geophys. Geosystems,7(4).
Maters, E. C., Delmelle, P., and Bonneville, S. (2016). Atmospheric Processingof Volcanic Glass: Effects on Iron Solubility and Redox Speciation. Environ.Sci. Technol., 50(10):5033–5040.
Maters, E. C., Delmelle, P., and Gunnlaugsson, H. P. (2017). Controls on ironmobilisation from volcanic ash at low pH: Insights from dissolution experimentsand Mössbauer spectroscopy. Chem. Geol., 449:73–81.
Mather, T., Pyle, D. M., and Oppenheimer, C. (2003). Tropospheric volcanicaerosol. Volcanism Earth’s Atmos., pages 189–212.
Mather, T. A. (2015). Volcanoes and the environment: Lessons for understandingEarth’s past and future from studies of present-day volcanic emissions. J.Volcanol. Geotherm. Res., 304:160–179.
Mather, T. A., McCabe, J. R., Rai, V. K., Thiemens, M. H., Pyle, D. M., Heaton,T. H. E., Sloane, H. J., and Fern, G. R. (2006). Oxygen and sulfur isotopiccomposition of volcanic sulfate aerosol at the point of emission. J. Geophys.Res. Atmos., 111(18):1–9.
43

Mather, T. A., Witt, M. L., Pyle, D. M., Quayle, B. M., Aiuppa, A., Bagnato, E.,Martin, R. S., Sims, K. W., Edmonds, M., Sutton, A. J., and Ilyinskaya, E.(2012). Halogens and trace metal emissions from the ongoing 2008 summiteruption of Kı̄lauea volcano, Hawaìi. Geochim. Cosmochim. Acta, 83:292–323.
McCormick, M. P., Thomason, L. W., and Trepte, R. C. (1995). Atmosphericeffects of the Mt Pinatubo eruption. Nature, 373(February 1995):399–404.
Methven, J., Arnold, S. R., Stohl, A., Evans, M. J., Avery, M., Law, K., Lewis,A. C., Monks, P. S., Parrish, D. D., Reeves, C. E., Schlager, H., Atlas, E. L.,Blake, D. R., Coe, H., Crosier, J., Flocke, F. M., Holloway, J. S., Hopkins,J. R., McQuaid, J., Purvis, R., Rappenglück, B., Singh, H. B., Watson, N. M.,Whalley, L. K., and Williams, P. I. (2006). Establishing Lagrangian connec-tions between observations within air masses crossing the Atlantic duringthe International Consortium for Atmospheric Research on Transport andTransformation experiment. J. Geophys. Res. Atmos., 111(23):1–21.
Michalski, G., Scott, Z., Kabiling, M., and Thiemens, M. H. (2003). First mea-surements and modeling of D17 O in atmospheric nitrate. Geophys. Res.Lett., 30(16):1870.
Michalski, G. and Xu, F. (2010). Isotope modeling of nitric acid formation inthe atmosphere using ISO-RACM: testing the importance of NO oxidation,heterogeneous reactions, and trace gas chemistry. Atmos. Chem. Phys.Discuss., 10(3):6829–6869.
Millard, G. A., Mather, T. A., Pyle, D. M., Rose, W. I., and Thornton, B. (2006).Halogen emissions from a small volcanic eruption: Modeling the peak concen-trations, dispersion, and volcanically induced ozone loss in the stratosphere.Geophys. Res. Lett., 33(19):6–11.
Minnis, P., Harrison, E. F., Stowe, L. L., Gibson, G. G., Denn, F. M., Doelling,D. R., and Smith, W. L. (1993). Radiative climate forcing by the mount Pinatuboeruption. Science, 259(5100):1411–5.
Morin, S., Sander, R., and Savarino, J. (2011). Simulation of the diurnal vari-ations of the oxygen isotope anomaly (Delta {17}O) of reactive atmosphericspecies. Atmos. Chem. Phys., 11(8):3653–3671.
Morin, S., Savarino, J., Bekki, S., Gong, S., and Bottenheim, J. W. (2007).Signature of Arctic surface ozone depletion events in the isotope anomaly(Delta{17}O) of atmospheric nitrate. Atmos. Chem. Phys., 7(5):1451–1469.
Morin, S., Savarino, J., Frey, M. M., Yan, N., Bekki, S., Bottenheim, J. W., andMartins, J. M. F. (2008). Tracing the origin and fate of NOx in the Arcticatmosphere using stable isotopes in nitrate. Science, 322(5902):730–2.
44

Oppenheimer, C., Fischer, T. P., and Scaillet, B. (2013). Volcanic Degassing:Process and Impact, volume 4.
Oppenheimer, C., Kyle, P., Eisele, F., Crawford, J., Huey, G., Tanner, D., Kim,S., Mauldin, L., Blake, D., Beyersdorf, A., Buhr, M., and Davis, D. (2010).Atmospheric chemistry of an Antarctic volcanic plume. J. Geophys. Res.Atmos., 115(4):1–15.
Oppenheimer, C., Tsanev, V. I., Braban, C. F., Cox, R. A., Adams, J. W., Aiuppa,A., Bobrowski, N., Delmelle, P., Barclay, J., and McGonigle, A. J. S. (2006).BrO formation in volcanic plumes. Geochim. Cosmochim. Acta, 70(12):2935–2941.
Pan, L. L., Honomichl, S. B., Randel, W. J., Apel, E. C., Atlas, E. L., Beaton, S. P.,Bresch, J. F., Hornbrook, R., Kinnison, D. E., Lamarque, J. F., Saiz-Lopez,A., Salawitch, R. J., and Weinheimer, A. J. (2015). Bimodal distribution offree tropospheric ozone over the tropical western Pacific revealed by airborneobservations. Geophys. Res. Lett., 42(18):7844–7851.
Parazols, M., Marinoni, A., Amato, P., Abida, O., Laj, P., and Mailhot, G. (2006).Speciation and role of iron in cloud droplets at the puy de Dôme station. J.Atmos. Chem., 54(3):267–281.
Pugh, T. A., Cain, M., Methven, J., Wild, O., Arnold, S. R., Real, E., Law, K. S.,Emmerson, K. M., Owen, S. M., Pyle, J. A., Hewitt, C. N., and MacKenzie,A. R. (2012). A Lagrangian model of air-mass photochemistry and mixingusing a trajectory ensemble: The Cambridge Tropospheric Trajectory modelof Chemistry And Transport (CiTTyCAT) version 4.2. Geosci. Model Dev.,5(1):193–221.
Raga, G. B., Kok, G. L., Baumgardner, D., Báez, A., and Rosas, I. (1999).Evidence for volcanic influence on Mexico City aerosols. Geophys. Res. Lett.,26(8):1149–1152.
Rattigan, O. V., Boniface, J., Swartz, E., Davidovits, P., Jayne, J. T., Kolb, C. E.,and Worsnop, D. R. (2000). Uptake of gas-phase SO 2 in aqueous sulfuricacid: Oxidation by H 2 O 2 , O 3 , and HONO. J. Geophys. Res. Atmos.,105(D23):29065–29078.
Real, E., Law, K. S., Weinzierl, B., Fiebig, M., Petzold, A., Wild, O., Methven, J.,Arnold, S., Stohl, A., Huntrieser, H., Roiger, A., Schlager, H., Stewart, D., Av-ery, M., Sachse, G., Browell, E., Ferrare, R., and Blake, D. (2007). Processesinfluencing ozone levels in Alaskan forest fire plumes during long-range trans-port over the North Atlantic. J. Geophys. Res. Atmos., 112(D10):n/a—-n/a.
Roberts, T. J., Braban, C. F., Martin, R. S., Oppenheimer, C., Adams, J. W.,Cox, R. A., Jones, R. L., and Griffiths, P. T. (2009). Modelling reactive
45

halogen formation and ozone depletion in volcanic plumes. Chem. Geol.,263(1-4):151–163.
Roberts, T. J., Braban, C. F., Oppenheimer, C., Martin, R. S., Freshwater, R. A.,Dawson, D. H., Griffiths, P. T., Cox, R. A., Saffell, J. R., and Jones, R. L. (2012).Electrochemical sensing of volcanic gases. Chem. Geol., 332-333:74–91.
Robock, A. (2000). Volcanic eruptions and climate. Rev. Geophys., 38(2):191–219.
Robock, A. (2002). PINATUBO ERUPTION: The Climatic Aftermath. Science(80-. )., 295(5558):1242–1244.
Robock, A. (2013). Introduction: Mount Pinatubo as a Test of Climate FeedbackMechanisms. Volcanism Earth’s Atmos., pages 1–8.
Rose, W. I. and Durant, A. J. (2009). Fine ash content of explosive eruptions. J.Volcanol. Geotherm. Res., 186(1-2):32–39.
Rose, W. I., Millard, G. A., Mather, T. A., Hunton, D. E., Anderson, B., Oppen-heimer, C., Thornton, B. F., Gerlach, T. M., Viggiano, A. A., Kondo, Y., Miller,T. M., and Ballenthin, J. O. (2006). Atmospheric chemistry of a 33-34 hour oldvolcanic cloud from Hekla Volcano (Iceland): Insights from direct samplingand the application of chemical box modeling. J. Geophys. Res. Atmos.,111(20):1–17.
Saiz-Lopez, A. (2004). Bromine oxide in the mid-latitude marine boundary layer.Geophys. Res. Lett., 31(3):L03111.
Sander, R. (2015). Compilation of Henry law constants (version 4.0) for wateras solvent. Atmos. Chem. Phys., 15(8):4399–4981.
Sander, S. P., Friedl, R. R., Golden, D. M., Kurylo, M. J., Moortgat, G. K., Wine,P. H., Ravishankara, a. R., Kolb, C. E., Molina, M. J., Diego, S., Jolla, L.,Huie, R. E., and Orkin, V. L. (2006). Chemical Kinetics and PhotochemicalData for Use in Atmospheric Studies Evaluation Number 15. Cross Sect.,California(15):1–153.
Savarino, J., Bhattacharya, S. K., Morin, S., Baroni, M., and Doussin, J.-F. (2008).The NO+O3 reaction: a triple oxygen isotope perspective on the reactiondynamics and atmospheric implications for the transfer of the ozone isotopeanomaly. J. Chem. Phys., 128(19):194303.
Savarino, J., Lee, C. C. W., and Thiemens, M. H. (2000). Laboratory oxygenisotopic study of sulfur (IV) oxidation: Origin of the mass-independent oxygenisotopic anomaly in atmospheric sulfates and sulfate mineral deposits onEarth. J. Geophys. Res. Atmos., 105(D23):29079–29088.
46

Savarino, J. and Thiemens, M. H. (1999a). Analytical procedure to determineboth delta {18}O and delta{17}O of H2O2 in natural water and first measure-ments. Atmos. Environ., 33(22):3683–3690.
Savarino, J. and Thiemens, M. H. (1999b). Mass-independent oxygen isotope(16O, 17O, 18O) fractionation found in Hx, Ox reactions. J. Phys. Chem. A,103(46):9221–9229.
Schmidt, A., Leadbetter, S., Theys, N., Carboni, E., Witham, C. S., Stevenson,J. A., Birch, C. E., Thordarson, T., Turnock, S., Barsotti, S., Delaney, L.,Feng, W., Grainger, R. G., Hort, M. C., and Höskuldsson, Á. (2015). Satellitedetection, long-range transport, and air quality impacts of volcanic sulfurdioxide from the 2014–2015 flood lava eruption at Bárðarbunga (Iceland). J.Geophys. Res. Atmos., 120(18):9739–9757.
Schmidt, A., Witham, C. S., Theys, N., Richards, N. A. D., Thordarson, T.,Redington, A. L., Johnson, B. T., Hayward, C. L., and Carslaw, K. S. (2014).Assessing hazards to aviation from sulfur dioxide emitted by explosive Ice-landic eruptions. J. Geophys. Res. Atmos. Atmos., 119(24):180–196.
Schumann, U., Weinzierl, B., Reitebuch, O., Schlager, H., Minikin, A., Forster, C.,Baumann, R., Sailer, T., Graf, K., Mannstein, H., Voigt, C., Rahm, S., Simmet,R., Scheibe, M., Lichtenstern, M., Stock, P., R??ba, H., Sc???auble, D.,Tafferner, A., Rautenhaus, M., Gerz, T., Ziereis, H., Krautstrunk, M., Mallaun,C., Gayet, J. F., Lieke, K., Kandler, K., Ebert, M., Weinbruch, S., Stohl, A.,Gasteiger, J., Gro, S., Freudenthaler, V., Wiegner, M., Ansmann, A., Tesche,M., Olafsson, H., and Sturm, K. (2011). Airborne observations of the Eyjafjallavolcano ash cloud over Europe during air space closure in April and May 2010.Atmos. Chem. Phys., 11(5):2245–2279.
Seinfeld, J. H. and Pandis, S. N. (2016). Atmospheric chemistry and physics:from air pollution to climate change. John wiley edition.
Stevenson, D. S., Johnson, C. E., Collins, W. J., and Derwent, R. G. (2003a).The tropospheric sulphur cycle and the role of volcanic SO2. Geol. Soc.London, Spec. Publ., 213(1):295–305.
Stevenson, D. S., Johnson, C. E., Highwood, E. J., Gauci, V., Collins, W. J., andDerwent, R. G. (2003b). Atmospheric impact of the 1783–1784 Laki eruption:Part I Chemistry modelling. Atmos. Chem. Phys. Discuss, 3:551–596.
Stocker, T., Qin, D., Plattner, G.-K., Tignor, M., Allen, S., Boschung, J., Nauels,A., Xia, Y., Bex, V., Midgley, P., and (eds.) (2013). Climate Change 2013: ThePhysical Science Basis. Contribution of Working Group I to the Fifth Assess-ment Report of the Intergovernmental Panel on Climate Change. Number 5th.Cambridge University Press, Cambridge, United Kingdom and New York, NY,USA.
47

Stoffel, M., Khodri, M., Corona, C., Guillet, S., Poulain, V., Bekki, S., Guiot, J.,Luckman, B. H., Oppenheimer, C., Lebas, N., Beniston, M., and Masson-Delmotte, V. (2015). Estimates of volcanic-induced cooling in the NorthernHemisphere over the past 1,500 years. Nat. Geosci., 8(10):784–788.
Stutz, J. (2002). Atmospheric reactive chlorine and bromine at the Great SaltLake, Utah. Geophys. Res. Lett., 29(10):18–21.
Textor, C., Graf, H.-F., Timmreck, C., and Robock, A. (2004). Emissions fromvolcanoes. In Emiss. Atmos. trace Compd., pages 269–303.
Thiemens, M. H. (2006). History and applications of mass-independent isotopeeffects. Annu. Rev. Earth Planet. Sci., 34(1):217–262.
Troy, R. C. and Margerum, D. W. (1991). Non-Metal Redox Kinetics: Hypo-bromite and Hypobromous Acid Reactions with Iodide and with Sulfite andthe Hydrolysis of Bromosulfate. Inorg. Chem., 30(18):3538–3543.
Uemura, R., Barkan, E., Abe, O., and Luz, B. (2010). Triple isotope compositionof oxygen in atmospheric water vapor. Geophys. Res. Lett., 37(4).
Vance, A., McGonigle, A. J., Aiuppa, A., Stith, J. L., Turnbull, K., and Von Glasow,R. (2010). Ozone depletion in tropospheric volcanic plumes. Geophys. Res.Lett., 37(22).
Vicars, W. C. and Savarino, J. (2014). Quantitative constraints on the 17O-excess (δ17O) signature of surface ozone: Ambient measurements from 50◦Nto 50◦S using the nitrite-coated filter technique. Geochim. Cosmochim. Acta,135:270–287.
Vogt, R., Crutzen, P. J., and Sander, R. (1996). A mechanism for halogenrelease from sea-salt aerosol in the remote marine boundary layer.
Voigt, C., Jessberger, P., Jurkat, T., Kaufmann, S., Baumann, R., Schlager, H.,Bobrowski, N., Giuffrida, G., and Salerno, G. (2014). Evolution of CO 2 , SO2 , HCl, and HNO 3 in the volcanic plumes from Etna. Geophys. Res. Lett.,41(6):2196–2203.
von Glasow, R. (2010). Atmospheric chemistry in volcanic plumes. Proc. Natl.Acad. Sci., 107(15):6594–6599.
von Glasow, R. and Crutzen, P. J. (2013). Tropospheric Halogen Chemistry.Treatise Geochemistry Second Ed., 5:19–69.
Von Glasow, R., Sander, R., Bott, A., and Crutzen, P. J. (2002a). Modeling halo-gen chemistry in the marine boundary layer 1. Cloud-free MBL. J. Geophys.Res. Atmos., 107(17).
48
Von Glasow, R., Sander, R., Bott, A., and Crutzen, P. J. (2002b). Modelinghalogen chemistry in the marine boundary layer 2. Interactions with sulfur andthe cloud-covered MBL. J. Geophys. Res. Atmos., 107(17):1–13.
Wang, Y., Liu, S. C., Wine, P. H., Davis, D. D., Sandholm, S. T., Atlas, E. L.,Avery, M. A., Blake, D. R., Blake, N. J., Brune, W. H., Heikes, B. G., Sachse,G. W., Shetter, R. E., Singh, H. B., Talbot, R. W., and Tan, D. (2001). Factorscontrolling tropospheric O 3 , OH, NO x and SO 2 over the tropical Pacificduring PEM-Tropics B. J. Geophys. Res. Atmos., 106(D23):32733–32747.
Wild, O., Zhu, X., and Prather, M. J. (2000). Fast-J: Accurate simulation ofin- and below-cloud photolysis in tropospheric chemical models. J. Atmos.Chem., 37(3):245–282.
Witt, M. L., Mather, T. A., Pyle, D. M., Aiuppa, A., Bagnato, E., and Tsanev, V. I.(2008). Mercury and halogen emissions from Masaya and telica volcanoes,Nicaragua. J. Geophys. Res. Solid Earth, 113(6):1–15.
Young, E. D., Galy, A., and Nagahara, H. (2002). Kinetic and equilibrium mass-dependant isotope fractionation laws in nature and their geochemical andcosmochemical significance. Geochim. Cosmochim. Acta, 66(6):1095–1104.
Zanchettin, D., Khodri, M., Timmreck, C., Toohey, M., Schmidt, A., Gerber,E. P., Hegerl, G., Robock, A., Pausata, F. S., Ball, W. T., Bauer, S. E., Bekki,S., Dhomse, S. S., Le Grande, A. N., Mann, G. W., Marshall, L., Mills, M.,Marchand, M., Niemeier, U., Poulain, V., Rozanov, E., Rubino, A., Stenke, A.,Tsigaridis, K., and Tummon, F. (2016). The Model Intercomparison Project onthe climatic response to Volcanic forcing (VolMIP): Experimental design andforcing input data for CMIP6. Geosci. Model Dev., 9(8):2701–2719.
Zuev, V. V., Zueva, N. E., Savelieva, E. S., and Gerasimov, V. V. (2015). TheAntarctic ozone depletion caused by Erebus volcano gas emissions. Atmos.Environ., 122:393–399.
49