halloween snapshot! · halloween tricks or treats the changing face of nebraska’s families...
TRANSCRIPT

www.dol.nebraska.gov Nebraska Workforce Trends|October 2010
HALLOWEENTRICKS OR TREATS
The Changing Face of Nebraska’s Families
Highest and LowestPaying Occupations
It’s Huntin’ Season!
Snapshot!Nebraska Union
Membership
Projected Employment within Nebraska’s Industries
Tr endsNEBRASKA WORKFORCE OctOber 2010

www.dol.nebraska.govNebraska Workforce Trends|October 2010
Northeast Region
Feature Story
The May 2008 Wage & Occupation Survey results show that the Northeast Region of Nebraska has an estimated employment of 108,720 and the average
hourly salary for this region is $15.31 and $31,837 is the average annual wage. The Nebraska Statewide average hourly wage of $17.63 is $2.32 more than the Northeast Region. These wages are from our 2008 Occupational Employment Survey* and are updated by Employment Cost Index (EC)I** factors to December, 2009.
Out of 530 reported occupations in this region, Physicians and Surgeons, All Other are the highest paid group with an estimated annual wage of $187,579. The second highest paid occupation is Family and General Practitioners with estimated average wages of $184,830 per year. The third highest estimated wages are Chiropractors with and annual salary of $170,127. Anesthesiologists are the fourth highest paid with an estimated annual salary of $168,859. Rounding out the top five are chief Executives with an average estimated annual salary of $129,291.
Of the 20 highest paying occupations in the Northeast Region, eight are in the healthcare field with an estimated employment of over 800.
The lowest paying occupation is Ushers, Lobby Attendants,
Chuck Adams, Research AnalystHIGHEST
and Ticket Takers with an estimated hourly wage of $7.14 or $14,860 per year.
Dishwashers are the second lowest paid with an estimated hourly salary of $7.25 (minimum wage) and Lifeguards, Ski Patrol, and Other Recreational Protective Service Workers is in third place with an average hourly wage of $7.26 or $15,098 per year. The fourth lowest paying occupation is Waiters and Waitresses with an average hourly salary of $7.36 and the fifth lowest paying occupation is Amusement and Recreation Attendants with an estimated hourly salary of $7.39 or $15,363 per year.
Over half of the lowest paying occupations in the Northeast Region are in Food Preparation and Serving Related Occupations with employment estimated at almost 20,000. Education pays!
Nebraska’s wages are available at: http://neblswages.nwd.ne.gov/ . Wages are available by occupation for Nebraska Statewide, Panhandle, Mid Plains, Central, Northeast, and Southeast Regions, and also for the Omaha, Lincoln and Sioux City Metropolitan Statistical Areas.
* For more on the OES survey please visit: http://www.bls.gov./oes/
**For more on the ECI factors please visit: http://www.bls.gov./ncs/ect/
Northest Region Map
CherryHolt
Custer
Sioux
Lincoln
Sheridan
MorrillGarden
Knox
Keith
Dawes
RockBrown
Gage
Hall
Dundy
Chase
Buffalo
Grant
Clay
Kimball
York
Frontier
Otoe
Dawson
Cedar
PlatteArthur
Burt
Perkins
Cheyenne
Hayes
Blaine Loup
Box Butte
Cass
Boyd
BooneBanner
Polk Butler
Furnas
Hooker
Mills
Antelope
Saline
Valley
Pierce
Logan
Thomas
Woodbury
Lancaster
Dixon
Harlan
Adams
Thayer
Dodge
Phelps
Harrison
Union
Saunders
McPherson
DeuelHoward
Cuming
Seward
Greeley
Fillmore
Hitchcock
Garfield
Franklin
Keya Paha
Webster
Nance
MadisonWheeler
Pottawattamie
Nuckolls
Merrick
Colfax
Gosper
Scotts Bluff
Jefferson
Wayne
Sherman
Red Willow
Kearney
Hamilton
Pawnee Richardson
NemahaJohnson
Thurston
Douglas
Sarpy
Stanton
Dakota
Washington
Paying Occupations and
lowest

www.dol.nebraska.gov Nebraska Workforce Trends| October 2010
$13,000 $14,000 $15,000 $16,000
Ushers, Lobby Attendants,Ticket Takers
Dishwashers
Lifeguards,Ski Patrol,Rec.Protective Service
Waiters and Waitresses
Amusement and Recreation Attendants
Counter Attendant (Food Service)
Other Food Prep. and Serving Workers
Hosts/Hostess-Restaurant,Lounge,Coffee Shop
Bartenders
Food and Beverage Serving Workers
Highest Paying OccupationsNorthest Region
Lowest Paying OccupationsNortheast Region
$20,000 $60,000 $100,000 $140,000 $180,000
Physicians and Surgeons, All Other
Family and General Practitioners
Chiropractors
Anesthesiologists
Chief Executives
General Dentists
Pharmacists
General and Operations Managers
Farm, Ranch, Other Agricultural Managers
Optometrists
L OW
HIGH

www.dol.nebraska.govNebraska Workforce Trends|October 2010
Lenora Castillo, Research Analyst
Feature Story
Nebraska Union MembershipSnapshot!
www.dol.nebraska.gov Nebraska Workforce Trends| October 2010
In 1983, the year when comparable union data for the nation was first available from the Bureau of Labor Statistics, there were 17.7 million union members in
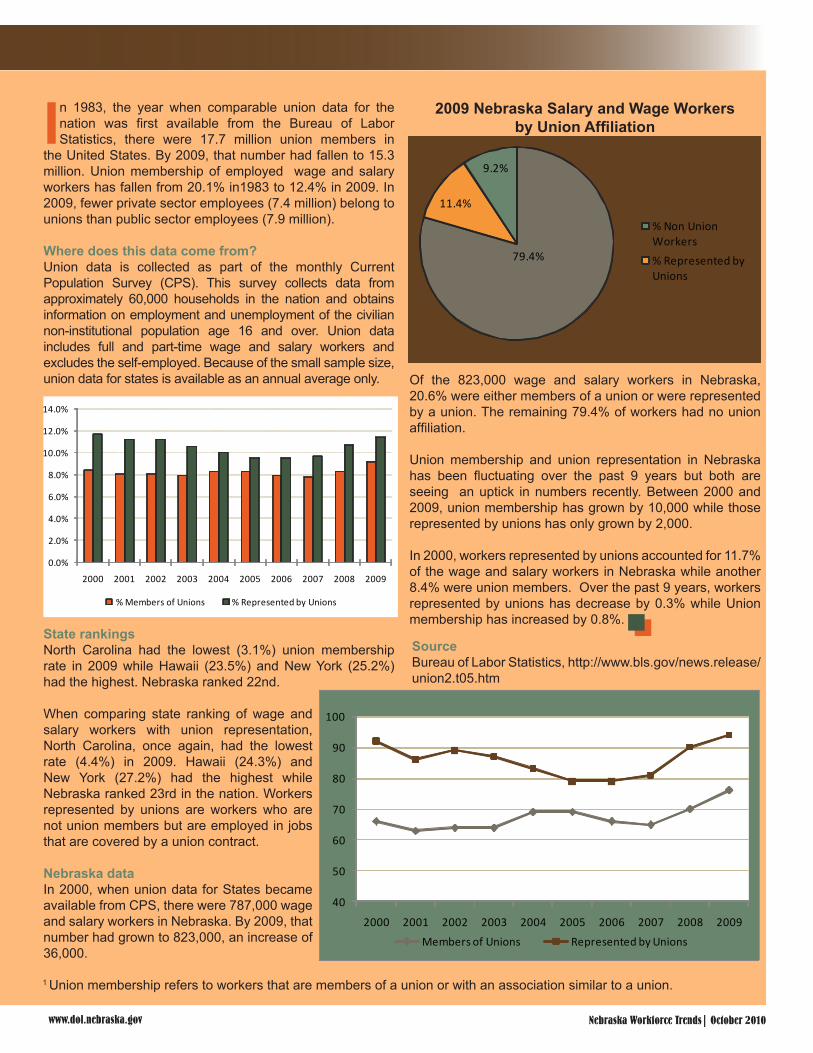
the United States. By 2009, that number had fallen to 15.3 million. Union membership of employed wage and salary workers has fallen from 20.1% in1983 to 12.4% in 2009. In 2009, fewer private sector employees (7.4 million) belong to unions than public sector employees (7.9 million).
Where does this data come from?Union data is collected as part of the monthly Current Population Survey (CPS). This survey collects data from approximately 60,000 households in the nation and obtains information on employment and unemployment of the civilian non-institutional population age 16 and over. Union data includes full and part-time wage and salary workers and excludes the self-employed. Because of the small sample size, union data for states is available as an annual average only.
State rankingsNorth Carolina had the lowest (3.1%) union membership rate in 2009 while Hawaii (23.5%) and New York (25.2%) had the highest. Nebraska ranked 22nd.
When comparing state ranking of wage and salary workers with union representation, North Carolina, once again, had the lowest rate (4.4%) in 2009. Hawaii (24.3%) and New York (27.2%) had the highest while Nebraska ranked 23rd in the nation. Workers represented by unions are workers who are not union members but are employed in jobs that are covered by a union contract.
Nebraska dataIn 2000, when union data for States became available from CPS, there were 787,000 wage and salary workers in Nebraska. By 2009, that number had grown to 823,000, an increase of 36,000.
Of the 823,000 wage and salary workers in Nebraska, 20.6% were either members of a union or were represented by a union. The remaining 79.4% of workers had no union affiliation.
Union membership and union representation in Nebraska has been fluctuating over the past 9 years but both are seeing an uptick in numbers recently. Between 2000 and 2009, union membership has grown by 10,000 while those represented by unions has only grown by 2,000.
In 2000, workers represented by unions accounted for 11.7% of the wage and salary workers in Nebraska while another 8.4% were union members. Over the past 9 years, workers represented by unions has decrease by 0.3% while Union membership has increased by 0.8%.
SourceBureau of Labor Statistics, http://www.bls.gov/news.release/union2.t05.htm
1 Union membership refers to workers that are members of a union or with an association similar to a union.
79.4%
11.4%
9.2%
2009 Nebraska Salary and WageWorkersby Union Affiliation
% Non Union Workers
% Represented by Unions
2009 Nebraska Salary and Wage Workersby Union Affiliation
0.0%
2.0%
4.0%
6.0%
8.0%
10.0%
12.0%
14.0%
2000 2001 2002 2003 2004 2005 2006 2007 2008 2009
% Members of Unions % Represented by Unions
40
50
60
70
80
90
100
2000 2001 2002 2003 2004 2005 2006 2007 2008 2009
Members of Unions Represented by Unions

www.dol.nebraska.govNebraska Workforce Trends|October 2010
Change is and always will be constant. Nebraska is not immune to the fast-paced evolution of American society. Nebraska’s families don’t look the same as
they did even 10 years ago. The transformation of Nebraska families can be seen in their make-up, location, and work.
Age is perhaps the most obvious of changes. Aside from the natural progression of individuals into different brackets through the aging process, age brackets can fluctuate in two different ways. The first is through in-migration and outmigration within the state. Families moving from out-of-state to Nebraska or moving out of Nebraska to another area cause the age range associated with each member of the family to rise or fall accordingly. The second way the age counts change is through natural decrease or, in other words, death.
Nebraska’s age groupings show interesting results. The Baby Boomer generation, defined as those born between 1946 and 1964, is well represented in Nebraska as one can see the generation progress through the three population measures noted in the Nebraska Population by Age Group
Jacob Liudahl, Research Analyst
Feature Story
Nebraska Population by Age Group
1990 Census 2000 Census 2008 ACS Total 1,578,385 1,711,263 1,770,896Under 5 years 119,606 117,048 129,7035 to 9 years 126,401 123,445 119,63510 to 14 years 117,383 128,934 118,98315 to 19 years 112,860 134,909 130,40320 to 24 years 108,649 120,331 132,28625 to 29 years 125,218 112,049 120,22030 to 34 years 131,990 111,224 107,62835 to 39 years 123,778 130,027 110,19640 to 44 years 105,034 133,807 119,66345 to 49 years 80,668 122,714 132,28350 to 54 years 68,721 103,040 125,06655 to 59 years 67,281 77,584 107,36360 to 64 years 67,728 63,956 81,33565 to 69 years 64,063 59,391 61,10870 to 74 years 53,580 56,308 52,85575 to 79 years 44,225 47,991 45,94480 to 84 years 31,998 34,552 38,91885 years and over 29,202 33,953 37,307
Source: U.S. Census Bureau, American Community Survey
The FaceofChanging FamiliesNebraska’s

www.dol.nebraska.gov Nebraska Workforce Trends| October 2010
table. The offspring of the Baby Boomers also resulted in a population spike that, in the 2008 American Community Survey, is spread between the 15-19, 20-24, and 25-29 year old age groups. In 2008, the largest age groups in Nebraska were the 20-24 year olds and 45-49 year olds with virtually identical population estimates of 132,286 and 132,283 people, respectively.
The age of Nebraska’s families isn’t the only thing that’s changing. The average family size has declined over the past 30 years. The size of the average Nebraska family has fallen from 3.21 persons per family in 1980 to 3.01 persons per family in 2008. Reduced family size is a common trend nationwide as the average number of persons per family has fallen from 3.27 in 1980 to 3.20 in 2008. Omaha went against the grain with average family size rising from 3.10 persons in 2000 to 3.15 persons in 2008.
The racial make-up of Nebraska’s families has shifted considerably in recent years. In 1990, 93.8% of Nebraska’s inhabitants identified themselves as Caucasian. By 2008, that percentage had fallen to 88.8%. Growth in the minority population came from a number of areas. The African-American population grew 24.3% from 1990 to 2008, from 57,404 to an estimated 71,355 inhabitants. Percentagewise, the Asian and Pacific Islander population grew over five times faster than the African-American populace. Between 1990 and 2008 the Asian and Pacific Islander population grew approximately 137.8%, from 12,422 inhabitants to 29,534. An even larger change happened in the Other race category, which more than tripled in size from 1990 to 2008. One explanation is the Hispanic population’s growth and realignment. While there has been strong documented growth in the Hispanic populace, many might also have self-identified as white in 1990 and changed their association to Other race in 2000 and 2008.
Educational attainment of Nebraska’s population has increased substantially across the board in the past 20 years. The percentage of high school grads has increased from 81.8% in 1990 to 89.8% in 2008. At the same time, the proportion of Nebraskans with a Bachelor’s degree or
higher has gone from 18.9% in 1990 to 27.3% in 2008, a 44.4% increase. While Nebraska used to lag behind the rest of the nation, this number of people with Bachelor’s degrees or higher now matches the national average, while the high school graduation rate exceeds it.
Family homes are often considered an investment as well as a place to live. Not surprisingly, the median home value in Nebraska, adjusted for inflation, has gone up nearly every decade since it has been recorded. That’s not to say it is more expensive to live in Nebraska compared to other states. In 2000, the median home value in Nebraska was $88,000. By contrast, the national average home value at the same time was $119,600. Lower home prices generally reflect Nebraska’s overall low cost of living.
In Nebraska, as is the case nationwide, there is a trend toward urbanization. Between 1990 and 2000 the percentage of people in Nebraska living in urban areas increased from 67.2% to 69.8%. This number largely reflects in-migration growth of the Omaha and Lincoln Metropolitan areas. Historically, in times of economic recession, urban growth is accelerated as people move from smaller towns to cities with higher numbers of employment opportunities.
Much has changed for workers over the course of the past 15 years. From 1994 to 2009, Nebraska employment grew 16.1%, from 778,700 jobs to 904,440. In 1994, the median pay in Nebraska for all workers was $8.38 per hour, not adjusted for inflation. In 2009, that wage had jumped to $14.30 per hour. The story is the same for the average wage. The average wage of $10.76 in 1994 climbed to $17.75 in 2009.
A position as a retail salesperson was the most common job title in 1994. The job earned an average wage of $7.08 per hour and employed an estimated 27,990 people. In 2009, a retail salesperson made an average of $10.85 per hour. In the 15 year span, employment in this occupation only increased 6.1% to 29,710 workers. In 1994, registered nurses were the highest-earning occupation of the top 10 most common jobs. In contrast to salespeople, the number of registered nurses has increased 40.3% in the same time frame, from 13,490 to 18,930 nurses. The wages for the nurses has also seen better increases than the retail salespeople. The average nurse today makes $26.45 per hour as opposed to $15.64 an hour in 1994. This 69% raise for RNs over that time period is slightly more than the average increase in overall wages for all workers.
It’s clear that Nebraska’s families have changed significantly in the past few decades. From age to race to how much we get paid, not much has remained the same even over a short time span. Whether it’s good or bad, change is here to stay.
Average Family Size
Source: U.S. Census Bureau, American Community Survey
National Nebraska Lincoln Omaha1980 3.27 3.21 *** ***1990 3.16 3.11 3.02 3.112000 3.14 3.06 2.99 3.102008 3.20 3.01 2.99 3.15

www.dol.nebraska.govNebraska Workforce Trends|October 2010
Map Facts
Aaron Ziska, Research Analyst
It’s Huntin’ Season!

www.dol.nebraska.gov Nebraska Workforce Trends|October 2010
Nebraska Firearm Units2010 Permit Figures
This month is a one-stop-shop map for the avid hunters and possibly the anglers of the state. A lot of things go into the preparation for a long hunting season or big fishing trip.
This map represents the establishments that a hunter might visit whilst pursuing the trophy buck throughout the state. The dots represent establishments that would include hunting lodges, butchering plants, and sports gear retail stores, but this doesn’t necessarily capture all of them. Many hunters might stay at a hotel during the hunt, visit a general merchandise store to grab their camouflage garb, or even visit grandma’s house to have the deer dressed. So, don’t be surprised if the place you and your hunting party picked last year to camp out isn’t mapped; it might just be counted as something else.
Also of note on the map, Nebraska is not split along the county boundaries or economic research areas commonly published with the Nebraska Department of Labor’s data. Instead the map is drawn with the Nebraska Game and Parks rifle hunting regions and their respective total deer permits, not including a few exceptions that would be considered “unlimited” permit types. This co-operative map is made possible due to the generous Nebraska Game and Parks Commission at http://outdoornebraska.ne.gov
Plains 1,500
Platte2,800
Sandhills 2,400
Elkhorn 3,600
Buffalo3,450
Wahoo 4,500
Frenchman3,700 Republican
3,100
Missouri 3,200
Upper Platte 1,200 Loup East
2,400
Pine Ridge 3,000
Calamus West 1,800
Keya Paha 2,300
Loup West 1,700
Blue Southeast 3,900
Blue Northwest2,700
Calamus East 1,300
BusinessesHunting Lodges
Sporting Goods Stores Meat Processing Facilities

www.dol.nebraska.govNebraska Workforce Trends|October 2010
Fast Facts
Jacob Liudahl, Statistical analyst
HalloweenT
OR
TREATS
IR CKS

www.dol.nebraska.gov Nebraska Workforce Trends| October 2010
Halloween began as a Celtic ritual thousands of years ago. In the United States, around 56,000 people identify as having Celtic ancestry.
There are about 40.2 million children in the United States aged 5-14 years old, the typical age of trick-or-treaters. In Nebraska, there are approximately 238,618 children 5-14 years old. Of course, others younger than 5 and older than 14 also participate in trick-or-treating.
Trick-or-treaters need stops to fill up their candy bags. There were 111.3 million occupied housing units across the nation in 2009 for them to visit.
There were five confectionary candy-making employers in Nebraska in 2009, making both chocolate and non-chocolate treats.
In 2008, there were 1,814 costume rental and formal wear establishments across the nation. This is 197 less establishments than the previous year or a 9.8% drop.
Looking for a horror movie to frighten the family? There are 12,451 video stores in the US to buy or rent your favorite scary movie.
If you’re into blood but not the gore, consider donating blood to a local area blood bank. Type O negative is the most transferable blood type for donation since persons of any blood type can receive it.
A Gallup Poll conducted in 2005 found that 37 percent of Americans believe that houses can be haunted.
Find some bones in the yard but realize that Fido buried them there? In 2009 there were 45 specialty pet supply stores in Nebraska, employing 581 people who could help you find a different toy.

www.dol.nebraska.govNebraska Workforce Trends|October 2010
Flash Forward
When the industry and occupational projections are combined, a different perspective on the data emerges that gives more detail and reveals interesting trends.
Occupations can vary widely from industry to industry. For example a Chemist can be working in the Professional, Scientific, and Technical Services industry doing research into new medications, working in construction developing stronger building materials, or working for a Manufacturing Company creating new candy flavors. All of these jobs involve conducting chemical analyses or experiments but for different end product results with very different applications.
The BreakdownWhen examining occupational projections, Office and Administrative Support occupations make up 16.1% of all occupations and is the largest occupational group. Not surprisingly this is the biggest occupational group in five of the eleven industry super-sectors: Information, Financial Activities, Professional and Business Services, Other Services, and Government. However, the top occupation from
Flash ForwardProjected Employment within Nebraska’s Industries
Industry Sector Largest Occupational Group
% of Industry
Jobs Largest Occupation
% of Industry
JobsNatural Resources & Mining Farming, Fishing, & Forestry 60.0% Farmworkers & Laborers, Crop, Nursery, & Greenhouse 44.7%Construction Construction & Extraction 67.5% Carpenters 11.5%Manufacturing Production 62.9% Meat, Poultry, & Fish Cutters & Trimmers 9.2%Trade, Transportation, & Utilities Sales & Related 33.0% Retail Salespersons 13.2%Information Office & Administrative Support 28.2% Customer Service Representatives 8.4%Financial Activities Office & Administrative Support 47.9% Customer Service Representatives 9.0%Professional & Business Services Office & Administrative Support 30.4% Janitors & Cleaners, Except Maids & Housekeeping Cleaners 6.4%Education & Health Services Education, Training, & Library 27.3% Registered Nurses 8.5%Leisure & Hospitality Food Preparation & Serving Related 71.8% Combined Food Preparation & Serving Workers, Including Fast Food 19.8%Other Services Office & Administrative Support 17.2% Hairdressers, Hairstylists, & Cosmetologists 6.4%Government Office & Administrative Support 20.8% Police & Sheriff's Patrol Officers ***
this occupational group varies by industry. Customer Service Representatives is the top occupation in two industries; Information employing 1,576 in 2008, and Financial Activities 6,252. It is the top occupation from this industry for Professional and Business Services employing 5,470. In the other Services industry the top occupation from this category is Secretaries employing 1,461 and for Government the top occupation was Postal Service Mail Carriers employing 2,440.
Job GainsHeavy and Tractor Trailer Truck Drivers is projected to have the largest employment increase from 2008-2018 and add 6,636 jobs. Of these, 6,069 are expected to be in the Trade, Transportation, and Utilities Industry, accounting for 92% of the occupations increase. Registered Nurses are also expected to experience large gains in employment by 2018 and most of the gain of 5,103 is to be within the Education and Health Services Industry adding 4,655 accounting for 91% of the growth within this occupation. The third fastest growing occupation is Customer Services Representatives adding 3,987 jobs by 2018. Most of the employment for this
Jodie Meyer, Research Analyst
Industry Sectors with Largest Occupational Group and Occupation

www.dol.nebraska.gov Nebraska Workforce Trends| October 2010
Industry Sector Occupation2008
Estimated2018
ProjectedNumeric Change
% Change
Natural Resources & MiningMixing & Blending Machine Setters, Operators, & Tenders *** *** *** 29.3%
Construction Carpenters 5,662 6,560 898 15.9%Manufacturing Meat, Poultry, & Fish Cutters & Trimmers 9,283 10,380 1,097 11.8%Trade, Transportation, & Utilities Truck Drivers, Heavy & Tractor-Trailer 24,760 30,856 6,096 24.6%Information Customer Service Representatives 1,576 1,797 221 14.0%Financial Activities Tellers 5,218 6,376 1,158 22.2%Professional & Business Services Customer Service Representatives 5,470 7,213 1,743 31.9%Education & Health Services Registered Nurses 18,573 23,228 4,655 25.1%
Leisure & HospitalityCombined Food Preparation & Serving Workers, Including Fast Food
16,335 19,228 2,893 17.7%
Other Services Hairdressers, Hairstylists, & Cosmetologists 2,291 2,806 515 22.5%Government Compliance Officers, Except Agriculture,
Construction, Health & Safety, & Transportation1,330 1,727 397 29.9%
Natural Resources & Mining Farmworkers & Laborers-Crop, Nursery, Greenhouse 27,042 23,031 -4,011 -14.8%Construction Helpers--Roofers 142 132 -10 -7.0%
ManufacturingCutting, Punching, & Press Machine Setters, Operators, & Tenders, Metal & Plastic
1,538 1,344 -194 -12.6%
Trade, Transportation, & Utilities Conveyor Operators & Tenders 937 828 -109 -11.6%Information Order Clerks 378 229 -149 -39.4%Financial Activities Computer Operators 334 242 -92 -27.5%Professional & Business Services Telemarketers 4,076 3,585 -491 -12.1%Education & Health Services Maids & Housekeeping Cleaners 2,116 1,963 -153 -7.2%Leisure & Hospitality Order Clerks *** *** *** -32.1%Other Services Secretaries, Except Legal, Medical, & Executive 1,461 1,400 -61 -4.2%Government Postal Service Mail Sorters, Processors, & Processing
Machine Operators1,288 997 -291 -22.6%
Gro
win
gD
eclin
ing
occupation is expected to be in Professional and business Services accounting for 44% growth and adding 1,743 jobs. Jobs within the Financial Activities industry are also contributing quite a bit to this occupations growth adding 1,016 and accounting for 25% of growth.
Job LossesCrop, Nursery, Greenhouse Farmworkers and Laborers are expected to see the largest numeric decline of any occupation losing 4,012 jobs by 2018. The majority of this job loss is expected to be within the Natural Resources and Mining Industry with a loss of 4,011 jobs. Much of the decline in Agriculture can be attributed to advancements in technology reducing the need for workers.
The occupation of Order Clerks is expected to be the largest declining occupation for two industries, Information and Leisure and Hospitality. For the Information industry this occupation is expected to decline by 149 jobs and for the Leisure and Hospitality Industry it is expected to decline by 32.1%. Much of the decline in this industry is expected as the job duties of these workers are increasingly automated eliminating the need for these positions. Telemarketers are also expected to decline by 2018 with an expected loss of 715 jobs. Much of this loss is expected to be in the Professional and Business Services industry where 419 jobs are expected to be lost. Some of this loss is contributed to organizations devoting few resources to telemarketing.
Top Loss and Gain?Sometimes an occupational group will be increasing the most
in one industry, but declining the most in another. For example, Office and Administrative Support Occupations are expected to add the most occupations to the Financial Activities (3,409) and Professional and Business Services Industries (5,032). This same occupational group is expected to lose 292 jobs in the Manufacturing Industry. The same case is true with Production Occupations increasing in Manufacturing by 2,131 and declining slightly in the Leisure and Hospitality industry.
Sometimes the same occupational group produces the top declining and increasing occupation within an industry. Taking a look at the Financial Activities industry reveals that an occupation from the Office and Administrative Support occupational group is both the top declining and increasing occupation. Computer Operators are expected to lose 92 jobs in this industry but Tellers are expected to gain 1,158 by 2018. The Information industry also has the top declining and increasing job in the Office and Administrative Support Occupational group. Customer Service Representatives are expected to add 221 jobs where Order Clerks are expected to lose 149. In the Manufacturing industry the Production occupation of Meat, Poultry, and Fish Cutters and Trimmers is expected to increase by 1,097 and another Production occupation, Cutting, Punching, and Press Machine Setters, Operators, and Tenders, is expected to lose 194 jobs.
A publication with more detail on both occupational and industry projections will be published online at www.NebraskaWorkforce.com later this year. Look for additional articles spotlighting projections in upcoming issues of Nebraska Workforce Trends.
Occupations with the Greatest Numeric Change in Employment2008-2018 by Industry

www.dol.nebraska.govNebraska Workforce Trends|October 2010
College Placement
There were 239 Western Nebraska Community College graduates between July 1, 2007 and June 30, 2008. Of these graduates, 132 (55%)
were working in Nebraska in the first quarter of 2009. There were 13 more graduates than in the previous year but an eight percent decrease in the percentage of graduates working in the state. Nearly two-thirds (65%) of the graduates were female, with 65% of the female graduates working in the state while 37% of males were employed in Nebraska.
There was at least one graduate employed in 13 of the state’s 93 counties. Scotts Bluff, Box Butte and Cheyenne Counties had the highest numbers of graduates working.
There were 50 Western Nebraska Community College graduates in 10 degree/fields of study that had more
Western nebraska Community College
Mary Findlay, Research Analyst
than 80% of graduates working in the state. Within this group, 22 of the 25 Licensed Practical Nursing 1 – 2 year award graduates were working in Nebraska and had the highest estimated average annual earnings of $30,779.
Data for many fields of study is not publishable due to the small number of graduates in many programs. The highest estimated wages were earned by the 14 Associate Degree Licensed Practical Nursing graduates working in the state with $49,512. Seventy-eight percent of these graduates were employed in Nebraska. The second highest estimated wages ($37,881) were earned by the 4 Lineworker 1 – 2 year award graduates.
The 4 graduates employed in the Utilities industry had the highest estimated average annual earnings of $38,184. The highest industry employment was in the Health Care industry with 42 graduates working in the state. The estimated average annual earnings for graduates employed in the Health Care industry were $36,102.
For more outcomes information on Western Nebraska Community College, Central Community College, Metropolitan Community College, Mid-Plains Community College, Northeast Community College, Southeast Community College, Chadron State College, Peru State College, Wayne State College and the University of Nebraska – Kearney, contact the Nebraska Department of Labor Office of Labor Market Information.
Employment Outcomes
Western Nebraska Community College
Cherry0 Holt
0
Custer0
Sioux0
Lincoln0
Sheridan0
Morrill4 Garden
0
Knox0
Keith0
Dawes3
Rock0
Brown0
Gage0
Hall1
Dundy0
Chase1
Buffalo1
Grant0
Clay0
Kimball3
York0
Frontier0
Otoe0
Dawson0
Cedar0
Platte0
Arthur0
Burt0
Perkins1
Cheyenne11
Hayes0
Blaine0
Loup0
Box Butte11
Cass0
Boyd0
Boone0Banner
0
Polk0
Butler0
Furnas0
Hooker0
Antelope0
Saline0
Valley0
Pierce0
Logan0
Thomas0
Lancaster3
Dixon0
Harlan0
Adams0
Thayer0
Dodge0
Phelps0
Saunders0
McPherson0
Deuel1
Howard0
Cuming0
Seward0
Greeley0
Fillmore0
Hitchcock1
Garfield0
Franklin0
Keya Paha0
Webster0
Nance0
Madison0
Wheeler0
Nuckolls0
Colfax0
Gosper0
Scotts Bluff50
Jefferson0
Wayne0
Sherman0
Red Willow0
Kearney0
Hamilton0
Stanton0
Pawnee0
Richardson0
Nemaha0
Johnson0
Douglas0
Merrick0
Thurston0
Sarpy0
Dakota0
Washington0
Western Nebraska Community College
Placement by County0
1
2 - 10
11 - 50
www.dol.nebraska.gov Nebraska Workforce Trends|October 2010
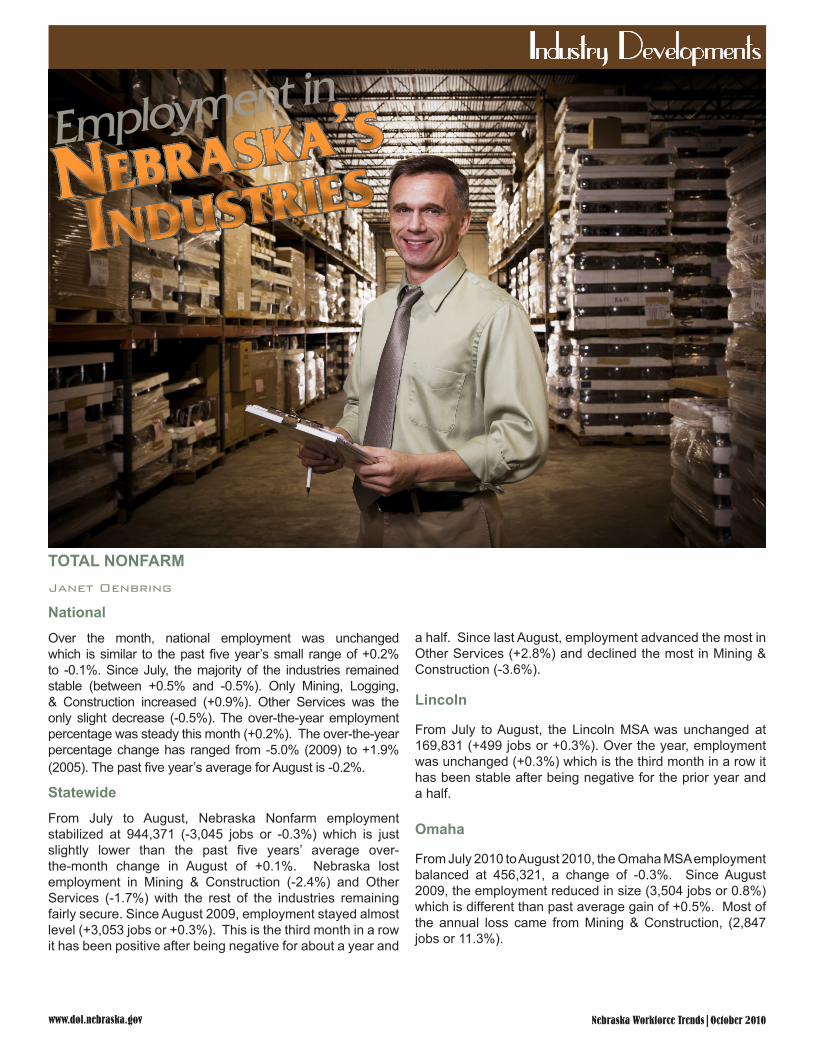
TOTAL NONFARMJanet Oenbring
National Over the month, national employment was unchanged which is similar to the past five year’s small range of +0.2% to -0.1%. Since July, the majority of the industries remained stable (between +0.5% and -0.5%). Only Mining, Logging, & Construction increased (+0.9%). Other Services was the only slight decrease (-0.5%). The over-the-year employment percentage was steady this month (+0.2%). The over-the-year percentage change has ranged from -5.0% (2009) to +1.9% (2005). The past five year’s average for August is -0.2%.
Statewide From July to August, Nebraska Nonfarm employment stabilized at 944,371 (-3,045 jobs or -0.3%) which is just slightly lower than the past five years’ average over-the-month change in August of +0.1%. Nebraska lost employment in Mining & Construction (-2.4%) and Other Services (-1.7%) with the rest of the industries remaining fairly secure. Since August 2009, employment stayed almost level (+3,053 jobs or +0.3%). This is the third month in a row it has been positive after being negative for about a year and
a half. Since last August, employment advanced the most in Other Services (+2.8%) and declined the most in Mining & Construction (-3.6%).
Lincoln
From July to August, the Lincoln MSA was unchanged at 169,831 (+499 jobs or +0.3%). Over the year, employment was unchanged (+0.3%) which is the third month in a row it has been stable after being negative for the prior year and a half.
Omaha
From July 2010 to August 2010, the Omaha MSA employment balanced at 456,321, a change of -0.3%. Since August 2009, the employment reduced in size (3,504 jobs or 0.8%) which is different than past average gain of +0.5%. Most of the annual loss came from Mining & Construction, (2,847 jobs or 11.3%).
Industry Developments
Nebraska’s
INdustrIesEmployment in

www.dol.nebraska.govNebraska Workforce Trends|October 2010
level in ten years. Nationally, Motor Vehicle & Parts Dealers are at their second lowest job level in ten years.
TRANSPORTATION, WAREHOUSE, AND UTILITIESDave Bauer
Transportation & Warehousing showed fractional over the month job losses, statewide and nationally. Since a year ago, statewide Transportation & Warehousing lost 2.0% of its employment while the nation lost 0.3%. Statewide Truck Transportation showed a modest 0.9% employment gain since July; nationally it was 0.4%. Statewide Specialized Freight Trucking employment is down slightly over the month; but for the year, remains at a ten year high, up 4.6% since a year ago.
INFORMATIONMary Dezort
Statewide, the Information sector is unchanged, over the month. There is an over-the-year decrease of 3.4%. This industry is tracking national figures, which declines both over the month, and over the year. The Lincoln and Omaha MSA are also unchanged for the month; both are down from this time last year.
MINING, LOGGING, AND CONSTRUCTIONDave Bauer
Statewide Construction of Buildings and Specialty Trade Contractors are at their lowest job levels since at least 2003. Only statewide Heavy & Civil Engineering Construction managed any sort of job gain since July, and since 2009. Nationwide, all three construction industries posted job gains since July and sporadic variability of highs and lows since 2000. Nationwide Construction of Buildings is down 5.7%, and Specialty Trade Contractors is down 4.8% since a year ago. Omaha’s Construction of Buildings industry is at its lowest job level since at least 2001 and its Specialty Trade Contractors are at their lowest job level since 2002.
MANUFACTURING Janet Oenbring Nationally, Manufacturing experienced its highest over-the-month growth (+1.0%) in the past decade from May to June; however, it has remained flat since. Over the month, Statewide Manufacturing employment remained stable from July to August (+0.3%). After almost two years of decreases, over-the-year employment finally increased slightly (+0.6% or +510 jobs). In the Lincoln MSA, the Manufacturing monthly employment has held steady for the past six months. Since August 2009, employment in Manufacturing shrank by 229 jobs (-1.8%). Over the past six months, Manufacturing employment has been stable, (+0.4% to -0.2%), in the Omaha MSA. Year-to-year employment was unchanged (+0.1), which is below its past five year’s average of +0.6%.
TRADE
Dave Bauer
Statewide Durable Wholesale Trade industry employment is at its lowest level since 2001; Non-Durable Wholesale Trade is at its lowest job level since 2007. Both have dropped employment since a month and year ago. Nationwide, both Durable and Non-Durable Wholesale Trade industries employment are at their lowest employment levels since at least 2000. Since a year ago, Wholesale Trade job numbers are down 4.0% in the Omaha MSA and 2.2% in the Lincoln MSA. Retail Clothing & Clothing Accessories Stores were the largest statewide job gainer since July (2.2%) and the largest job loser since 2009 (-5.4%). Nationally, Retail Clothing & Clothing Accessories Stores gained employment at the rate of 2.6% since last August, making them the largest over the year retail job gainer. Since July statewide Non-Store Retailers lost jobs at a 3.3% rate, but the industry grew by 0.8% nationally. Regardless of meager July job gains of 1.0%, statewide Motor Vehicle and Parts Dealers job numbers are down 2.3% since last year; their lowest August

www.dol.nebraska.gov Nebraska Workforce Trends| October 2010
Aug-10 Jul-10 Aug-09Numeric Change
Percent Change
Numeric Change
Percent Change
Total Nonfarm 944,371 947,416 941,318 -3,045 -0.32% 3,053 0.32%Mining, Logging & Construction 49,085 50,312 50,904 -1,227 -2.44% -1,819 -3.57%
Construction 48,454 49,445 49,942 -991 -2.00% -1,488 -2.98%Heavy and Civil Engineering Construction 9,236 9,194 8,920 42 0.46% 316 3.54%Specialty Trade Contractors 29,510 30,494 31,308 -984 -3.23% -1,798 -5.74%
Manufacturing 92,543 92,293 92,033 250 0.27% 510 0.55%Durable Goods 42,556 42,566 41,660 -10 -0.02% 896 2.15%Non-Durable Goods 49,987 49,727 50,373 260 0.52% -386 -0.77%
Trade, Transportation, & Utilities 194,892 195,184 196,363 -292 -0.15% -1,471 -0.75%Wholesale Trade 39,528 39,653 40,927 -125 -0.32% -1,399 -3.42%Retail Trade 104,960 104,939 103,968 21 0.02% 992 0.95%Transportation, Warehousing, and Utilities 50,404 50,592 51,468 -188 -0.37% -1,064 -2.07%
Information 16,864 16,925 17,462 -61 -0.36% -598 -3.42%Financial Activities 68,412 68,510 67,999 -98 -0.14% 413 0.61%
Finance and Insurance 59,488 59,588 58,839 -100 -0.17% 649 1.10%Real Estate and Rental and Leasing 8,924 8,922 9,160 2 0.02% -236 -2.58%
Professional & Business Services 102,373 102,666 100,572 -293 -0.29% 1,801 1.79%Professional, Scientific, and Technical Services 41,095 41,398 41,575 -303 -0.73% -480 -1.15%Management of Companies and Enterprises 16,680 16,722 17,021 -42 -0.25% -341 -2.00%Admin & Support & Waste Mngmt & Remdtn Srvcs 44,598 44,546 41,976 52 0.12% 2,622 6.25%
Education & Health Services 135,733 136,427 132,981 -694 -0.51% 2,752 2.07%Educational Services 16,768 16,711 16,400 57 0.34% 368 2.24%Health Care and Social Assistance 118,965 119,716 116,581 -751 -0.63% 2,384 2.04%
Leisure and Hospitality 86,223 85,765 84,971 458 0.53% 1,252 1.47%Arts, Entertainment, and Recreation 15,085 15,061 14,736 24 0.16% 349 2.37%Accommodation and Food Services 71,138 70,704 70,235 434 0.61% 903 1.29%
Other Services 36,719 37,343 35,723 -624 -1.67% 996 2.79%Repair and Maintenance 9,421 9,682 9,111 -261 -2.70% 310 3.40%Personal and Laundry Services 8,267 8,206 7,972 61 0.74% 295 3.70%Religious, Grantmaking, Civic, Profssnl, & Sim Orgs 19,031 19,455 18,640 -424 -2.18% 391 2.10%
Government 161,527 161,991 162,310 -464 -0.29% -783 -0.48%Federal Government 17,000 17,805 16,553 -805 -4.52% 447 2.70%State Government 39,133 38,600 39,149 533 1.38% -16 -0.04%Local Government 105,394 105,586 106,608 -192 -0.18% -1,214 -1.14%
Over the Month Over the YearNumber of Workers
FINANCIAL ACTIVITIES Nancy Ritchie
Financial Activities employment remained stable in August with total employment of 68,412. Finance and Insurance held steady with employment of 59,488. The Real Estate and Rental and Leasing sector remained solid with employment at 8,924. The Financial Activities sector has improved slightly since August 2009 (0.6%). Financial Activities was constant
over the month in the Lincoln MSA with total employment of 13,261. The Omaha MSA was nearly unchanged in August with employment of 39,249. Over the year, the Lincoln MSA grew by 179 jobs (1.4%). The Omaha MSA fell by 530 jobs (1.3%) since August 2009. The Nebraska employment trends in the Financial Activities sector are currently following very closely with the national numbers holding steady in both areas. Over the year, the national figures showed a 1.5% decrease while Nebraska’s numbers posted a slight growth of 0.6%.

www.dol.nebraska.govNebraska Workforce Trends|October 2010
PROFESSIONAL AND BUSINESS SERVICESJanet Oenbring Nationally, since last month Professional & Business Services remained fixed (+0.4%) which is just a smidge above its past five year’s average of 0.3% in August. Over the month, the Statewide employment remained stable (-0.3%) after posting several months of positive growth. The over-the-year employment growth of 1.8% is over half of its historical average of +2.9%. The over-the-year percentage growth has occurred the past two months which is different from the previous year and a half decline. In the Lincoln MSA, this industry remained stable in August (-0.3%) but it is opposite its historical +0.3% average. Since August 2009, this industry remained stable (+0.4%) which is significantly different than its historical average of +3.1%. The past three months have at least been positive after over a year and a half of declines. Since July, employment in the Omaha MSA remained unchanged which is similar to the historical average of +0.1%. Over the year, Professional & Business Services remained fairly stable at +0.4%, but much lower than the historical average of +2.3%.
EDUCATION AND HEALTH SERVICES Nancy Ritchie
Statewide, Educational & Health Services dropped slightly in August with total employment of 135,733. Over the year, this industry experienced a healthy expansion of 2,752 jobs (2.1%). Statewide, Educational Services employment was unaffected in August with 16,768 jobs. Over the year, 368 jobs were added (2.2%). Health Care & Social Assistance contracted slightly with employment of 118,965 in August (0.6%). Education & Health Services in the Lincoln MSA
stayed even with employment of 24,940. Over the year, the Lincoln MSA expanded by 880 jobs (3.7%). The Omaha MSA was unchanged with 69,123 total jobs. There has been an increase of 2,384 jobs (2.0%) since last August. Since August of last year, employment progressed slightly by 423 jobs (0.6%). Both Nebraska (-0.5%) and the nation (+0.2%) showed small changes over the month; over the year, the national employment level and Nebraska employment rose the same amount (+2.1%).
LEISURE AND HOSPITALITY
Mary Dezort
Statewide, Arts, Entertainment, & Recreation employment was unchanged in August; this stagnation is a common, seasonal occurrence for the month. Employment is higher than the previous year by 2.4%. Statewide, Accommodation & Food Services employment increased. This employment increase can be attributed primarily to the Food Services & Drinking Places industries. Both the Full Service Restaurants and Limited Service Eating Places added over 100 jobs. A comparison of the data to last year’s figures indicates both Full Service Restaurants and Catering Services are the major contributors to the higher than last year’s employment levels.
Leisure & Hospitality in the Lincoln MSA increased over the month. The positive over the month change of employment for the MSA brings the area to a percentage increase of 1.5% over the year. Leisure & Hospitality in the Omaha MSA also increased over the month, adding 633 jobs. The over the year increase of 2.6% can be attributed to the Food Service & Drinking Places industry. The Accommodations industry declined both over the month and over the year for this MSA.
OTHER SERVICES
Mary Dezort
Statewide, Other Services employment declined in August. There is a loss of 424 jobs within the Religious, Grantmaking, Civic, Professional, & Similar Organizations. Additional losses can be seen under the Repair & Maintenance industry this industry dropping by 261 jobs. Over the year positive growth occurred adding 2.8% to last year’s Other Services numbers.
The Lincoln MSA is unchanged over the month, while the Omaha MSA decreased by 1.5% for a loss of 265 jobs. Both MSA’s are higher than this time last year, adding 200+ jobs. This over-the-year increase is tracking opposite of national, non-seasonally adjusted data.

www.dol.nebraska.gov Nebraska Workforce Trends|October 2010
Labor Force/Work Force
StatewideStatewide, Non-farm employment estimates were 944,371 in August 2010; 3,045 less jobs than last month and 3,053 more than in August 2009.Manufacturing industries employed 92,543 workers; 250 more people than last month and 510 more than in August 2009. Statewide, Average weekly hours worked in manufacturing industries were 40.7, an increase of 0.4 hours since July, and an increase of 0.4 hours since August 2009. Average weekly earnings increased by $10.52 since July to $659.75, and have risen by $2.86 since August 2009. Average hourly earnings in manufacturing industries of $16.21 were $0.10 higher than in July and $0.09 less than in August 2009.Omaha MSANon-farm employment estimates were 457,114 July 2010; 4,315 less jobs than last month and 3,250 less than in July 2009.Lincoln MSANon-farm employment estimates were 169,831 August 2010; 499 more jobs than last month and 496 more than in August 2009.
August 2010 County Rates
Labor Force Employment by Place of Residence:Nebraska (smoothed seasonally adjusted): •August unemployment rate: 4.6%•Change (OTM): -0.1%•Change (OTY): -0.2%
Economic Regions (not seasonally adjusted):•Central: 3.5% •Panhandle: 4.4% •Mid Plains: 3.7% •Southeast: 4.8%•Northeast: 4.3%
Revisions to July Data:•Unemployment rate: unchanged at 4.7%•Labor Force: 152•Unemployment: 124•Employment: 28
Unemployment Rate InfoRmatIon foR aUgUst 2010
Office of Labor Market Information
Cherry2.4 Holt
2.9
Custer3.2
Sioux3.7
Lincoln3.7
Sheridan3.1
Morrill3.8 Garden
4.6
Knox3.7
Keith3.5
Dawes4.0
Rock2.9
Brown2.7
Gage6.3
Hall4.0
Dundy3.1
Chase2.7
Buffalo3.1
Grant3.8
Clay4.3
Kimball4.5
York5.0
Frontier3.1
Otoe4.2
Dawson4.9
Cedar3.1
Platte3.7
Arthur3.9
Burt5.2
Perkins2.6
Cheyenne3.4
Hayes4.6
Blaine4.5
Loup5.1
Box Butte5.2
Cass4.8
Boone2.8Banner
5.3
Polk3.5
Butler3.5
Furnas2.8
Hooker4.1
Antelope3.0
Saline3.7
Valley3.3
Pierce3.5
Logan6.4
Thomas4.0
Lancaster3.9
Dixon4.8
Harlan2.7
Adams4.0
Thayer3.5
Dodge4.6
Phelps2.8
Saunders4.5
McPherson3.9
Deuel3.2
Howard3.2
Cuming3.4
Seward3.5
Greeley3.3
Fillmore3.5
Hitchcock3.6
Garfield2.5
Franklin3.3
Keya Paha3.5
Webster3.6
Nance3.5
Madison3.8
Wheeler4.4
Nuckolls3.9
Colfax3.5
Gosper2.9
Scotts Bluff4.7
Jefferson4.3
Wayne3.8
Sherman3.0
Red Willow3.6
Kearney3.2
Hamilton3.0
Pawnee3.6
Richardson5.9
Johnson3.9
Douglas5.0
Boyd3.1
Merrick4.2
Stanton3.5
Nemaha5.8
Thurston8.4
Sarpy4.4
Dakota9.3
Washington4.7
August 2010 County Rates
County Rates2.4 - 3.2
3.3 - 4.1
4.2 - 5.1
5.2 - 6.4
6.5 - 9.3

www.dol.nebraska.govNebraska Workforce Trends|October 2010
Notes: Unemployment Rates are seasonally adjusted. DXY is the U.S. Dollar compared to a basket of international currencies. Retail Sales figures are in billions of dollars. Median Employment Wages are OES 50th percentile Annual Wage for All Occupations. Crude Oil Price is as of the close of business on the last Thursday of the month. Corn for Grain is based on the price per bushel. Cattle 500+ Lbs is price per cwt. ECI is Employer Cost Index. PPI is Producer Price Index. CPI is Consumer Price Index.
Economic IndicatorsTrevor Nelson, Research Analyst
Sources: tradingeconomics.com, bls.gov, fhfa.gov, usda.gov, revenue.state.ne.us, oil-price.net
Median wages earned is the amount of money made by the individual who splits earners in half; half of the workforce earns more than this person, and half earn less. Median wages earned is an important statistic for a number of reasons. First, since it is a median rather than an average, it represents a wage that is actually being paid, and will not be skewed by large outliers on either side of the earnings. This is important in areas where large wage discrepancies can occur. When tracked over time, median wage can give economists a general idea of the level of demand from consumers, and the value of the labor supply to businesses. This number can be adjusted for inflation, which indicates the change in purchasing power for a representative person over time.
According to Occupational Employment Statistics, the median annual wage earned in the state of Nebraska has increased by almost $6,000 over the past decade. This number is not adjusted for inflation. From 2002 through 2008, the median annual wage earned in the state increased between 2.4% and 2.6%. Around 2008, the rate of increase has dropped significantly, which corresponds to the beginning of the current recession. In 2009 the median annual wage increased by only 1.37%, and is expected to increase by only 0.90% for the year 2010.
Median Wages
Economic Indicators of the Month
$0
$5,000
$10,000
$15,000
$20,000
$25,000
$30,000
$35,000
2001 2002 2003 2004 2005 2006 2007 2008 2009 2010
Median Annual Wage Earned in Nebraska
National Indicators Date ValueGDP Growth 10Q2 1.60%Unemployment Rate Aug-10 9.60%Fed Interest Rate Aug-10 0.25%Current Account Balance 10Q2 -$123 BillionExchange Rate DXY Aug-10 82.92
Nebraska Indicators Date ValueUnemployment Rate Jul-10 4.7House Value Appriciation 09Q4-10Q1 0.31%Average Weekly Manufacturing Hours Aug-10 40.7Net Taxable Retail Sales Jun-10 $2.085 BillionMedian Employment Wages 10Q1 $30,056
Pricing Indicators Date ValueBarrell of Crude Oil Aug-10 $73.22Corn for Grain Aug-10 $3.70Cattle 500+ Lbs Aug-10 $94.70ECI Change 10Q2 0.50%PPI Change Aug-10 0.40%
August 2010Aug-10 Jul-10 Aug-09 Jul-10 Aug-09
U.S. All Items 218.312 218.011 215.834 0.1% 1.1%
Midwest Urban All Items 208.639 208.211 205.632 0.2% 1.5%
Northeast Urban All Items 234.15 233.885 230.883 0.1% 1.4%
South Urban All Items 211.308 210.988 209.000 0.2% 1.1%
West Urban All Items 221.523 221.331 219.884 0.1% 0.7%
Indexes % Change From

www.dol.nebraska.gov Nebraska Workforce Trends|October 2010
Website Spotlight
The LMI website is changing! On October 4, 2010 the Office of Labor market information will release a brand new site with more features and more data than ever before.
As part of the change to a new site, the web address for the Nebraska Department of Labor Office of Labor Market Information will change to http://neworks.nebraska.gov/analyzer. This means that bookmarks to the old site will no longer be available and users will want to navigate to the new site to refresh any bookmarks or favorites previously set.
Web-based Labor Market Resource Trainings will be offered to users who would like a guided demonstration of the features of the new site. Several sessions will be available to users in October and November. Users who are interested in attending a web-based training should email the Office of Labor Market Information at [email protected] for more information.
Employers who have posted jobs with the Nebraska Department of Labor should note that this site will also change on October 4, 2010. Employers can access the new site at http://neworks.nebraska.gov.
UNDER CONSTRUCTION
Labor Market Information
Shannon Philippi Ramaeker, Editor-in-Chief

www.dol.nebraska.govNebraska Workforce Trends|October 2010
Business Openings & Expansions
Lincoln: Anderson Ford is opening a new dealership at 33rd St. and Yankee Hill Rd. HTI Plastics finished its expansion and renovation of its plant at Lincoln’s Air Park industrial park.This expansion added 35K square feet to the building and began in March of 2009. Kiewit opened an office on P St in Lincoln this month. Chocolatier Blue, an organic chocolate store, is opening a location at 70th St and Pioneers Blvd. Dana Point Development Corporation is planning a 15 home development in Waverly. NebraskaLink, LLC has received $11.5 million in ARRA funds to build an optical network covering the state at a total cost of $16.5 million. Trader Joe’s, a specialty grocery chain, will open its first Lincoln location on Pine Lake Road which will employ between 60 and 70 people.
Omaha: Work is being planned on the City of Omaha’s sewer systems which will take years. Millions will be spent so additional hiring is expected as companies gear up to do the work. Anytime Fitness opened in Blair with four employees. Integrity Dental in Elkhorn is a new business and is adding four employees. TeamUSA Mortgage is a new business in Omaha adding six employees. Cox and West have been looking to hire phone reps and technical staff. Physicians Mutual opened an office on Center St. Afternoon, an Omaha based gift shop, is opening a 2,500 square foot store at Midtown Crossing. West Corp is adding another 300 positions after adding 500 jobs in May. The following openings and expansions have been reported by the Omaha Chamber of Commerce: Runza Restaurant, 140 Park Drive, (20). Great Plains Hanger Co, Hanger manufacturer, (20).
Note: The following information is obtained through a monthly survey of Nebraska’s Career Centers. Openings and expansions that were not publicly reported or reported to career center managers are not listed.
Southeast RegionBeatrice: DeWitt received a $1 Million grant from the U.S. Department of Commerce to make infrastructure improvements around the former Vise-Grip manufacturing site.
Nebraska City: A new business in Dunbar, Winnrack, specializes in the reconstruction and fabrication of pallet racking for warehouses and other businesses. The company has five full time employees. Southeast District Health Department has a new facility in Auburn. The new building includes eight offices, kitchen, storage area, immunization clinic and conference room. The new Cedar Creek Steakhouse opened recently.
Northeast RegionNorfolk: The J. Paul and Eleanor McIntosh College of Nursing opened on the Northeast Community College campus.
Mid-Plains RegionNorth Platte: Green Oak Renewables is planning to build a $20 million wind farm southeast of Ogallala.
Lexington: Ivan’s Computer Repair shop opened.
Panhandle RegionScottsbluff: RTS Shearing Company from South Dakota has purchased the former Hergert Milling property in Gering for redevelopment uses.
Sidney: The Studio X Hair and Nail Salon expanded this month.
Trevor Nelson, Research Analyst

www.dol.nebraska.gov Nebraska Workforce Trends|October 2010
Commissioner of Labor Catherine D. Lang
LMI AdministratorPhil Baker
Editor-in-ChiefShannon Philippi Ramaeker
Graphic DesignerKristin Brehmer
Credits & Links
Nebraska Workforce Trends is published by the Nebraska Department of Labor - Labor Market Information Center in cooperation with the U.S. Department of Labor, Bureau of Labor Statistics.
DEPARTMENT OF LABOR
Previous Issues | Email Subscription

www.dol.nebraska.govNebraska Workforce Trends|October 2010
All State Colleges ‘06-’07 Graduates Working in Nebraska in First Quarter 2008
DEPARTMENT OF LABOR