half year results 2019 presentation to investors & …/media/flughafenzh/dokumente/das... · 1...
TRANSCRIPT

© Flughafen Zürich AG1 | August 27, 2019
HALF YEAR RESULTS 2019
PRESENTATION TO INVESTORS & ANALYSTS
Stephan Widrig
Chief Executive Officer
Lukas Brosi
Chief Financial Officer

© Flughafen Zürich AG2 | August 27, 2019
CONTENT
Business Update
Financial Update
Outlook
Q&A
Appendix

© Flughafen Zürich AG3 | August 27, 2019
HIGHLIGHTS
HALF YEAR 2019
Traffic
THE CIRCLE
International
Advertising
Media
All-time peak day with more than 115,000 passengers (July 28)
Deceleration of passenger growth slightly faster than expected, yet ongoing strong
demand for mobility
Construction work on time, increased pre-letting
New project started to connect THE CIRCLE directly with other airport facilities
New concessions won in Vitória and Macaé in Brazil; operational takeover expected
in January 2020
Opening of new terminal building in Florianópolis in October 2019
Advertising space newly awarded to APG|SGA starting in January 2020 and lasting
until December 2024
APG|SGA will manage all analog and digital advertising space at Zurich Airport
Commercial
Activities
No increase in transfer payments (cross-subsidization)
No adjustments to WACC calculation formula
Ordinance on
Airport Charges
Various refurbishment works and new concepts
Increased use of digital channels
© Flughafen Zürich AG4 | August 27, 2019
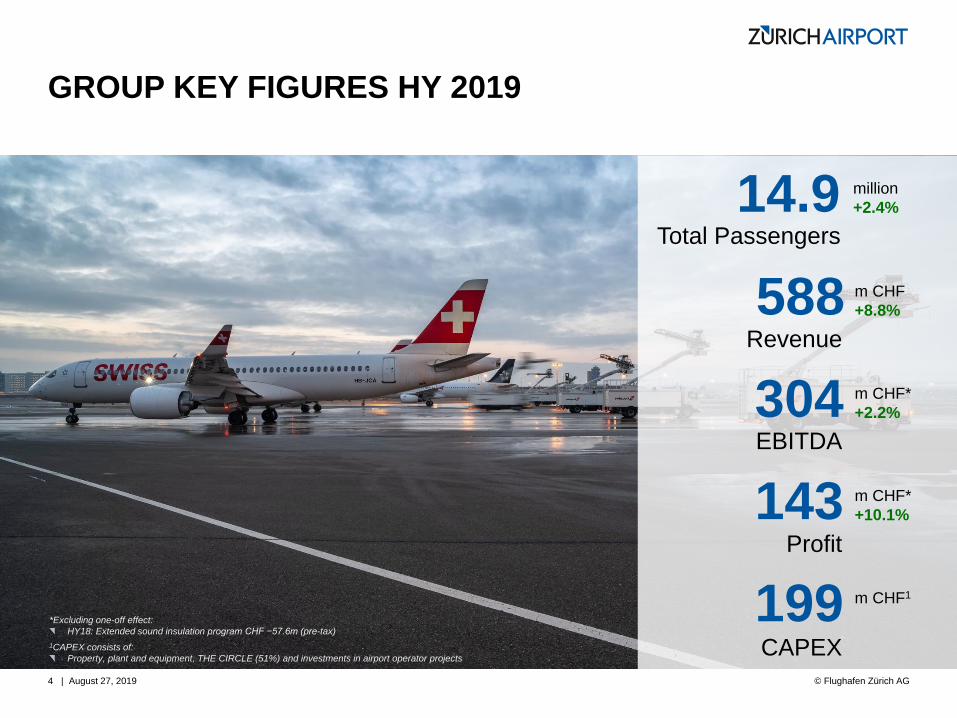
GROUP KEY FIGURES HY 2019
588
304
143 m CHF*
+10.1%
14.9
m CHF
+8.8%
m CHF*
+2.2%
million
+2.4%
199 m CHF1
Revenue
EBITDA
Profit
CAPEX
Total Passengers
*Excluding one-off effect:
HY18: Extended sound insulation program CHF −57.6m (pre-tax)
1CAPEX consists of:
Property, plant and equipment, THE CIRCLE (51%) and investments in airport operator projects

© Flughafen Zürich AG5 | August 27, 2019
STRONG PERFORMANCE IN AVIATION BUSINESS
2.4% rise in passenger
volumes to 14.9m
Local passengers of
10.5m (+1.1%)
Transfer passengers of
4.4m (+5.7%)
Transfer share of
29.3%
Rise in air traffic
movements to 135,871
(+0.9%)
whereof line & charter
movements 119,431
Cargo -7.5% to 226,003
tons
Top 5 Airlines in HY 2019
Swiss Airlines 53.5%
Edelweiss Air 8.3%
easyJet 3.2%
Eurowings 2.9%
British Airways 2.2%
© Flughafen Zürich AG6 | August 27, 2019
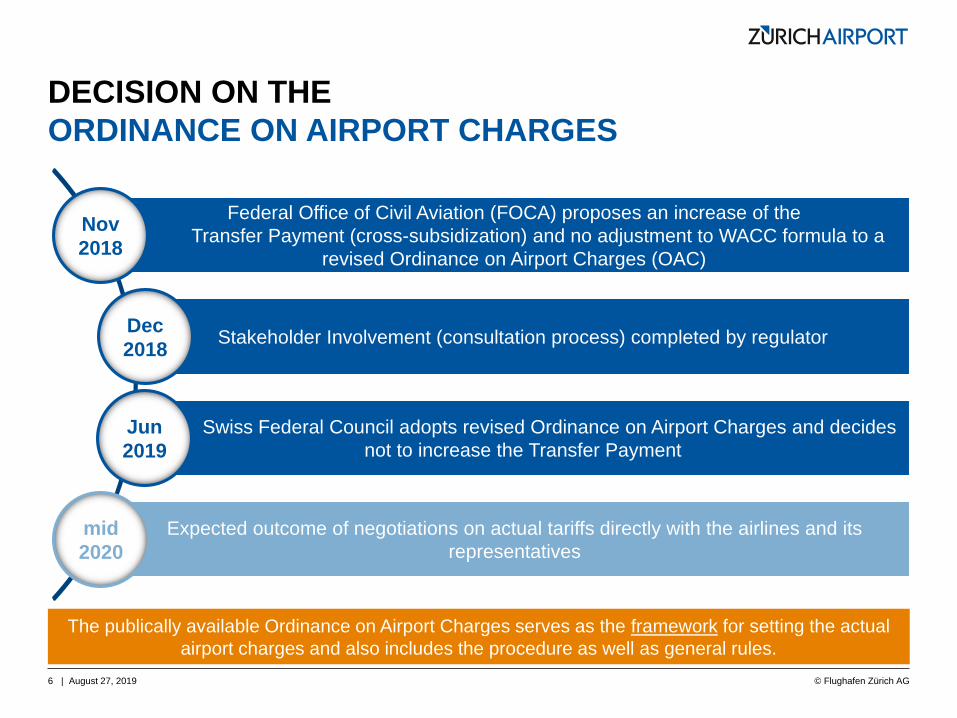
Federal Office of Civil Aviation (FOCA) proposes an increase of the
Transfer Payment (cross-subsidization) and no adjustment to WACC formula to a
revised Ordinance on Airport Charges (OAC)
Stakeholder Involvement (consultation process) completed by regulator
Swiss Federal Council adopts revised Ordinance on Airport Charges and decides
not to increase the Transfer Payment
Expected outcome of negotiations on actual tariffs directly with the airlines and its
representatives
DECISION ON THE
ORDINANCE ON AIRPORT CHARGES
Dec
2018
Jun
2019
mid
2020
Nov
2018
The publically available Ordinance on Airport Charges serves as the framework for setting the actual
airport charges and also includes the procedure as well as general rules.

© Flughafen Zürich AG7 | August 27, 2019
NON-AVIATION BUSINESS AND STRATEGIC PROJECTS
Commercial turnover
Airside +0.2%
Landside +0.8%
New commercial
concepts increase
revenues
Strategic projects
Opening of THE
CIRCLE mid 2020
Transition of newly
acquired airports in
Brazil has started
© Flughafen Zürich AG8 | August 27, 2019
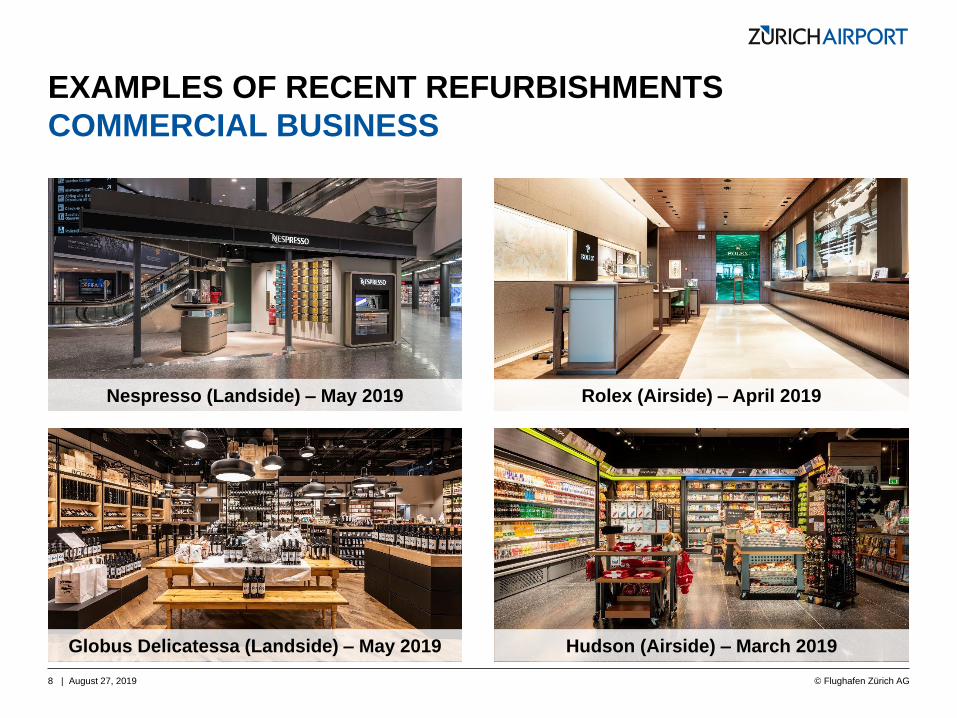
EXAMPLES OF RECENT REFURBISHMENTS
COMMERCIAL BUSINESS
Nespresso (Landside) – May 2019 Rolex (Airside) – April 2019
Globus Delicatessa (Landside) – May 2019 Hudson (Airside) – March 2019

© Flughafen Zürich AG9 | August 27, 2019
CHF 257.4 CHF 253.4 CHF 256.6
CHF 271.7
CHF 284.8 CHF 286.3
20.3%
20.5%
20.3%
20.7%
21.5%
22.3%
CHF 0
CHF 50
CHF 100
CHF 150
CHF 200
CHF 250
CHF 300
H1 2014 H1 2015 H1 2016 H1 2017 H1 2018 H1 2019
in m
CH
F
Turnover Airside (m CHF) Turnover Landside (m CHF) Average Concession Rate
COMMERCIAL BUSINESS – DEVELOPMENT
Total Airside Commercial Area ~14,200m2 Total Landside Commercial Area ~19,000m2
Airside Turnover HY 2019 +0.2%
Landside Turnover HY 2019 +0.8%
© Flughafen Zürich AG10 | August 27, 2019
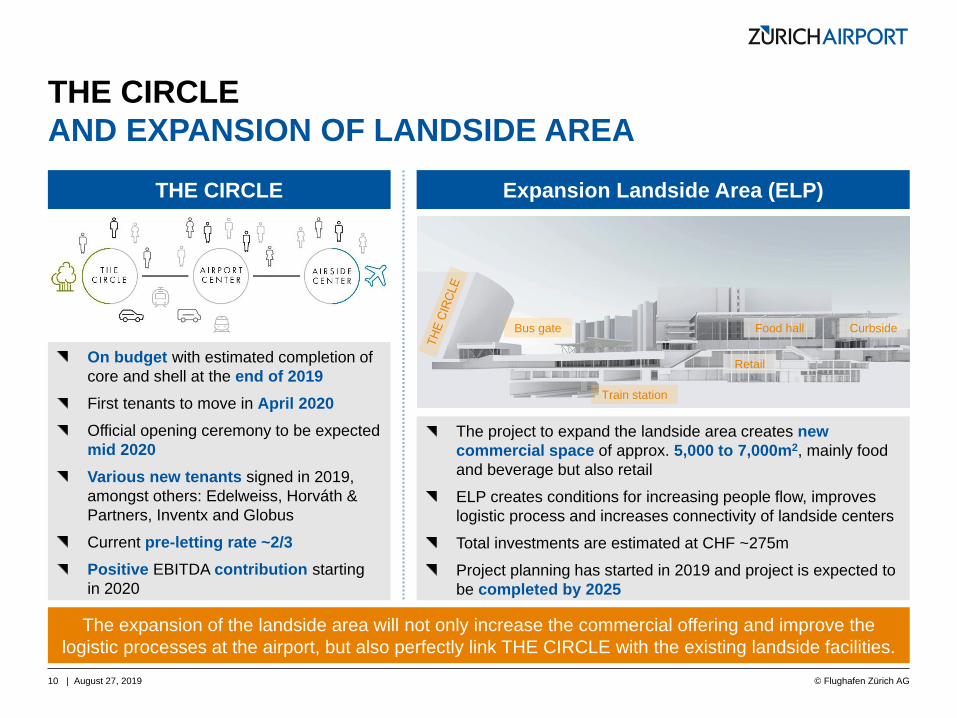
THE CIRCLE
AND EXPANSION OF LANDSIDE AREA
THE CIRCLE Expansion Landside Area (ELP)
Bus gate
Train station
Food hall
Retail
Curbside
The expansion of the landside area will not only increase the commercial offering and improve the
logistic processes at the airport, but also perfectly link THE CIRCLE with the existing landside facilities.
The project to expand the landside area creates new
commercial space of approx. 5,000 to 7,000m2, mainly food
and beverage but also retail
ELP creates conditions for increasing people flow, improves
logistic process and increases connectivity of landside centers
Total investments are estimated at CHF ~275m
Project planning has started in 2019 and project is expected to
be completed by 2025
On budget with estimated completion of
core and shell at the end of 2019
First tenants to move in April 2020
Official opening ceremony to be expected
mid 2020
Various new tenants signed in 2019,
amongst others: Edelweiss, Horváth &
Partners, Inventx and Globus
Current pre-letting rate ~2/3
Positive EBITDA contribution starting
in 2020
© Flughafen Zürich AG11 | August 27, 2019
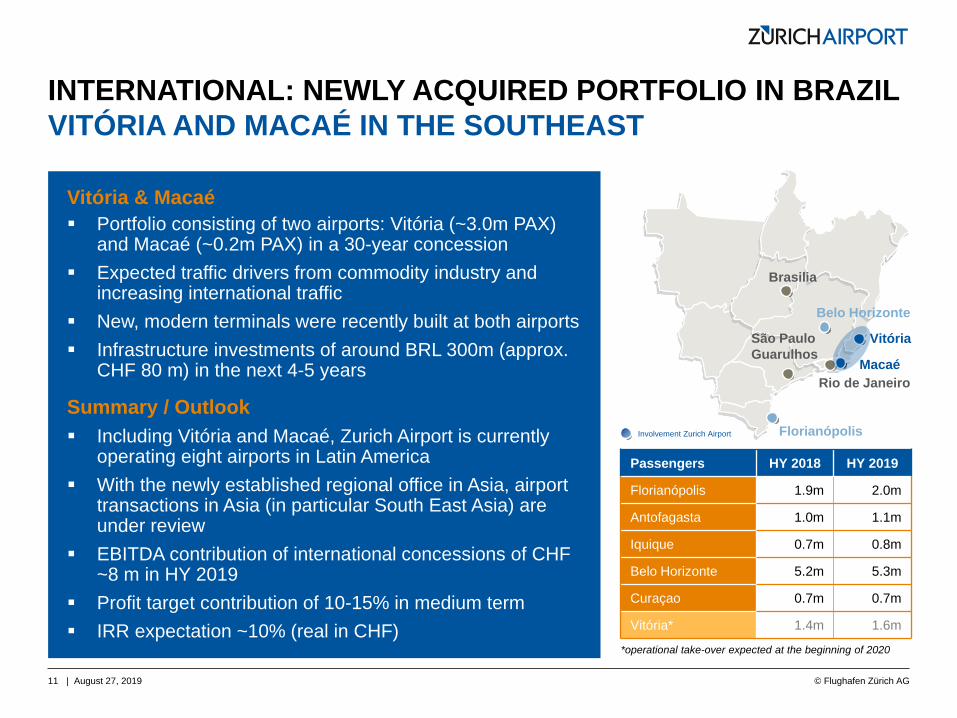
INTERNATIONAL: NEWLY ACQUIRED PORTFOLIO IN BRAZIL
VITÓRIA AND MACAÉ IN THE SOUTHEAST
Vitória & Macaé
Portfolio consisting of two airports: Vitória (~3.0m PAX) and Macaé (~0.2m PAX) in a 30-year concession
Expected traffic drivers from commodity industry and increasing international traffic
New, modern terminals were recently built at both airports
Infrastructure investments of around BRL 300m (approx. CHF 80 m) in the next 4-5 years
Summary / Outlook
Including Vitória and Macaé, Zurich Airport is currently operating eight airports in Latin America
With the newly established regional office in Asia, airport transactions in Asia (in particular South East Asia) are under review
EBITDA contribution of international concessions of CHF ~8 m in HY 2019
Profit target contribution of 10-15% in medium term
IRR expectation ~10% (real in CHF)
São Paulo
Guarulhos
Brasilia
Rio de Janeiro
Belo Horizonte
Florianópolis
Vitória
Macaé
Involvement Zurich Airport
Passengers HY 2018 HY 2019
Florianópolis 1.9m 2.0m
Antofagasta 1.0m 1.1m
Iquique 0.7m 0.8m
Belo Horizonte 5.2m 5.3m
Curaçao 0.7m 0.7m
Vitória* 1.4m 1.6m
*operational take-over expected at the beginning of 2020
© Flughafen Zürich AG12 | August 27, 2019
CONTENT
Business Update
Financial Update
Outlook
Q&A
Appendix

© Flughafen Zürich AG13 | August 27, 2019
DECENT HY 2019 REVENUE AND PROFIT GROWTH
540
588
Revenue (in million CHF)
Passenger growth,
increasing commercial
revenues and higher
construction activity in
Florianópolis led to an
increase of 8.8%
297304
EBITDA (in million CHF)
The EBITDA-margin was at
51.6%, lower due the gross
amounts of concession
accounting (otherwise
55.9%)
173188
EBIT (in million CHF)
With slightly lower
amortization and
depreciation figures, EBIT
rose by 8.3%
*Excluding one-off effect:
HY18: Extended sound insulation program CHF −57.6m (pre-tax)
HY18* HY19
130143
Profit (in million CHF)
Profit grew by 10.1%
compared with the
corresponding period a year
ago
HY18* HY19Concession accounting
543531

© Flughafen Zürich AG14 | August 27, 2019
AVIATION REVENUES IN LINE WITH VOLUME GROWTH
206209
PAX-related Flight Operations
Charges(in million CHF)
PAX-related Charges grew softer
compared to PAX growth because
of increased transfer share
66 67
Other Flight Operations
Charges (in million CHF)
Flight Operations Charges
grew by 1.8% mainly due to
an increase in ATM’s and
Average Maximum Take-Off
Weight
309315
HY18 HY19
Total Aviation Revenue (in million CHF)
Solid traffic numbers
augmented aviation
revenues by 2.1%
37 39
Aviation Fees and other
Aviation Revenues(in million CHF)
Aviation Fees and other
Aviation Revenues are up by
5.6%, mainly because of
higher de-icing revenue
HY18 HY19

© Flughafen Zürich AG15 | August 27, 2019
Total Non-Aviation Revenue (in million CHF)
Excl. IFRIC12 (concession
accounting), non-aviation
revenues grew by 2.3%
32
68
International Revenue(in million CHF)
Higher construction activity in
Florianópolis led to an
increase in revenues
NON-AVIATION REVENUES ON TRACK FOR GROWTH
118121
Commercial & Parking
Revenue(in million CHF)
On the back of a higher
average concession rate,
Commercial Revenue grew
by 4.4%
21 22
Revenue from Services (in million CHF)
Almost unchanged Revenues
from Services
60 63
Revenue Facility Management (in million CHF)
Revenues from Facility
Management are up by 3.6%
because of additional rental
agreements
HY18 HY19
FY17 FY18
Concession accounting
23
231273
227222
HY18 HY19
23
© Flughafen Zürich AG16 | August 27, 2019
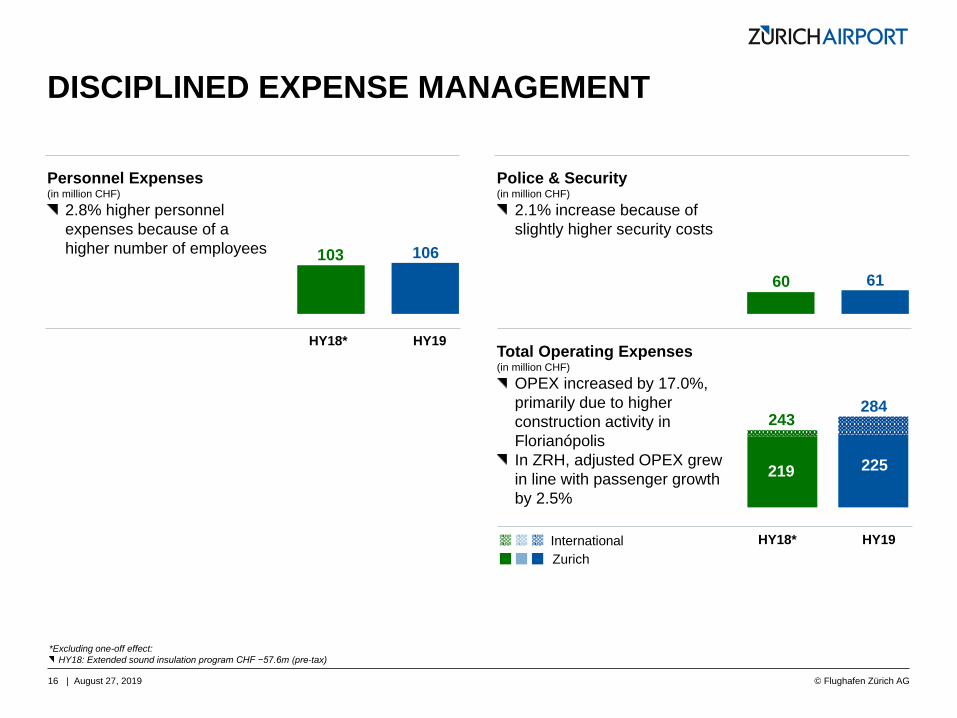
DISCIPLINED EXPENSE MANAGEMENT
103 106
Personnel Expenses (in million CHF)
2.8% higher personnel
expenses because of a
higher number of employees
60 61
Police & Security (in million CHF)
2.1% increase because of
slightly higher security costs
243
Total Operating Expenses(in million CHF)
OPEX increased by 17.0%,
primarily due to higher
construction activity in
Florianópolis
In ZRH, adjusted OPEX grew
in line with passenger growth
by 2.5%
219 225
International
Zurich
HY18* HY19
HY18* HY19
284
*Excluding one-off effect:
HY18: Extended sound insulation program CHF −57.6m (pre-tax)

© Flughafen Zürich AG17 | August 27, 2019
FINANCIAL KEY FIGURES
1.1x
1.3xNet Financial Debt / EBITDA(excl. noise)
Net Financial Debt stands at
CHF 796 m
ROIC (incl. noise, in %)
Adjusted for last year’s one-
off effect, the ROIC has
increased by 0.8 percentage
points
195201
Operating Cash Flow (incl. noise, in million CHF)
Operating Cash Flow
increased by CHF 6 m
HY18* HY19
8.5
9.3
60
1
Free Cash Flow (incl. noise, in million CHF)
Reduction in Free Cash Flow
because of substantial higher
CAPEX
HY18 HY19
*Excluding one-off effect:
HY18: Extended sound insulation program CHF −57.6m (pre-tax)
© Flughafen Zürich AG18 | August 27, 2019
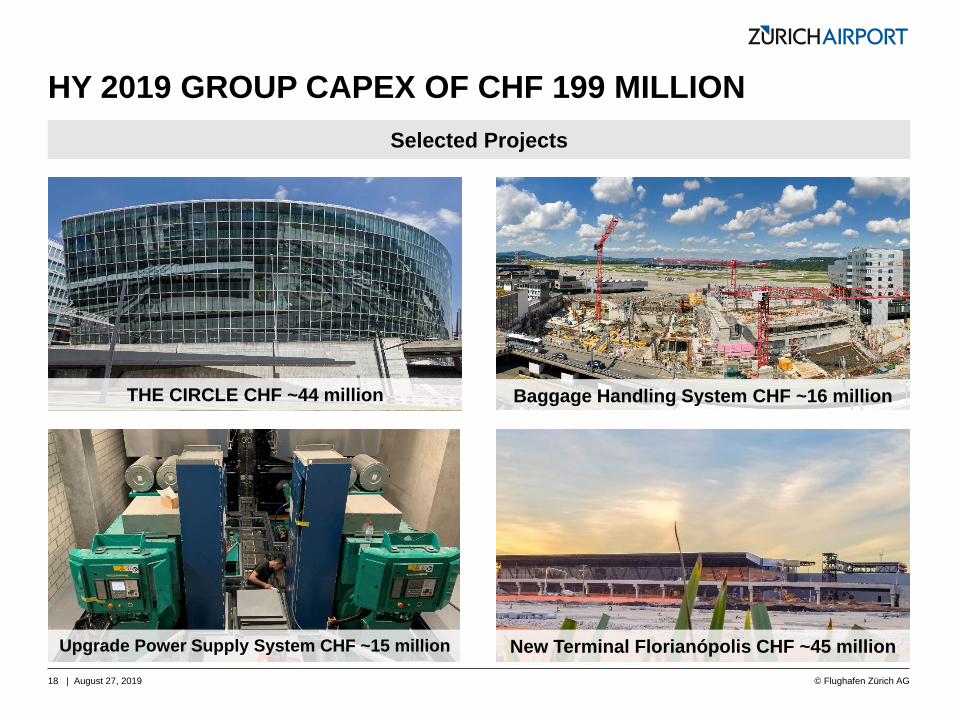
HY 2019 GROUP CAPEX OF CHF 199 MILLION
THE CIRCLE CHF ~44 million
New Terminal Florianópolis CHF ~45 millionUpgrade Power Supply System CHF ~15 million
Baggage Handling System CHF ~16 million
Selected Projects

© Flughafen Zürich AG19 | August 27, 2019
CONTENT
Business Update
Financial Update
Outlook
Q&A
Appendix

© Flughafen Zürich AG20 | August 27, 2019
TIMETABLE HIGHLIGHTS
Upcoming Winter Timetable 2019/2020
Osaka, Washington, D.C.Swiss will have two additional Boeing 777 in operation from
Q1/2020.
TorontoAir Canada will increase its frequencies from 6 weekly flights to a
daily connection to Toronto.
Current Summer Timetable 2019
Gdansk, HeringsdorfThe home carrier expands its route network with 4 weekly flights to
Gdansk and one flight per week to Heringsdorf.
Kalamata, Tirana, OhridEdelweiss further expands its route network with up to 2 weekly
flights to Kalamata (seasonal), Tirana and Ohrid.
VancouverSince June 7, Air Canada has increased its seasonal service to
Vancouver from 3 to 5 weekly frequencies.
PalmaEurowings expands its network from Zurich with 5 weekly flights to
Palma.
HongkongSince March 3, Cathay Pacific has changed the aircraft to a A350–
1000, which increased the capacity to additional 59 seats/flight.
Vueling has dropped 6 routes since October 2018.
Following two years of impressive growth, easyJet made various
corrections to its Zurich portfolio.

© Flughafen Zürich AG21 | August 27, 2019
MID-TERM CAPEX ROADMAP OUTLOOK
ZURICH AND INTERNATIONAL
Zurich
CAPEX peak in 2020 (completion of THE CIRCLE)
Total CAPEX of CHF ~300m p.a. expected in Zurich going forward
Maintenance CAPEX accounts for around CHF 100m to 150m p.a.
Regulated CAPEX estimated to account for roughly 60% (after THE CIRCLE will
be completed)
Major projects within the next 5 to 10 years include:
Baggage Handling System (estimated costs of CHF 470m from 2018 to 2025)
Expansion Landside Area (estimated costs of CHF 275m from 2019 to 2025)
Additional aircraft stands
New car parking facility
Mid-term CAPEX is subject to economic conditions and future economic regulations
International
CAPEX depends on project and its obligations
Major international CAPEX includes:
Florianópolis: New terminal will be opened on October 1, 2019; thereafter
CAPEX will be reduced significantly
Vitória and Macaé: Total CAPEX of roughly CHF 80m expected from 2020 to
2025
New acquisitions will increase international CAPEX requirement on a case by case
basis

© Flughafen Zürich AG22 | August 27, 2019
GUIDANCE FOR FULL YEAR 2019
1 2018 excluding one-off effect: Extended sound insulation program CHF −57.6m (pre-tax)
2018 Actual1 2019 Guidance
Passengers 31.1 million Approx. 2% higher (previous ~3%)
Revenues (incl. Concession
Accounting)
CHF 1,153 million Aviation revenues slightly higher
Slightly higher commercial & real estate revenues
Revenues from international business CHF ~45−50m
Concession
Accounting, IFRIC12(indication for international
CAPEX)
CHF 41 million Mid-double digit million amount
Operating expenses (incl. Concession
Accounting)
CHF 524 million Slightly higher costs in ZRH
OPEX international CHF ~30−35m
EBITDA CHF 629 million Slightly higher
Depreciation CHF 244 million Slightly lower
Profit CHF 284 million Approx. 5% higher
ZRH CAPEX CHF 290 million CHF ~350 million; whereof CHF ~110 million for THE CIRCLE
© Flughafen Zürich AG23 | August 27, 2019
CONTENT
Business Update
Financial Update
Outlook
Q&A
Appendix

© Flughafen Zürich AG24 | August 27, 2019
CORPORATE CALENDAR & CONTACT INFORMATION
Investor Relations Team
+41 (0)43 816 71 61
September 6, 2019
UBS Best of Switzerland Conference (Zurich)
September 9, 2019
UBS Transport Conference (London)
September 25, 2019
Santander EUROLATAM Conference (New York)
November 6/7, 2019
ZKB Conference (Zurich)
March 10, 2020
Publication of full year results 2019
© Flughafen Zürich AG25 | August 27, 2019
CONTENT
Business Update
Financial Update
Outlook
Q&A
Appendix

© Flughafen Zürich AG26 | August 27, 2019
THE CIRCLE
2018 investments of CHF 95 million
Business and lifestyle center
Overall CHF 1.2 billion investment,
180,000m2 lettable area and 6,500 jobs
Co-owned with Swiss Life AG (49%)
Expect knock-on effect on existing
commercial business from additional
commuters and visitors
Completion of construction by end 2019;
opening of main area in 2020
ZURICH AIRPORT AT A GLANCE
2018 revenue of CHF 657 million
“To satisfy the demand for direct
connections to the world’s major cities”
Regulated business with profitability
restrictions; not subsidized
Premium mid-sized hub with operating
license until 2051
Land and infrastructure wholly-owned
by Zurich Airport
Service to 206 airports in 68 countries
Economic importance: 278,458 air
traffic movements and 493,222t freight
Passengers: currently ~31 million/year
Revenue contribution ~60%
COMMERCIAL, REAL ESTATE & SERVICES
2018 revenue of CHF 413 million
Leading commercial center
Average concession rate of >21% of
total commercial turnover
Commercial revenues driven by passenger
numbers (airside) and commuters,
employees, shoppers etc. (landside)
Revenue contribution ~40%
INTERNATIONAL BUSINESS
2018 revenue of CHF 83 million
Long-term growth potential in
international markets as airport developer
and operator
Diversification of revenues to strengthen
future profitability
Financial capacity for investments with
focus on airports in Latin America and
Asia
Profit target contribution ~15%
AVIATION / REGULATED NON-AVIATION / UNREGULATED
STRATEGIC GROWTH PROJECTS / UNREGULATED

© Flughafen Zürich AG27 | August 27, 2019
GROUP KEY FIGURES YTD*
Including noise Excluding noise
In million CHF Jan – Jun 2019 Jan – Jun 2018 Jan – Jun 2019 Jan – Jun 2018
Aviation revenue 315.4 309.0 309.9 303.4
Non-aviation revenue 272.6 231.2 272.6 231.2
Revenue 588.0 540.2 582.5 534.6
EBITDA 303.7 239.6 299.8 293.1
EBITDA margin (in %) 51.6 44.3 51.1 54.8
Depreciation and amortization (115.9) (123.8) (113.8) (121.1)
EBIT 187.7 115.8 186.0 171.9
EBIT margin (in %) 31.9 21.4 31.9 32.2
Finance result (net) (3.7) (9.4) (8.1) (7.6)
Associated companies (1.8) (1.8) (1.8) (1.8)
Income tax expense (38.8) (20.1) (37.6) (32.8)
PROFIT 143.4 84.5 138.5 129.8
*As reported; including one-off effect:
HY18: Extended sound insulation program CHF −57.6m (pre-tax)
© Flughafen Zürich AG28 | August 27, 2019
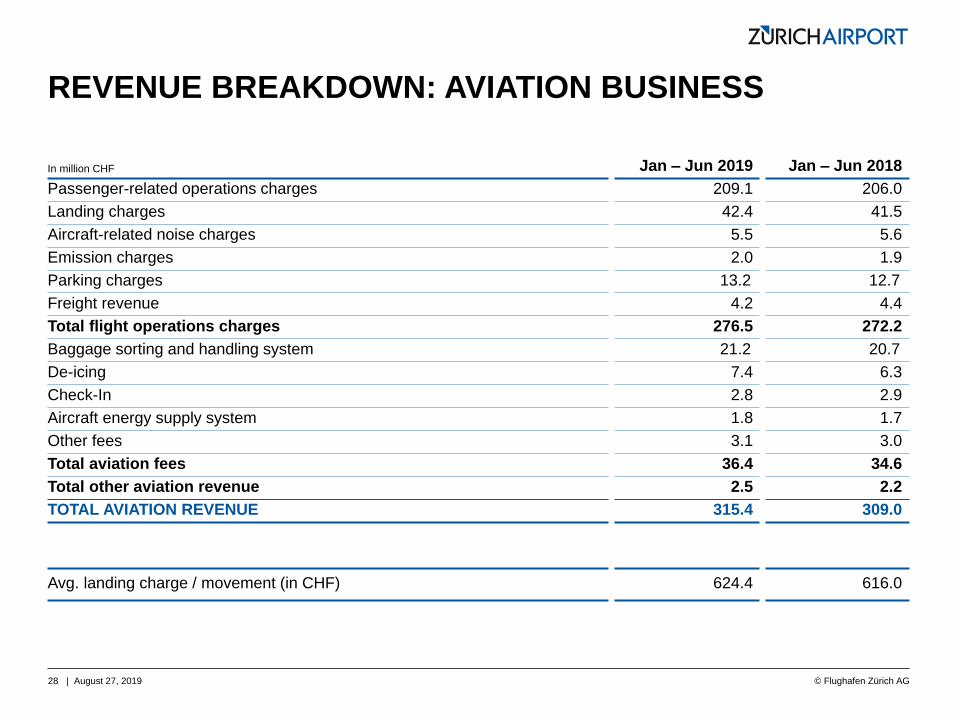
REVENUE BREAKDOWN: AVIATION BUSINESS
In million CHF Jan – Jun 2019 Jan – Jun 2018
Passenger-related operations charges 209.1 206.0
Landing charges 42.4 41.5
Aircraft-related noise charges 5.5 5.6
Emission charges 2.0 1.9
Parking charges 13.2 12.7
Freight revenue 4.2 4.4
Total flight operations charges 276.5 272.2
Baggage sorting and handling system 21.2 20.7
De-icing 7.4 6.3
Check-In 2.8 2.9
Aircraft energy supply system 1.8 1.7
Other fees 3.1 3.0
Total aviation fees 36.4 34.6
Total other aviation revenue 2.5 2.2
TOTAL AVIATION REVENUE 315.4 309.0
Avg. landing charge / movement (in CHF) 624.4 616.0

© Flughafen Zürich AG29 | August 27, 2019
REVENUE BREAKDOWN: NON-AVIATION BUSINESS
In million CHF Jan – Jun 2019 Jan – Jun 2018
Retail, tax & duty-free 54.7 52.2
Food & beverage operations 9.1 8.9
Revenue from multi-story car parks 39.2 38.8
Other commercial revenue 17.5 17.5
Total commercial revenue 120.5 117.5
Revenue from rental and leasing agreements 45.8 44.9
Energy and utility cost allocation 12.0 11.2
Cleaning and other service revenue 4.8 4.3
Revenue from facility management 62.6 60.5
Revenue from services 21.8 21.3
Revenues international 22.6 23.1
Revenues from construction projects 45.1 8.8
Total revenues international 67.7 31.9
TOTAL NON-AVIATION REVENUE 272.6 231.2
© Flughafen Zürich AG30 | August 27, 2019
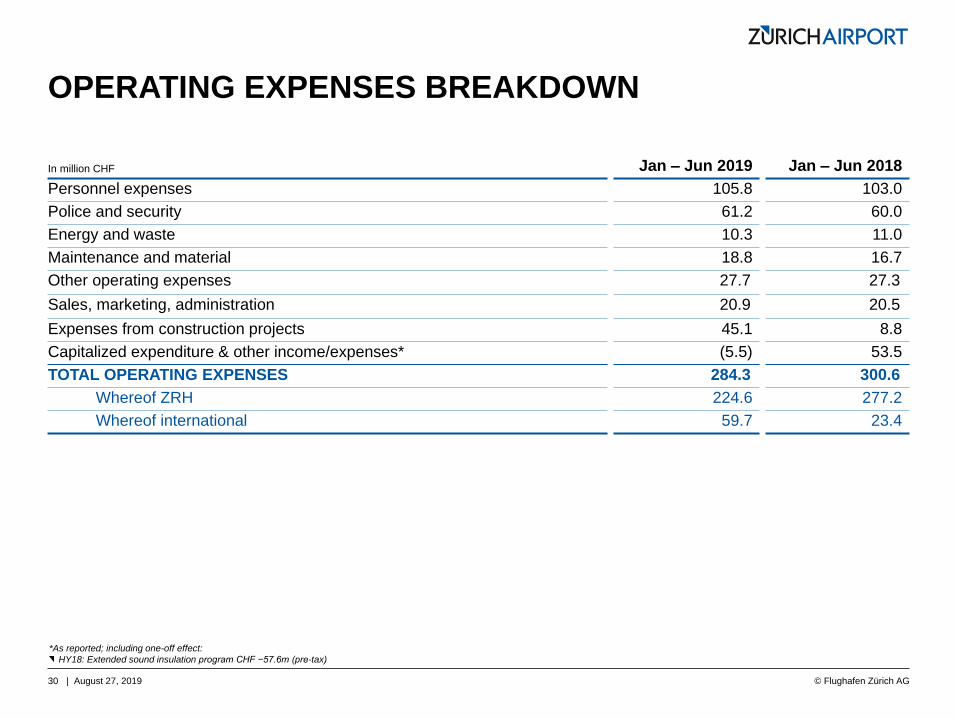
OPERATING EXPENSES BREAKDOWN
In million CHF Jan – Jun 2019 Jan – Jun 2018
Personnel expenses 105.8 103.0
Police and security 61.2 60.0
Energy and waste 10.3 11.0
Maintenance and material 18.8 16.7
Other operating expenses 27.7 27.3
Sales, marketing, administration 20.9 20.5
Expenses from construction projects 45.1 8.8
Capitalized expenditure & other income/expenses* (5.5) 53.5
TOTAL OPERATING EXPENSES 284.3 300.6
Whereof ZRH 224.6 277.2
Whereof international 59.7 23.4
*As reported; including one-off effect:
HY18: Extended sound insulation program CHF −57.6m (pre-tax)

© Flughafen Zürich AG31 | August 27, 2019
PASSENGER DEVELOPMENT
Global Market Figures Jan – June 2019
North America 2019
Share ZRH 8.2%
From/to ZRH +5.4%
Global market +3.9%
Source: ACI & ZRH data warehouse, 2019
Latin America 2019
Share ZRH 2.2%
From/to ZRH +32.8%
Global market +5.5%Europe 2019
Share ZRH 73.6%
From/to ZRH +0.4%
Global market +4.3%
Africa 2019
Share ZRH 2.6%
From/to ZRH +17.5%
Global market +7.1%
Middle East 2019
Share ZRH 5.6%
From/to ZRH +1.8%
Global market +2.5%
Far East 2019
Share ZRH 7.8%
From/to ZRH +8.2%
Global market +1.9%
Worldwide 2019
From/to ZRH +2.4%
Global market +3.6%

© Flughafen Zürich AG32 | August 27, 2019
3.5%
4.8%
5.7%
65.8%
68.3%
3.6%
4.9%
5.4%
66.1%
67.2%
0% 10% 20% 30% 40% 50% 60% 70% 80%
Middle East Carrier
Skyteam
Oneworld
Star Alliance
Lufthansa Group
HY 2018 HY 2019
HY 2019 ALLIANCE SHARE ZRH
Source: ZRH data warehouse, 2019
+0.8%
+2.2%
+7.5%
+2.0%
+4.1%
+0% +5% +10%
Middle East Carrier
Skyteam
Oneworld
Star Alliance
Lufthansa Group
YTD Passenger Growth

© Flughafen Zürich AG33 | August 27, 2019
LUFTHANSA HUBS PASSENGER DEVELOPMENT
-10%
-5%
0%
5%
10%
15%
20%
25%
30%
Jul 18 Aug 18 Sep 18 Oct 18 Nov 18 Dec 18 Jan 19 Feb 19 Mar 19 Apr 19 May 19 Jun 19
ZRH BRU FRA VIE MUC DUS
Jul 2018 – Jun 2019
Source: ACI & ZRH data warehouse, 2019

© Flughafen Zürich AG34 | August 27, 2019
TRAFFIC RATIOS
Source: ZRH data warehouse, 2019
70% 71%
73%
74% 74%
75%
73%
75%
77%
76%
9698
103106
108109
112
120
125 125
80 8184 85 86 86
9193
95 95
75
90
105
120
135
150
165
65%
70%
75%
80%
HY 2010 HY 2011 HY 2012 HY 2013 HY 2014 HY 2015 HY 2016 HY 2017 HY 2018 HY 2019
Passengers
per M
ovem
ent (P
AX
)A
vera
ge T
ake-O
ff Weig
ht (to
ns)
Seat
Load F
acto
r
Seat Load Factor Passengers per Movement Average Take-Off Weight

© Flughafen Zürich AG35 | August 27, 2019
PASSENGERS AND MOVEMENTS DEVELOPMENT
STEADY TRAFFIC GROWTH
22.7
20.6
17.917.0 17.3
17.9
19.2
20.7
22.1 21.922.9
24.324.8 24.9
25.526.3
27.7
29.4
31.1
250'000
270'000
290'000
310'000
330'000
350'000
370'000
0
5'000'000
10'000'000
15'000'000
20'000'000
25'000'000
30'000'000
2000 2001 2002 2003 2004 2005 2006 2007 2008 2009 2010 2011 2012 2013 2014 2015 2016 2017 2018
To
tal A
ir Tra
ffic M
ove
me
nts
(AT
M)
To
tal P
asse
ng
ers
Local passengers Transfer passengers Transit passengers Total Air Traffic Movements (ATM)

© Flughafen Zürich AG36 | August 27, 2019
DISCLAIMER: FORWARD-LOOKING STATEMENTS
This document has been prepared by Flughafen Zürich AG for use in this presentation.
The information contained in this document has not been independently verified. No representation or warranty – whether
express or implied – is made as to, and no reliance should be placed on, the fairness, accuracy, completeness or
correctness of the information or opinions contained therein. Neither the company nor any of its affiliates, advisors or
representatives shall have any liability whatsoever (in negligence or otherwise) for any loss arising from any use of this
document or its content or otherwise arising in connection with this document.
This document does not constitute an offer or invitation to purchase or subscribe for any shares and neither this document
nor any part of it shall form the basis of, or be relied upon in connection with, any contract or commitment whatsoever.
This document contains forward-looking statements that are based on current estimates and assumptions made by the
management of Flughafen Zürich AG to the best of its knowledge. Such forward-looking statements are subject to risks
and uncertainties, the non-occurrence or occurrence of which could cause the actual results – including the financial
condition and profitability of Flughafen Zürich AG – to differ materially from or be more negative than those expressed or
implied by such forward-looking statements. This also applies to the forward-looking estimates and forecasts derived from
third-party studies. Consequently, neither the Company nor its management can give any assurance regarding the future
accuracy of the opinions set forth in this document or the actual occurrence of the predicted developments.
By accepting this document, you agree with foregoing.