half year financial report january-june 2018...value of the global paints and coatings market; usd...
TRANSCRIPT
Half year financial reportJanuary-June 2018
Investor presentation
2
Disclaimer
In this presentation, all forward-looking statements in relation to the company or its business are
based on the management judgment, and macroeconomic or general industry data are based
on third-party sources, and actual results may differ from the expectations and beliefs such
statements contain.
3
Contents
• Tikkurila in brief
• Development during the review period
• Strategic Business Units
• Proceeding of the efficiency program and strategic actions
• Conclusions and outlook
• Appendix
Tikkurila in brief
4
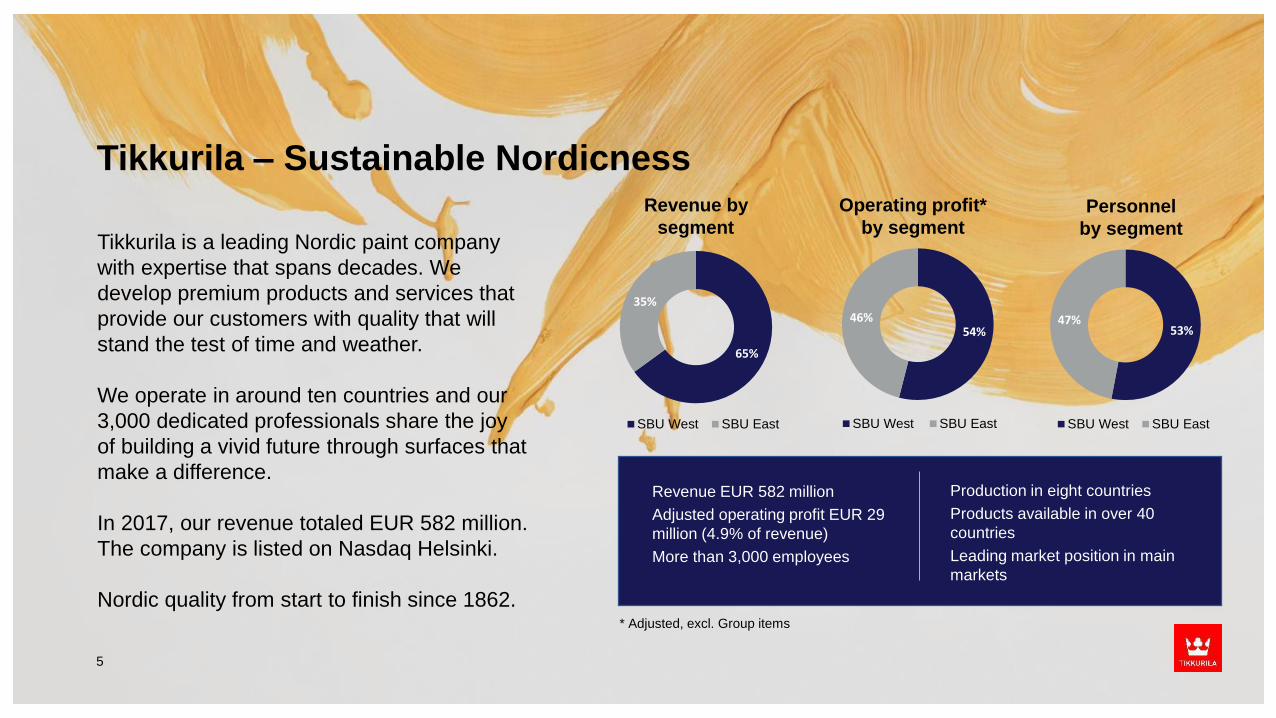
Tikkurila – Sustainable Nordicness
Revenue EUR 582 million
Adjusted operating profit EUR 29
million (4.9% of revenue)
More than 3,000 employees
Tikkurila is a leading Nordic paint company
with expertise that spans decades. We
develop premium products and services that
provide our customers with quality that will
stand the test of time and weather.
We operate in around ten countries and our
3,000 dedicated professionals share the joy
of building a vivid future through surfaces that
make a difference.
In 2017, our revenue totaled EUR 582 million.
The company is listed on Nasdaq Helsinki.
Nordic quality from start to finish since 1862.
Production in eight countries
Products available in over 40
countries
Leading market position in main
markets
5
Revenue by
segment
Operating profit*
by segmentPersonnel
by segment
* Adjusted, excl. Group items
65%
35%
SBU West SBU East
54%46%
SBU West SBU East
53%47%
SBU West SBU East
6
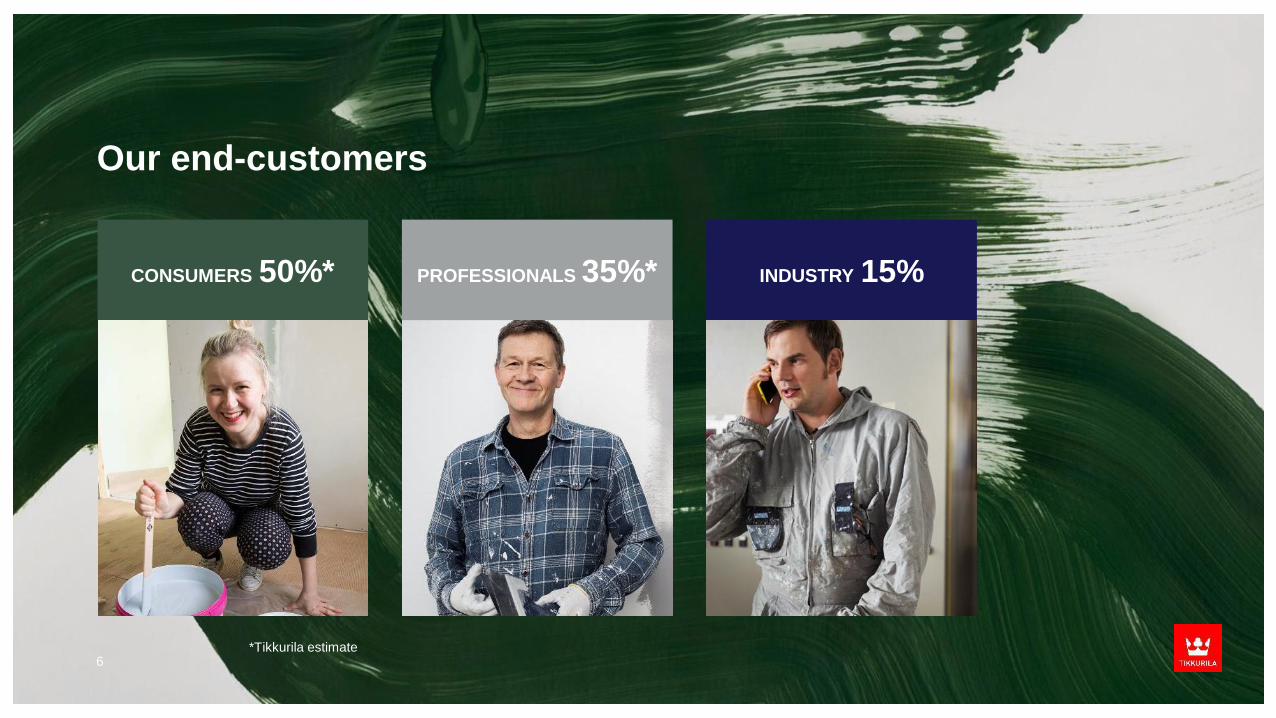
CONSUMERS 50%* PROFESSIONALS 35%* INDUSTRY 15%
Our end-customers
*Tikkurila estimate
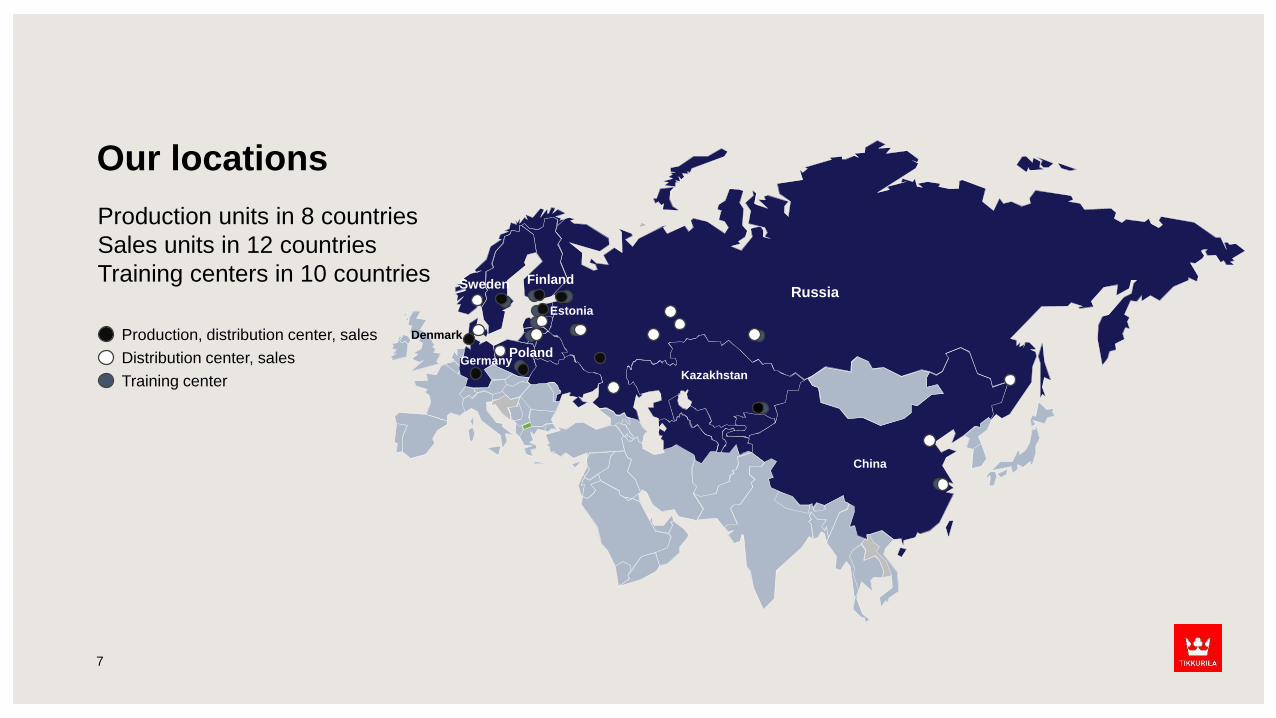
Our locations
7
Production units in 8 countries
Sales units in 12 countries
Training centers in 10 countries
Production, distribution center, sales
Distribution center, sales
Training center
FinlandSweden
Estonia
GermanyPoland
Kazakhstan
China
Russia
Denmark
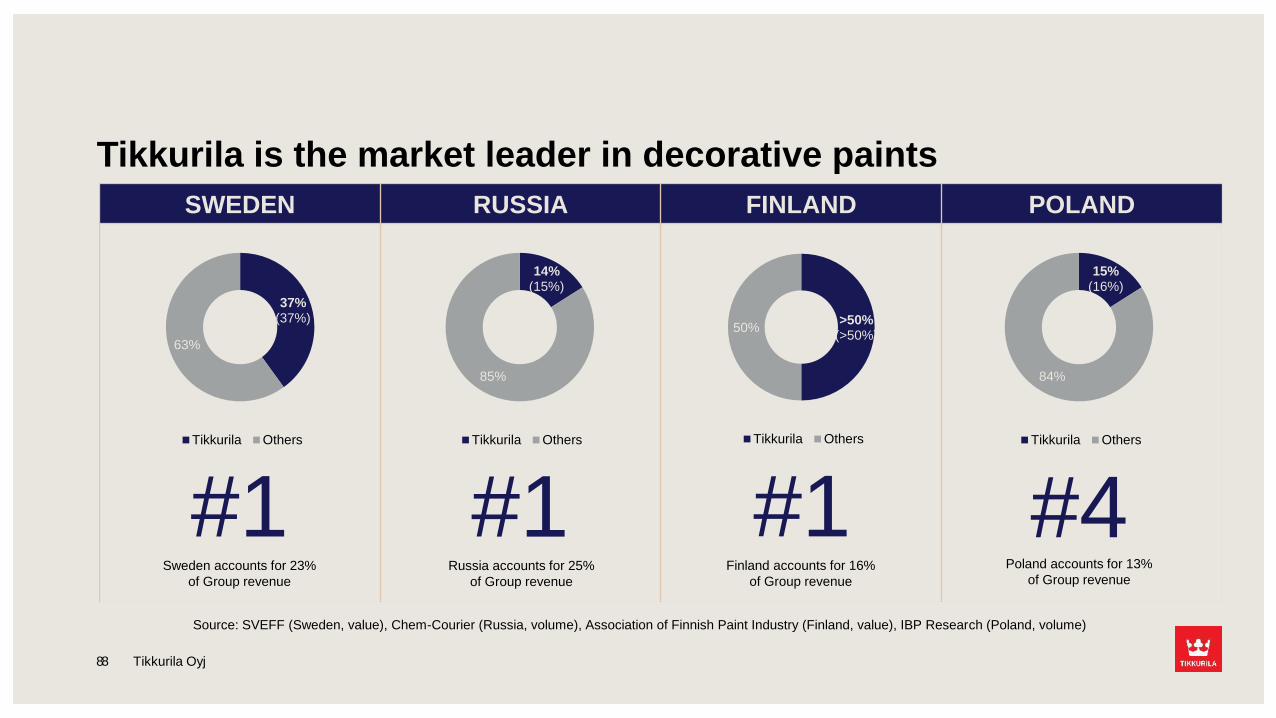
Tikkurila is the market leader in decorative paints
SWEDEN RUSSIA FINLAND POLAND
#1 #1 #1 #4Russia accounts for 25%
of Group revenue
Sweden accounts for 23%
of Group revenue
Finland accounts for 16%
of Group revenue
Poland accounts for 13%
of Group revenue
37%(37%)
63%
Tikkurila Others
>50%(>50%)
50%
Tikkurila Others
15%(16%)
84%
Tikkurila Others
14%(15%)
85%
Tikkurila Others
Source: SVEFF (Sweden, value), Chem-Courier (Russia, volume), Association of Finnish Paint Industry (Finland, value), IBP Research (Poland, volume)
Tikkurila Oyj88
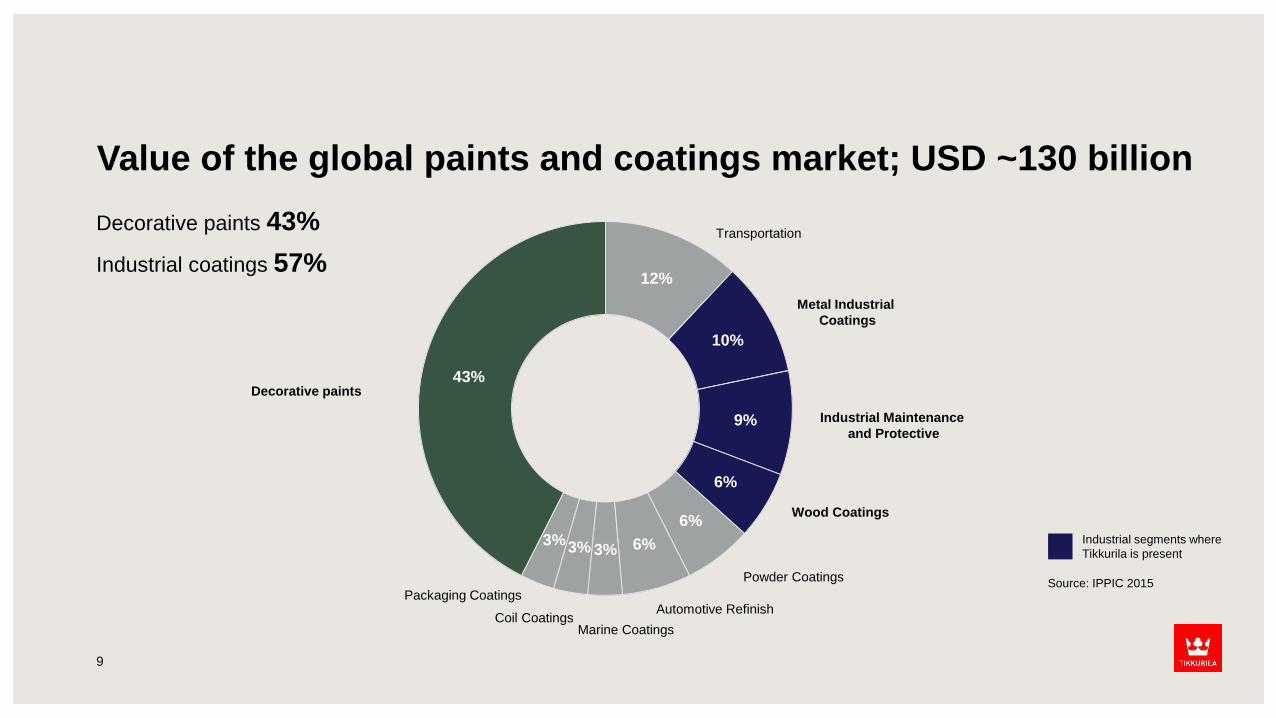
Value of the global paints and coatings market; USD ~130 billion
9
12%
10%
9%
6%
6%
6%3%3%3%
43%
Decorative paints 43%
Industrial coatings 57%
Source: IPPIC 2015
Decorative paints
Metal Industrial
Coatings
Transportation
Industrial Maintenance
and Protective
Automotive Refinish
Powder Coatings
Wood Coatings
Marine CoatingsCoil Coatings
Packaging Coatings
Industrial segments where
Tikkurila is present
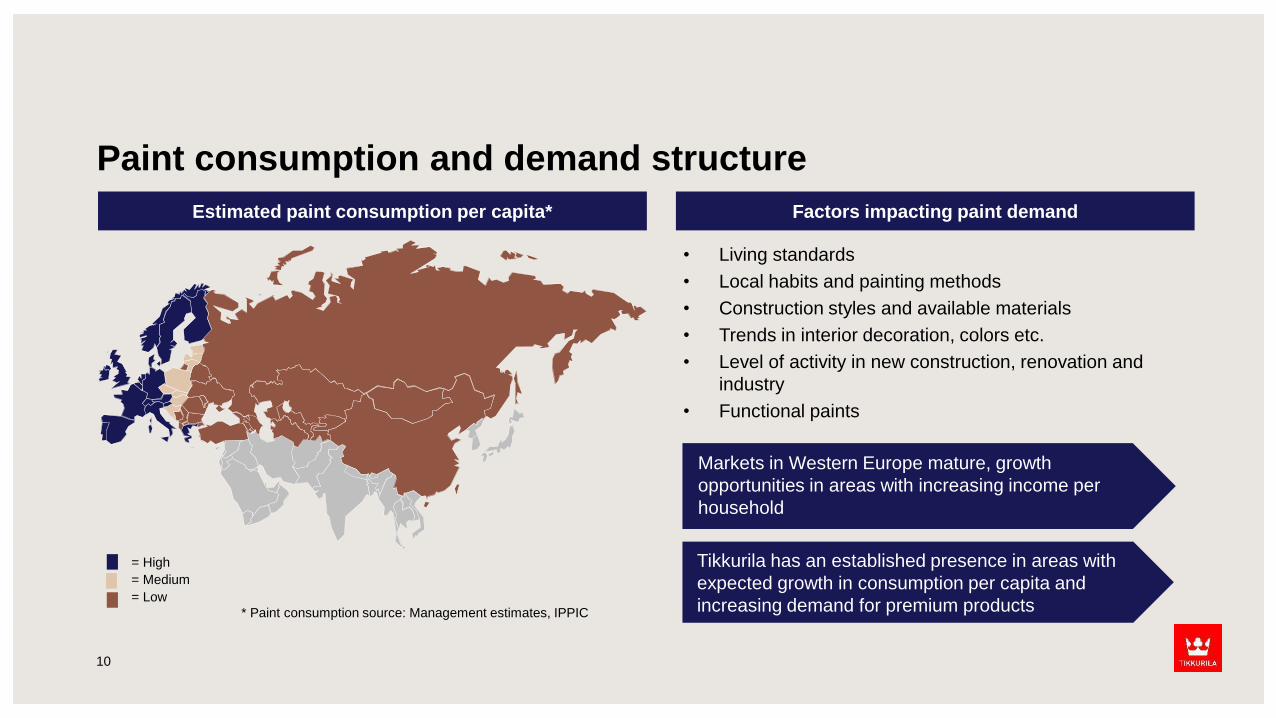
Paint consumption and demand structure
10
= High
= Medium
= Low
Factors impacting paint demandEstimated paint consumption per capita*
• Living standards
• Local habits and painting methods
• Construction styles and available materials
• Trends in interior decoration, colors etc.
• Level of activity in new construction, renovation and
industry
• Functional paints
Markets in Western Europe mature, growth
opportunities in areas with increasing income per
household
Tikkurila has an established presence in areas with
expected growth in consumption per capita and
increasing demand for premium products* Paint consumption source: Management estimates, IPPIC
0
2
4
6
8
10
12
0
100
200
300
400
500
600
700
800
2000 2001 2002 2003 2004 2005 2006 2007 2008 2009 2010 2011 2012 2013 2014 2015 2016 2017
Revenue Revenue from acquisitions Divestments Adjusted operating profit margin
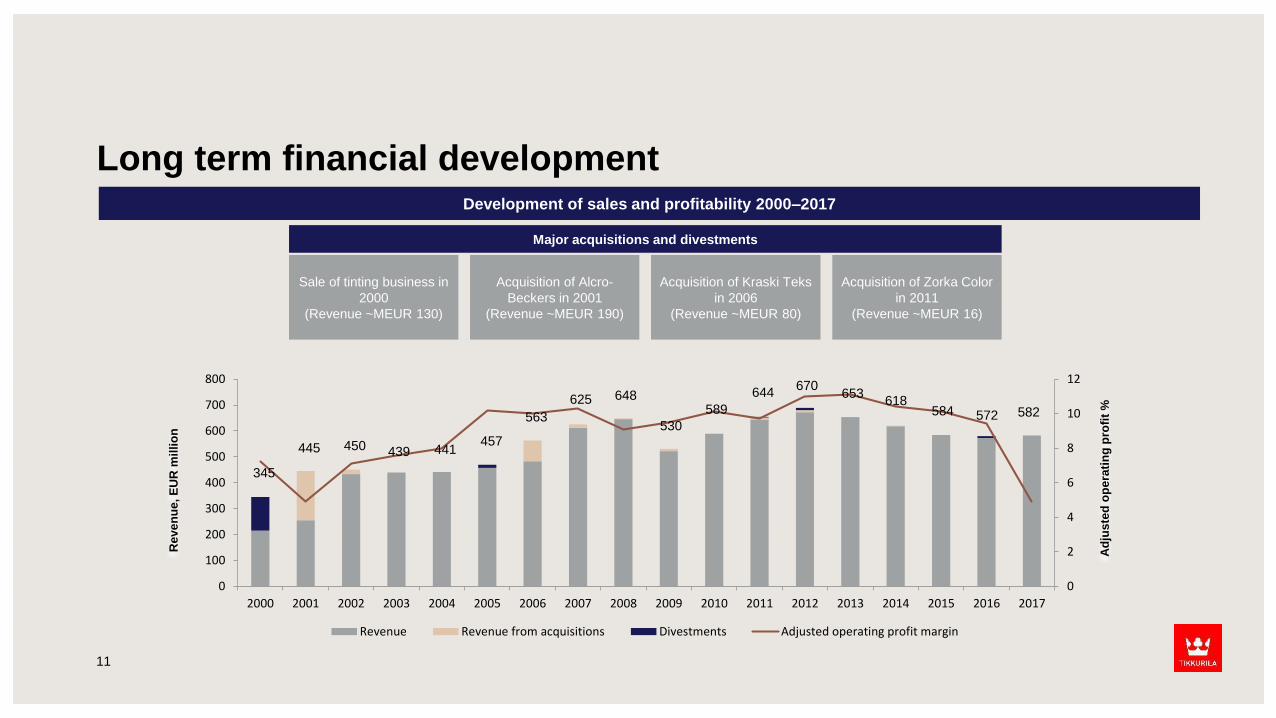
Long term financial development
11
Development of sales and profitability 2000–2017
Acquisition of Alcro-
Beckers in 2001
(Revenue ~MEUR 190)
Sale of tinting business in
2000
(Revenue ~MEUR 130)
Acquisition of Kraski Teks
in 2006
(Revenue ~MEUR 80)
Acquisition of Zorka Color
in 2011
(Revenue ~MEUR 16)
Major acquisitions and divestments
Reve
nu
e, E
UR
mil
lio
n
Ad
jus
ted
op
era
tin
g p
rofi
t %
530
648625
563
457441 439450445
345
589
644670
653618
584 572 582
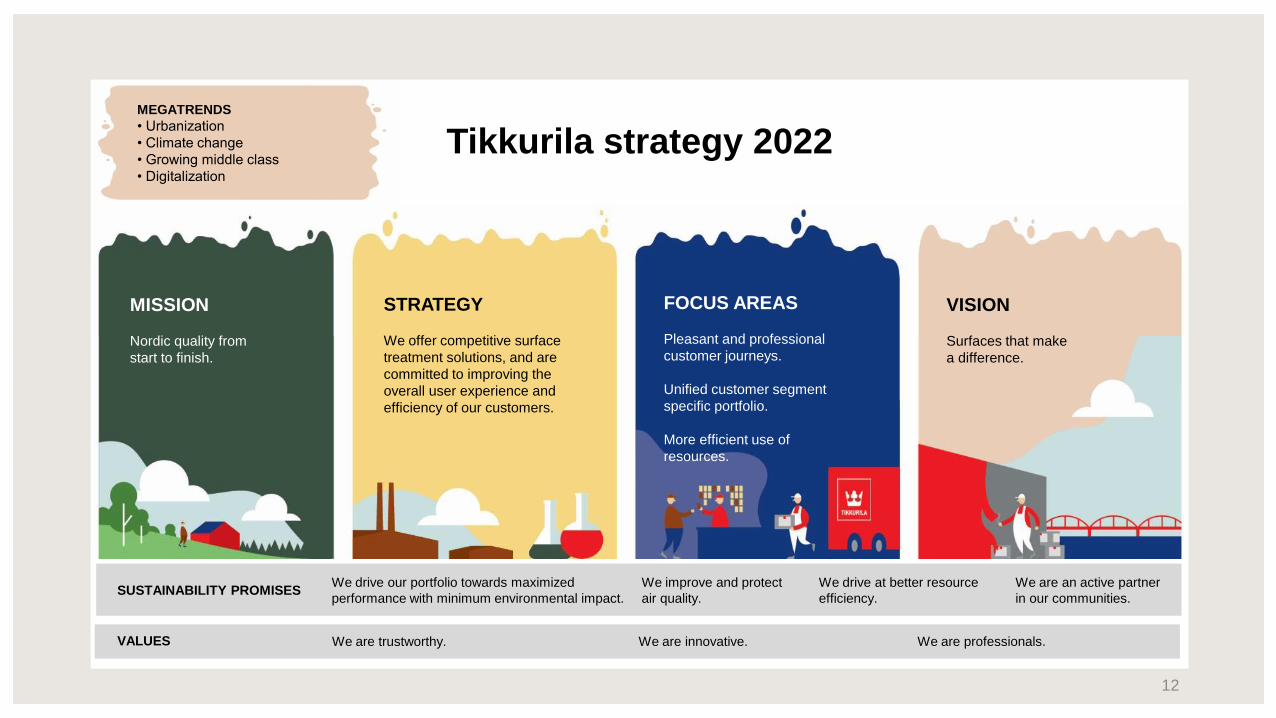
Tikkurila strategy 2022
SUSTAINABILITY PROMISESWe improve and protect
air quality.
VALUES We are trustworthy. We are innovative. We are professionals.
We drive our portfolio towards maximized
performance with minimum environmental impact.
We drive at better resource
efficiency.
We are an active partner
in our communities.
MISSION
Nordic quality from
start to finish.
STRATEGY
We offer competitive surface
treatment solutions, and are
committed to improving the
overall user experience and
efficiency of our customers.
FOCUS AREAS
Pleasant and professional
customer journeys.
Unified customer segment
specific portfolio.
More efficient use of
resources.
VISION
Surfaces that make
a difference.
MEGATRENDS
• Urbanization
• Climate change
• Growing middle class
• Digitalization
12
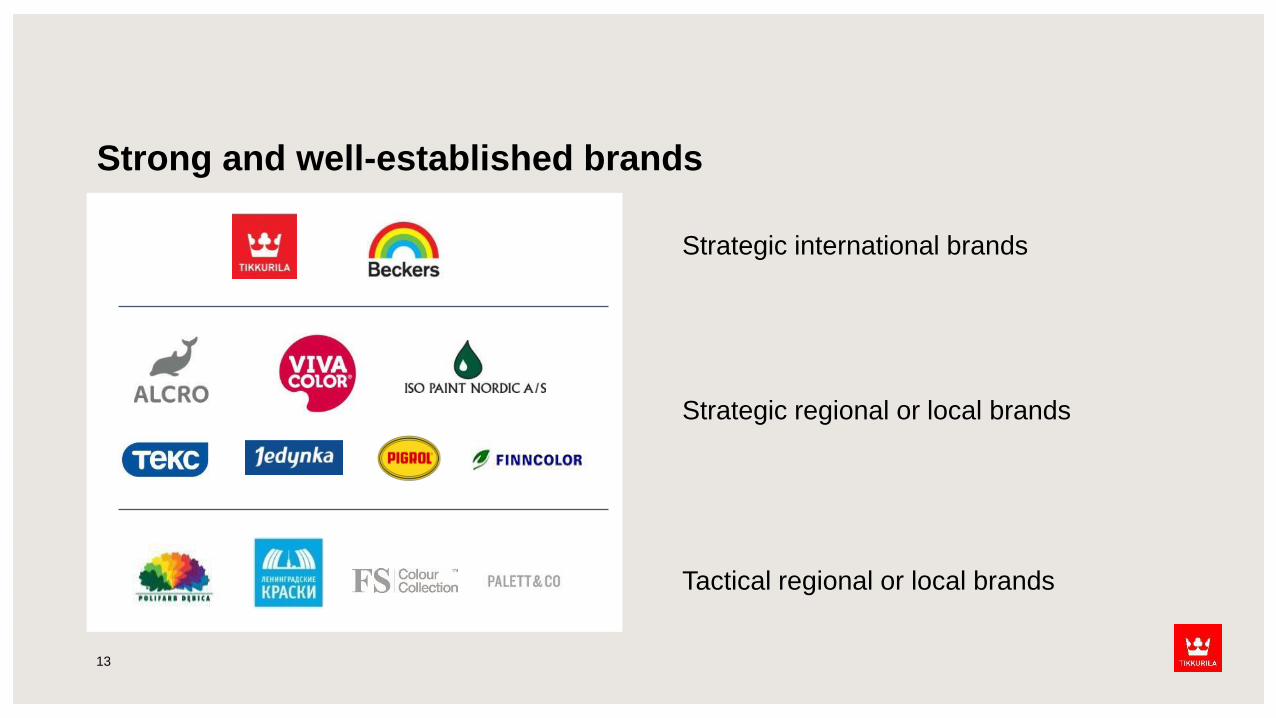
Strong and well-established brands
13
Strategic international brands
Tactical regional or local brands
Strategic regional or local brands
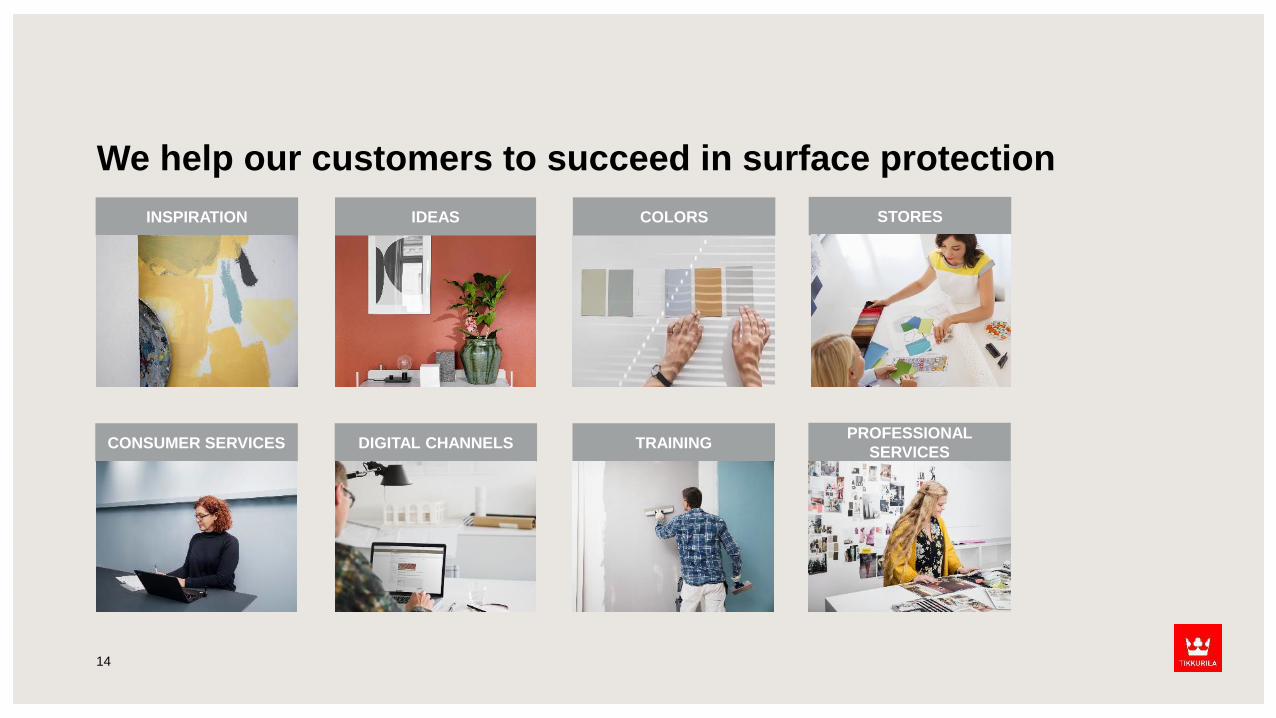
We help our customers to succeed in surface protection
14
INSPIRATION IDEAS COLORS STORES
CONSUMER SERVICES DIGITAL CHANNELS TRAININGPROFESSIONAL
SERVICES
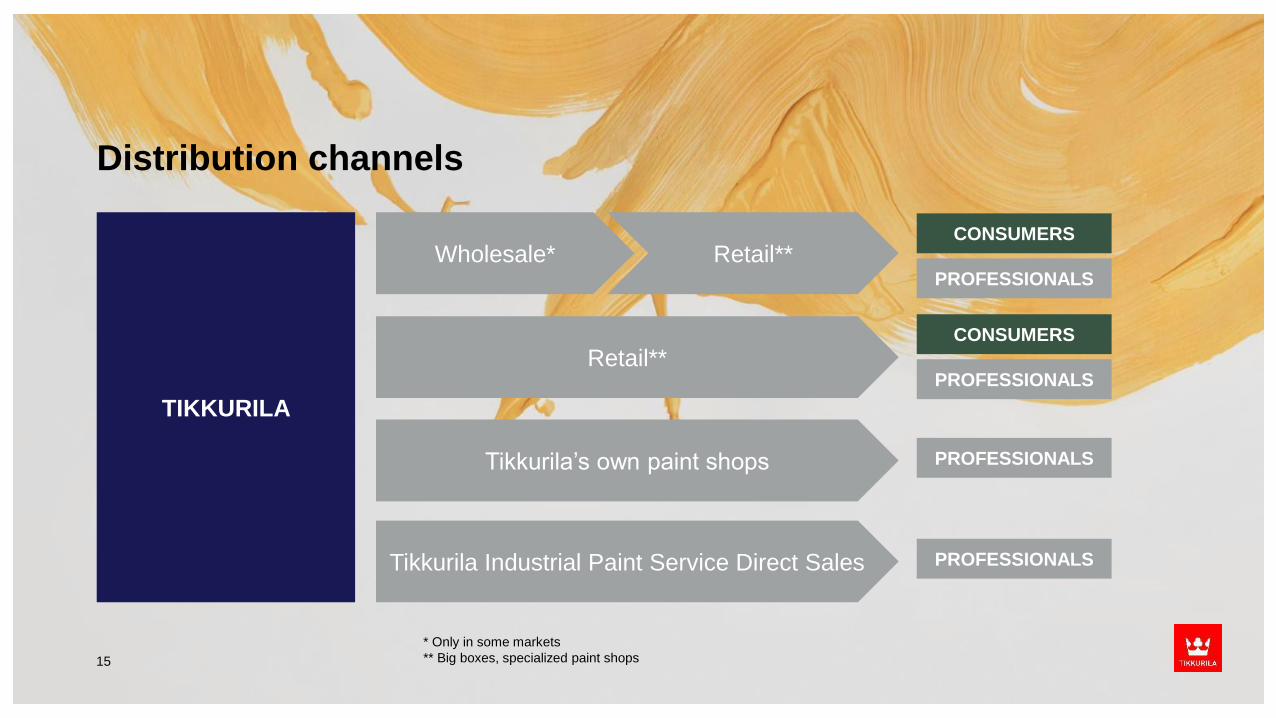
Distribution channels
15
TIKKURILA
Wholesale* Retail**
Retail**
Tikkurila’s own paint shops
Tikkurila Industrial Paint Service Direct Sales
CONSUMERS
PROFESSIONALS
CONSUMERS
PROFESSIONALS
PROFESSIONALS
PROFESSIONALS
* Only in some markets
** Big boxes, specialized paint shops
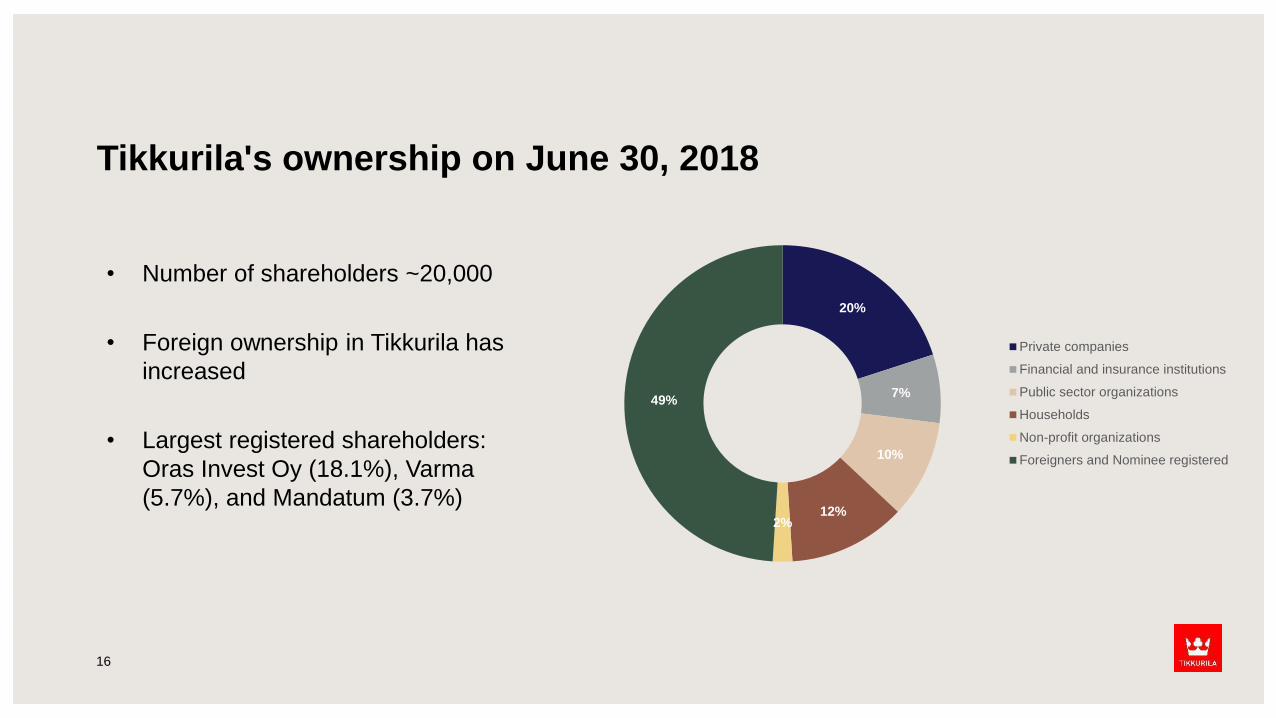
Tikkurila's ownership on June 30, 2018
16
• Number of shareholders ~20,000
• Foreign ownership in Tikkurila has
increased
• Largest registered shareholders:
Oras Invest Oy (18.1%), Varma
(5.7%), and Mandatum (3.7%)
20%
7%
10%
12%2%
49%
Private companies
Financial and insurance institutions
Public sector organizations
Households
Non-profit organizations
Foreigners and Nominee registered

Development during the review period
17
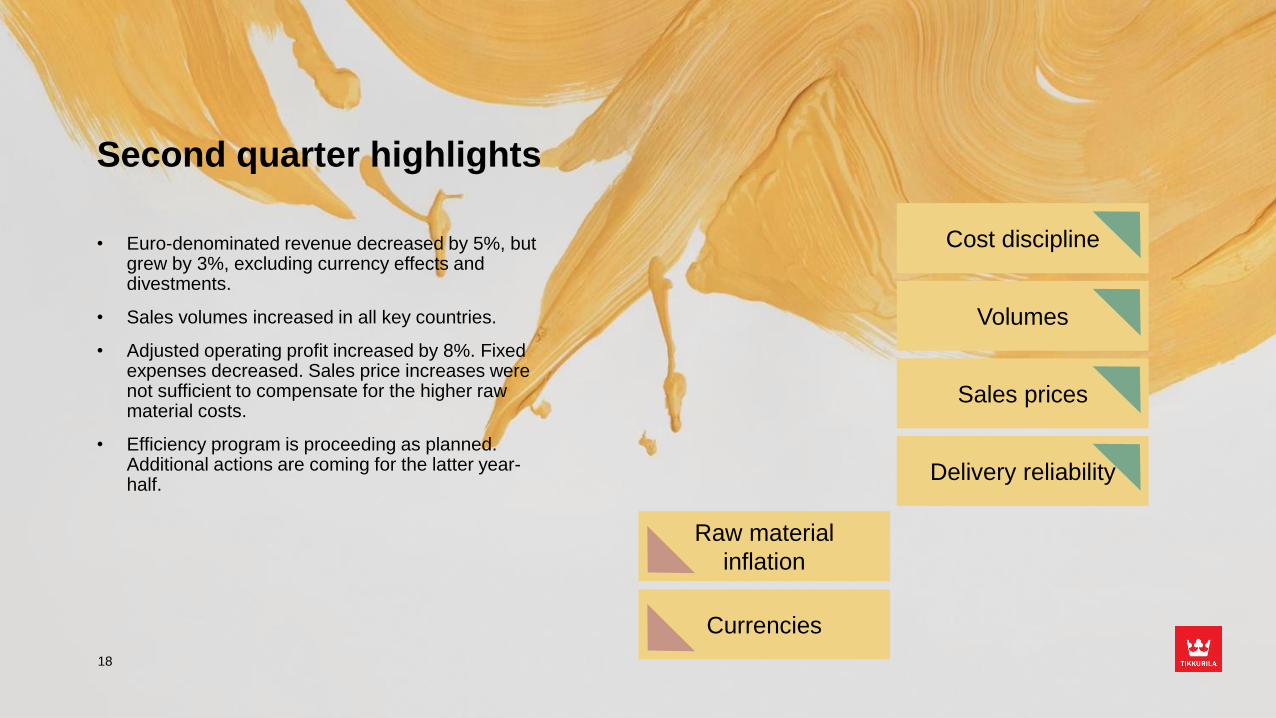
Second quarter highlights
Currencies
Raw material
inflation
Delivery reliability
Sales prices
Cost discipline
Volumes
• Euro-denominated revenue decreased by 5%, but grew by 3%, excluding currency effects and divestments.
• Sales volumes increased in all key countries.
• Adjusted operating profit increased by 8%. Fixed expenses decreased. Sales price increases were not sufficient to compensate for the higher raw material costs.
• Efficiency program is proceeding as planned. Additional actions are coming for the latter year-half.
18
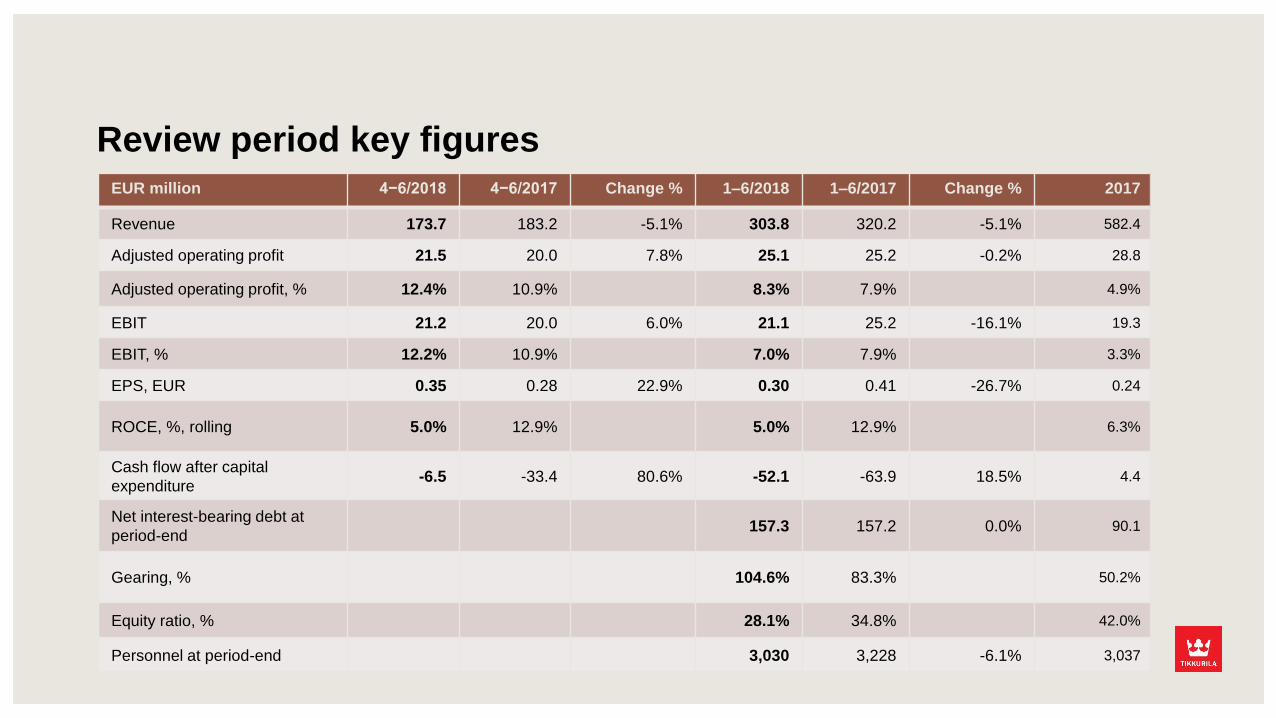
EUR million 4−6/2018 4−6/2017 Change % 1–6/2018 1–6/2017 Change % 2017
Revenue 173.7 183.2 -5.1% 303.8 320.2 -5.1% 582.4
Adjusted operating profit 21.5 20.0 7.8% 25.1 25.2 -0.2% 28.8
Adjusted operating profit, % 12.4% 10.9% 8.3% 7.9% 4.9%
EBIT 21.2 20.0 6.0% 21.1 25.2 -16.1% 19.3
EBIT, % 12.2% 10.9% 7.0% 7.9% 3.3%
EPS, EUR 0.35 0.28 22.9% 0.30 0.41 -26.7% 0.24
ROCE, %, rolling 5.0% 12.9% 5.0% 12.9% 6.3%
Cash flow after capital
expenditure-6.5 -33.4 80.6% -52.1 -63.9 18.5% 4.4
Net interest-bearing debt at
period-end157.3 157.2 0.0% 90.1
Gearing, % 104.6% 83.3% 50.2%
Equity ratio, % 28.1% 34.8% 42.0%
Personnel at period-end 3,030 3,228 -6.1% 3,037
Review period key figures
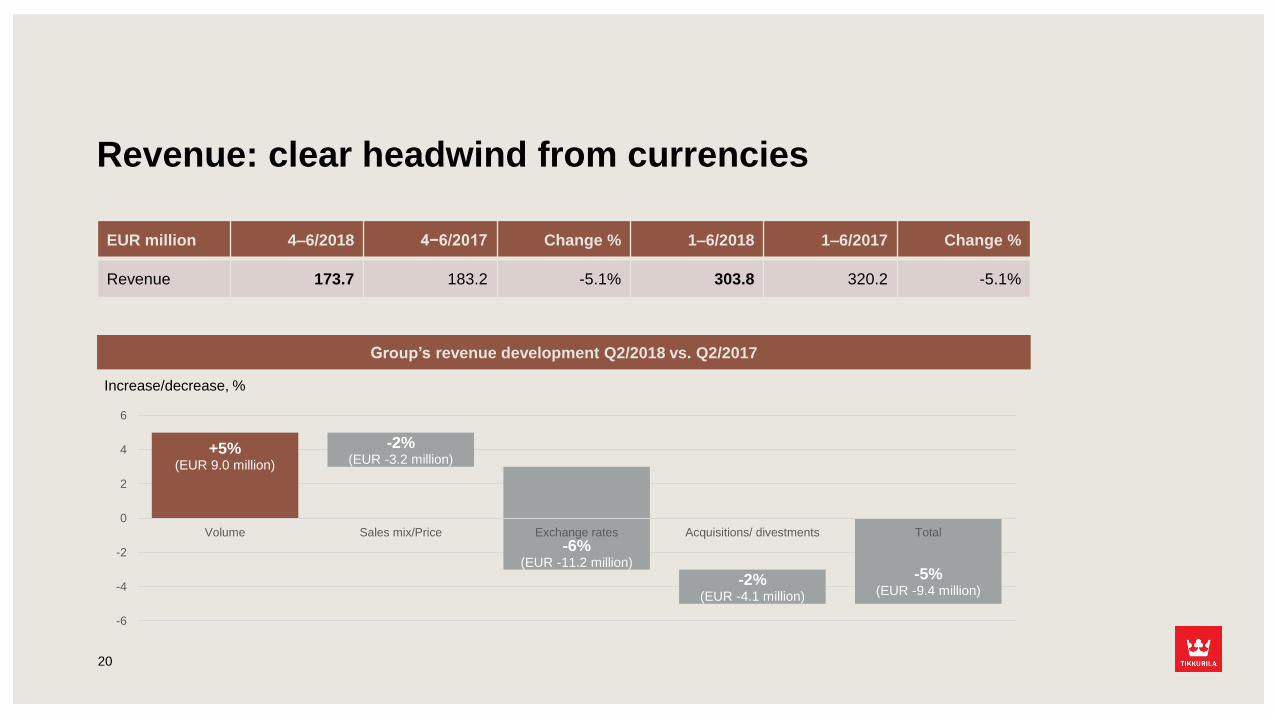
EUR million 4–6/2018 4−6/2017 Change % 1–6/2018 1–6/2017 Change %
Revenue 173.7 183.2 -5.1% 303.8 320.2 -5.1%
Group’s revenue development Q2/2018 vs. Q2/2017
20
Revenue: clear headwind from currencies
+5%(EUR 9.0 million)
-5%(EUR -9.4 million)
-2%(EUR -3.2 million)
-6%(EUR -11.2 million)
-2%(EUR -4.1 million)
-6
-4
-2
0
2
4
6
Volume Sales mix/Price Exchange rates Acquisitions/ divestments Total
Increase/decrease, %
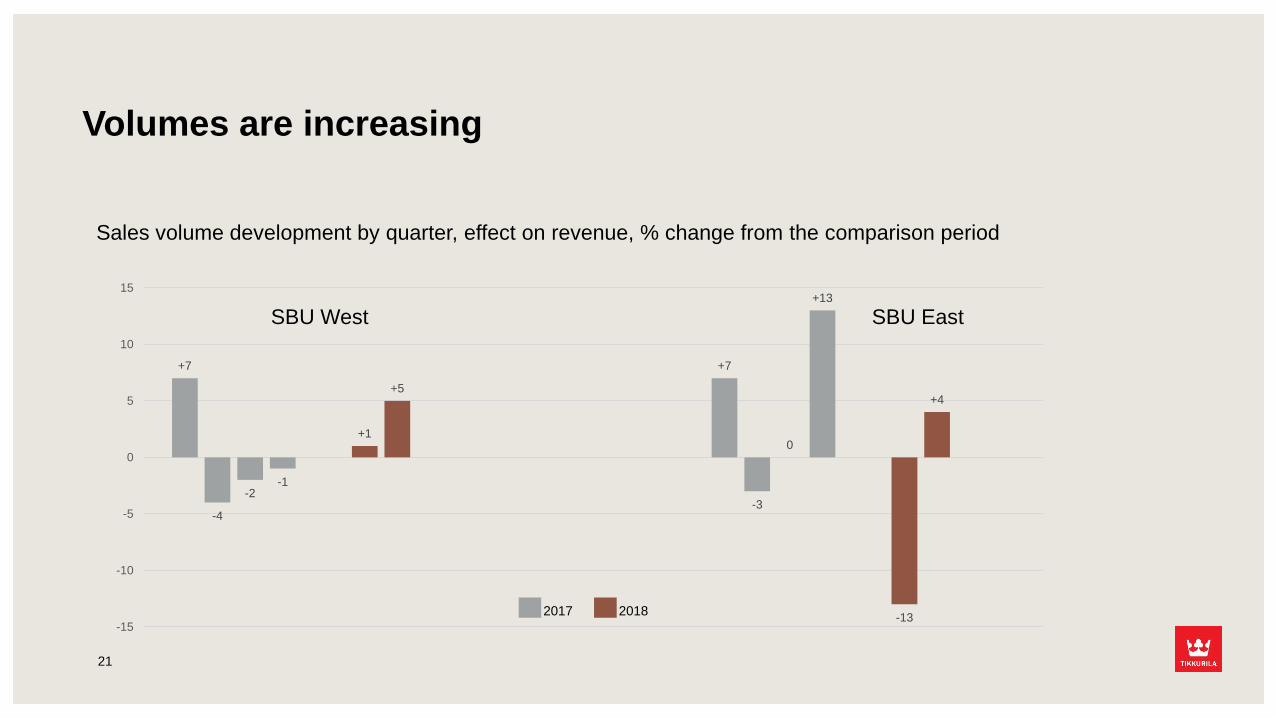
Sales volume development by quarter, effect on revenue, % change from the comparison period
2017 2018
SBU West SBU East
21
Volumes are increasing
+7
+1
+7
-13
-4
+5
-3
+4
-2
0
-1
+13
-15
-10
-5
0
5
10
15
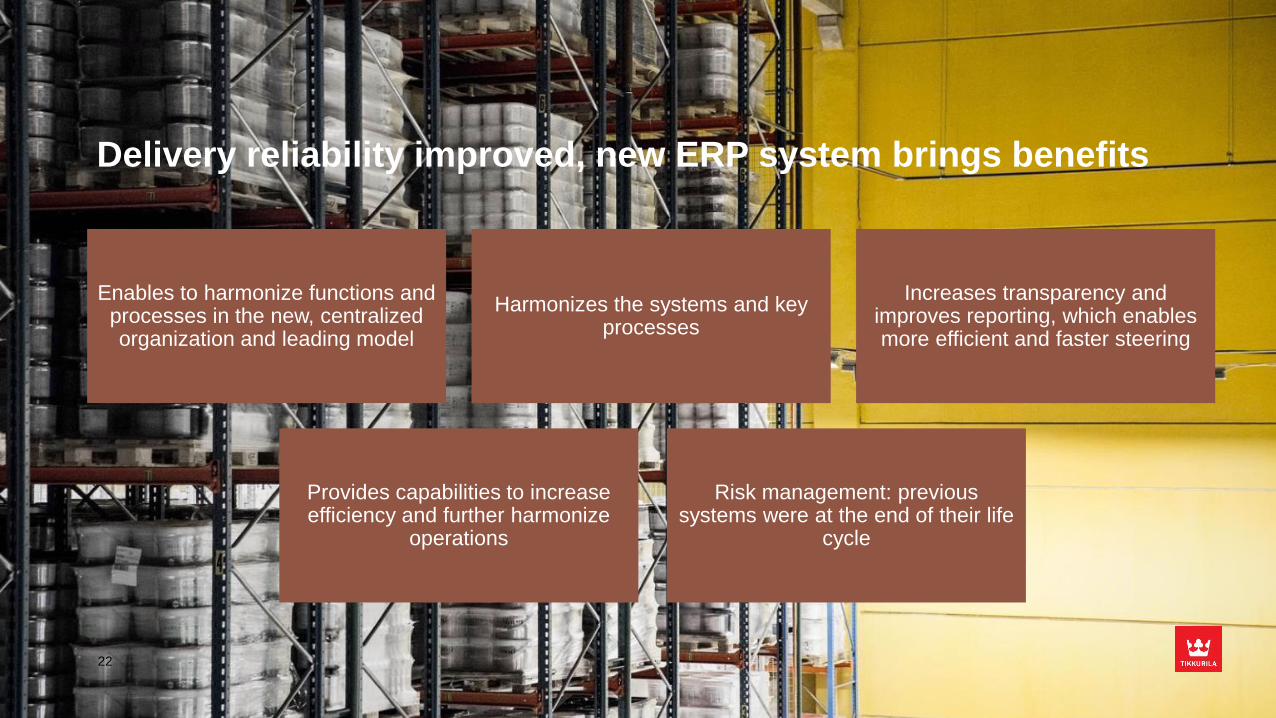
Delivery reliability improved, new ERP system brings benefits
22
Enables to harmonize functions and processes in the new, centralized organization and leading model
Harmonizes the systems and key processes
Increases transparency and improves reporting, which enables more efficient and faster steering
Provides capabilities to increase efficiency and further harmonize
operations
Risk management: previous systems were at the end of their life
cycle

Strategic Business Units
23
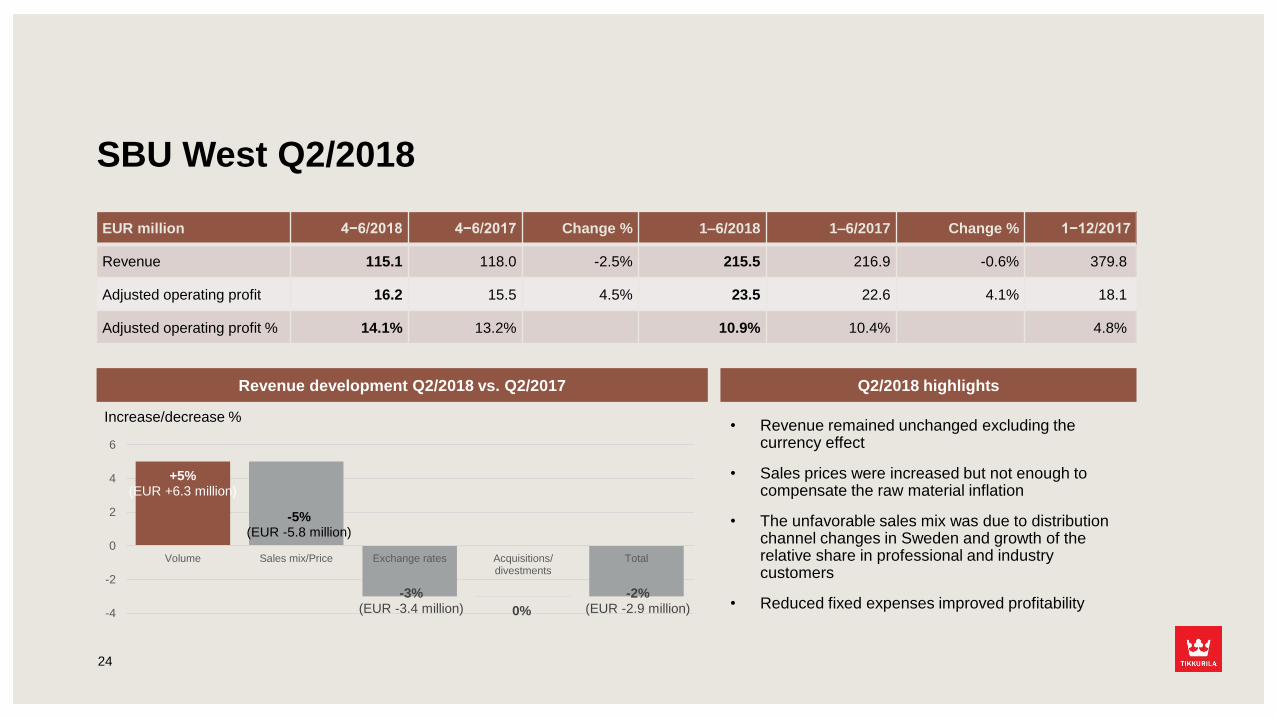
SBU West Q2/2018
EUR million 4−6/2018 4−6/2017 Change % 1–6/2018 1–6/2017 Change % 1−12/2017
Revenue 115.1 118.0 -2.5% 215.5 216.9 -0.6% 379.8
Adjusted operating profit 16.2 15.5 4.5% 23.5 22.6 4.1% 18.1
Adjusted operating profit % 14.1% 13.2% 10.9% 10.4% 4.8%
Increase/decrease %
Revenue development Q2/2018 vs. Q2/2017 Q2/2018 highlights
• Revenue remained unchanged excluding the currency effect
• Sales prices were increased but not enough to compensate the raw material inflation
• The unfavorable sales mix was due to distribution channel changes in Sweden and growth of the relative share in professional and industry customers
• Reduced fixed expenses improved profitability
24
+5%(EUR +6.3 million)
-5%(EUR -5.8 million)
-3%(EUR -3.4 million) 0%
-2%(EUR -2.9 million)-4
-2
0
2
4
6
Volume Sales mix/Price Exchange rates Acquisitions/divestments
Total
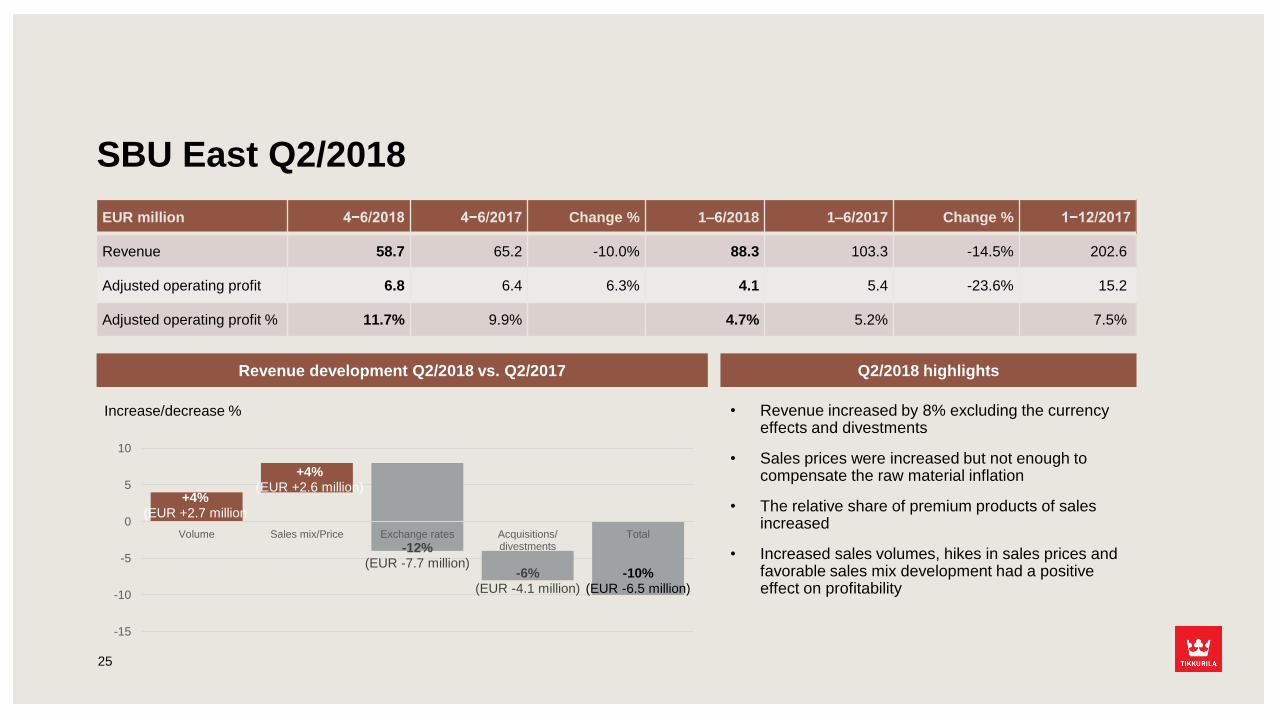
SBU East Q2/2018
EUR million 4−6/2018 4−6/2017 Change % 1–6/2018 1–6/2017 Change % 1−12/2017
Revenue 58.7 65.2 -10.0% 88.3 103.3 -14.5% 202.6
Adjusted operating profit 6.8 6.4 6.3% 4.1 5.4 -23.6% 15.2
Adjusted operating profit % 11.7% 9.9% 4.7% 5.2% 7.5%
Revenue development Q2/2018 vs. Q2/2017 Q2/2018 highlights
• Revenue increased by 8% excluding the currency effects and divestments
• Sales prices were increased but not enough to compensate the raw material inflation
• The relative share of premium products of sales increased
• Increased sales volumes, hikes in sales prices and favorable sales mix development had a positive effect on profitability
25
Increase/decrease %
+4%(EUR +2.7 million
-10%(EUR -6.5 million)
+4%(EUR +2.6 million)
-12%(EUR -7.7 million)
-6%(EUR -4.1 million)
-15
-10
-5
0
5
10
Volume Sales mix/Price Exchange rates Acquisitions/divestments
Total
Proceeding of efficiency program and strategic actions
26
Tikkurila Oyj
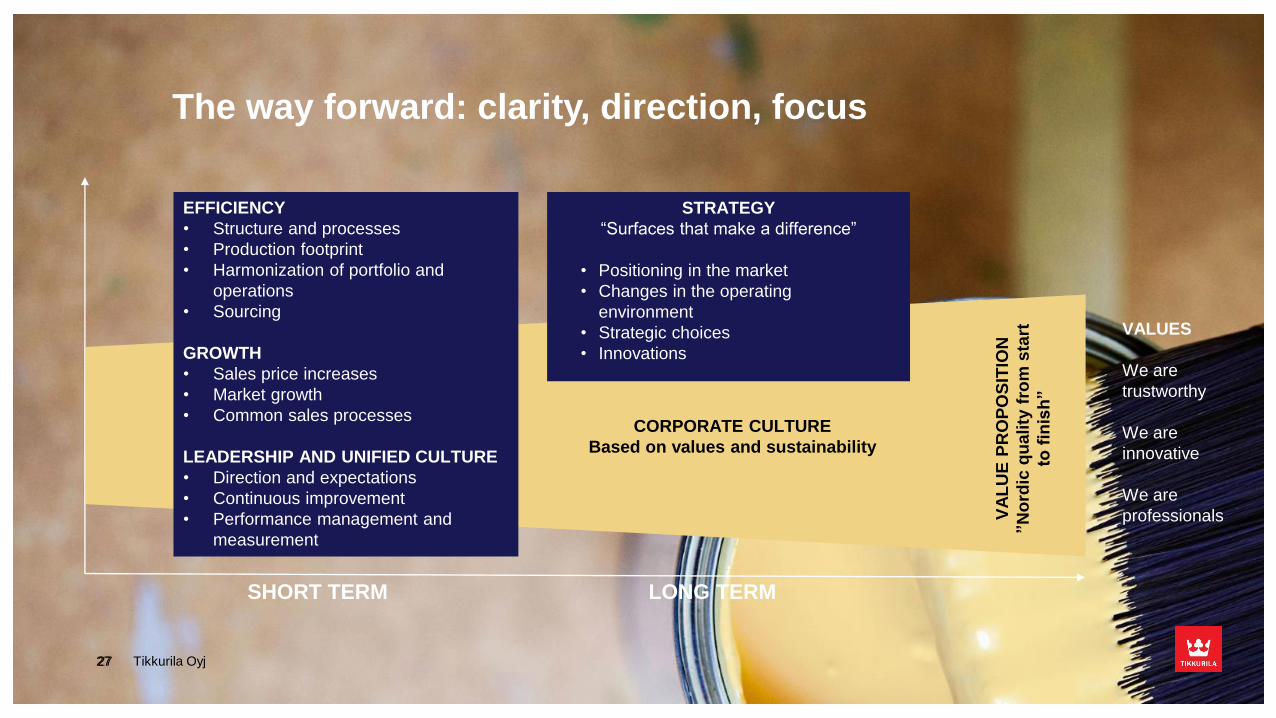
SHORT TERM LONG TERM
EFFICIENCY
• Structure and processes
• Production footprint
• Harmonization of portfolio and
operations
• Sourcing
GROWTH
• Sales price increases
• Market growth
• Common sales processes
LEADERSHIP AND UNIFIED CULTURE
• Direction and expectations
• Continuous improvement
• Performance management and
measurement
VA
LU
E P
RO
PO
SIT
ION
”N
ord
ic q
uality
fro
m s
tart
to f
inis
h”
CORPORATE CULTURE
Based on values and sustainability
STRATEGY
“Surfaces that make a difference”
• Positioning in the market
• Changes in the operating
environment
• Strategic choices
• Innovations
The way forward: clarity, direction, focus
27
VALUES
We are
trustworthy
We are
innovative
We are
professionals
27
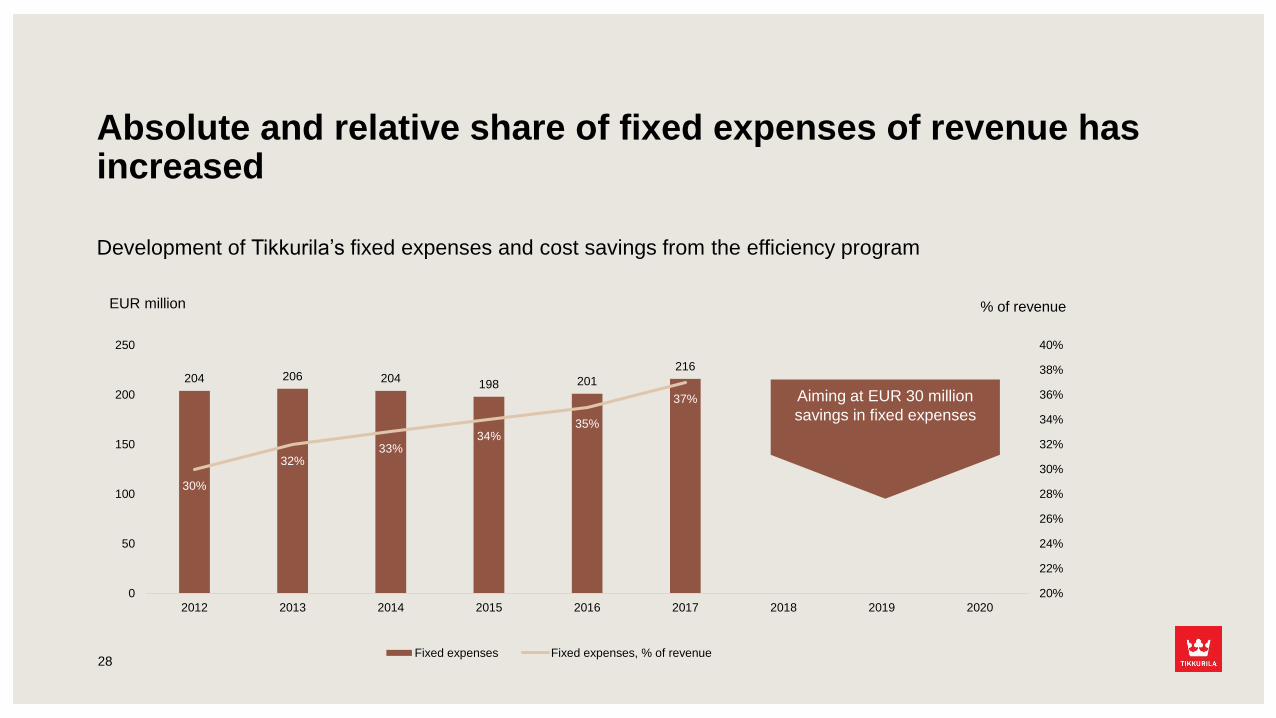
204 206 204198 201
216
30%
32%33%
34%35%
37%
20%
22%
24%
26%
28%
30%
32%
34%
36%
38%
40%
0
50
100
150
200
250
2012 2013 2014 2015 2016 2017 2018 2019 2020
Fixed expenses Fixed expenses, % of revenue
Absolute and relative share of fixed expenses of revenue has increased
Development of Tikkurila’s fixed expenses and cost savings from the efficiency program
EUR million % of revenue
Aiming at EUR 30 million
savings in fixed expenses
28
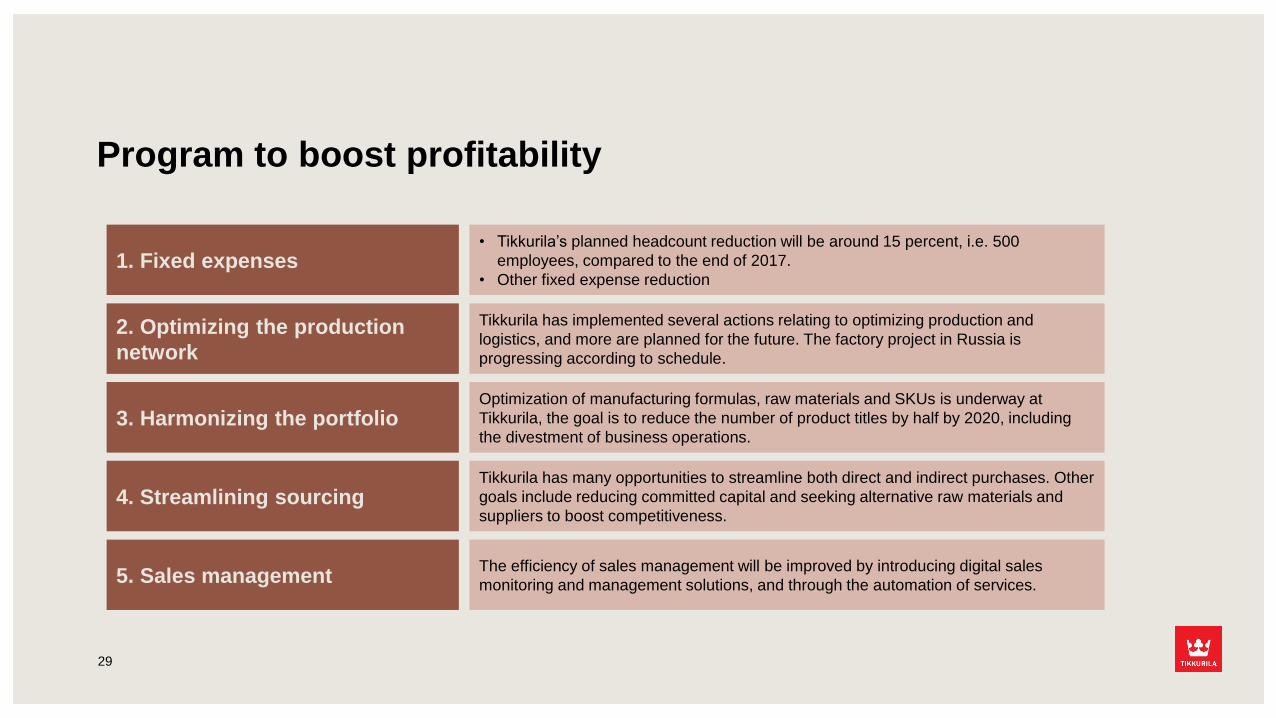
Program to boost profitability
29
1. Fixed expenses
2. Optimizing the production
network
3. Harmonizing the portfolio
4. Streamlining sourcing
5. Sales management
• Tikkurila’s planned headcount reduction will be around 15 percent, i.e. 500
employees, compared to the end of 2017.
• Other fixed expense reduction
Tikkurila has implemented several actions relating to optimizing production and
logistics, and more are planned for the future. The factory project in Russia is
progressing according to schedule.
Optimization of manufacturing formulas, raw materials and SKUs is underway at
Tikkurila, the goal is to reduce the number of product titles by half by 2020, including
the divestment of business operations.
Tikkurila has many opportunities to streamline both direct and indirect purchases. Other
goals include reducing committed capital and seeking alternative raw materials and
suppliers to boost competitiveness.
The efficiency of sales management will be improved by introducing digital sales
monitoring and management solutions, and through the automation of services.
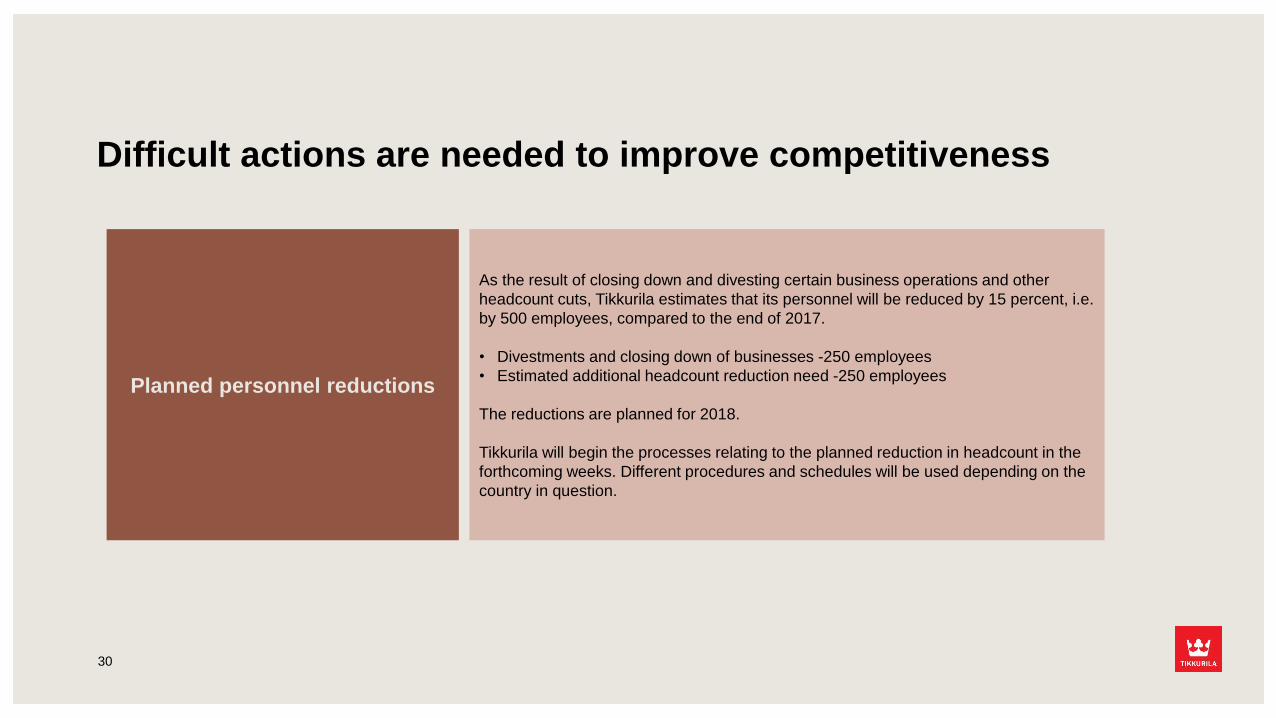
Difficult actions are needed to improve competitiveness
30
Planned personnel reductions
As the result of closing down and divesting certain business operations and other
headcount cuts, Tikkurila estimates that its personnel will be reduced by 15 percent, i.e.
by 500 employees, compared to the end of 2017.
• Divestments and closing down of businesses -250 employees
• Estimated additional headcount reduction need -250 employees
The reductions are planned for 2018.
Tikkurila will begin the processes relating to the planned reduction in headcount in the
forthcoming weeks. Different procedures and schedules will be used depending on the
country in question.
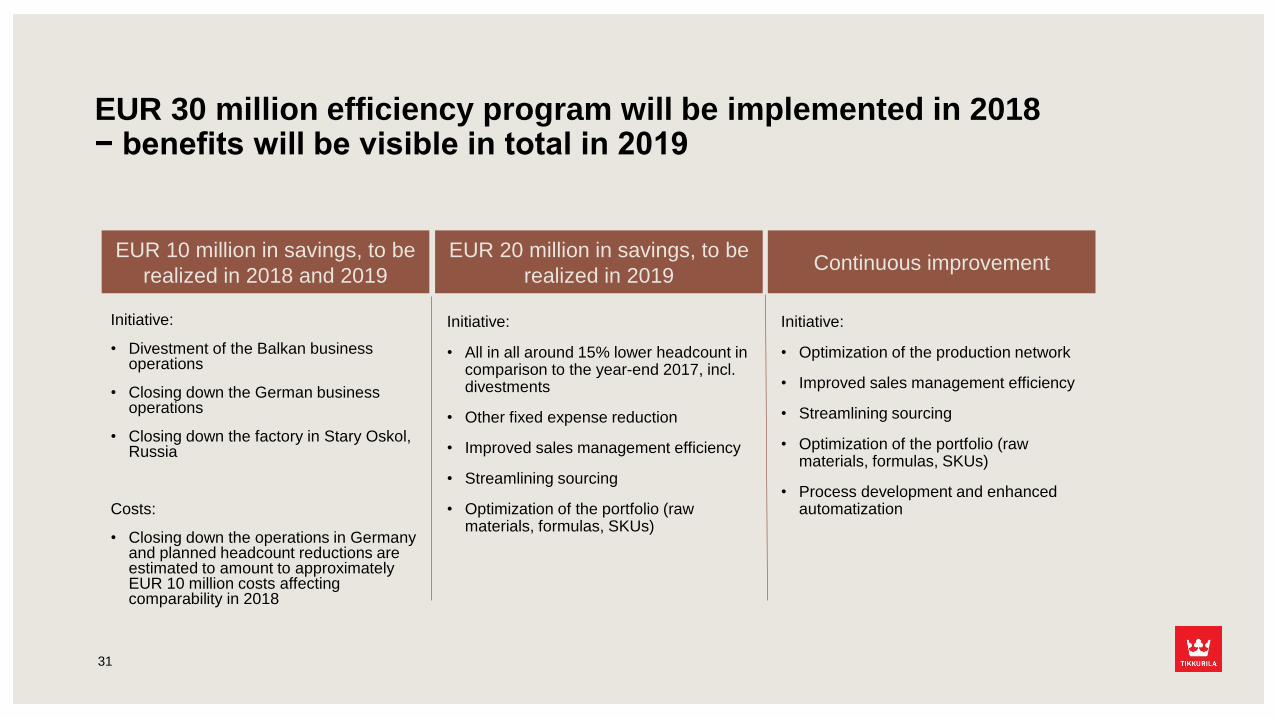
EUR 30 million efficiency program will be implemented in 2018− benefits will be visible in total in 2019
EUR 20 million in savings, to be
realized in 2019
Initiative:
• All in all around 15% lower headcount in comparison to the year-end 2017, incl. divestments
• Other fixed expense reduction
• Improved sales management efficiency
• Streamlining sourcing
• Optimization of the portfolio (raw materials, formulas, SKUs)
Continuous improvement
Initiative:
• Optimization of the production network
• Improved sales management efficiency
• Streamlining sourcing
• Optimization of the portfolio (raw materials, formulas, SKUs)
• Process development and enhanced automatization
31
EUR 10 million in savings, to be
realized in 2018 and 2019
Initiative:
• Divestment of the Balkan business operations
• Closing down the German business operations
• Closing down the factory in Stary Oskol, Russia
Costs:
• Closing down the operations in Germany and planned headcount reductions are estimated to amount to approximately EUR 10 million costs affecting comparability in 2018
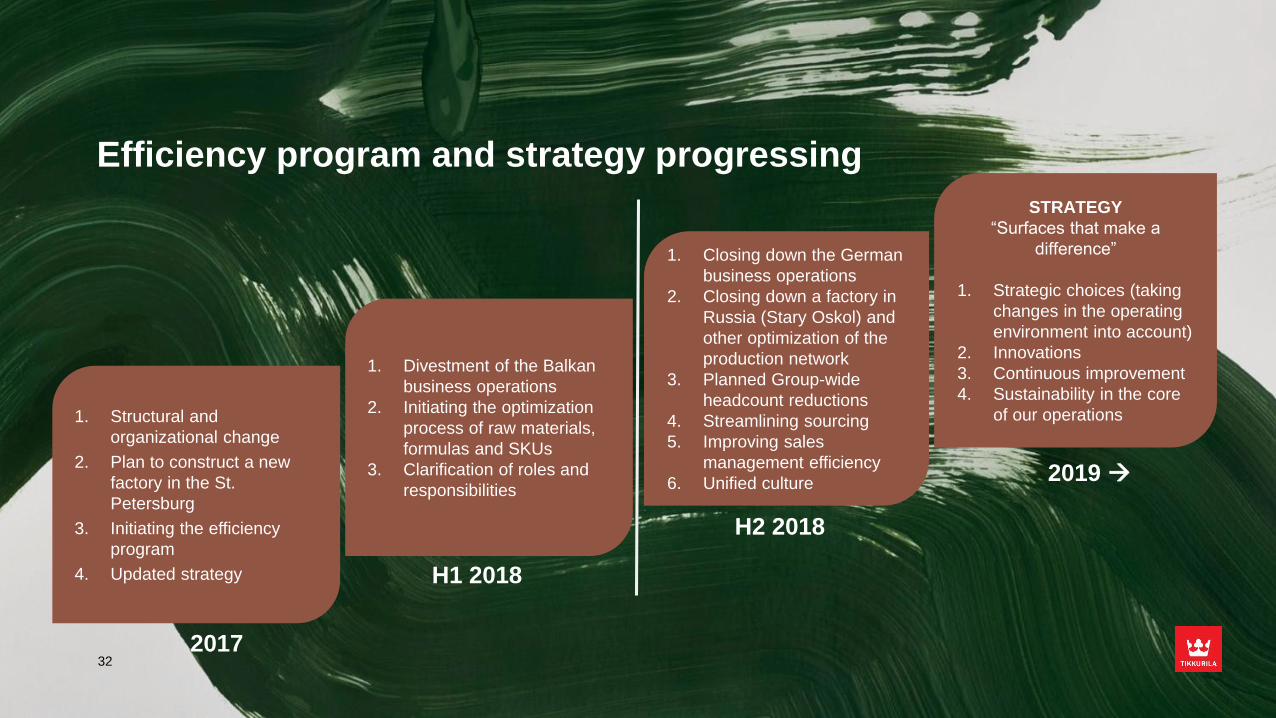
Efficiency program and strategy progressing
2017
1. Structural and
organizational change
2. Plan to construct a new
factory in the St.
Petersburg
3. Initiating the efficiency
program
4. Updated strategy
1. Closing down the German
business operations
2. Closing down a factory in
Russia (Stary Oskol) and
other optimization of the
production network
3. Planned Group-wide
headcount reductions
4. Streamlining sourcing
5. Improving sales
management efficiency
6. Unified culture
H2 2018
STRATEGY
“Surfaces that make a
difference”
1. Strategic choices (taking
changes in the operating
environment into account)
2. Innovations
3. Continuous improvement
4. Sustainability in the core
of our operations
2019 →
32
1. Divestment of the Balkan
business operations
2. Initiating the optimization
process of raw materials,
formulas and SKUs
3. Clarification of roles and
responsibilities
H1 2018
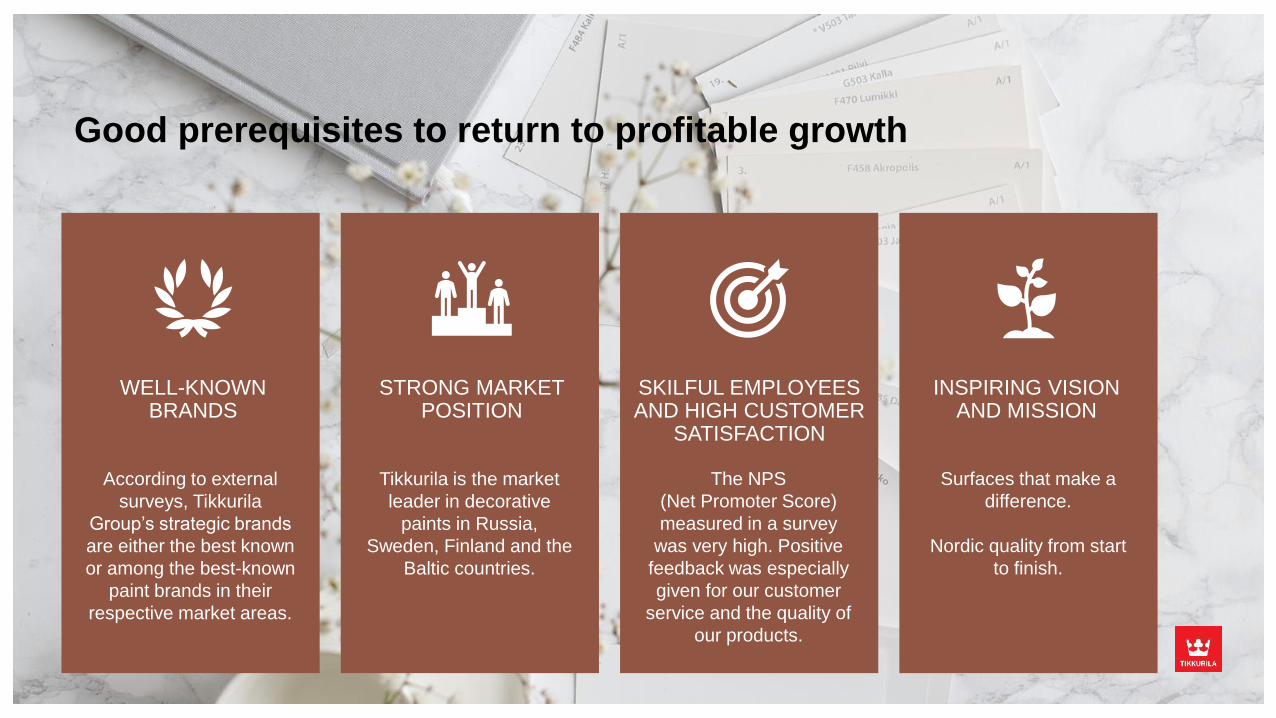
Good prerequisites to return to profitable growth
WELL-KNOWN BRANDS
STRONG MARKET POSITION
SKILFUL EMPLOYEES AND HIGH CUSTOMER
SATISFACTION
INSPIRING VISION AND MISSION
Surfaces that make a
difference.
Nordic quality from start
to finish.
The NPS
(Net Promoter Score)
measured in a survey
was very high. Positive
feedback was especially
given for our customer
service and the quality of
our products.
Tikkurila is the market
leader in decorative
paints in Russia,
Sweden, Finland and the
Baltic countries.
According to external
surveys, Tikkurila
Group’s strategic brands
are either the best known
or among the best-known
paint brands in their
respective market areas.
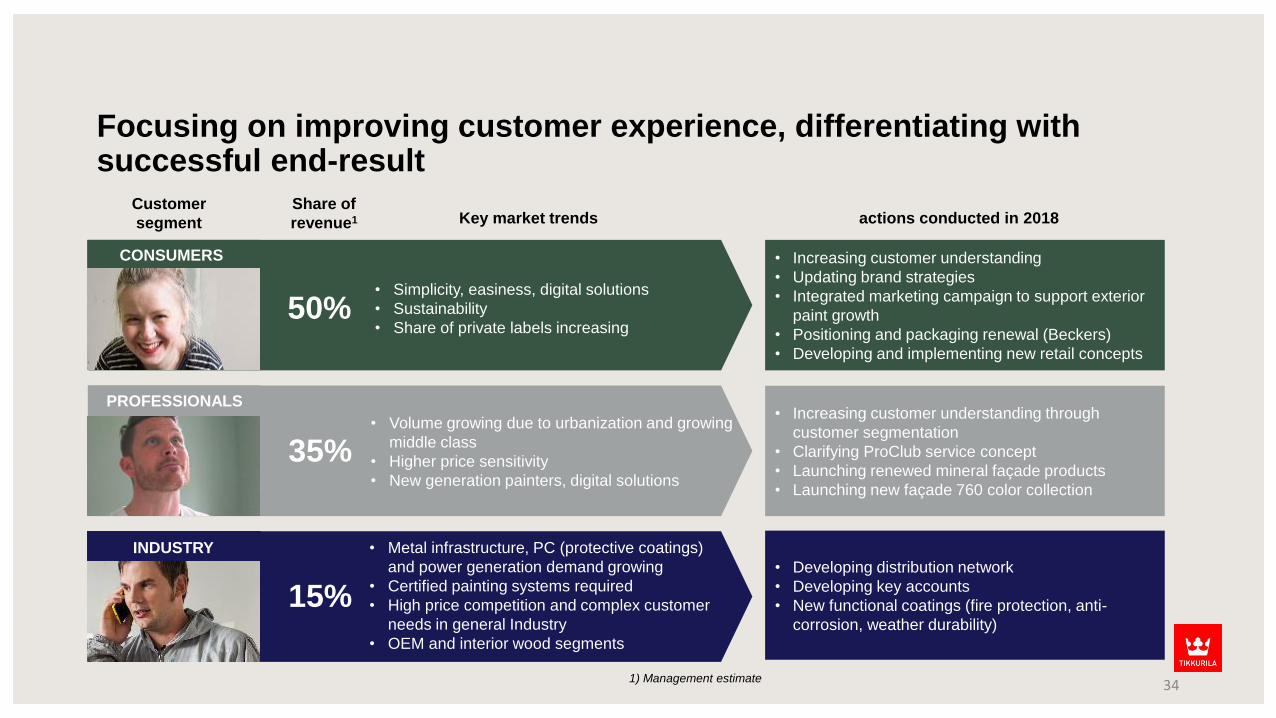
Focusing on improving customer experience, differentiating with successful end-result
• Metal infrastructure, PC (protective coatings)
and power generation demand growing
• Certified painting systems required
• High price competition and complex customer
needs in general Industry
• OEM and interior wood segments
• Simplicity, easiness, digital solutions
• Sustainability
• Share of private labels increasing
• Volume growing due to urbanization and growing
middle class
• Higher price sensitivity
• New generation painters, digital solutions
50%
Share of
revenue1
Customer
segment Key market trends
• Developing distribution network
• Developing key accounts
• New functional coatings (fire protection, anti-
corrosion, weather durability)
• Increasing customer understanding
• Updating brand strategies
• Integrated marketing campaign to support exterior
paint growth
• Positioning and packaging renewal (Beckers)
• Developing and implementing new retail concepts
• Increasing customer understanding through
customer segmentation
• Clarifying ProClub service concept
• Launching renewed mineral façade products
• Launching new façade 760 color collection
actions conducted in 2018
CONSUMERS
PROFESSIONALS
INDUSTRY
1) Management estimate
35%
15%
34
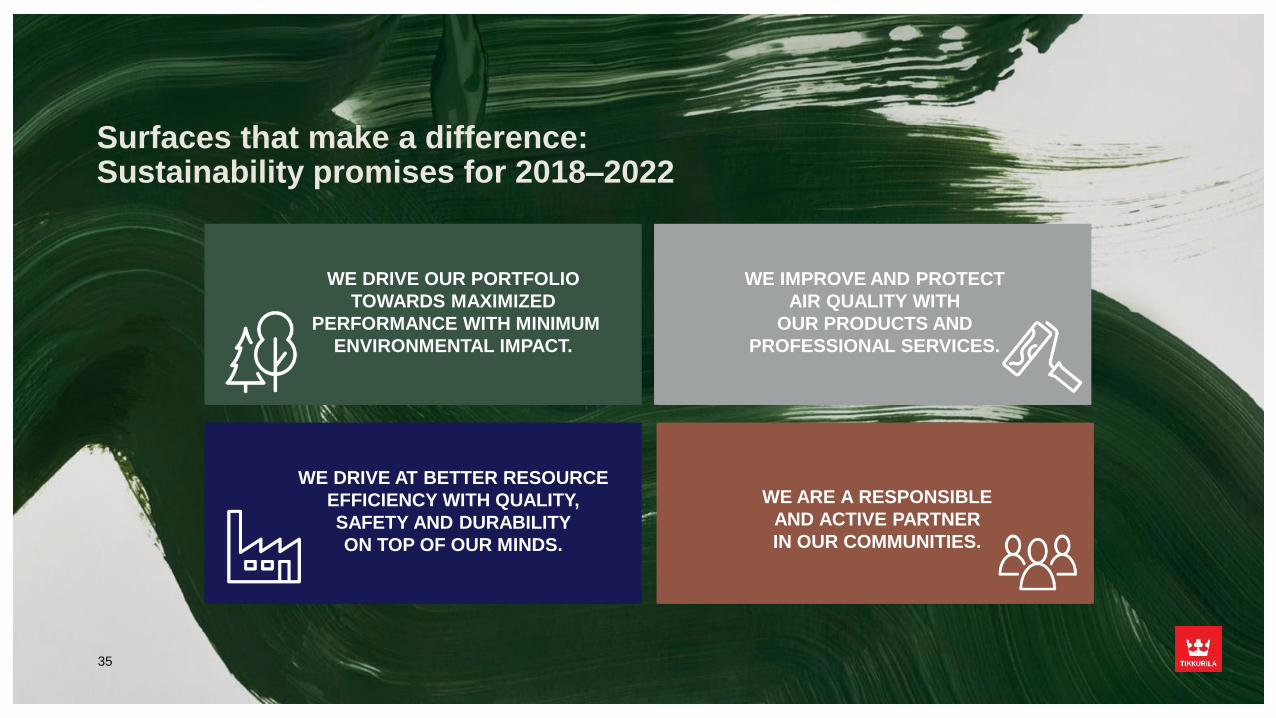
Surfaces that make a difference:Sustainability promises for 2018–2022
WE DRIVE OUR PORTFOLIO
TOWARDS MAXIMIZED
PERFORMANCE WITH MINIMUM
ENVIRONMENTAL IMPACT.
WE IMPROVE AND PROTECT
AIR QUALITY WITH
OUR PRODUCTS AND
PROFESSIONAL SERVICES.
WE DRIVE AT BETTER RESOURCE
EFFICIENCY WITH QUALITY,
SAFETY AND DURABILITY
ON TOP OF OUR MINDS.
WE ARE A RESPONSIBLE
AND ACTIVE PARTNER
IN OUR COMMUNITIES.
35

Conclusions and outlook
36
Conclusions
37
• Program to boost profitability is proceeding as planned, significant actions
planned for the latter year-half
• Market outlook is fairly good for the rest of the year, positive volume
development is expected to continue
• Raw material prices are anticipated to continue to rise, we will continue to
increase our own sales prices
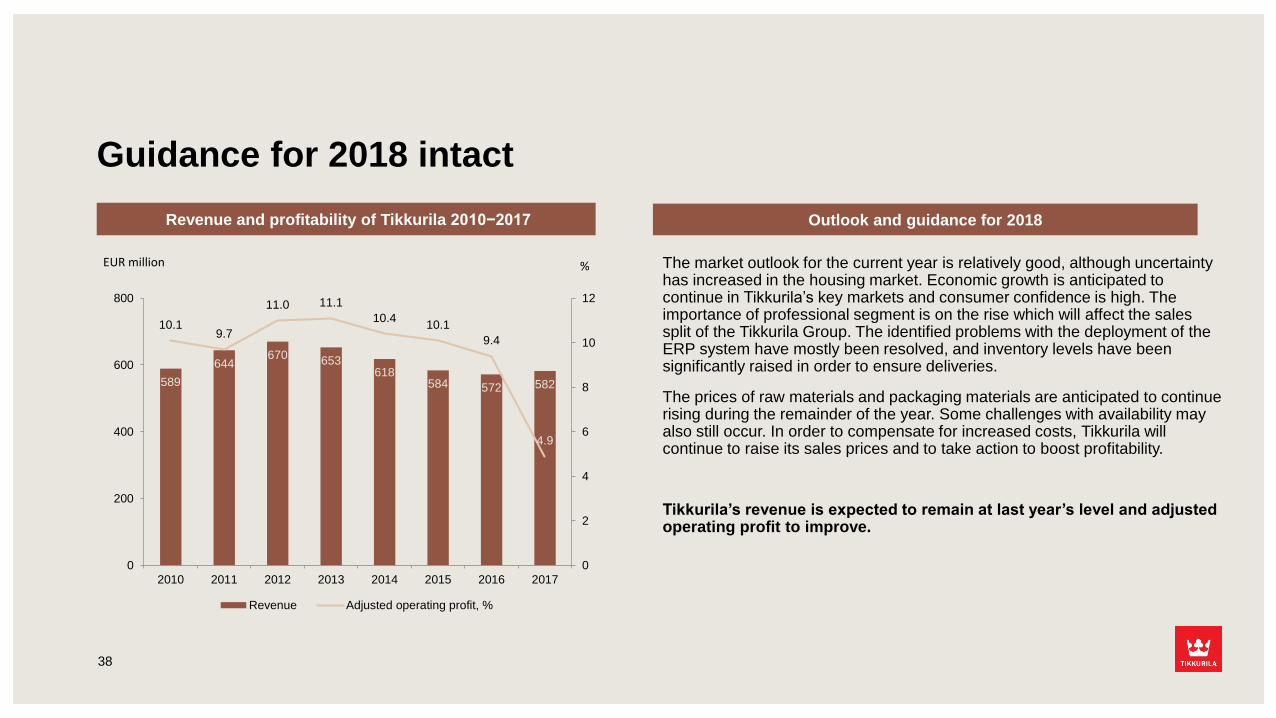
Guidance for 2018 intact
Revenue and profitability of Tikkurila 2010−2017 Outlook and guidance for 2018
589
644670
653618
584 572 582
10.19.7
11.0 11.1
10.410.1
9.4
4.9
0
2
4
6
8
10
12
0
200
400
600
800
2010 2011 2012 2013 2014 2015 2016 2017
Revenue Adjusted operating profit, %
EUR million % The market outlook for the current year is relatively good, although uncertainty has increased in the housing market. Economic growth is anticipated to continue in Tikkurila’s key markets and consumer confidence is high. The importance of professional segment is on the rise which will affect the sales split of the Tikkurila Group. The identified problems with the deployment of the ERP system have mostly been resolved, and inventory levels have been significantly raised in order to ensure deliveries.
The prices of raw materials and packaging materials are anticipated to continue rising during the remainder of the year. Some challenges with availability may also still occur. In order to compensate for increased costs, Tikkurila will continue to raise its sales prices and to take action to boost profitability.
Tikkurila’s revenue is expected to remain at last year’s level and adjusted operating profit to improve.
38

Appendix
39
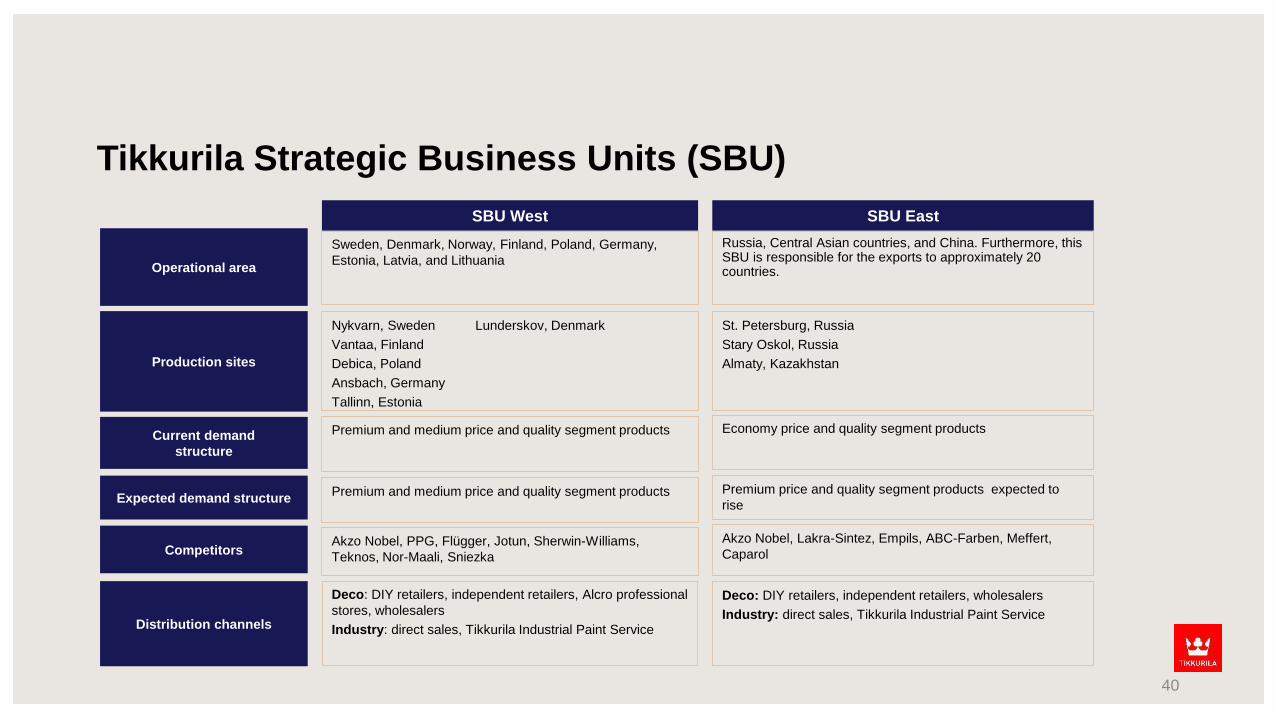
Tikkurila Strategic Business Units (SBU)
Russia, Central Asian countries, and China. Furthermore, this SBU is responsible for the exports to approximately 20 countries.
SBU EastSBU West
Sweden, Denmark, Norway, Finland, Poland, Germany,
Estonia, Latvia, and LithuaniaOperational area
Production sites
Current demand
structure
Expected demand structure
Competitors
Distribution channels
St. Petersburg, Russia
Stary Oskol, Russia
Almaty, Kazakhstan
Nykvarn, Sweden Lunderskov, Denmark
Vantaa, Finland
Debica, Poland
Ansbach, Germany
Tallinn, Estonia
Economy price and quality segment productsPremium and medium price and quality segment products
Premium price and quality segment products expected to
risePremium and medium price and quality segment products
Akzo Nobel, Lakra-Sintez, Empils, ABC-Farben, Meffert,
CaparolAkzo Nobel, PPG, Flügger, Jotun, Sherwin-Williams,
Teknos, Nor-Maali, Sniezka
Deco: DIY retailers, independent retailers, wholesalers
Industry: direct sales, Tikkurila Industrial Paint Service
Deco: DIY retailers, independent retailers, Alcro professional
stores, wholesalers
Industry: direct sales, Tikkurila Industrial Paint Service
40
VantaaNykvarnOslo
CopenhagenStockholm
Tallinn
Riga
Vilnius
AnsbachDebica
WarsawLodz
Lunderskov
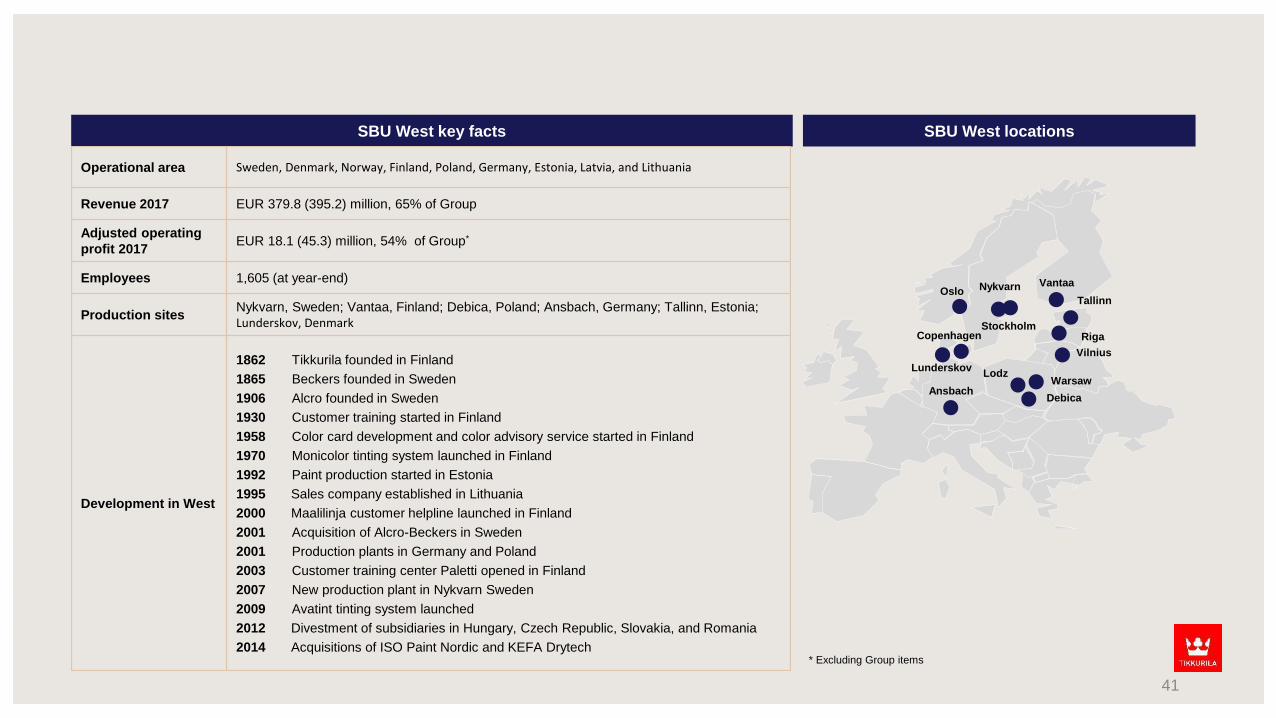
SBU West key facts
Operational area Sweden, Denmark, Norway, Finland, Poland, Germany, Estonia, Latvia, and Lithuania
Revenue 2017 EUR 379.8 (395.2) million, 65% of Group
Adjusted operating
profit 2017EUR 18.1 (45.3) million, 54% of Group*
Employees 1,605 (at year-end)
Production sitesNykvarn, Sweden; Vantaa, Finland; Debica, Poland; Ansbach, Germany; Tallinn, Estonia;
Lunderskov, Denmark
Development in West
1862 Tikkurila founded in Finland
1865 Beckers founded in Sweden
1906 Alcro founded in Sweden
1930 Customer training started in Finland
1958 Color card development and color advisory service started in Finland
1970 Monicolor tinting system launched in Finland
1992 Paint production started in Estonia
1995 Sales company established in Lithuania
2000 Maalilinja customer helpline launched in Finland
2001 Acquisition of Alcro-Beckers in Sweden
2001 Production plants in Germany and Poland
2003 Customer training center Paletti opened in Finland
2007 New production plant in Nykvarn Sweden
2009 Avatint tinting system launched
2012 Divestment of subsidiaries in Hungary, Czech Republic, Slovakia, and Romania
2014 Acquisitions of ISO Paint Nordic and KEFA Drytech
SBU West locations
* Excluding Group items
41
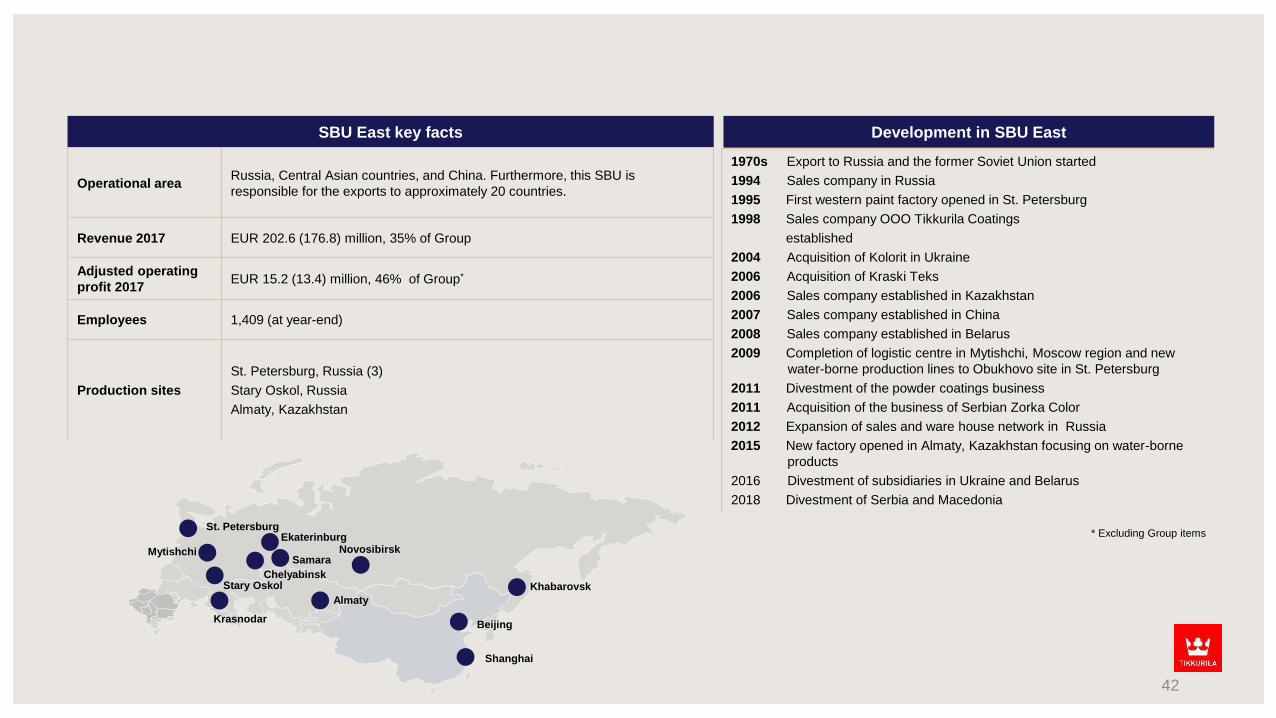
Khabarovsk
Novosibirsk
Almaty
Ekaterinburg
Chelyabinsk
St. Petersburg
Mytishchi
Stary Oskol
KrasnodarBeijing
Shanghai
Samara
SBU East key facts
Operational areaRussia, Central Asian countries, and China. Furthermore, this SBU is
responsible for the exports to approximately 20 countries.
Revenue 2017 EUR 202.6 (176.8) million, 35% of Group
Adjusted operating
profit 2017EUR 15.2 (13.4) million, 46% of Group*
Employees 1,409 (at year-end)
Production sites
St. Petersburg, Russia (3)
Stary Oskol, Russia
Almaty, Kazakhstan
Development in SBU East
1970s Export to Russia and the former Soviet Union started
1994 Sales company in Russia
1995 First western paint factory opened in St. Petersburg
1998 Sales company OOO Tikkurila Coatings
established
2004 Acquisition of Kolorit in Ukraine
2006 Acquisition of Kraski Teks
2006 Sales company established in Kazakhstan
2007 Sales company established in China
2008 Sales company established in Belarus
2009 Completion of logistic centre in Mytishchi, Moscow region and new
water-borne production lines to Obukhovo site in St. Petersburg
2011 Divestment of the powder coatings business
2011 Acquisition of the business of Serbian Zorka Color
2012 Expansion of sales and ware house network in Russia
2015 New factory opened in Almaty, Kazakhstan focusing on water-borne
products
2016 Divestment of subsidiaries in Ukraine and Belarus
2018 Divestment of Serbia and Macedonia
* Excluding Group items
42
Investor and media contacts
43
Minna AvellanDirector, Communications
and Investor Relations
Tel. +358 40 533 7932
Jukka HaviaCFO
Elisa MarkulaCEO