half-year financial report · et ifrs 10, ias 40, ifrs 2, ifrs 4 and ifrs 15 • annual...
TRANSCRIPT

2018 HALF-YEAR FINANCIAL REPORT

Designed & published by +33 (0)1 40 55 16 66
GENSIGHT BIOLOGICS – Half-Year Financial Report 2018 – June 30, 2018 – 1
TABLE OF CONTENTS
1 HALF-YEAR CONDENSED CONSOLIDATED FINANCIAL STATEMENTS – JUNE 30, 2018 3
2 ACTIVITY REPORT 19
A Operating Income 20
B Operating Expenses 20
1. Research and Development 20
2. General and Administrative 20
3. Sales and Marketing 21
C Financial income (loss) 21
D Net income (loss) 21
E Non-current assets 21
F Current assets 22
G Changes in shareholder’s equity 22
H Analysis of cash flow 22
3 TRANSACTIONS BETWEEN RELATED PARTIES 23
4 RISK FACTORS 25
5 STATUTORY AUDITORS’ REVIEW REPORT ON THE 2018 HALF‑YEAR FINANCIAL INFORMATION 27
6 DECLARATION BY THE PERSON RESPONSIBLE FOR THE 2018 HALF‑YEAR FINANCIAL REPORT 29


3 – GENSIGHT BIOLOGICS – Half-Year Financial Report 2018 – June 30, 2018
1 HALF-YEAR CONDENSED CONSOLIDATED FINANCIAL STATEMENTS – JUNE 30, 2018

STATEMENTS OF FINANCIAL POSITION
In thousands of euros
As of December 31 As of June 30
Notes 2017 2018
ASSETS
Non-current assets
Intangible assets 4 185 176
Property, plant and equipment 5 889 1,420
Other non-current financial assets 6 327 343
Total non-current assets 1,401 1,939
Current assets
Trade accounts receivable 12 2
Other current assets 7 5,351 9,183
Cash and cash equivalents 8 55,448 41,675
Total current assets 60,811 50,861
TOTAL ASSETS 62,212 52,800
In thousands of euros
As of December 31 As of June 30
Notes 2017 2018
LIABILITIES
Shareholders’ equity
Share capital 9 606 606
Premiums related to the share capital 112,140 112,140
Reserves (33,638) (56,449)
of which cumulative translation adjustment 9 (17)
Net income (loss) (24,112) (11,658)
Total shareholders’ equity 54,996 44,639
Non-current liabilities
Conditional advances - non-current portion 10 3,033 3,407
Non-current provisions 11 88 82
Total non-current liabilities 3,121 3,489
Current liabilities
Conditional advances - current portion 10 – –
Trade accounts payable 10.2 2,225 3,017
Other current liabilities 12 1,870 1,654
Total current liabilities 4,095 4,671
TOTAL LIABILITIES AND SHAREHOLDERS’ EQUITY 62,212 52,800
4 – GENSIGHT BIOLOGICS – Half-Year Financial Report 2018 – June 30, 2018
HALF-YEAR CONDENSED CONSOLIDATED FINANCIAL STATEMENTS – JUNE 30, 2018 1
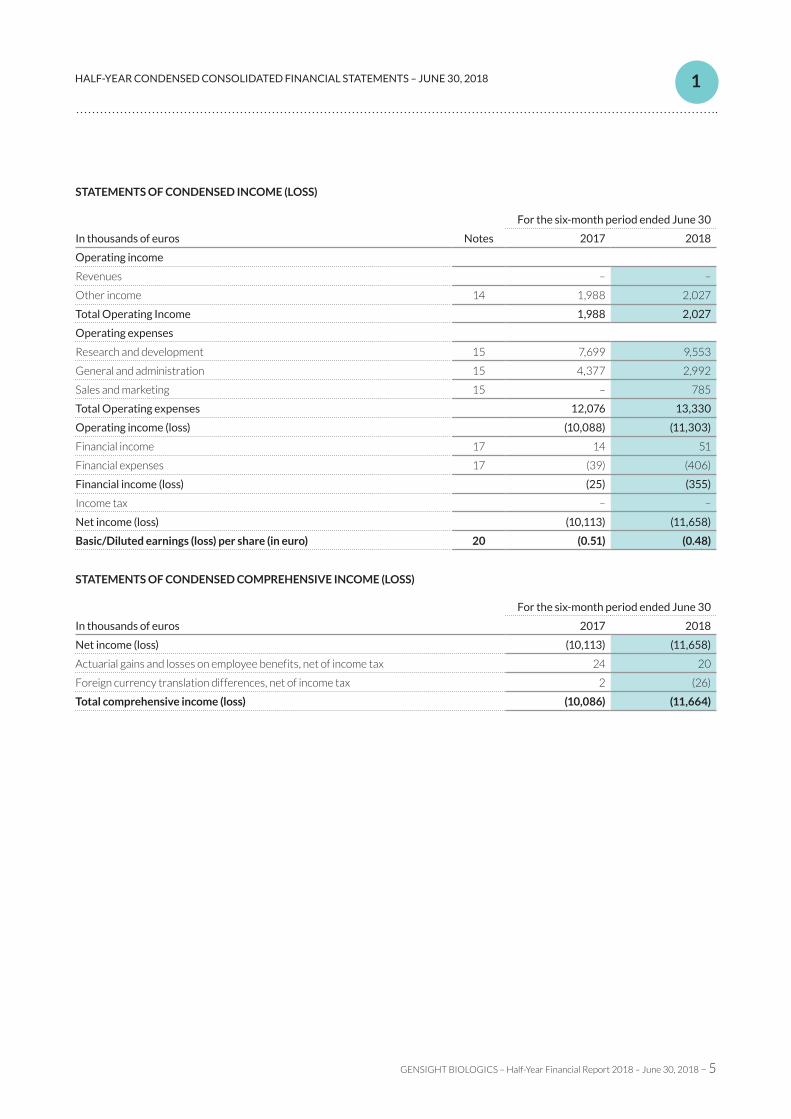
STATEMENTS OF CONDENSED INCOME (LOSS)
In thousands of euros
For the six-month period ended June 30
Notes 2017 2018
Operating income
Revenues – –
Other income 14 1,988 2,027
Total Operating Income 1,988 2,027
Operating expenses
Research and development 15 7,699 9,553
General and administration 15 4,377 2,992
Sales and marketing 15 – 785
Total Operating expenses 12,076 13,330
Operating income (loss) (10,088) (11,303)
Financial income 17 14 51
Financial expenses 17 (39) (406)
Financial income (loss) (25) (355)
Income tax – –
Net income (loss) (10,113) (11,658)
Basic/Diluted earnings (loss) per share (in euro) 20 (0.51) (0.48)
STATEMENTS OF CONDENSED COMPREHENSIVE INCOME (LOSS)
In thousands of euros
For the six-month period ended June 30
2017 2018
Net income (loss) (10,113) (11,658)
Actuarial gains and losses on employee benefits, net of income tax 24 20
Foreign currency translation differences, net of income tax 2 (26)
Total comprehensive income (loss) (10,086) (11,664)
GENSIGHT BIOLOGICS – Half-Year Financial Report 2018 – June 30, 2018 – 5
HALF-YEAR CONDENSED CONSOLIDATED FINANCIAL STATEMENTS – JUNE 30, 2018 1
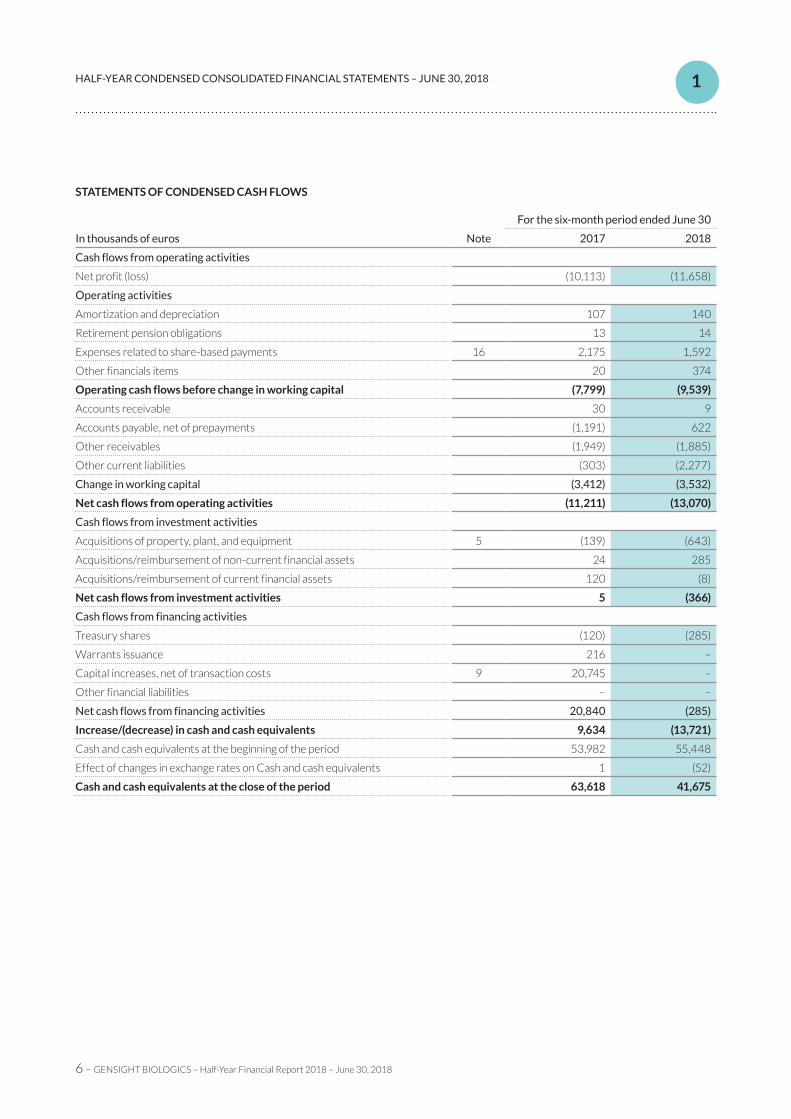
STATEMENTS OF CONDENSED CASH FLOWS
In thousands of euros
For the six-month period ended June 30
Note 2017 2018
Cash flows from operating activities
Net profit (loss) (10,113) (11,658)
Operating activities
Amortization and depreciation 107 140
Retirement pension obligations 13 14
Expenses related to share-based payments 16 2,175 1,592
Other financials items 20 374
Operating cash flows before change in working capital (7,799) (9,539)
Accounts receivable 30 9
Accounts payable, net of prepayments (1,191) 622
Other receivables (1,949) (1,885)
Other current liabilities (303) (2,277)
Change in working capital (3,412) (3,532)
Net cash flows from operating activities (11,211) (13,070)
Cash flows from investment activities
Acquisitions of property, plant, and equipment 5 (139) (643)
Acquisitions/reimbursement of non-current financial assets 24 285
Acquisitions/reimbursement of current financial assets 120 (8)
Net cash flows from investment activities 5 (366)
Cash flows from financing activities
Treasury shares (120) (285)
Warrants issuance 216 –
Capital increases, net of transaction costs 9 20,745 –
Other financial liabilities – –
Net cash flows from financing activities 20,840 (285)
Increase/(decrease) in cash and cash equivalents 9,634 (13,721)
Cash and cash equivalents at the beginning of the period 53,982 55,448
Effect of changes in exchange rates on Cash and cash equivalents 1 (52)
Cash and cash equivalents at the close of the period 63,618 41,675
6 – GENSIGHT BIOLOGICS – Half-Year Financial Report 2018 – June 30, 2018
HALF-YEAR CONDENSED CONSOLIDATED FINANCIAL STATEMENTS – JUNE 30, 2018 1

STATEMENTS OF CHANGES IN SHAREHOLDERS’ EQUITY
In thousands of euros, except for number of shares
Share Capital
Number of shares
Amount Premiums related to the share
capital
Reserves Net income (loss)
Total Shareholders’
Equity
At January 1, 2017 19,409 701 485 91,230 (16,293) (22,082) 53,340
Net income (loss) – – – – (10,113) (10,113)
Other comprehensive income – – – 27 – 27
Total comprehensive income (loss) 27 (10,113) (10,086)
Allocation of prior period net income (loss)
– – – (22,082) 22,082 –
Allocation to reserves – – – – – –
Capital increase by issuance of ordinary shares
3,750 000 94 22,406 – – 22,500
Capital increase transaction costs – – (1,755) – – (1,755)
Capital increase by issuance of share warrants
374,552 9 206 – – 216
Treasury shares – – – (120) – (120)
Share-based payments – – – 2,175 – 2,175
At June 30, 2017 23,534 253 588 112,088 (36,294) (10,113) 66,269
At January 1, 2018 24,234 223 606 112,140 (33,638) (24,112) 54,996
Net income (loss) – – – – (11,658) (11,658)
Cumulative translation adjustment – – – (26) – (26)
Other comprehensive income – – – 20 – 20
Total comprehensive income (loss) – – – (6) (11,658) (11,664)
Allocation of prior period income (loss) – – – (24,112) 24,112 –
Allocation to reserves – – – – – –
Capital increase by issuance of Ordinary shares
– – – – – –
Capital increase transaction costs – – – – – –
Issue of share warrants – – – – – –
Treasury shares – – – (285) – (285)
Share-based payments – – – 1,592 – 1,592
At June 30, 2018 24,234 223 606 112,140 (56,449) (11,658) 44,639
GENSIGHT BIOLOGICS – Half-Year Financial Report 2018 – June 30, 2018 – 7
HALF-YEAR CONDENSED CONSOLIDATED FINANCIAL STATEMENTS – JUNE 30, 2018 1

NOTES TO THE CONDENSED FINANCIAL STATEMENTS
Note 1: General information about the Company
Founded in 2012, GenSight Biologics S.A. (hereinafter referred to
as “GenSight Biologics” or the “Company” and together with its
subsidiary as the “Group”) is a clinical-stage biotechnology group
discovering and developing novel therapies for neurodegenerative
retinal diseases and diseases of the central nervous system.
GenSight Biologics’ pipeline leverages two core technology
platforms, the Mitochondrial Targeting Sequence (MTS) and
optogenetics, to help preserve or restore vision in patients suffering
from severe degenerative retinal diseases. The Group focus is in
ophthalmology where it develops product candidates to restore
eyesight to patients suffering from retinal diseases that would
otherwise lead to blindness.
The Company has incurred losses and negative cash flows from
operations since its inception and shareholders’ equity amounts to
€44,639 K as of June 30, 2018 as a result of several financing
rounds (see Note 9). The Group anticipates incurring additional
losses until such time, if ever, that it can generate significant
revenue from its product candidates in development. Substantial
additional financing will be needed by the Company to fund its
operations and to commercially develop its product candidates.
The Group’s future operations are highly dependent on a
combination of factors, including: (i) the success of its research and
development; (ii) regulatory approval and market acceptance of the
Group’s proposed future products; (iii) the timely and successful
completion of additional financing; and (iv) the development of
competitive therapies by other biotechnology and pharmaceutical
companies.
Note 2: Significant events during the period
On January 10, 2018, Gensight Biologics announced UK Medicines
and Healthcare Regulatory Agency (MHRA) acceptance of the
Company’s Clinical Trial Application (CTA) to initiate the PIONEER
Phase I/II study of GS030 in patients with Retinitis Pigmentosa
(RP). PIONEER is a first-in-man, multi-center, open label dose-
escalation study to evaluate the safety and tolerability of GS030
in subjects with Retinitis Pigmentosa. GS030 is the combination of
a gene therapy (GS030-DP) administered via a single intravitreal
injection and a wearable optronic visual stimulation device
(GS030-MD).
On April 3, 2018, Gensight Biologics announced topline results
from Reverse Phase III clinical trial of GS010 in patients with Leber
Hereditary Optic Neuropathy (LHON). Topline results further
highlight the favorable safety and tolerability profile of GS010, and
demonstrate a clinically meaningful improvement of +11 ETDRS
letters (-0.218 LogMAR) in treated eyes at 48 weeks as compared
to baseline in all 37 patients. Unexpectedly, untreated contralateral
eyes (treated with a sham injection) show a similar improvement of
+11 ETDRS letters (-0.211 LogMAR). Due to this improvement in
untreated eyes, the trial did not meet its primary endpoint, defined
as a difference of improvement in visual acuity in GS010-treated
eyes compared to sham-treated eyes at 48 weeks.
On June 12, 2018, GenSight Biologics reports positive additional
data from REVERSE Phase III clinical trial of GS010 for treatment
of Leber Hereditary Optic Neuropathy (LHON).
Note 3: Accounting principles and compliance
3.1. Preliminary remarks
The condensed half-year consolidated financial statements (the
“Financial Statements”) present the operations of GenSight
Biologics as of June 30, 2018. GenSight Biologics S.A. is a public
limited company whose head office is located at 74 rue du Faubourg
St. Antoine, 75012 Paris.
The condensed semi-annual consolidated financial statements for
the six months ended June 30, 2018 have been prepared under
the responsibility of the management of GenSight Biologics, they
have been approved on July 24, 2018 by the Board of Directors.
The presented condensed financial statements are expressed in
thousands of euros, unless stated otherwise.
The Reporting date for the condensed consolidated accounting
statements is June 30, and covers a six- month period. The
individual statements of the consolidated subsidiary is prepared at
the same Reporting date, i.e. June 30, and covers the same period.
3.2. Accounting principles and Statement of compliance
International accounting standards include International Financial
Reporting Standards (IFRS), International Accounting Standards
(IAS), as well as the interpretations issued by the Standing
Interpretations Committee (SIC), and the International Financial
Reporting Interpretations Committee (IFRIC).
The IFRS as adopted by the European Union differ in certain
aspects with the IFRS published by the IASB. Nevertheless, the
Group ensured that the financial information for the periods
presented would not have been substantially different if it had
applied IFRS as published by the IASB.
The notes to the condensed consolidated financial statements at
June 30, 2018 were prepared in accordance with IAS 34 - Interim
Financial Reporting, as endorsed by the European Union, which
requires the disclosure of selected notes only. The condensed
financial statements do not include all disclosures required for
annual financial statements and should therefore be read in
conjunction with the consolidated financial statements for year
ended December 31, 2017.
8 – GENSIGHT BIOLOGICS – Half-Year Financial Report 2018 – June 30, 2018
HALF-YEAR CONDENSED CONSOLIDATED FINANCIAL STATEMENTS – JUNE 30, 2018 1
All the texts adopted by the European Union are available on the
European Commission’s website: https://ec.europa.eu/info/
la w/ i n te r n a t i o n a l - a c c o u n t i n g - s t a n da rd s - re g u la t i o n -
ec-no -16 06 -20 02 /amending-and-supplementar y-ac ts/
acts-adopted-basis-regulatory-procedure-scrutiny-rps_en
The condensed consolidated financial statements were prepared
in accordance with the accounting principles and methods used by
the Group for the 2017 financial statements and described in
note 3 to consolidated financial statements for the year ended
December 31, 2017. Furthermore, the condensed consolidated
financial statements were prepared in compliance with other
standards and interpretations in force as of January 1, 2018, with
the exception of the application of the new standards and
interpretations described below.
• IFRS 9 – Financial instruments
• IFRS 15 – Revenue from Contracts with Customers
• IFRIC 23 – Uncertainty over Income Tax Treatments
• Clarifications and amendments related to IAS 7, IAS 12, IAS 28
et IFRS 10, IAS 40, IFRS 2, IFRS 4 and IFRS 15
• Annual improvements to IFRS norms – 2014-2016 cycle
The application by the Group of these new standards and
amendments has no material impact on the Group’s interim
financial statements.
In addition, the Group has not decided to early adopt the new
standards, amendments to standards and interpretations published
by IASB, adopted by the European Union but not yet applicable
as of June 2018, and in particular, IFRS 16 Leases, issued on
January 13, 2016 by the IASB. IFRS 16 specifies how an entity will
recognize, measure, present and disclose leases. The Groupe
do not expect that this new standard will have material impact on
its future consolidated financial statements.
3.3. Consolidation scope and methods
On April 28, 2017 the Group incorporated GenSight Biologics Inc.
in the United States. As 100% of the voting rights and ownership
interests are held by the Group, GenSight Biologics Inc. is fully
consolidated.
3.4. Going-concern
The historical deficit position of the Group is explained by the
innovative character of the products developed, which thus
involved a research and development phase of several years
preceding the marketing thereof.
The available cash and cash equivalents as of June 30, 2018 in the
amount of €41.7 million and the reimbursement of the 2017
Research Tax Credit in the amount of €3.7 million expected during
the second half year of 2018 should enable the Group to cover its
cash requirements through the next 12 months.
3.5. Use of estimates
In the course of preparing its interim financial statements, GenSight
Biologics’ management made estimates, judgments and
assumptions impacting the application of accounting principles and
methods as well as the carrying value of assets and liabilities and
income and expense items. The main sources of uncertainty with
respect to key estimates and judgments made were identical to
those applied in the consolidated financial statements for the year
ended December 31, 2017.
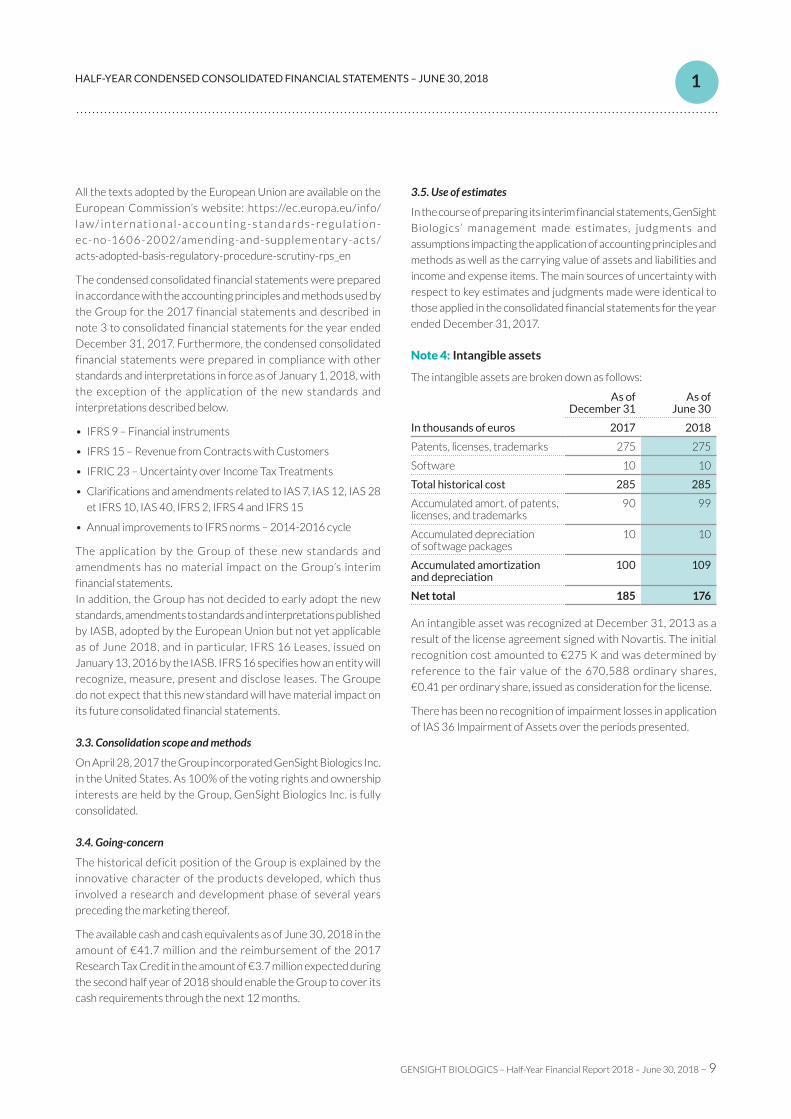
Note 4: Intangible assets
The intangible assets are broken down as follows:
In thousands of euros
As of December 31
As of June 30
2017 2018
Patents, licenses, trademarks 275 275
Software 10 10
Total historical cost 285 285
Accumulated amort. of patents, licenses, and trademarks
90 99
Accumulated depreciation of softwage packages
10 10
Accumulated amortization and depreciation
100 109
Net total 185 176
An intangible asset was recognized at December 31, 2013 as a
result of the license agreement signed with Novartis. The initial
recognition cost amounted to €275 K and was determined by
reference to the fair value of the 670,588 ordinary shares,
€0.41 per ordinary share, issued as consideration for the license.
There has been no recognition of impairment losses in application
of IAS 36 Impairment of Assets over the periods presented.
GENSIGHT BIOLOGICS – Half-Year Financial Report 2018 – June 30, 2018 – 9
HALF-YEAR CONDENSED CONSOLIDATED FINANCIAL STATEMENTS – JUNE 30, 2018 1

Note 5: Property, plant and equipment
Changes in PPE gross book values and accumulated depreciation for the full year 2017 are presented in the following table:
In thousands of Euros
As of January 1, 2017 Increase Decrease Currency translation
adjustment
As of December
31, 2017As published Restated(1)
Technical equipment and installations 687 277 95 – – 372
Leasehold improvement 143 553 51 – – 604
Office and computer equipment 102 102 41 – – 144
Furniture 256 256 47 – – 303
Fixed assests in progress – – 1 – – 1
Total gross property, plant and equipment 1,188 1,188 236 – – 1,424
Accumulated depreciation of technical equipment and installations
108 83 56 – – 138
Accumulated depreciation of leasehold improvement
67 93 64 – – 157
Accumulated depreciation of office and computer equipment
62 62 29 – – 91
Accumulated depreciation of furniture 93 93 56 – – 149
Accumulated depreciation of fixed assets in progress
– – – – – –
Total accumulated depreciation 330 330 205 – – 535
Total net property, plant and equipment 858 858 31 – – 889
(1) In order to improve the readability of the Financial Statements, some technical equipment are presented together with Leasehold improvement.
Changes in PPE gross book values and accumulated depreciation as of June 2018 are presented in the following table:
In thousands of eurosAs of January 1,
2018Increase Decrease As of June 30,
2018
Technical equipment and installations 372 202 – 574
Leasehold improvement 604 291 – 896
Office and computer equipment 144 21 – 165
Furniture 303 144 – 446
Fixed assets in progress 1 3 – 5
Total gross property, plant and equipment 1,424 662 – 2,086
Accumulated depreciation of technical equipment and installations
138 38 – 176
Accumulated depreciation of leasehold improvement
157 39 – 197
Accumulated depreciation of office and computer equipment
91 17 – 108
Accumulated depreciation of furniture 149 37 – 186
Accumulated depreciation of fixed assets in progress
– – – –
Total accumulated depreciation 535 131 – 666
Total net property, plant and equipment 889 531 – 1,420
The increase in property, plant and equipment as at June 30, 2018 is explained by the costs deriving from the new premises of the US
subsidiary GenSight Biologics Inc. in its new facility located at 3 East 28th Street - New York, NY 10016, April 18, 2018.
10 – GENSIGHT BIOLOGICS – Half-Year Financial Report 2018 – June 30, 2018
HALF-YEAR CONDENSED CONSOLIDATED FINANCIAL STATEMENTS – JUNE 30, 2018 1
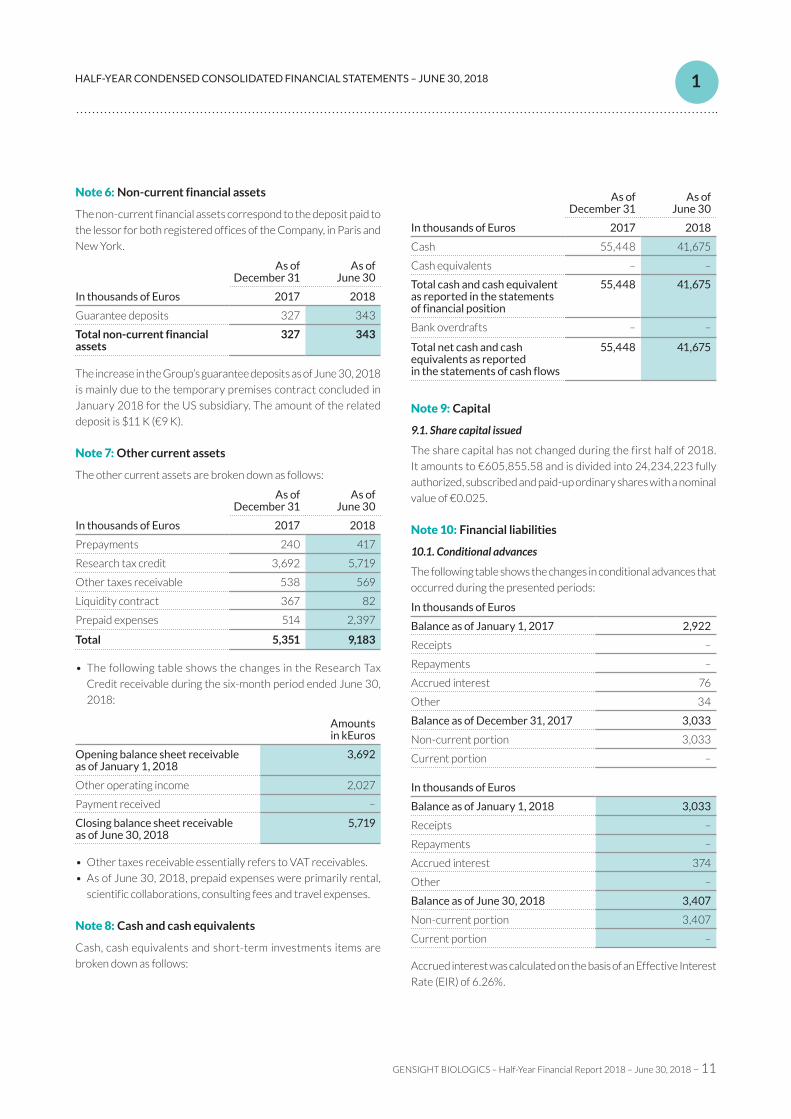
Note 6: Non-current financial assets
The non-current financial assets correspond to the deposit paid to
the lessor for both registered offices of the Company, in Paris and
New York.
In thousands of Euros
As of December 31
As of June 30
2017 2018
Guarantee deposits 327 343
Total non-current financial assets
327 343
The increase in the Group’s guarantee deposits as of June 30, 2018
is mainly due to the temporary premises contract concluded in
January 2018 for the US subsidiary. The amount of the related
deposit is $11 K (€9 K).
Note 7: Other current assets
The other current assets are broken down as follows:
In thousands of Euros
As of December 31
As of June 30
2017 2018
Prepayments 240 417
Research tax credit 3,692 5,719
Other taxes receivable 538 569
Liquidity contract 367 82
Prepaid expenses 514 2,397
Total 5,351 9,183
• The following table shows the changes in the Research Tax
Credit receivable during the six-month period ended June 30,
2018:
Amounts in kEuros
Opening balance sheet receivable as of January 1, 2018
3,692
Other operating income 2,027
Payment received –
Closing balance sheet receivable as of June 30, 2018
5,719
• Other taxes receivable essentially refers to VAT receivables.
• As of June 30, 2018, prepaid expenses were primarily rental,
scientific collaborations, consulting fees and travel expenses.
Note 8: Cash and cash equivalents
Cash, cash equivalents and short-term investments items are
broken down as follows:
In thousands of Euros
As of December 31
As of June 30
2017 2018
Cash 55,448 41,675
Cash equivalents – –
Total cash and cash equivalent as reported in the statements of financial position
55,448 41,675
Bank overdrafts – –
Total net cash and cash equivalents as reported in the statements of cash flows
55,448 41,675
Note 9: Capital
9.1. Share capital issued
The share capital has not changed during the first half of 2018.
It amounts to €605,855.58 and is divided into 24,234,223 fully
authorized, subscribed and paid-up ordinary shares with a nominal
value of €0.025.
Note 10: Financial liabilities
10.1. Conditional advances
The following table shows the changes in conditional advances that
occurred during the presented periods:
In thousands of Euros
Balance as of January 1, 2017 2,922
Receipts –
Repayments –
Accrued interest 76
Other 34
Balance as of December 31, 2017 3,033
Non-current portion 3,033
Current portion –
In thousands of Euros
Balance as of January 1, 2018 3,033
Receipts –
Repayments –
Accrued interest 374
Other –
Balance as of June 30, 2018 3,407
Non-current portion 3,407
Current portion –
Accrued interest was calculated on the basis of an Effective Interest
Rate (EIR) of 6.26%.
GENSIGHT BIOLOGICS – Half-Year Financial Report 2018 – June 30, 2018 – 11
HALF-YEAR CONDENSED CONSOLIDATED FINANCIAL STATEMENTS – JUNE 30, 2018 1
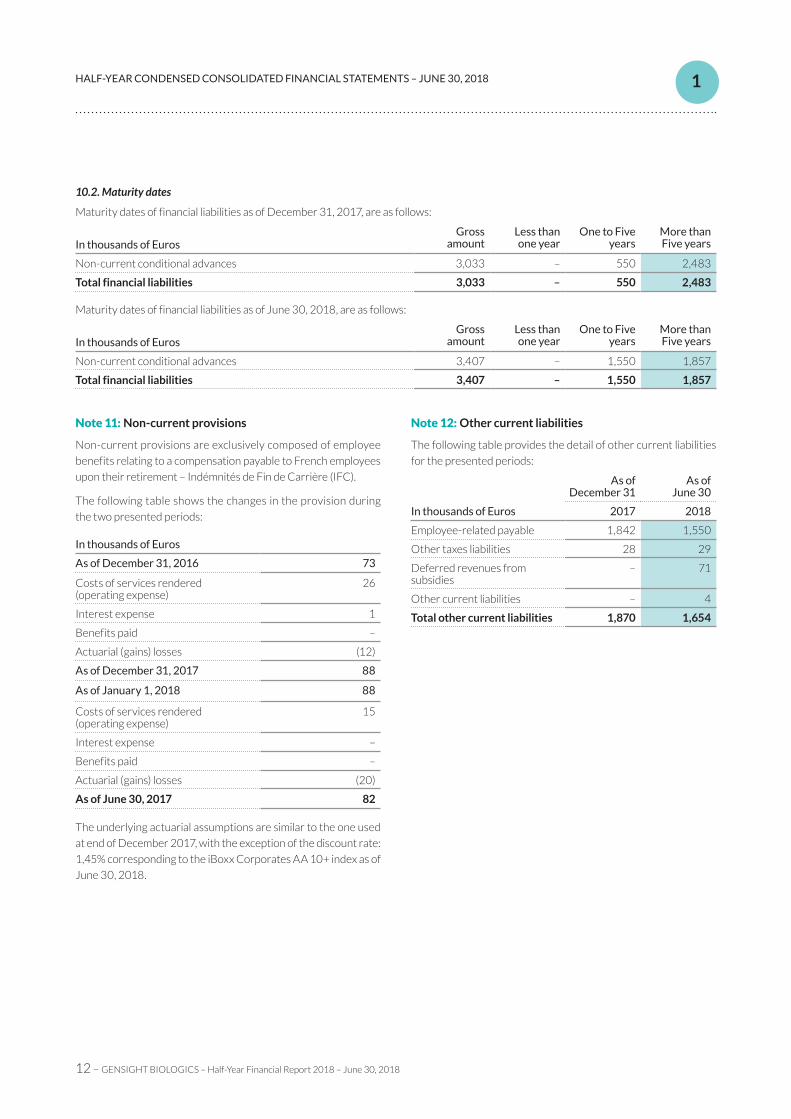
10.2. Maturity dates
Maturity dates of financial liabilities as of December 31, 2017, are as follows:
In thousands of EurosGross
amountLess than one year
One to Five years
More than Five years
Non-current conditional advances 3,033 – 550 2,483
Total financial liabilities 3,033 – 550 2,483
Maturity dates of financial liabilities as of June 30, 2018, are as follows:
In thousands of EurosGross
amountLess than one year
One to Five years
More than Five years
Non-current conditional advances 3,407 – 1,550 1,857
Total financial liabilities 3,407 – 1,550 1,857
Note 11: Non-current provisions
Non-current provisions are exclusively composed of employee
benefits relating to a compensation payable to French employees
upon their retirement – Indémnités de Fin de Carrière (IFC).
The following table shows the changes in the provision during
the two presented periods:
In thousands of Euros
As of December 31, 2016 73
Costs of services rendered (operating expense)
26
Interest expense 1
Benefits paid –
Actuarial (gains) losses (12)
As of December 31, 2017 88
As of January 1, 2018 88
Costs of services rendered (operating expense)
15
Interest expense –
Benefits paid –
Actuarial (gains) losses (20)
As of June 30, 2017 82
The underlying actuarial assumptions are similar to the one used
at end of December 2017, with the exception of the discount rate:
1,45% corresponding to the iBoxx Corporates AA 10+ index as of
June 30, 2018.
Note 12: Other current liabilities
The following table provides the detail of other current liabilities
for the presented periods:
In thousands of Euros
As of December 31
As of June 30
2017 2018
Employee-related payable 1,842 1,550
Other taxes liabilities 28 29
Deferred revenues from subsidies
– 71
Other current liabilities – 4
Total other current liabilities 1,870 1,654
12 – GENSIGHT BIOLOGICS – Half-Year Financial Report 2018 – June 30, 2018
HALF-YEAR CONDENSED CONSOLIDATED FINANCIAL STATEMENTS – JUNE 30, 2018 1
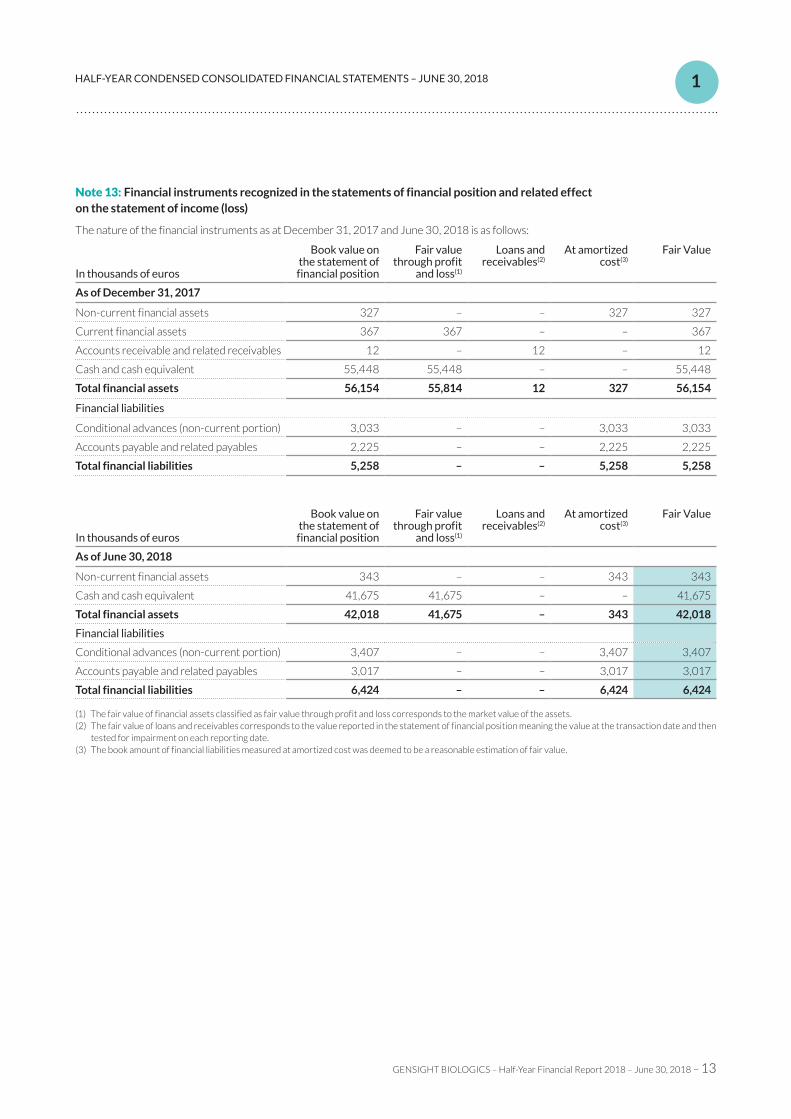
Note 13: Financial instruments recognized in the statements of financial position and related effect on the statement of income (loss)
The nature of the financial instruments as at December 31, 2017 and June 30, 2018 is as follows:
In thousands of euros
Book value on the statement of financial position
Fair value through profit
and loss(1)
Loans and receivables(2)
At amortized cost(3)
Fair Value
As of December 31, 2017
Non-current financial assets 327 – – 327 327
Current financial assets 367 367 – – 367
Accounts receivable and related receivables 12 – 12 – 12
Cash and cash equivalent 55,448 55,448 – – 55,448
Total financial assets 56,154 55,814 12 327 56,154
Financial liabilities
Conditional advances (non-current portion) 3,033 – – 3,033 3,033
Accounts payable and related payables 2,225 – – 2,225 2,225
Total financial liabilities 5,258 – – 5,258 5,258
In thousands of euros
Book value on the statement of financial position
Fair value through profit
and loss(1)
Loans and receivables(2)
At amortized cost(3)
Fair Value
As of June 30, 2018
Non-current financial assets 343 – – 343 343
Cash and cash equivalent 41,675 41,675 – – 41,675
Total financial assets 42,018 41,675 – 343 42,018
Financial liabilities
Conditional advances (non-current portion) 3,407 – – 3,407 3,407
Accounts payable and related payables 3,017 – – 3,017 3,017
Total financial liabilities 6,424 – – 6,424 6,424
(1) The fair value of financial assets classified as fair value through profit and loss corresponds to the market value of the assets. (2) The fair value of loans and receivables corresponds to the value reported in the statement of financial position meaning the value at the transaction date and then
tested for impairment on each reporting date. (3) The book amount of financial liabilities measured at amortized cost was deemed to be a reasonable estimation of fair value.
GENSIGHT BIOLOGICS – Half-Year Financial Report 2018 – June 30, 2018 – 13
HALF-YEAR CONDENSED CONSOLIDATED FINANCIAL STATEMENTS – JUNE 30, 2018 1
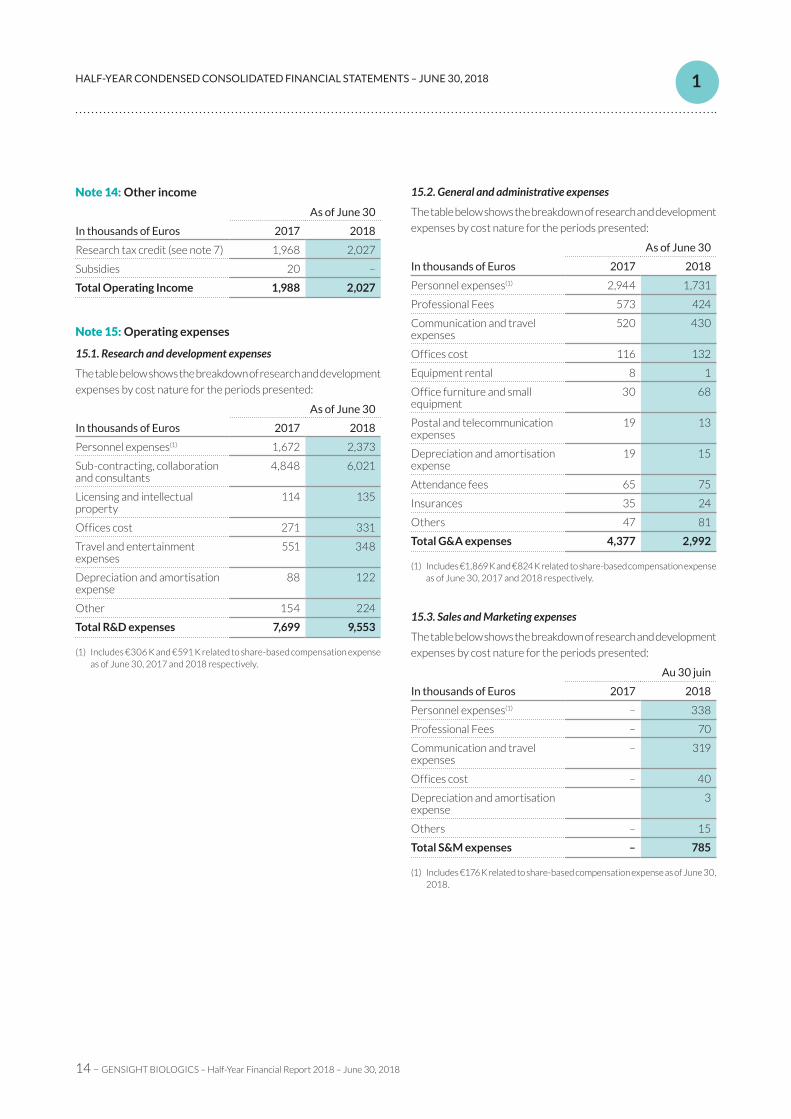
Note 14: Other income
In thousands of Euros
As of June 30
2017 2018
Research tax credit (see note 7) 1,968 2,027
Subsidies 20 –
Total Operating Income 1,988 2,027
Note 15: Operating expenses
15.1. Research and development expenses
The table below shows the breakdown of research and development
expenses by cost nature for the periods presented:
In thousands of Euros
As of June 30
2017 2018
Personnel expenses(1) 1,672 2,373
Sub-contracting, collaboration and consultants
4,848 6,021
Licensing and intellectual property
114 135
Offices cost 271 331
Travel and entertainment expenses
551 348
Depreciation and amortisation expense
88 122
Other 154 224
Total R&D expenses 7,699 9,553
(1) Includes €306 K and €591 K related to share-based compensation expense as of June 30, 2017 and 2018 respectively.
15.2. General and administrative expenses
The table below shows the breakdown of research and development
expenses by cost nature for the periods presented:
In thousands of Euros
As of June 30
2017 2018
Personnel expenses(1) 2,944 1,731
Professional Fees 573 424
Communication and travel expenses
520 430
Offices cost 116 132
Equipment rental 8 1
Office furniture and small equipment
30 68
Postal and telecommunication expenses
19 13
Depreciation and amortisation expense
19 15
Attendance fees 65 75
Insurances 35 24
Others 47 81
Total G&A expenses 4,377 2,992
(1) Includes €1,869 K and €824 K related to share-based compensation expense as of June 30, 2017 and 2018 respectively.
15.3. Sales and Marketing expenses
The table below shows the breakdown of research and development
expenses by cost nature for the periods presented:
In thousands of Euros
Au 30 juin
2017 2018
Personnel expenses(1) – 338
Professional Fees – 70
Communication and travel expenses
– 319
Offices cost – 40
Depreciation and amortisation expense
3
Others – 15
Total S&M expenses – 785
(1) Includes €176 K related to share-based compensation expense as of June 30, 2018.
14 – GENSIGHT BIOLOGICS – Half-Year Financial Report 2018 – June 30, 2018
HALF-YEAR CONDENSED CONSOLIDATED FINANCIAL STATEMENTS – JUNE 30, 2018 1
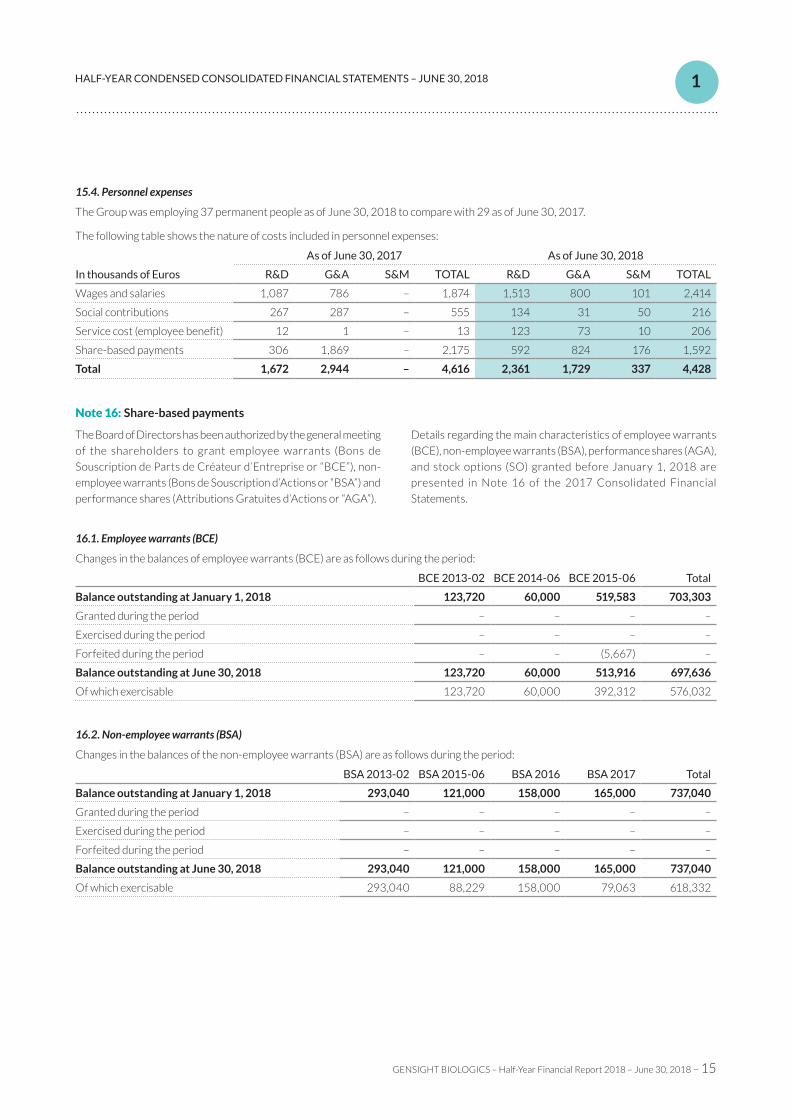
15.4. Personnel expenses
The Group was employing 37 permanent people as of June 30, 2018 to compare with 29 as of June 30, 2017.
The following table shows the nature of costs included in personnel expenses:
In thousands of Euros
As of June 30, 2017 As of June 30, 2018
R&D G&A S&M TOTAL R&D G&A S&M TOTAL
Wages and salaries 1,087 786 – 1,874 1,513 800 101 2,414
Social contributions 267 287 – 555 134 31 50 216
Service cost (employee benefit) 12 1 – 13 123 73 10 206
Share-based payments 306 1,869 – 2,175 592 824 176 1,592
Total 1,672 2,944 – 4,616 2,361 1,729 337 4,428
Note 16: Share-based payments
The Board of Directors has been authorized by the general meeting
of the shareholders to grant employee warrants (Bons de
Souscription de Parts de Créateur d’Entreprise or “BCE”), non-
employee warrants (Bons de Souscription d’Actions or “BSA”) and
performance shares (Attributions Gratuites d’Actions or “AGA”).
Details regarding the main characteristics of employee warrants
(BCE), non-employee warrants (BSA), performance shares (AGA),
and stock options (SO) granted before January 1, 2018 are
presented in Note 16 of the 2017 Consolidated Financial
Statements.
16.1. Employee warrants (BCE)
Changes in the balances of employee warrants (BCE) are as follows during the period:
BCE 2013-02 BCE 2014-06 BCE 2015-06 Total
Balance outstanding at January 1, 2018 123,720 60,000 519,583 703,303
Granted during the period – – – –
Exercised during the period – – – –
Forfeited during the period – – (5,667) –
Balance outstanding at June 30, 2018 123,720 60,000 513,916 697,636
Of which exercisable 123,720 60,000 392,312 576,032
16.2. Non-employee warrants (BSA)
Changes in the balances of the non-employee warrants (BSA) are as follows during the period:
BSA 2013-02 BSA 2015-06 BSA 2016 BSA 2017 Total
Balance outstanding at January 1, 2018 293,040 121,000 158,000 165,000 737,040
Granted during the period – – – – –
Exercised during the period – – – – –
Forfeited during the period – – – – –
Balance outstanding at June 30, 2018 293,040 121,000 158,000 165,000 737,040
Of which exercisable 293,040 88,229 158,000 79,063 618,332
GENSIGHT BIOLOGICS – Half-Year Financial Report 2018 – June 30, 2018 – 15
HALF-YEAR CONDENSED CONSOLIDATED FINANCIAL STATEMENTS – JUNE 30, 2018 1
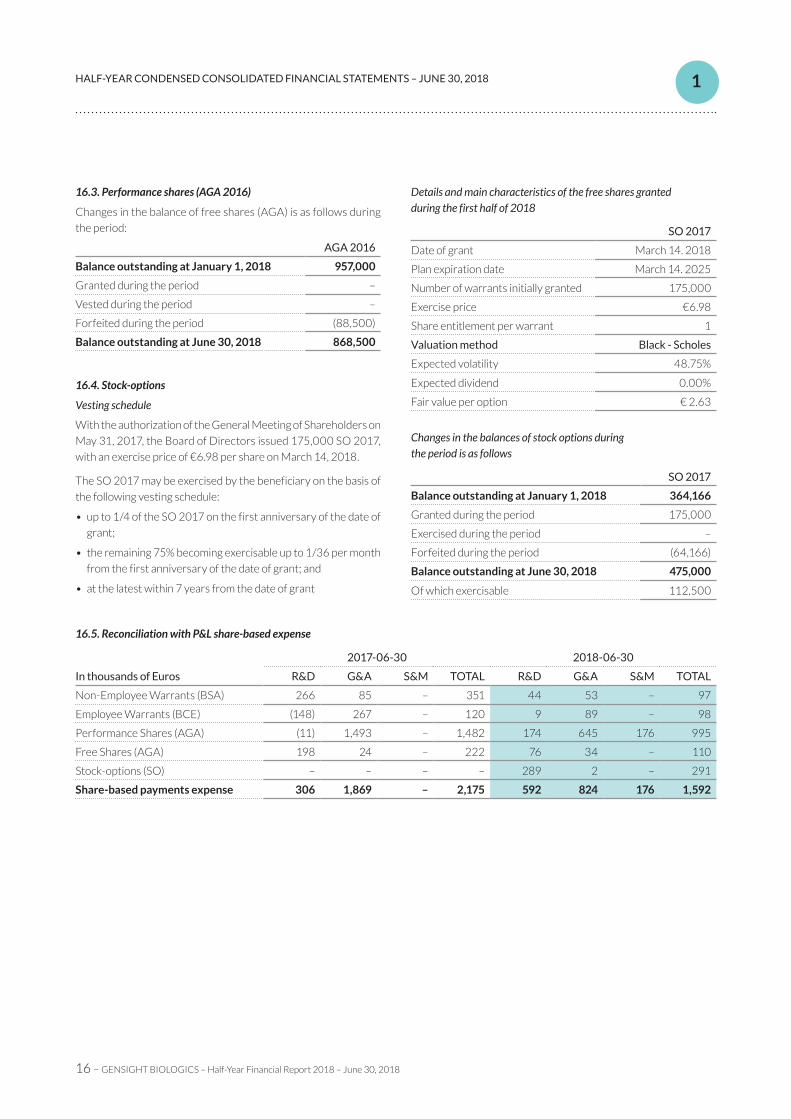
16.3. Performance shares (AGA 2016)
Changes in the balance of free shares (AGA) is as follows during
the period:
AGA 2016
Balance outstanding at January 1, 2018 957,000
Granted during the period –
Vested during the period –
Forfeited during the period (88,500)
Balance outstanding at June 30, 2018 868,500
16.4. Stock-options
Vesting schedule
With the authorization of the General Meeting of Shareholders on
May 31, 2017, the Board of Directors issued 175,000 SO 2017,
with an exercise price of €6.98 per share on March 14, 2018.
The SO 2017 may be exercised by the beneficiary on the basis of
the following vesting schedule:
• up to 1/4 of the SO 2017 on the first anniversary of the date of
grant;
• the remaining 75% becoming exercisable up to 1/36 per month
from the first anniversary of the date of grant; and
• at the latest within 7 years from the date of grant
Details and main characteristics of the free shares granted during the first half of 2018
SO 2017
Date of grant March 14. 2018
Plan expiration date March 14. 2025
Number of warrants initially granted 175,000
Exercise price €6.98
Share entitlement per warrant 1
Valuation method Black - Scholes
Expected volatility 48.75%
Expected dividend 0.00%
Fair value per option € 2.63
Changes in the balances of stock options during the period is as follows
SO 2017
Balance outstanding at January 1, 2018 364,166
Granted during the period 175,000
Exercised during the period –
Forfeited during the period (64,166)
Balance outstanding at June 30, 2018 475,000
Of which exercisable 112,500
16.5. Reconciliation with P&L share-based expense
In thousands of Euros
2017-06-30 2018-06-30
R&D G&A S&M TOTAL R&D G&A S&M TOTAL
Non-Employee Warrants (BSA) 266 85 – 351 44 53 – 97
Employee Warrants (BCE) (148) 267 – 120 9 89 – 98
Performance Shares (AGA) (11) 1,493 – 1,482 174 645 176 995
Free Shares (AGA) 198 24 – 222 76 34 – 110
Stock-options (SO) – – – – 289 2 – 291
Share-based payments expense 306 1,869 – 2,175 592 824 176 1,592
16 – GENSIGHT BIOLOGICS – Half-Year Financial Report 2018 – June 30, 2018
HALF-YEAR CONDENSED CONSOLIDATED FINANCIAL STATEMENTS – JUNE 30, 2018 1
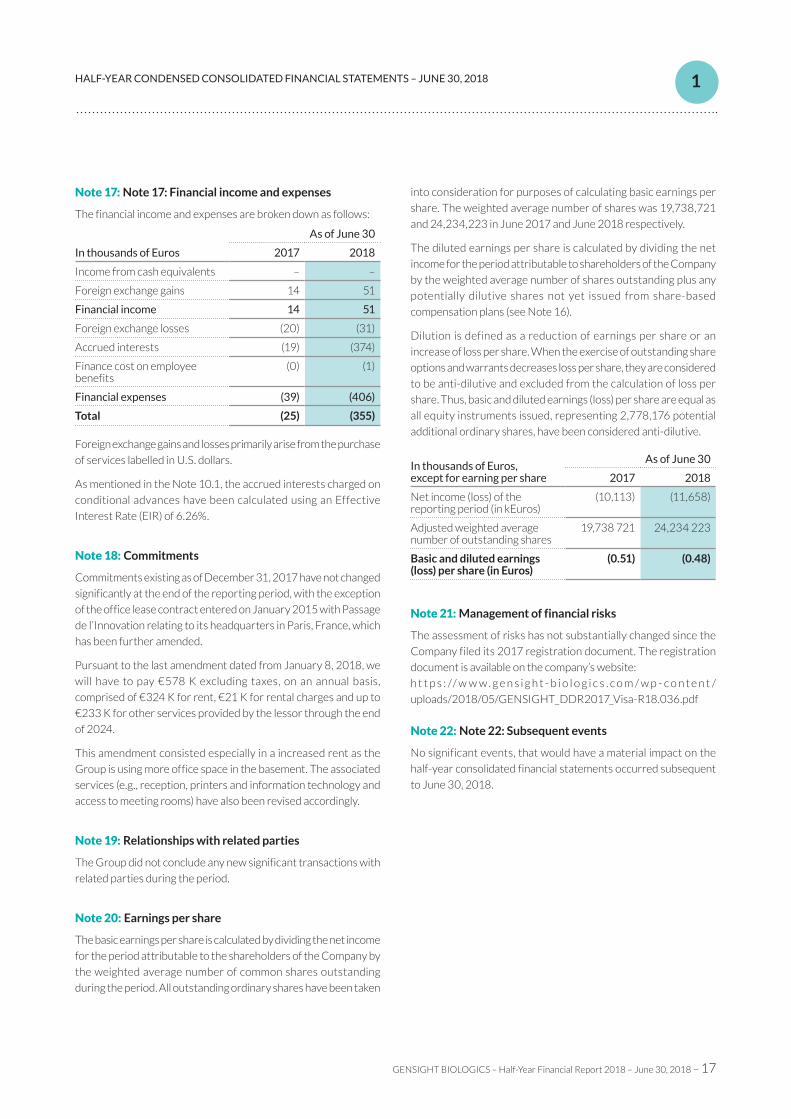
Note 17: Note 17: Financial income and expenses
The financial income and expenses are broken down as follows:
In thousands of Euros
As of June 30
2017 2018
Income from cash equivalents – –
Foreign exchange gains 14 51
Financial income 14 51
Foreign exchange losses (20) (31)
Accrued interests (19) (374)
Finance cost on employee benefits
(0) (1)
Financial expenses (39) (406)
Total (25) (355)
Foreign exchange gains and losses primarily arise from the purchase
of services labelled in U.S. dollars.
As mentioned in the Note 10.1, the accrued interests charged on
conditional advances have been calculated using an Effective
Interest Rate (EIR) of 6.26%.
Note 18: Commitments
Commitments existing as of December 31, 2017 have not changed
significantly at the end of the reporting period, with the exception
of the office lease contract entered on January 2015 with Passage
de l’Innovation relating to its headquarters in Paris, France, which
has been further amended.
Pursuant to the last amendment dated from January 8, 2018, we
will have to pay €578 K excluding taxes, on an annual basis,
comprised of €324 K for rent, €21 K for rental charges and up to
€233 K for other services provided by the lessor through the end
of 2024.
This amendment consisted especially in a increased rent as the
Group is using more office space in the basement. The associated
services (e.g., reception, printers and information technology and
access to meeting rooms) have also been revised accordingly.
Note 19: Relationships with related parties
The Group did not conclude any new significant transactions with
related parties during the period.
Note 20: Earnings per share
The basic earnings per share is calculated by dividing the net income
for the period attributable to the shareholders of the Company by
the weighted average number of common shares outstanding
during the period. All outstanding ordinary shares have been taken
into consideration for purposes of calculating basic earnings per
share. The weighted average number of shares was 19,738,721
and 24,234,223 in June 2017 and June 2018 respectively.
The diluted earnings per share is calculated by dividing the net
income for the period attributable to shareholders of the Company
by the weighted average number of shares outstanding plus any
potentially dilutive shares not yet issued from share-based
compensation plans (see Note 16).
Dilution is defined as a reduction of earnings per share or an
increase of loss per share. When the exercise of outstanding share
options and warrants decreases loss per share, they are considered
to be anti-dilutive and excluded from the calculation of loss per
share. Thus, basic and diluted earnings (loss) per share are equal as
all equity instruments issued, representing 2,778,176 potential
additional ordinary shares, have been considered anti-dilutive.
In thousands of Euros, except for earning per share
As of June 30
2017 2018
Net income (loss) of the reporting period (in kEuros)
(10,113) (11,658)
Adjusted weighted average number of outstanding shares
19,738 721 24,234 223
Basic and diluted earnings (loss) per share (in Euros)
(0.51) (0.48)
Note 21: Management of financial risks
The assessment of risks has not substantially changed since the
Company filed its 2017 registration document. The registration
document is available on the company’s website:
h t t p s : // w w w . g e n s i g h t - b i o l o g i c s . c o m / w p - c o n t e n t /
uploads/2018/05/GENSIGHT_DDR2017_Visa-R18.036.pdf
Note 22: Note 22: Subsequent events
No significant events, that would have a material impact on the
half-year consolidated financial statements occurred subsequent
to June 30, 2018.
GENSIGHT BIOLOGICS – Half-Year Financial Report 2018 – June 30, 2018 – 17
HALF-YEAR CONDENSED CONSOLIDATED FINANCIAL STATEMENTS – JUNE 30, 2018 1


19 – GENSIGHT BIOLOGICS – Half-Year Financial Report 2018 – June 30, 2018
2 ACTIVITY REPORT
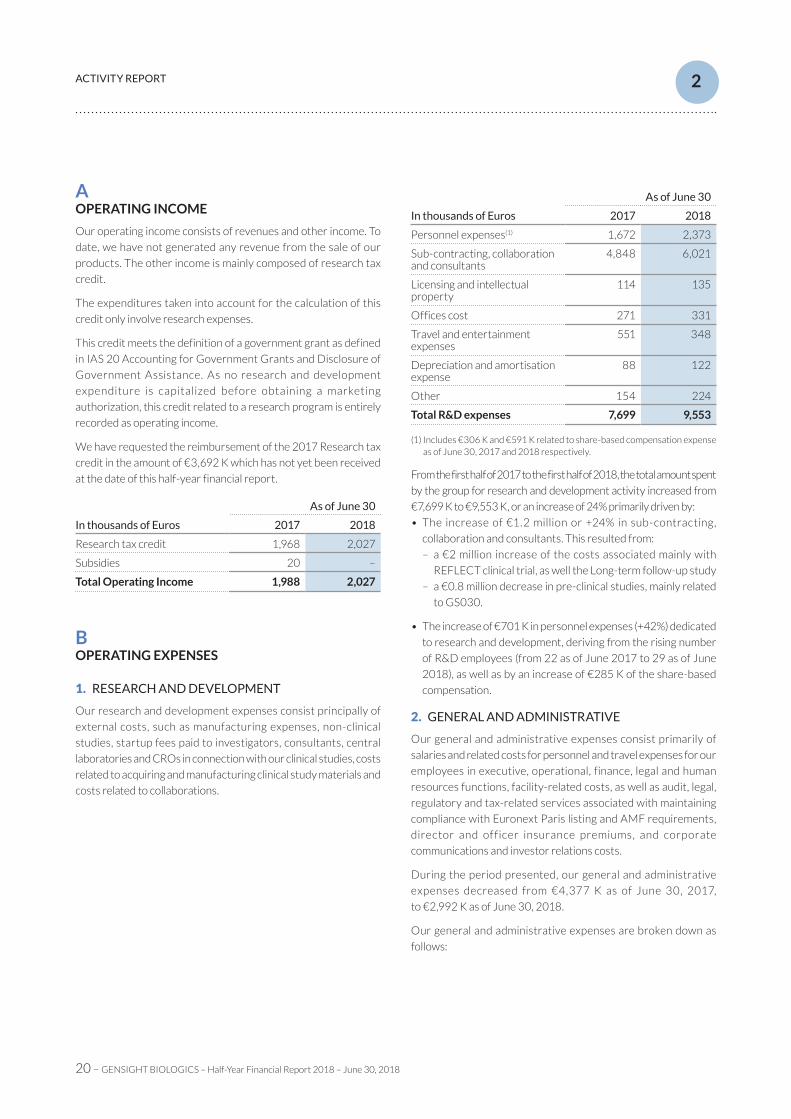
A OPERATING INCOME
Our operating income consists of revenues and other income. To
date, we have not generated any revenue from the sale of our
products. The other income is mainly composed of research tax
credit.
The expenditures taken into account for the calculation of this
credit only involve research expenses.
This credit meets the definition of a government grant as defined
in IAS 20 Accounting for Government Grants and Disclosure of
Government Assistance. As no research and development
expenditure is capitalized before obtaining a marketing
authorization, this credit related to a research program is entirely
recorded as operating income.
We have requested the reimbursement of the 2017 Research tax
credit in the amount of €3,692 K which has not yet been received
at the date of this half-year financial report.
In thousands of Euros
As of June 30
2017 2018
Research tax credit 1,968 2,027
Subsidies 20 –
Total Operating Income 1,988 2,027
B OPERATING EXPENSES
1. RESEARCH AND DEVELOPMENT
Our research and development expenses consist principally of
external costs, such as manufacturing expenses, non-clinical
studies, startup fees paid to investigators, consultants, central
laboratories and CROs in connection with our clinical studies, costs
related to acquiring and manufacturing clinical study materials and
costs related to collaborations.
In thousands of Euros
As of June 30
2017 2018
Personnel expenses(1) 1,672 2,373
Sub-contracting, collaboration and consultants
4,848 6,021
Licensing and intellectual property
114 135
Offices cost 271 331
Travel and entertainment expenses
551 348
Depreciation and amortisation expense
88 122
Other 154 224
Total R&D expenses 7,699 9,553
(1) Includes €306 K and €591 K related to share-based compensation expense as of June 30, 2017 and 2018 respectively.
From the first half of 2017 to the first half of 2018, the total amount spent
by the group for research and development activity increased from
€7,699 K to €9,553 K, or an increase of 24% primarily driven by:
• The increase of €1.2 million or +24% in sub-contracting,
collaboration and consultants. This resulted from:
– a €2 million increase of the costs associated mainly with
REFLECT clinical trial, as well the Long-term follow-up study
– a €0.8 million decrease in pre-clinical studies, mainly related
to GS030.
• The increase of €701 K in personnel expenses (+42%) dedicated
to research and development, deriving from the rising number
of R&D employees (from 22 as of June 2017 to 29 as of June
2018), as well as by an increase of €285 K of the share-based
compensation.
2. GENERAL AND ADMINISTRATIVE
Our general and administrative expenses consist primarily of
salaries and related costs for personnel and travel expenses for our
employees in executive, operational, finance, legal and human
resources functions, facility-related costs, as well as audit, legal,
regulatory and tax-related services associated with maintaining
compliance with Euronext Paris listing and AMF requirements,
director and officer insurance premiums, and corporate
communications and investor relations costs.
During the period presented, our general and administrative
expenses decreased from €4,377 K as of June 30, 2017,
to €2,992 K as of June 30, 2018.
Our general and administrative expenses are broken down as
follows:
20 – GENSIGHT BIOLOGICS – Half-Year Financial Report 2018 – June 30, 2018
ACTIVITY REPORT 2

In thousands of Euros
As of June 30
2017 2018
Personnel expenses(1) 2,944 1,731
Professional Fees 573 424
Communication and travel expenses
520 430
Offices cost 116 132
Equipment rental 8 1
Office furniture and small equipment
30 68
Postal and telecommunication expenses
19 13
Depreciation and amortisation expense
19 15
Attendance fees 65 75
Insurances 35 24
Others 47 81
Total G&A expenses 4,377 2,992
(1) Includes €1,869 K and €824 K related to share-based compensation expense as of June 30, 2017 and 2018 respectively.
The decreased expenditures between the two periods mainly
resulted from a 41% decrease in personnel expenses dedicated to
General and Administration, primarily due to a drop in share-based
compensation expense related to granting performance shares to
employees. Excluding these non-cash share-based compensation
expenses, total personnel expenses dedicated to General and
Administrative decreased by 15.6%.
3. SALES AND MARKETING
Sales and marketing expenses consist primarily of professional fees,
communication and branding fees and personnel costs. If and when
we believe that regulatory approval of the first product candidate
appears likely, we anticipate an increase in payroll and related
expenses as a result of our preparation for commercial operations.
In preparation for GS010 commercialization, we started to invest
in marketing activities in the second half of 2017.
The majority of the sales and marketing expenses as of June 2018
correspond to personnel expenses as well as consulting fees.
In thousands of Euros
As of June 30
2017 2018
Personnel expenses(1) – 338
Professional Fees – 70
Communication and travel expenses
– 319
Offices cost – 40
Depreciation and amortisation expense
3
Others – 15
Total S&M expenses – 785
(1) Includes €176 K related to share-based compensation expense as of June 30, 2018.
C FINANCIAL INCOME (LOSS)
Our net financial profit (loss) decreased to €(355) K as of June 30,
2018 from €(25) K as of June 30, 2017. Our financial expenses
increased from €39 K to €406 K, primarily due to the accrued
interest charges on the conditional advances granted by Bpifrance
(Sight Again collaborative project) booked in June 2018 for an
amount of €374 K.
D NET INCOME (LOSS)
The net loss amounts to €(11,658) K as of June 30, 2018 from
€(10,113) K as of June 30, 2017. The basic and diluted loss per
share (calculated with the adjusted weighted average number of
outstanding shares during the period) amounted to €(0.51) and
€(0.48) as of June 30, 2017 and 2018 respectively.
E NON-CURRENT ASSETS
Non-current assets are composed of intangible, tangible assets and
non-current financial assets. They increased over the period,
amounting to €1,401K as of December 31, 2017 and €1,939 K as
of June 30, 2018. Property, plant and equipment assets have
increased due to the costs deriving from the new premises of the
US subsidiary GenSight Biologics Inc. in its new facility located at
3 East 28th Street - New York, NY 10016.
F CURRENT ASSETS
Current assets amounted to €60,811 K as of December 31, 2017
and €50,861 K as of June 30, 2018. The decrease is essentially due
GENSIGHT BIOLOGICS – Half-Year Financial Report 2018 – June 30, 2018 – 21
ACTIVITY REPORT 2

to the usage of cash and cash equivalents during the first half of
2018, partly offset by the increase of the Research tax credit,
whose reimbursement for 2017 amount have not been yet received
at the date of the present report.
G CHANGES IN SHAREHOLDER’S EQUITY
The changes in shareholder’s equity are primarily due the losses of
the half-year period. Thus, shareholder’s equity amounted to
€54,996 K as of December 31, 2017 and €44,639 K as of June 30,
2018.
H ANALYSIS OF CASH FLOW
For the six-month period
In thousands of euros
ended June 30,
2017 2018
Net cash flows from operating activities
(11,211) (13,070)
Net cash flows from investment activities
5 (366)
Net cash flows from financing activities
20,840 (285)
The net cash flows from operating activities as of June 2018
amount to €(13.1) million and €(11.2) million as of June 2017, mainly
due to the growing expenses engaged in Research and Development
as well as Sales and Marketing.
The negative cash flows from investment activities are due to the
acquisition of property, plant and equipment related to the
furnishing and layout investments of new premises of our US
subsidiary.
The negative cash flows from financing activities are due to the
purchase of own shares as part of the liquidity contract set up on
the second half of 2016, following the 2016 IPO on Euronext Paris.
22 – GENSIGHT BIOLOGICS – Half-Year Financial Report 2018 – June 30, 2018
ACTIVITY REPORT 2

23 – GENSIGHT BIOLOGICS – Half-Year Financial Report 2018 – June 30, 2018
3 TRANSACTIONS BETWEEN RELATED PARTIES

The Group did not conclude any new significant transactions with related parties during the period.
24 – GENSIGHT BIOLOGICS – Half-Year Financial Report 2018 – June 30, 2018
TRANSACTIONS BETWEEN RELATED PARTIES 3

25 – GENSIGHT BIOLOGICS – Half-Year Financial Report 2018 – June 30, 2018
4 RISK FACTORS

Risk factors are similar to those presented in the section 4 of the
2017 Registration Document (pages 17 to 60) and did not change
significantly during the first half-year of 2018. This Registration
Document was registered on April 27, 2018, by The French
“Autorité des Marchés Financiers” (AMF), with number R.18-0036
and was published on April 27, 2018.
This document is available on the Company’s website:
w w w. gensight-biologic s .com and the A MF’s website:
www. amf-france.org.
26 – GENSIGHT BIOLOGICS – Half-Year Financial Report 2018 – June 30, 2018
RISK FACTORS 4

27 – GENSIGHT BIOLOGICS – Half-Year Financial Report 2018 – June 30, 2018
5 STATUTORY AUDITORS’ REVIEW REPORT ON THE 2018 HALF-YEAR FINANCIAL INFORMATION
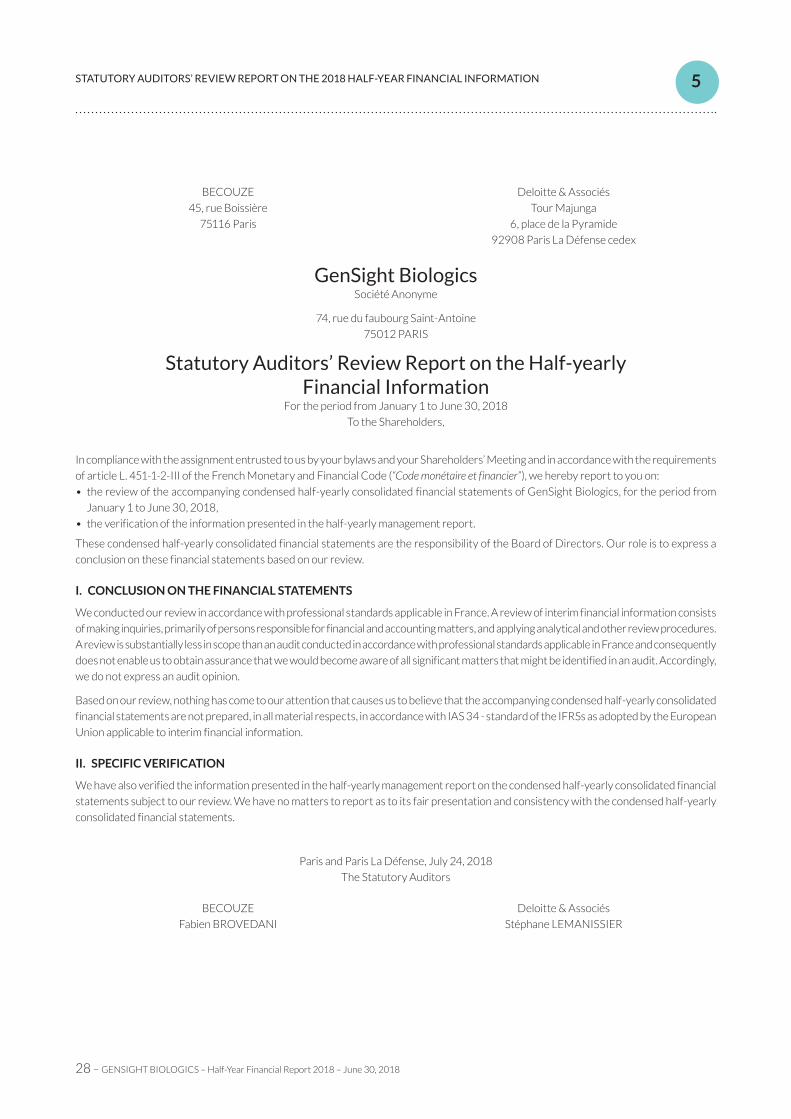
In compliance with the assignment entrusted to us by your bylaws and your Shareholders’ Meeting and in accordance with the requirements
of article L. 451-1-2-III of the French Monetary and Financial Code (“Code monétaire et financier”), we hereby report to you on:
• the review of the accompanying condensed half-yearly consolidated financial statements of GenSight Biologics, for the period from
January 1 to June 30, 2018,
• the verification of the information presented in the half-yearly management report.
These condensed half-yearly consolidated financial statements are the responsibility of the Board of Directors. Our role is to express a
conclusion on these financial statements based on our review.
I. CONCLUSION ON THE FINANCIAL STATEMENTS
We conducted our review in accordance with professional standards applicable in France. A review of interim financial information consists
of making inquiries, primarily of persons responsible for financial and accounting matters, and applying analytical and other review procedures.
A review is substantially less in scope than an audit conducted in accordance with professional standards applicable in France and consequently
does not enable us to obtain assurance that we would become aware of all significant matters that might be identified in an audit. Accordingly,
we do not express an audit opinion.
Based on our review, nothing has come to our attention that causes us to believe that the accompanying condensed half-yearly consolidated
financial statements are not prepared, in all material respects, in accordance with IAS 34 - standard of the IFRSs as adopted by the European
Union applicable to interim financial information.
II. SPECIFIC VERIFICATION
We have also verified the information presented in the half-yearly management report on the condensed half-yearly consolidated financial
statements subject to our review. We have no matters to report as to its fair presentation and consistency with the condensed half-yearly
consolidated financial statements.
GenSight BiologicsSociété Anonyme
74, rue du faubourg Saint-Antoine
75012 PARIS
Statutory Auditors’ Review Report on the Half-yearly Financial Information
For the period from January 1 to June 30, 2018
To the Shareholders,
BECOUZE
45, rue Boissière
75116 Paris
Deloitte & Associés
Tour Majunga
6, place de la Pyramide
92908 Paris La Défense cedex
Paris and Paris La Défense, July 24, 2018
The Statutory Auditors
BECOUZE
Fabien BROVEDANI
Deloitte & Associés
Stéphane LEMANISSIER
28 – GENSIGHT BIOLOGICS – Half-Year Financial Report 2018 – June 30, 2018
STATUTORY AUDITORS’ REVIEW REPORT ON THE 2018 HALF-YEAR FINANCIAL INFORMATION 5

29 – GENSIGHT BIOLOGICS – Half-Year Financial Report 2018 – June 30, 2018
6 DECLARATION BY THE PERSON RESPONSIBLE FOR THE 2018 HALF-YEAR FINANCIAL REPORT
“I declare that, to the best of my knowledge, the summary consolidated financial statements for the ending semester have been prepared in accordance with applicable accounting standards and give a true and fair view of the assets and liabilities, financial position and profit and loss of the Company and all the other companies included in the scope of consolidation, and that this Half-year Activity Report includes a fair review of the important events which occurred during the first six months of the year, their impact on the half-year financial statements and the main transactions between related parties, together with a description of the principal risks and uncertainties that they face in the remaining six months of the year.”
Paris, July 24, 2018
Bernard GillyChief Executive Officer
30 – GENSIGHT BIOLOGICS – Half-Year Financial Report 2018 – June 30, 2018
DECLARATION BY THE PERSON RESPONSIBLE FOR THE 2018 HALF-YEAR FINANCIAL REPORT 6

Designed & published by +33 (0)1 40 55 16 66

74, rue du Faubourg Saint-Antoine
75012 Paris, France