haitong csi300 index etf 30.06.2016 final clean - htisec.com · haitong csi300 index etf (a...
TRANSCRIPT
RESTRICTED
Unaudited Semi-Annual Report 2016
HAITONG ETF SERIES – HAITONG CSI300 INDEX ETF
(A sub-fund of the Haitong ETF series as an
umbrella unit trust under Hong Kong law)
For the period from 1 January 2016 to 30 June 2016

RESTRICTED
HAITONG CSI300 INDEX ETF
(A SUB-FUND OF HAITONG ETF SERIES)
CONTENTS
Pages
MANAGEMENT AND ADMINISTRATION 1 - 2
REPORT OF THE MANAGER TO THE UNITHOLDERS 3
STATEMENT OF FINANCIAL POSITION (UNAUDITED) 4
INVESTMENT PORTFOLIO (UNAUDITED) 5 - 12
STATEMENT OF MOVEMENTS IN INVESTMENT PORTFOLIO (UNAUDITED) 13 - 24
PERFORMANCE TABLE (UNAUDITED) 25
DISTRIBUTION DISCLOSURE (UNAUDITED) 26
UNDERLYING INDEX CONSTITUENT STOCKS DISCLOSURE 27
REPORT ON INVESTMENT OVERWEIGHT (UNAUDITED) 28

RESTRICTED 1
HAITONG CSI300 INDEX ETF
(A SUB-FUND OF HAITONG ETF SERIES)
MANAGEMENT AND ADMINISTRATION
Directors of the Manager
Lo Wai Ho
Zhang Xinjun
Zhang Yibin
Yang Jianxin
Poon Mo Yiu (Resigned on 16 February 2016)
Manager
Hai Tong Asset Management (HK) Limited
22/F, Li Po Chun Chambers
189 Des Voeux Road Central
Hong Kong
Trustee and Registrar
HSBC Institutional Trust Services (Asia) Limited
1 Queen’s Road Central
Hong Kong
Auditors
Ernst & Young
22/F, CITIC Tower
1 Tim Mei Avenue Central
Hong Kong
Service Agent
HK Conversion Agency Services Limited
2/F, Infinitus Plaza
199 Des Voeux Road Central
Hong Kong
Custodian
The Hongkong and Shanghai Banking
Corporation Limited
1 Queen’s Road Central
Hong Kong
Legal Advisers to the Manager
King & Wood Mallesons
13/F, Gloucester Tower
The Landmark
15 Queen’s Road Central
Hong Kong
PRC Custodian
HSBC Bank (China) Company Limited
33/F, HSBC Building Shanghai IFC
8 Century Avenue, Pudong
Shanghai 200120, China
RQFII Holder
Haitong International Holdings Limited
22/F, Li Po Chun Chambers
189 Des Voeux Road Central
Hong Kong

RESTRICTED 2
HAITONG CSI300 INDEX ETF
(A SUB-FUND OF HAITONG ETF SERIES)
MANAGEMENT AND ADMINISTRATION (continued)
Participating Dealers
ABN AMRO Clearing Hong Kong Limited
Level 70, International Commerce Centre,
1 Austin Road West, Kowloon,
Hong Kong
China Merchants Securities (HK) Co., Limited
48/F, One Exchange Square, Central,
Hong Kong
Credit Suisse Securities (Hong Kong) Limited
6/F, Alexandra House,
18 Chater Road, Central,
Hong Kong
Goldman Sachs (Asia) Securities Limited
68/F Cheung Kong Center,
2 Queen’s Road Central,
Hong Kong
Haitong International Securities Company Limited
22/F Li Po Chun Chambers,
189 Des Voeux Road Central,
Hong Kong
The Hongkong and Shanghai Banking Corporation Limited
1 Queen’s Road Central,
Hong Kong
KGI Securities (Hong Kong) Limited
41/F, Central Plaza,
18 Harbour Road, Wanchai,
Hong Kong
Merrill Lynch Far East Limited
15/F, Citibank Tower,
3 Garden Road, Central,
Hong Kong
Nomura International (Hong Kong) Limited
30/F, Two International Finance Centre,
8 Finance Street, Central,
Hong Kong
(Terminated with effect from 18 February 2016)
Standard Chartered Bank (Hong Kong) Limited
32/F, 4-4A Des Veoux Road, Central,
Hong Kong
UBS Securities Hong Kong Limited
42/F, One Exchange Square,
8 Connaught Road, Central,
Hong Kong
SG Securities (HK) Limited
38/F, Three Pacific Place,
1 Queen’s Road East,
Hong Kong

RESTRICTED 3
HAITONG CSI300 INDEX ETF
(A SUB-FUND OF HAITONG ETF SERIES)
REPORT OF THE MANAGER TO THE UNITHOLDERS
Market Review
On macroeconomic level, in the first half of 2016, China's economic operation was stable. China's GDP was
up 6.7% from a year earlier, laid a good foundation for completing the annual economic goals. The industrial
production rose stable, improved profitability, fixed asset investment growth fell back, online retailing was
growing rapidly, import and export declined narrowed and general trade proportion raised. In general, the
economic structure optimized.
In the first half of 2016, the CSI 300 index was down 15.47%, and the valuation was13.4x PE (based on
expected earnings of 2016).
Portfolio Review
In the first half of 2016, Fund’s NAV per unit decreased 15.80%. The annualized tracking error of the fund is
0.757%.
Market Outlook
In the first half of 2016, the risk of the China’s A-share market’s volatility reduced smoothly. The reducing of
the A-share market leverage will help the market to keep stable development.
Looking forward to the next period,Supply side structural reforms will be the most important work of China
economy. In addition, cultivating new economic structure, strengthening the new momentum of development,
promoting the national economy sustainable and healthy development will be the important work targets to
continue to push forward.
In general, we hold a positive view on the A share market in the next period of 2016.
Hai Tong Asset Management (HK) Limited

RESTRICTED 4
HAITONG CSI300 INDEX ETF
(A SUB-FUND OF HAITONG ETF SERIES)
STATEMENT OF FINANCIAL POSITION (Unaudited)
As at 30 June 2016
(Unaudited) (Audited)
As at 30 June As at 31 December
2016 2015
RMB RMB
ASSETS
Financial assets at fair value through profit or loss 252,783,730 376,255,688
Deposit reserve - China Exchange Clearing 380,800 380,800
Prepayments and other receivables 46,784 24,406
Cash and bank balances 2,406,149 3,098,363
––––––––––– –––––––––––
TOTAL ASSETS 255,617,463 379,759,257
══════════ ══════════ LIABILITIES
Management fee payable 126,980 191,825
Trustee fee payable 40,000 48,156
Other payables and accruals 402,342 565,520
––––––––––– –––––––––––
TOTAL LIABILITIES 569,322 805,501
══════════ ══════════
EQUITY
Net assets value attributable to unitholders 255,048,141 378,953,756
══════════ ══════════
TOTAL LIABILITIES AND EQUITY 255,617,463 379,759,257
══════════ ══════════
Number of units in issue 22,000,000 27,500,000
══════════ ══════════
Net asset value per unit 11.5931 13.7801
══════════ ══════════

HAITONG CSI300 INDEX ETF
(A SUB-FUND OF HAITONG ETF SERIES)
INVESTMENT PORTFOLIO (Unaudited)
As at 30 June 2016
RESTRICTED 5
Fair value % of Net
Holdings RMB Assets
Listed equities
China
Agricultural Bank of China Ltd 1,137,700 3,640,640 1.43
Aier Eye Hospital Group Co Ltd 11,747 429,118 0.17
Air China Ltd 76,100 514,436 0.20
Aisino Co Ltd 32,934 783,829 0.31
Alpha Group (formerly known as Guangdong Alpha Animation and
Culture Co Ltd) 15,398 461,170 0.18
Aluminum Corporation of China Ltd 163,100 614,887 0.24
Angang Steel Co Ltd 54,900 210,267 0.08
Anhui Conch Cement Co Ltd 59,504 865,188 0.34
Anxin Trust Co Ltd 26,300 443,681 0.17
Aurora Optoelectronics Co Ltd 5,400 187,704 0.07
AVIC Aero-Engine Controls Co Ltd 13,600 359,040 0.14
AVIC Aircraft Co Ltd 32,900 647,801 0.25
AVIC Aviation Engine Corporation Plc 22,959 795,529 0.31
AVIC Helicopter Co Ltd 7,000 290,360 0.11
AVIC Investment Holdings Co Ltd 133,200 783,216 0.31
Bank of Beijing Co Ltd 301,698 3,128,608 1.23
Bank of China Ltd 627,200 2,013,312 0.79
Bank of Communications Co Ltd 815,400 4,590,702 1.80
Bank of Nanjing Co Ltd 108,190 1,015,904 0.40
Bank of Ningbo Co Ltd 58,016 857,476 0.34
Baoshan Iron & Steel Co Ltd 147,000 720,300 0.28
BBMG Corporation 37,200 288,300 0.11
Beijing Capital Co Ltd 69,100 268,799 0.11
Beijing Capital Development Co Ltd 26,500 294,680 0.12
Beijing Dabeinong Technology Group Co Ltd 61,000 491,660 0.19
Beijing Enlight Media Co Ltd 26,160 302,410 0.12
Beijing Gehua CATV Networks Co Ltd 16,512 251,148 0.10
Beijing Jingneng Thermal Power Co Ltd 39,500 169,060 0.07
Beijing Origin Water Technology Co Ltd 46,106 686,057 0.27
Beijing Shiji Information Technology Co Ltd 9,200 242,696 0.09
Beijing Tongrentang Co Ltd 16,319 486,143 0.19
Beijing Ultrapower Software Co Ltd 35,600 378,784 0.15
Beijing Xinwei Telecom Technology Group Co Ltd 34,800 620,832 0.24
Beijing Yanjing Brewery Co Ltd 41,948 318,385 0.12
BlueFocus Communication Group Co Ltd 41,545 403,402 0.16
BOE Technology Group Co Ltd 707,280 1,633,817 0.64
Bohai Financial Investment Holding Co Ltd (formerly known as Bohai
Leasing Co Ltd) 62,500 426,250 0.17
BYD Co Ltd 18,406 1,122,950 0.44

HAITONG CSI300 INDEX ETF
(A SUB-FUND OF HAITONG ETF SERIES)
INVESTMENT PORTFOLIO (Unaudited) (continued)
As at 30 June 2016
RESTRICTED 6
Fair value % of Net
Holdings RMB Assets
Listed equities (continued)
China (continued)
CECEP Wind Power Corporation Co Ltd 6,200 61,566 0.02
Changjiang Securities Co Ltd 98,748 1,145,477 0.45
China Avionics Systems Co Ltd 15,644 304,589 0.12
China Baoan Group Co Ltd 45,640 625,268 0.24
China CITIC Bank Corporation Ltd 91,238 517,319 0.20
China Coal Energy Co Ltd 54,493 281,184 0.11
China Communications Construction Co Ltd 45,500 479,115 0.19
China Construction Bank Corporation 223,500 1,061,625 0.42
China COSCO Holdings Co Ltd 109,700 557,276 0.22
China CSSC Holdings Ltd 20,448 455,172 0.18
China Dongfanghong Spacesat Co Ltd 17,601 591,394 0.23
China Eastern Airlines Corporation Ltd 101,000 667,610 0.26
China Everbright Bank Co Ltd 473,900 1,781,864 0.70
China First Heavy Industries Co Ltd 77,800 405,338 0.16
China Fortune Land Development Co Ltd 25,900 631,442 0.25
China Hainan Rubber Industry Group Co Ltd 35,100 196,209 0.08
China International Marine Containers (Group) Co Ltd 22,005 311,811 0.12
China International Travel Service Corporation Ltd 14,022 616,688 0.24
China Life Insurance Co Ltd 49,653 1,033,775 0.40
China Merchants Bank Co Ltd 306,984 5,372,220 2.11
China Merchants Energy Shipping Co Ltd 63,100 295,308 0.12
China Merchants Securities Co Ltd 86,400 1,425,600 0.56
China Merchants Shekou Industrial Zone Co Ltd 69,812 994,821 0.39
China Minsheng Banking Co Ltd 703,538 6,282,594 2.46
China Molybdenum Co Ltd 108,233 449,167 0.18
China National Chemical Engineering Co Ltd 58,800 325,164 0.13
China National Nuclear Power Co Ltd 138,900 948,687 0.37
China Northern Rare Earth (Group) High-Tech Co Ltd 64,850 863,153 0.34
China Oilfield Services Ltd 17,641 214,338 0.08
China Pacific Insurance Group Co Ltd 93,565 2,529,998 0.99
China Petroleum & Chemical Corporation 312,800 1,476,416 0.58
China Railway Group Ltd 166,400 1,159,808 0.45
China Railways Construction Corporation 102,800 1,023,888 0.40
China Resources Sanjiu Medical and Pharmaceutical Co Ltd 11,606 281,097 0.11
China Shenhua Energy Co Ltd 58,913 828,906 0.32
China Shipbuilding Industry Co Ltd 286,152 1,811,342 0.71
China Shipping Container Lines Co Ltd 94,400 373,824 0.15
China South Publishing & Media Group Co Ltd 21,332 386,323 0.15
China Southern Airlines Co Ltd 104,500 737,770 0.29

HAITONG CSI300 INDEX ETF
(A SUB-FUND OF HAITONG ETF SERIES)
INVESTMENT PORTFOLIO (Unaudited) (continued)
As at 30 June 2016
RESTRICTED 7
Fair value % of Net
Holdings RMB Assets
Listed equities (continued)
China (continued)
China State Construction Engineering Corporation Ltd 446,400 2,374,848 0.93
China United Network Communications Ltd 252,323 961,351 0.38
China Vanke Co Ltd 295,916 6,051,482 2.37
China XD Electric Co Ltd 61,000 309,270 0.12
China Yangtze Power Co Ltd 191,800 2,395,582 0.94
Chinese Universe Publishing & Media Co Ltd 16,300 338,225 0.13
Chongqing Changan Automobile Co Ltd 67,200 918,624 0.36
CITIC Guoan Information Industry Co Ltd 32,600 694,706 0.27
CITIC Heavy Industries Co Ltd 38,400 206,208 0.08
CITIC Securities Co Ltd 234,156 3,800,352 1.49
Cofco Tunhe Co Ltd 24,300 280,665 0.11
CRRC Corporation Ltd 272,870 2,502,218 0.98
CSSC Offshore and Marine Engineering (Group) Co Ltd 5,800 147,088 0.06
Daqin Railway Co Ltd 177,048 1,140,189 0.45
Datang International Power Generation Co Ltd 89,300 347,377 0.14
DHC Software Co Ltd 29,802 748,030 0.29
Dongfang Electric Corporation Ltd 35,700 350,574 0.14
Dongxing Securities Co Ltd 26,900 657,436 0.26
Dongxu Optoelectronic Technology Co Ltd 52,824 453,758 0.18
Dr Peng Telecom & Media Group Co Ltd 33,600 612,528 0.24
East Money Information Co Ltd 62,760 1,393,272 0.55
Eternal Asia Supply Chain Management Ltd 37,294 534,050 0.21
Everbright Securities Co Ltd 34,900 591,206 0.23
FAW Car Co Ltd 24,210 263,405 0.10
Finance Street Holding Co Ltd 44,500 432,540 0.17
Founder Securities Co Ltd 122,500 938,350 0.37
Fuyao Glass Industry Group Co Ltd 41,688 583,632 0.23
GD Power Development Co Ltd 340,400 997,372 0.39
Gemdale Corporation 67,000 694,120 0.27
Gezhouba Group Co Ltd 82,200 478,404 0.19
GF Securities Co Ltd 88,111 1,476,740 0.58
GoerTek Inc 27,300 782,964 0.31
Gousen Securities Co Ltd 73,000 1,259,250 0.49
Great Wall Motor Co Ltd 35,900 302,996 0.12
Gree Electric Appliances Inc of Zhuhai 169,914 3,265,747 1.28
Greenland Holdings Corporation Ltd 8,700 94,134 0.04
GRG Banking Equipment Co Ltd 24,200 397,848 0.16
Guangdong By-Health Biotechnology Co Ltd 20,900 282,986 0.11
Guangdong Golden Dragon Development Inc 13,000 269,880 0.11

HAITONG CSI300 INDEX ETF
(A SUB-FUND OF HAITONG ETF SERIES)
INVESTMENT PORTFOLIO (Unaudited) (continued)
As at 30 June 2016
RESTRICTED 8
Fair value % of Net
Holdings RMB Assets
Listed equities (continued)
China (continued)
Guanghui Energy Co Ltd 93,220 382,202 0.15
Guangshen Railway Co Ltd 100,899 394,515 0.15
Guangxi Wuzhou Zhongheng Group Co Ltd 82,774 359,239 0.14
Guangzhou Baiyunshan Pharmaceutical Holdings Co Ltd 15,877 391,209 0.15
Guangzhou Development Industry (Holdings) Co Ltd 19,400 151,708 0.06
Guangzhou Haige Communication Group 53,906 670,591 0.26
Guizhou Bailing Group Pharmaceutical Co Ltd 10,030 172,516 0.07
Guotai Junan Securities Co Ltd 45,400 807,666 0.32
Guoyuan Securities Co Ltd 36,901 616,985 0.24
Hainan Airlines Co Ltd 175,800 557,286 0.22
Haitong Securities Co Ltd 240,847 3,713,861 1.46
Hangzhou Hikvision Digital Technology Co Ltd 54,526 1,170,128 0.46
Han's Laser Technology Industry Group Co Ltd 25,341 578,788 0.23
Hedy Holding Co Ltd 14,600 241,046 0.09
Heilan Home Co Ltd 40,100 453,130 0.18
Henan Shuanghui Investment & Development Co Ltd 29,458 615,083 0.24
Hesteel Company Ltd (formerly known as Hebei Iron & Steel Co Ltd) 126,400 350,128 0.14
Hisense Electric Co Ltd 23,441 414,437 0.16
Hua Xia Bank Co Ltd 159,013 1,572,639 0.62
Huadian Power International Corporation Ltd 72,700 359,865 0.14
Huadong Medicine Co Ltd 7,047 474,968 0.19
Hualan Biological Engineering Inc 13,860 435,204 0.17
Huaneng Power International Inc 124,997 939,977 0.37
Huatai Securities Co Ltd 97,181 1,838,665 0.72
Huawen Media Investment Group Corporation 58,900 581,932 0.23
Huayi Brothers Media Corporation 58,074 786,322 0.31
HUAYU Automotive Systems Co Ltd 37,512 525,543 0.21
Hubei Energy Group Co Ltd 55,900 258,817 0.10
Hunan TV & Broadcast Intermediary Co Ltd 33,726 557,491 0.22
Hundsun Electronic Co Ltd 14,714 982,454 0.38
iFLYTEK Co Ltd 26,976 886,162 0.35
Industrial and Commercial Bank of China Ltd 708,900 3,147,516 1.23
Industrial Bank Co Ltd 396,912 6,048,939 2.37
Industrial Securities Co Ltd 139,490 1,030,831 0.40
Inner Mongolia Junzheng Energy & Chemical Industry Co Ltd 36,608 273,462 0.11
Inner Mongolia MengDian HuaNeng Thermal Power Corporation Ltd 86,400 260,928 0.10
Inner Mongolia Yili Industrial Group Co Ltd 180,540 3,009,602 1.18
Inner Mongolian BaoTou Steel Union Co Ltd 290,700 831,402 0.33
Inspur Electronic Information Industry Co Ltd 14,300 335,335 0.13

HAITONG CSI300 INDEX ETF
(A SUB-FUND OF HAITONG ETF SERIES)
INVESTMENT PORTFOLIO (Unaudited) (continued)
As at 30 June 2016
RESTRICTED 9
Fair value % of Net
Holdings RMB Assets
Listed equities (continued)
China (continued)
Jiangsu Broadcasting Cable Information Network Corporation Ltd 17,800 248,488 0.10
Jiangsu Hengrui Medicine Co Ltd 42,167 1,691,318 0.66
Jiangsu Phoenix Publishing & Media Corporation Ltd 22,700 239,258 0.09
Jiangsu Protruly Vision Technology Group Co Ltd 21,900 326,748 0.13
Jiangsu Yanghe Brewery Joint-Stock Co Ltd 17,729 1,275,070 0.50
Jiangxi Copper Co Ltd 24,690 332,821 0.13
Jihua Group Corporation Ltd 45,900 350,676 0.14
Jilin Aodong Medicine Industry Groups Co Ltd 21,242 529,988 0.21
Jinduicheng Molybdenum Co Ltd 28,767 234,451 0.09
Jointown Pharmaceutical Group Co Ltd 9,800 171,598 0.07
Juneyao Airlines Co Ltd 4,200 110,250 0.04
Kangde Xin Group Co Ltd (formerly known as Jiangsu Kangde Xin
Composite Material Co Ltd) 76,655 1,310,800 0.51
Kangmei Pharmaceutical Co Ltd 92,046 1,398,179 0.55
Kweichow Moutai Co Ltd 14,962 4,367,707 1.71
Lepu Medical Technology Co Ltd 26,000 474,240 0.19
Leshi Internet Information & Technology (Beijing) Co Ltd 27,600 1,460,316 0.57
Liaoning Cheng Da Co Ltd 36,257 564,521 0.22
Luxin Venture Capital Group Co Ltd 8,900 192,329 0.08
Luxshare Precision Industry Co Ltd 23,961 470,834 0.18
Luzhou Laojiao Co Ltd 20,833 618,740 0.24
Material Industry Zhongda Group Co Ltd 27,280 255,341 0.10
MeiHua Holdings Group Co Ltd 55,500 344,655 0.13
Metallurgical Corporation of China Ltd 145,000 535,050 0.21
Midea Group Co Ltd 95,190 2,257,907 0.89
NARI Technology Development Co Ltd 43,367 579,817 0.23
Neusoft Co Ltd 28,778 527,213 0.21
New China Life Insurance Co Ltd 23,232 938,573 0.37
New Hope Liuhe Co Ltd 62,000 515,840 0.20
Ningbo Port Co Ltd 114,300 565,785 0.22
Northeast Securities Co Ltd 40,412 521,719 0.20
Oceanwide Holdings Co Ltd 45,200 456,972 0.18
Offshore Oil Engineering Co Ltd 65,800 454,678 0.18
Orient Securities Co Ltd 78,400 1,317,904 0.52
Ourpalm Co Ltd 55,100 577,999 0.23
Pacific Security Co Ltd 135,200 828,776 0.32
Pang Da Automobile Trade Co Ltd 127,500 350,625 0.14
Pangang Group Vanadium Titanium & Resources Co Ltd 133,800 319,782 0.13
People.cn Co Ltd 16,440 273,068 0.11
PetroChina Co Ltd 144,534 1,044,981 0.41

HAITONG CSI300 INDEX ETF
(A SUB-FUND OF HAITONG ETF SERIES)
INVESTMENT PORTFOLIO (Unaudited) (continued)
As at 30 June 2016
RESTRICTED 10
Fair value % of Net
Holdings RMB Assets
Listed equities (continued)
China (continued)
Ping An Bank Co Ltd 205,576 1,788,511 0.70
Ping An Insurance (Group) Co of China Ltd 322,092 10,319,828 4.05
Poly Real Estate Group Co Ltd 192,100 1,657,823 0.65
Power Construction Corporation of China 122,800 701,188 0.27
Qingdao Haier Co Ltd 90,846 806,712 0.32
Qinghai Salt Lake Potash Co Ltd 21,500 453,650 0.18
Risesun Real Estate Development Co Ltd 37,534 252,228 0.10
SAIC Motor Corporation Ltd 98,385 1,996,232 0.78
Sanan Optoelectronics Co Ltd 37,905 756,963 0.30
Sany Heavy Industry Co Ltd 113,332 568,927 0.22
SDIC Essence Holdings Co Ltd 32,800 584,496 0.23
SDIC Power Holdings Co Ltd 101,020 666,732 0.26
Sealand Securities Co Ltd 62,810 464,166 0.18
Searainbow Holding Corporation 21,300 856,473 0.34
Shaanxi Coal Industry Co Ltd 59,500 307,615 0.12
Shandong Dong-E E-Jiao Co Ltd 15,496 818,654 0.32
Shandong Gold Mining Co Ltd 21,125 821,974 0.32
Shandong Iron and Steeel Co Ltd 40,000 94,800 0.04
Shandong Kingenta Ecological Engineering Co Ltd 45,100 363,055 0.14
Shanghai 2345 Network Holdings Group Co Ltd 21,400 263,006 0.10
Shanghai Bailian Group Co Ltd 23,000 277,840 0.11
Shanghai Bairun Investment Holding Group Co Ltd 4,300 94,600 0.04
Shanghai Construction Co Ltd 79,894 305,994 0.12
Shanghai Electric Group Co Ltd 88,000 665,280 0.26
Shanghai Electric Power Co Ltd 25,500 261,885 0.10
Shanghai Fosun Pharmaceutical (Group) Co Ltd 34,049 647,612 0.25
Shanghai International Airport Co Ltd 28,628 745,759 0.29
Shanghai International Port Group Co Ltd 96,520 492,252 0.19
Shanghai Lujiazui Finance & Trade Zone Development Co Ltd 21,856 497,224 0.19
Shanghai Oriental Pearl Media Co Ltd 39,080 948,472 0.37
Shanghai Pharmaceutical Co Ltd 34,364 620,270 0.24
Shanghai Pudong Development Bank Co Ltd 257,290 4,006,005 1.57
Shanghai RAAS Blood Products Co Ltd 16,410 618,329 0.24
Shanghai SMI Holding Co Ltd 45,500 653,380 0.26
Shanghai Tunnel Engineering Co Ltd 46,800 392,652 0.15
Shanghai Waigaoqiao FTZ Development Co Ltd 11,053 217,855 0.09
Shanghai Wangsu Science & Technology Co Ltd 13,872 932,198 0.37
Shanghai Zhangjiang Hi-Tech Park Development Co Ltd 23,100 417,648 0.16
Shanxi Securities Co Ltd 33,000 546,480 0.21

HAITONG CSI300 INDEX ETF
(A SUB-FUND OF HAITONG ETF SERIES)
INVESTMENT PORTFOLIO (Unaudited) (continued)
As at 30 June 2016
RESTRICTED 11
Fair value % of Net
Holdings RMB Assets
Listed equities (continued)
China (continued)
Shanxi Taigang Stainless Steel Co Ltd 67,800 214,248 0.08
Shenergy Co Ltd 67,800 389,172 0.15
Shenwan Hongyuan Group Co Ltd 132,635 1,115,460 0.44
Shenzhen Agricultural Products Co Ltd 25,191 306,323 0.12
Shenzhen Energy Group Co Ltd 35,400 225,852 0.09
Shenzhen Hepalink Pharmaceutical Co Ltd 10,900 190,314 0.07
Shenzhen Infogem Technologies Co Ltd 6,500 194,350 0.08
Shenzhen Inovance Technology Co Ltd 27,698 537,341 0.21
Shenzhen Kingdom Sci-Tech Co Ltd 14,900 535,655 0.21
Shenzhen O-film Tech Co Ltd 21,450 632,775 0.25
Shenzhen Overseas Chinese Town Co Ltd 97,700 625,280 0.24
Shenzhen Salubris Pharmaceuticals Co Ltd 9,348 254,266 0.10
Shenzhen Zhongjin Lingnan Nonfemet Co Ltd 44,990 469,246 0.18
Siasun Robot & Automation Co Ltd 32,520 825,683 0.32
Sichuan Changhong Electric Co Ltd 109,900 485,758 0.19
Sichuan Chuantou Energy Co Ltd 65,500 541,030 0.21
Sichuan Kelun Pharmaceutic Co Ltd 25,700 396,037 0.16
Sinolink Securities Co Ltd 54,086 729,079 0.29
Sinopec Oilfield Service Corporation 42,800 164,352 0.06
Sinopec Shanghai Petrochemical Co Ltd 65,200 397,720 0.16
Songcheng Performance Development Co Ltd 17,300 430,943 0.17
Soochow Security Co Ltd 62,266 834,364 0.33
Sound Environmental Resources Co Ltd 15,319 467,995 0.18
Southwest Securities Co Ltd 83,990 609,767 0.24
Spring Airlines Co Ltd 7,100 340,374 0.13
Suning Commerce Group Co Ltd 110,900 1,204,374 0.47
Suzhou Gold Mantis Constructions 45,864 459,557 0.18
Tasly Pharmaceutical Group Co Ltd 19,324 691,026 0.27
TBEA Co Ltd 77,237 658,059 0.26
TCL Corporation 218,100 717,549 0.28
Tian Di Science & Technology Co Ltd 39,300 176,850 0.07
Tianjin Zhonghuan Semiconductor Co Ltd 41,160 341,216 0.13
Tonghua Dongbao Pharmaceutical Co Ltd 28,436 588,341 0.23
Tongling Nonferrous Metals Group Co Ltd 182,200 462,788 0.18
Tsinghua Tongfang Co Ltd 52,900 791,384 0.31
Tsingtao Brewery Co Ltd 8,236 239,421 0.09
Wanda Cinema Line Co Ltd 14,000 1,118,600 0.44
WanHua Chemical Group Co Ltd 32,206 557,164 0.22
Wanxiang Qianchao Co Ltd 34,160 532,896 0.21

HAITONG CSI300 INDEX ETF
(A SUB-FUND OF HAITONG ETF SERIES)
INVESTMENT PORTFOLIO (Unaudited) (continued)
As at 30 June 2016
RESTRICTED 12
Fair value % of Net
Holdings RMB Assets
Listed equities (continued)
China (continued)
Wasu Media Holdings Co Ltd 11,000 204,050 0.08
Weichai Power Co Ltd 72,124 563,288 0.22
Western Securities Co Ltd 40,000 1,034,400 0.41
Wintime Energy Co Ltd 109,340 430,800 0.17
Wuhan Iron and Steel Co Ltd 120,200 331,752 0.13
Wuliangye Yibin Co Ltd 56,479 1,837,262 0.72
XCMG Construction Machinery Co Ltd 126,500 387,090 0.15
Xiamen C&D Inc 50,858 610,296 0.24
Xinhu Zhongbao Co Ltd 124,800 527,904 0.21
Xinjiang Goldwind Science & Technology Co Ltd 46,500 703,545 0.28
Xinxing Ductile Iron Pipes Co Ltd 65,000 301,600 0.12
Yanzhou Coal Mining Co Ltd 11,399 124,705 0.05
Yingkou Port Group Co Ltd 57,800 194,208 0.08
Yonghui Superstores Co Ltd 121,024 499,829 0.20
Yonyou Network Technology Co Ltd 21,024 411,650 0.16
Youngor Group Co Ltd 45,705 630,272 0.25
Yunnan Baiyao Group Co Ltd 15,443 992,985 0.39
Zhejiang China Commodities City Group Co Ltd 80,900 499,962 0.20
Zhejiang Dahua Technology Co Ltd 43,180 565,658 0.22
Zhejiang Huace Film & TV Co Ltd 20,740 322,922 0.13
Zhejiang Longsheng Group Co Ltd 67,766 584,143 0.23
Zhejiang Zheneng Electric 113,560 578,020 0.23
Zhengzhou Yutong Bus Co Ltd 39,501 782,120 0.31
Zhongjin Gold Co Ltd 50,111 563,248 0.22
Zhongtian Urban Development Group Co Ltd 77,200 480,956 0.19
Zijin Mining Group Co Ltd 282,100 950,677 0.37
Zoomlion Heavy Industry Science & Technology Co Ltd 130,769 540,076 0.21
ZTE Corporation 70,171 1,006,252 0.39
–––––––––– –––––––
Total investments, at fair value 252,783,730 99.11
══════════ ══════
Total investments, at cost 241,626,241
══════════

HAITONG CSI300 INDEX ETF
(A SUB-FUND OF HAITONG ETF SERIES)
STATEMENT OF MOVEMENTS IN INVESTMENT PORTFOLIO (Unaudited)
For the period from 1 January 2016 to 30 June 2016
RESTRICTED 13
At 1
January
2016 Additions Disposals
Corporate
actions
At 30
June
2016
Listed equities
China
Agricultural Bank of China Ltd 1,457,900 - (320,200) - 1,137,700
Aier Eye Hospital Group Co Ltd 14,947 100 (3,300) - 11,747
Air China Ltd 97,500 - (21,400) - 76,100
Aisino Co Ltd 20,467 - (4,700) 17,167 32,934
Alpha Group (formerly known as
Guangdong Alpha Animation and
Culture Co Ltd) 19,298 500 (4,400) - 15,398
Aluminum Corporation of China Ltd 209,000 - (45,900) - 163,100
Angang Steel Co Ltd 70,400 - (15,500) - 54,900
Anhui Conch Cement Co Ltd 76,304 - (16,800) - 59,504
Anxin Trust Co Ltd - 26,900 (600) - 26,300
Aurora Optoelectronics Co Ltd - 5,600 (200) - 5,400
AVIC Aero-Engine Controls Co Ltd 17,500 - (3,900) - 13,600
AVIC Aircraft Co Ltd 42,200 - (9,300) - 32,900
AVIC Aviation Engine Corporation
Plc 29,759 1,500 (8,300) - 22,959
AVIC Helicopter Co Ltd 9,000 200 (2,200) - 7,000
AVIC Investment Holdings Co Ltd 82,200 900 (16,500) 66,600 133,200
Bank of Beijing Co Ltd 386,598 - (84,900) - 301,698
Bank of China Ltd 803,800 - (176,600) - 627,200
Bank of Communications Co Ltd 898,100 100,400 (183,100) - 815,400
Bank of Nanjing Co Ltd 77,050 - (19,300) 50,440 108,190
Bank of Ningbo Co Ltd 74,316 - (16,300) - 58,016
Baoshan Iron & Steel Co Ltd 188,400 - (41,400) - 147,000
BBMG Corporation 47,700 - (10,500) - 37,200
Beijing Capital Co Ltd 36,800 11,100 (8,600) 29,800 69,100
Beijing Capital Development Co Ltd - 27,300 (800) - 26,500
Beijing Dabeinong Technology
Group Co Ltd 62,600 - (27,400) 25,800 61,000
Beijing Enlight Media Co Ltd 16,780 - (5,600) 14,980 26,160
Beijing Gehua CATV Network Co Ltd - 17,012 (500) - 16,512
Beijing Jingneng Thermal Power Co
Ltd 54,600 7,400 (22,500) - 39,500
Beijing Origin Water Technology Co
Ltd 23,400 - (5,700) 28,406 46,106
Beijing Shiji Information Technology
Co Ltd 4,700 1,300 (2,200) 5,400 9,200
Beijing SL Pharmaceutical Co Ltd 15,701 - (15,701) - -
Beijing Tongrentang Co Ltd 26,119 - (9,800) - 16,319

HAITONG CSI300 INDEX ETF
(A SUB-FUND OF HAITONG ETF SERIES)
STATEMENT OF MOVEMENTS IN INVESTMENT PORTFOLIO (Unaudited) (continued)
For the period from 1 January 2016 to 30 June 2016
RESTRICTED 14
At 1
January
2016 Additions Disposals
Corporate
actions
At 30
June
2016
Listed equities (continued)
China (continued)
Beijing Ultrapower Software Co Ltd 45,500 - (9,900) - 35,600
Beijing Xinwei Telecom Technology
Group Co Ltd 44,600 - (9,800) - 34,800
Beijing Yanjing Brewery Co Ltd 53,748 - (11,800) - 41,948
Beiqi Foton Motor Co Ltd 63,600 - (63,600) - -
BlueFocus Communication Group
Co Ltd 58,945 - (17,400) - 41,545
BOE Technology Group Co Ltd 906,380 - (199,100) - 707,280
Bohai Financial Investment Holding
Co Ltd (formerly known as Bohai
Leasing Co Ltd) 67,700 - (5,200) - 62,500
BYD Co Ltd 23,806 800 (6,200) - 18,406
CECEP Wind Power Corporation Co
Ltd 7,500 - (1,300) - 6,200
Changjiang Securities Co Ltd 126,648 - (27,900) - 98,748
Chengdu Xingrong Environment Co
Ltd 68,301 - (68,301) - -
China Avionics Systems Co Ltd 20,144 - (4,500) - 15,644
China Baoan Group Co Ltd 48,540 7,200 (10,100) - 45,640
China CITIC Bank Corporation Ltd 121,638 - (30,400) - 91,238
China Coal Energy Co Ltd 69,793 - (15,300) - 54,493
China Communications Construction
Co Ltd 58,200 - (12,700) - 45,500
China Construction Bank
Corporation 256,100 19,600 (52,200) - 223,500
China COSCO Holdings Co Ltd 138,200 15,700 (44,200) - 109,700
China CSSC Holdings Ltd 26,248 - (5,800) - 20,448
China Dongfanghong Spacesat Co
Ltd 22,501 - (4,900) - 17,601
China Eastern Airlines Corporation
Ltd 129,400 - (28,400) - 101,000
China Everbright Bank Co Ltd 607,300 - (133,400) - 473,900
China First Heavy Industries Co Ltd 99,700 - (21,900) - 77,800
China Fortune Land Development
Co Ltd 40,400 2,000 (16,500) - 25,900
China Hainan Rubber Industry
Group Co Ltd 45,000 - (9,900) - 35,100
China International Marine
Containers (Group) Co Ltd 28,205 - (6,200) - 22,005
China International Travel Service
Corporation Ltd 14,922 2,400 (3,300) - 14,022

HAITONG CSI300 INDEX ETF
(A SUB-FUND OF HAITONG ETF SERIES)
STATEMENT OF MOVEMENTS IN INVESTMENT PORTFOLIO (Unaudited) (continued)
For the period from 1 January 2016 to 30 June 2016
RESTRICTED 15
At 1
January
2016 Additions Disposals
Corporate
actions
At 30
June
2016
Listed equities (continued)
China (continued)
China Life Insurance Co Ltd 63,553 - (13,900) - 49,653
China Merchants Bank Co Ltd 393,384 - (86,400) - 306,984
China Merchants Energy Shipping
Co Ltd 80,800 - (17,700) - 63,100
China Merchants Securities Co Ltd 110,800 - (24,400) - 86,400
China Merchants Shekou Industrial
Zone Co Ltd 84,612 3,400 (18,200) - 69,812
China Minmetals Rare Metal Earth
Co Ltd 26,176 - (26,176) - -
China Minsheng Banking Co Ltd 1,127,038 12,900 (436,400) - 703,538
China Molybdenum Co Ltd 98,533 30,300 (20,600) - 108,233
China National Chemical
Engineering Co Ltd 75,300 - (16,500) - 58,800
China National Nuclear Power Co
Ltd 178,100 - (39,200) - 138,900
China Northern Rare Earth (Group)
High-Tech Co Ltd 83,150 - (18,300) - 64,850
China Oilfield Services Ltd 22,541 - (4,900) - 17,641
China Pacific Insurance Group Co
Ltd 119,865 - (26,300) - 93,565
China Petroleum & Chemical
Corporation 400,900 - (88,100) - 312,800
China Railway Group Ltd 213,200 - (46,800) - 166,400
China Railways Construction
Corporation 131,600 - (28,800) - 102,800
China Resources Sanjiu Medical and
Pharmaceutical Co Ltd 14,906 - (3,300) - 11,606
China Shenhua Energy Co Ltd 75,513 - (16,600) - 58,913
China Shipbuilding Industry Co Ltd 350,152 - (64,000) - 286,152
China Shipping Container Lines Co
Ltd 143,400 - (49,000) - 94,400
China South Publishing & Media
Group Co Ltd 27,432 - (6,100) - 21,332
China Southern Airlines Co Ltd 133,900 - (29,400) - 104,500
China State Construction
Engineering Corporation Ltd 572,100 - (125,700) - 446,400
China United Network
Communications Ltd 323,323 - (71,000) - 252,323
China Vanke Co Ltd 295,916 - - - 295,916
China XD Electric Co Ltd 78,200 - (17,200) - 61,000
China Yangtze Power Co Ltd 188,800 46,900 (43,900) - 191,800

HAITONG CSI300 INDEX ETF
(A SUB-FUND OF HAITONG ETF SERIES)
STATEMENT OF MOVEMENTS IN INVESTMENT PORTFOLIO (Unaudited) (continued)
For the period from 1 January 2016 to 30 June 2016
RESTRICTED 16
At 1
January
2016 Additions Disposals
Corporate
actions
At 30
June
2016
Listed equities (continued)
China (continued)
Chinese Universe Publishing &
Media Co Ltd 21,000 - (4,700) - 16,300
Chongqing Changan Automobile Co
Ltd 86,100 - (18,900) - 67,200
Chongqing Water Group Co Ltd 21,930 - (21,930) - -
CITIC Guoan Information Industry
Co Ltd - 33,300 (700) - 32,600
CITIC Heavy Industries Co Ltd 47,000 1,300 (9,900) - 38,400
CITIC Securities Co Ltd 300,156 - (66,000) - 234,156
Cofco Tunhe Co Ltd - 25,000 (700) - 24,300
CRRC Corporation Ltd 349,570 - (76,700) - 272,870
CSSC Offshore and Marine
Engineering (Group) Co Ltd - 6,000 (200) - 5,800
Daqin Railway Co Ltd 226,748 - (49,700) - 177,048
Datang International Power
Generation Co Ltd 114,300 - (25,000) - 89,300
DHC Software Co Ltd 29,802 - - - 29,802
Dongfang Electric Corporation Ltd 45,700 - (10,000) - 35,700
Dongxing Securities Co Ltd 19,100 11,600 (3,800) - 26,900
Dongxu Optoelectronic Technology
Co Ltd 64,424 2,000 (13,600) - 52,824
Dr Peng Telecom & Media Group Co
Ltd 42,700 - (9,100) - 33,600
East Money Information Co Ltd 45,400 2,900 (16,100) 30,560 62,760
Eternal Asia Supply Chain
Management Ltd - 38,194 (900) - 37,294
Everbright Securities Co Ltd 44,700 - (9,800) - 34,900
FAW Car Co Ltd 31,010 - (6,800) - 24,210
Finance Street Holding Co Ltd 57,000 - (12,500) - 44,500
Foshan Haitian Flavouring & Food
Co Ltd 10,294 - (10,294) - -
Founder Securities Co Ltd 157,000 - (34,500) - 122,500
Fuyao Glass Industry Group Co Ltd 53,488 - (11,800) - 41,688
GD Power Development Co Ltd 374,700 42,100 (76,400) - 340,400
Gemdale Corporation 85,800 - (18,800) - 67,000
Gezhouba Group Co Ltd 105,400 - (23,200) - 82,200
GF Securities Co Ltd 112,911 - (24,800) - 88,111
Glodon Science and Technology Co
Ltd (formerly known as Glodon
Software Co Ltd) 25,795 - (25,795) - -
GoerTek Inc 34,900 - (7,600) - 27,300

HAITONG CSI300 INDEX ETF
(A SUB-FUND OF HAITONG ETF SERIES)
STATEMENT OF MOVEMENTS IN INVESTMENT PORTFOLIO (Unaudited) (continued)
For the period from 1 January 2016 to 30 June 2016
RESTRICTED 17
At 1
January
2016 Additions Disposals
Corporate
actions
At 30
June
2016
Listed equities (continued)
China (continued)
Gousen Securities Co Ltd 46,900 36,800 (10,700) - 73,000
Great Wall Motor Co Ltd 46,000 - (10,100) - 35,900
Gree Electric Appliances Inc of
Zhuhai 183,514 - (13,600) - 169,914
Greenland Holdings Corporation Ltd - 8,900 (200) - 8,700
GRG Banking Equipment Co Ltd - 24,800 (600) - 24,200
Guangdong By-Health Biotechnology
Co Ltd 11,100 3,200 (3,300) 9,900 20,900
Guangdong Electric Power
Development Co Ltd 34,000 - (34,000) - -
Guangdong Golden Dragon
Development Inc 17,100 1,600 (5,700) - 13,000
Guanghui Energy Co Ltd 119,520 - (26,300) - 93,220
Guangshen Railway Co Ltd 129,299 - (28,400) - 100,899
Guangxi Wuzhou Zhongheng Group
Co Ltd 106,074 - (23,300) - 82,774
Guangzhou Automobile Group Co
Ltd 20,900 - (20,900) - -
Guangzhou Baiyunshan
Pharmaceutical Holdings Co Ltd 20,377 - (4,500) - 15,877
Guangzhou Development Industry
(Holdings) Co Ltd - 20,000 (600) - 19,400
Guangzhou Haige Communication
Group 65,506 - (11,600) - 53,906
Guizhou Bailing Group
Pharmaceutical Co Ltd - 10,330 (300) - 10,030
Guotai Junan Securities Co Ltd 58,200 - (12,800) - 45,400
Guoyuan Securities Co Ltd 44,901 - (8,000) - 36,901
Hainan Airlines Co Ltd 225,300 - (49,500) - 175,800
Hainan Mining Co Ltd 8,800 - (8,800) - -
Haitong Securities Co Ltd 308,647 - (67,800) - 240,847
Hangzhou Hikvision Digital
Technology Co Ltd 46,551 - (11,000) 18,975 54,526
Han's Laser Technology Industry
Group Co Ltd 32,241 - (6,900) - 25,341
Hedy Holding Co Ltd - 7,500 (200) 7,300 14,600
Heilan Home Co Ltd 51,400 - (11,300) - 40,100
Henan Shuanghui Investment &
Development Co Ltd 37,758 - (8,300) - 29,458
Hesteel Company Ltd (formerly
known as Hebei Iron & Steel Co
Ltd) 162,000 - (35,600) - 126,400

HAITONG CSI300 INDEX ETF
(A SUB-FUND OF HAITONG ETF SERIES)
STATEMENT OF MOVEMENTS IN INVESTMENT PORTFOLIO (Unaudited) (continued)
For the period from 1 January 2016 to 30 June 2016
RESTRICTED 18
At 1
January
2016 Additions Disposals
Corporate
actions
At 30
June
2016
Listed equities (continued)
China (continued)
Hisense Electric Co Ltd 29,941 - (6,500) - 23,441
Hua Xia Bank Co Ltd 203,713 - (44,700) - 159,013
Huadian Power International
Corporation Ltd 93,200 - (20,500) - 72,700
Huadong Medicine Co Ltd 8,247 1,000 (2,200) - 7,047
Hualan Biological Engineering Inc 11,100 - (2,700) 5,460 13,860
Huaneng Power International Inc 160,197 - (35,200) - 124,997
Huatai Securities Co Ltd 124,581 - (27,400) - 97,181
Huawen Media Investment Group
Corporation 62,600 8,700 (12,400) - 58,900
Huayi Brothers Media Corporation 37,101 - (11,900) 32,873 58,074
HUAYU Automotive Systems Co Ltd 39,400 9,112 (11,000) - 37,512
Hubei Energy Group Co Ltd 81,600 8,800 (34,500) - 55,900
Hunan TV & Broadcast Intermediary
Co Ltd 43,226 - (9,500) - 33,726
Hundsun Electronic Co Ltd 18,814 - (4,100) - 14,714
iFLYTEK Co Ltd 34,276 - (7,300) - 26,976
Industrial and Commercial Bank of
China Ltd 822,600 53,200 (166,900) - 708,900
Industrial Bank Co Ltd 508,612 5,900 (117,600) - 396,912
Industrial Securities Co Ltd 158,690 49,700 (68,900) - 139,490
Inner Mongolia Junzheng Energy &
Chemical Industry Co Ltd 42,208 4,300 (9,900) - 36,608
Inner Mongolia MengDian HuaNeng
Thermal Power Corporation Ltd 110,700 - (24,300) - 86,400
Inner Mongolia Yili Industrial Group
Co Ltd 231,340 - (50,800) - 180,540
Inner Mongolian BaoTou Steel Union
Co Ltd 372,500 - (81,800) - 290,700
Inspur Electronic Information
Industry Co Ltd - 14,700 (400) - 14,300
Jiangsu Broadcasting Cable
Information Network Corporation
Ltd 22,800 - (5,000) - 17,800
Jiangsu Hengrui Medicine Co Ltd 44,722 7,300 (17,000) 7,145 42,167
Jiangsu Phoenix Publishing & Media
Corporation Ltd 29,100 - (6,400) - 22,700
Jiangsu Protruly Vision Technology
Group Co Ltd - 22,500 (600) - 21,900
Jiangsu Yanghe Brewery Joint-Stock
Co Ltd 23,029 900 (6,200) - 17,729

HAITONG CSI300 INDEX ETF
(A SUB-FUND OF HAITONG ETF SERIES)
STATEMENT OF MOVEMENTS IN INVESTMENT PORTFOLIO (Unaudited) (continued)
For the period from 1 January 2016 to 30 June 2016
RESTRICTED 19
At 1
January
2016 Additions Disposals
Corporate
actions
At 30
June
2016
Listed equities (continued)
China (continued)
Jiangxi Copper Co Ltd 31,690 - (7,000) - 24,690
Jihua Group Corporation Ltd 58,800 - (12,900) - 45,900
Jilin Aodong Medicine Industry
Groups Co Ltd 27,242 - (6,000) - 21,242
Jinduicheng Molybdenum Co Ltd 36,867 - (8,100) - 28,767
Jizhong Energy Resources Co Ltd 40,390 - (40,390) - -
Jointown Pharmaceutical Group Co
Ltd 12,600 - (2,800) - 9,800
Juneyao Airlines Co Ltd 5,200 100 (1,100) - 4,200
Kangde Xin Group Co Ltd (formerly
known as Jiangsu Kangde Xin
Composite Material Co Ltd) 48,906 - (12,600) 40,349 76,655
Kangmei Pharmaceutical Co Ltd 117,346 - (25,300) - 92,046
Kweichow Moutai Co Ltd 19,162 - (4,200) - 14,962
Lepu Medical Technology Co Ltd 18,600 - (5,600) 13,000 26,000
Leshi Internet Information &
Technology (Beijing) Co Ltd 35,300 - (7,700) - 27,600
Liaoning Cheng Da Co Ltd 46,557 800 (11,100) - 36,257
Luxin Venture Capital Group Co Ltd 11,400 - (2,500) - 8,900
Luxshare Precision Industry Co Ltd 19,041 4,700 (6,400) 6,620 23,961
Luzhou Laojiao Co Ltd 26,733 - (5,900) - 20,833
Material Industry Zhongda Group Co
Ltd - 21,600 (800) 6,480 27,280
MeiHua Holdings Group Co Ltd 71,100 - (15,600) - 55,500
Metallurgical Corporation of China
Ltd 185,800 - (40,800) - 145,000
Midea Group Co Ltd 81,327 - (22,300) 36,163 95,190
NARI Technology Development Co
Ltd 55,567 - (12,200) - 43,367
Neusoft Co Ltd 33,678 3,300 (8,200) - 28,778
New China Life Insurance Co Ltd 23,832 6,700 (7,300) - 23,232
New Hope Liuhe Co Ltd 47,600 - (16,600) 31,000 62,000
Ningbo Port Co Ltd 177,400 - (63,100) - 114,300
Northeast Securities Co Ltd 44,812 5,400 (9,800) - 40,412
Oceanwide Holdings Co Ltd 52,100 4,800 (11,700) - 45,200
Offshore Oil Engineering Co Ltd 84,300 - (18,500) - 65,800
Orient Securities Co Ltd 40,300 46,900 (8,800) - 78,400
Ourpalm Co Ltd 56,500 10,900 (12,300) - 55,100

HAITONG CSI300 INDEX ETF
(A SUB-FUND OF HAITONG ETF SERIES)
STATEMENT OF MOVEMENTS IN INVESTMENT PORTFOLIO (Unaudited) (continued)
For the period from 1 January 2016 to 30 June 2016
RESTRICTED 20
At 1
January
2016 Additions Disposals
Corporate
actions
At 30
June
2016
Listed equities (continued)
China (continued)
Pacific Security Co Ltd 134,600 41,600 (41,000) - 135,200
Pang Da Automobile Trade Co Ltd 123,600 30,000 (26,100) - 127,500
Pangang Group Vanadium Titanium
& Resources Co Ltd 163,800 - (30,000) - 133,800
People.cn Co Ltd 21,040 - (4,600) - 16,440
PetroChina Co Ltd 185,234 - (40,700) - 144,534
Ping An Bank Co Ltd 218,230 35,500 (83,000) 34,846 205,576
Ping An Insurance (Group) Co of
China Ltd 413,092 6,100 (97,100) - 322,092
Poly Real Estate Group Co Ltd 246,100 - (54,000) - 192,100
Power Construction Corporation of
China 157,400 - (34,600) - 122,800
Qingdao Haier Co Ltd 121,546 - (30,700) - 90,846
Qinghai Salt Lake Potash Co Ltd 24,300 2,700 (5,500) - 21,500
Risesun Real Estate Development
Co Ltd 58,334 5,300 (26,100) - 37,534
SAIC Motor Corporation Ltd 126,185 - (27,800) - 98,385
Sanan Optoelectronics Co Ltd 54,805 - (16,900) - 37,905
Sany Heavy Industry Co Ltd 145,232 - (31,900) - 113,332
SDIC Essence Holdings Co Ltd - 33,600 (800) - 32,800
SDIC Power Holdings Co Ltd 129,420 - (28,400) - 101,020
Sealand Securities Co Ltd 53,540 - (12,500) 21,770 62,810
Searainbow Holding Corporation 27,400 500 (6,600) - 21,300
Shaanxi Coal Industry Co Ltd 76,300 - (16,800) - 59,500
Shandong Dong-E E-Jiao Co Ltd 19,996 - (4,500) - 15,496
Shandong Expressway Co Ltd 25,700 - (25,700) - -
Shandong Gold Mining Co Ltd 27,125 - (6,000) - 21,125
Shandong Iron and Steeel Co Ltd - 41,100 (1,100) - 40,000
Shandong Kingenta Ecological
Engineering Co Ltd 23,800 6,600 (5,100) 19,800 45,100
Shanghai 2345 Network Holdings
Group Co Ltd 10,000 5,900 (2,500) 8,000 21,400
Shanghai Bailian Group Co Ltd 29,400 - (6,400) - 23,000
Shanghai Bairun Investment Holding
Group Co Ltd - 4,400 (100) - 4,300
Shanghai Construction Co Ltd 67,995 20,000 (18,400) 10,299 79,894
Shanghai Electric Group Co Ltd 112,700 - (24,700) - 88,000
HAITONG CSI300 INDEX ETF
(A SUB-FUND OF HAITONG ETF SERIES)
STATEMENT OF MOVEMENTS IN INVESTMENT PORTFOLIO (Unaudited) (continued)
For the period from 1 January 2016 to 30 June 2016
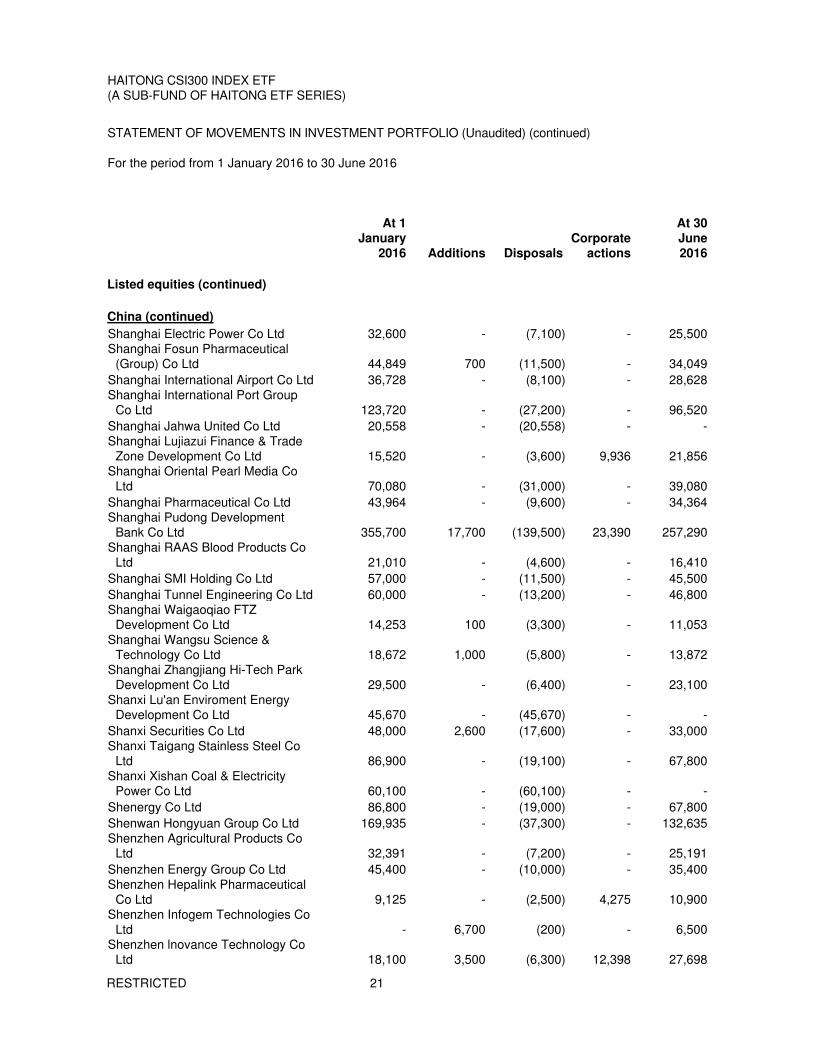
RESTRICTED 21
At 1
January
2016 Additions Disposals
Corporate
actions
At 30
June
2016
Listed equities (continued)
China (continued)
Shanghai Electric Power Co Ltd 32,600 - (7,100) - 25,500
Shanghai Fosun Pharmaceutical
(Group) Co Ltd 44,849 700 (11,500) - 34,049
Shanghai International Airport Co Ltd 36,728 - (8,100) - 28,628
Shanghai International Port Group
Co Ltd 123,720 - (27,200) - 96,520
Shanghai Jahwa United Co Ltd 20,558 - (20,558) - -
Shanghai Lujiazui Finance & Trade
Zone Development Co Ltd 15,520 - (3,600) 9,936 21,856
Shanghai Oriental Pearl Media Co
Ltd 70,080 - (31,000) - 39,080
Shanghai Pharmaceutical Co Ltd 43,964 - (9,600) - 34,364
Shanghai Pudong Development
Bank Co Ltd 355,700 17,700 (139,500) 23,390 257,290
Shanghai RAAS Blood Products Co
Ltd 21,010 - (4,600) - 16,410
Shanghai SMI Holding Co Ltd 57,000 - (11,500) - 45,500
Shanghai Tunnel Engineering Co Ltd 60,000 - (13,200) - 46,800
Shanghai Waigaoqiao FTZ
Development Co Ltd 14,253 100 (3,300) - 11,053
Shanghai Wangsu Science &
Technology Co Ltd 18,672 1,000 (5,800) - 13,872
Shanghai Zhangjiang Hi-Tech Park
Development Co Ltd 29,500 - (6,400) - 23,100
Shanxi Lu'an Enviroment Energy
Development Co Ltd 45,670 - (45,670) - -
Shanxi Securities Co Ltd 48,000 2,600 (17,600) - 33,000
Shanxi Taigang Stainless Steel Co
Ltd 86,900 - (19,100) - 67,800
Shanxi Xishan Coal & Electricity
Power Co Ltd 60,100 - (60,100) - -
Shenergy Co Ltd 86,800 - (19,000) - 67,800
Shenwan Hongyuan Group Co Ltd 169,935 - (37,300) - 132,635
Shenzhen Agricultural Products Co
Ltd 32,391 - (7,200) - 25,191
Shenzhen Energy Group Co Ltd 45,400 - (10,000) - 35,400
Shenzhen Hepalink Pharmaceutical
Co Ltd 9,125 - (2,500) 4,275 10,900
Shenzhen Infogem Technologies Co
Ltd - 6,700 (200) - 6,500
Shenzhen lnovance Technology Co
Ltd 18,100 3,500 (6,300) 12,398 27,698

HAITONG CSI300 INDEX ETF
(A SUB-FUND OF HAITONG ETF SERIES)
STATEMENT OF MOVEMENTS IN INVESTMENT PORTFOLIO (Unaudited) (continued)
For the period from 1 January 2016 to 30 June 2016
RESTRICTED 22
At 1
January
2016 Additions Disposals
Corporate
actions
At 30
June
2016
Listed equities (continued)
China (continued)
Shenzhen Kingdom Sci-Tech Co Ltd - 15,200 (300) - 14,900
Shenzhen O-film Tech Co Ltd 27,550 - (6,100) - 21,450
Shenzhen Overseas Chinese Town
Co Ltd 140,200 - (42,500) - 97,700
Shenzhen Salubris Pharmaceuticals
Co Ltd 11,948 - (2,600) - 9,348
Shenzhen Zhongjin Lingnan
Nonfemet Co Ltd 50,590 4,500 (10,100) - 44,990
Siasun Robot & Automation Co Ltd 18,900 300 (7,200) 20,520 32,520
Sichuan Changhong Electric Co Ltd 140,800 - (30,900) - 109,900
Sichuan Chuantou Energy Co Ltd 83,900 - (18,400) - 65,500
Sichuan Kelun Pharmaceutic Co Ltd 33,000 - (7,300) - 25,700
Sinolink Securities Co Ltd 69,186 - (15,100) - 54,086
Sinopec Oilfield Service Corporation - 44,000 (1,200) - 42,800
Sinopec Shanghai Petrochemical Co
Ltd 83,600 - (18,400) - 65,200
Songcheng Performance
Development Co Ltd 21,800 - (4,500) - 17,300
Soochow Security Co Ltd 82,366 1,400 (21,500) - 62,266
Sound Environmental Resources Co
Ltd 19,419 200 (4,300) - 15,319
Southwest Securities Co Ltd 107,690 - (23,700) - 83,990
Spring Airlines Co Ltd 9,200 100 (2,200) - 7,100
Suning Commerce Group Co Ltd 168,900 - (58,000) - 110,900
Suzhou Gold Mantis Constructions 33,643 5,500 (7,100) 13,821 45,864
Tasly Pharmaceutical Group Co Ltd 24,724 - (5,400) - 19,324
TBEA Co Ltd 99,137 - (21,900) - 77,237
TCL Corporation 325,800 - (107,700) - 218,100
Tian Di Science & Technology Co
Ltd - 40,400 (1,100) - 39,300
Tianjin Port Co Ltd 31,900 - (31,900) - -
Tianjin Zhonghuan Semiconductor
Co Ltd 52,560 - (11,400) - 41,160
Tonghua Dongbao Pharmaceutical
Co Ltd 30,280 - (6,700) 4,856 28,436
Tongling Nonferrous Metals Group
Co Ltd 145,800 68,000 (31,600) - 182,200
Tsinghua Tongfang Co Ltd 67,800 - (14,900) - 52,900
HAITONG CSI300 INDEX ETF
(A SUB-FUND OF HAITONG ETF SERIES)
STATEMENT OF MOVEMENTS IN INVESTMENT PORTFOLIO (Unaudited) (continued)
For the period from 1 January 2016 to 30 June 2016
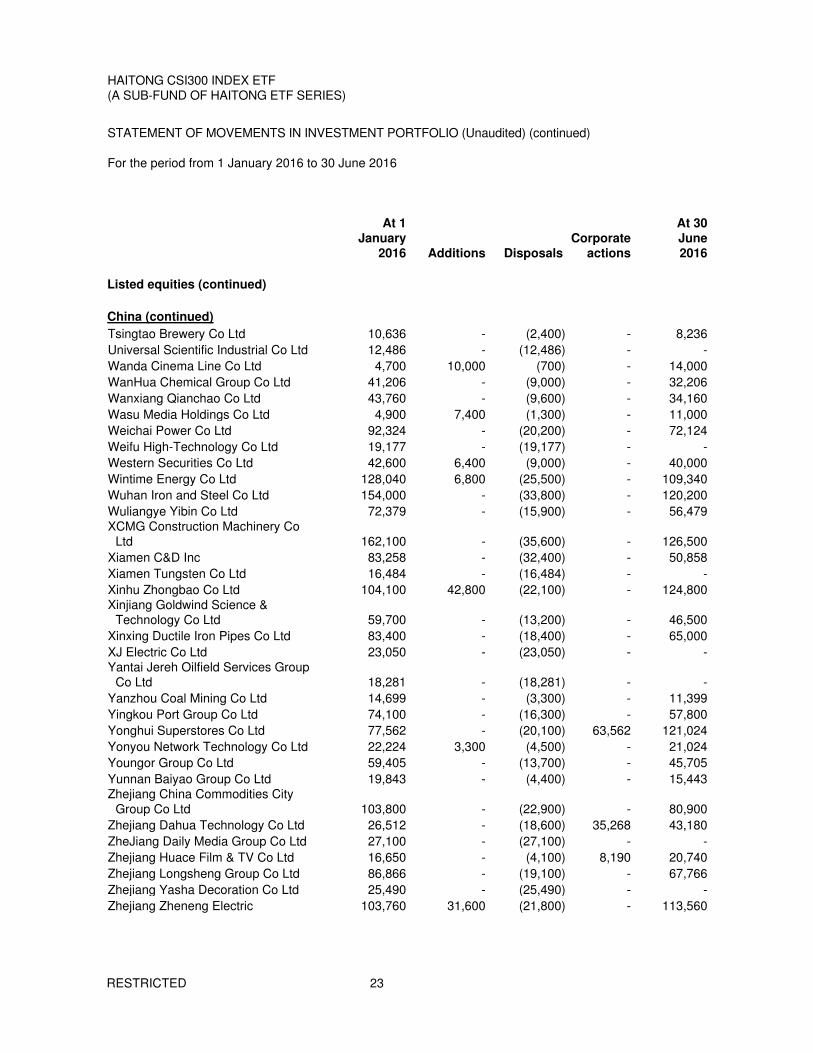
RESTRICTED 23
At 1
January
2016 Additions Disposals
Corporate
actions
At 30
June
2016
Listed equities (continued)
China (continued)
Tsingtao Brewery Co Ltd 10,636 - (2,400) - 8,236
Universal Scientific Industrial Co Ltd 12,486 - (12,486) - -
Wanda Cinema Line Co Ltd 4,700 10,000 (700) - 14,000
WanHua Chemical Group Co Ltd 41,206 - (9,000) - 32,206
Wanxiang Qianchao Co Ltd 43,760 - (9,600) - 34,160
Wasu Media Holdings Co Ltd 4,900 7,400 (1,300) - 11,000
Weichai Power Co Ltd 92,324 - (20,200) - 72,124
Weifu High-Technology Co Ltd 19,177 - (19,177) - -
Western Securities Co Ltd 42,600 6,400 (9,000) - 40,000
Wintime Energy Co Ltd 128,040 6,800 (25,500) - 109,340
Wuhan Iron and Steel Co Ltd 154,000 - (33,800) - 120,200
Wuliangye Yibin Co Ltd 72,379 - (15,900) - 56,479
XCMG Construction Machinery Co
Ltd 162,100 - (35,600) - 126,500
Xiamen C&D Inc 83,258 - (32,400) - 50,858
Xiamen Tungsten Co Ltd 16,484 - (16,484) - -
Xinhu Zhongbao Co Ltd 104,100 42,800 (22,100) - 124,800
Xinjiang Goldwind Science &
Technology Co Ltd 59,700 - (13,200) - 46,500
Xinxing Ductile Iron Pipes Co Ltd 83,400 - (18,400) - 65,000
XJ Electric Co Ltd 23,050 - (23,050) - -
Yantai Jereh Oilfield Services Group
Co Ltd 18,281 - (18,281) - -
Yanzhou Coal Mining Co Ltd 14,699 - (3,300) - 11,399
Yingkou Port Group Co Ltd 74,100 - (16,300) - 57,800
Yonghui Superstores Co Ltd 77,562 - (20,100) 63,562 121,024
Yonyou Network Technology Co Ltd 22,224 3,300 (4,500) - 21,024
Youngor Group Co Ltd 59,405 - (13,700) - 45,705
Yunnan Baiyao Group Co Ltd 19,843 - (4,400) - 15,443
Zhejiang China Commodities City
Group Co Ltd 103,800 - (22,900) - 80,900
Zhejiang Dahua Technology Co Ltd 26,512 - (18,600) 35,268 43,180
ZheJiang Daily Media Group Co Ltd 27,100 - (27,100) - -
Zhejiang Huace Film & TV Co Ltd 16,650 - (4,100) 8,190 20,740
Zhejiang Longsheng Group Co Ltd 86,866 - (19,100) - 67,766
Zhejiang Yasha Decoration Co Ltd 25,490 - (25,490) - -
Zhejiang Zheneng Electric 103,760 31,600 (21,800) - 113,560

HAITONG CSI300 INDEX ETF
(A SUB-FUND OF HAITONG ETF SERIES)
STATEMENT OF MOVEMENTS IN INVESTMENT PORTFOLIO (Unaudited) (continued)
For the period from 1 January 2016 to 30 June 2016
RESTRICTED 24
At 1
January
2016 Additions Disposals
Corporate
actions
At 30
June
2016
Listed equities (continued)
China (continued)
Zhengzhou Yutong Bus Co Ltd 50,701 - (11,200) - 39,501
Zhongjin Gold Co Ltd 56,111 5,200 (11,200) - 50,111
Zhongtian Urban Development
Group Co Ltd 65,700 26,400 (14,900) - 77,200
Zijin Mining Group Co Ltd 361,600 - (79,500) - 282,100
Zoomlion Heavy Industry Science &
Technology Co Ltd 167,569 - (36,800) - 130,769
ZTE Corporation 89,971 - (19,800) - 70,171

HAITONG CSI300 INDEX ETF
(A SUB-FUND OF HAITONG ETF SERIES)
PERFORMANCE TABLE (Unaudited)
30 June 2016
RESTRICTED 25
1. Net Asset Value
Net asset value per unit Total net asset value
RMB RMB
30 June 2016 11.5931 255,048,141
31 December 2015 13.7801 378,953,756
31 December 2014 12.9058 696,911,314
2. Highest issue and lowest redemption prices per unit
Highest issue Lowest redemption
unit price unit price
RMB RMB
Period from 1 January 2016 to 30 June 2016 13.1202 10.5903
Year ended 31 December 2015 19.7223 11.1933
Period from 5 March 2014 (date of
inception) to 31 December 2014 12.9350 7.6607
3. Comparison of the scheme performance and the actual Index performance
The table below illustrates the comparison between the Sub-Fund’s performance (Market-to-Market) and
that of the Index during the following period/year:
CSI300
Index
RMB Counter of
the Sub-Fund
HKD Counter of
the Sub-Fund
During the period/year ended:
30 June 2016 (15.47%) (15.80%) (16.65%)
31 December 2015 5.58% 6.87% 0.73%

HAITONG CSI300 INDEX ETF
(A SUB-FUND OF HAITONG ETF SERIES)
DISTRIBUTION DISCLOSURE (Unaudited)
30 June 2016
RESTRICTED 26
During the period from 1 January 2016 to 30 June 2016, there was no distribution paid by the Sub-Fund. The distribution made by the Sub-Fund for the year ended 31 December 2015 is as follows: Date of Date of Distribution Total ex-distribution payment per unit distribution RMB RMB
Interim Distribution on 32,500,000 units 30 July 2015 5 August 2015 0.12 3,900,000
HAITONG CSI300 INDEX ETF
(A SUB-FUND OF HAITONG ETF SERIES)
UNDERLYING INDEX CONSTITUENT STOCKS DISCLOSURE
30 June 2016
RESTRICTED 27
The underlying index of Haitong CSI300 Index ETF, namely CSI 300 Index, did not have any constituent
stock that accounted for more than 10% of the index as at 30 June 2016.
During the period from 1 January 2016 to 30 June 2016, the CSI 300 Index decreased by 15.47% while the
net asset value per unit of the Sub-Fund decreased by 15.80% for RMB Counter and decreased by 16.65%
for HKD Counter respectively.

HAITONG CSI300 INDEX ETF
(A SUB-FUND OF HAITONG ETF SERIES)
REPORT ON INVESTMENT OVERWEIGHT (UNAUDITED)
For the period from 1 January 2016 to 30 June 2016
RESTRICTED 28
Pursuant to the SFC’s Guidelines for Regulating Index Tracking Exchange Trade Funds (the “ETF
Guidelines”), more than 10% of the Sub-Fund’s net asset value maybe invested in constituent securities
issued by single issuer provided that it is limited to any constituent securities that each accounts for more
than 10% of the weighting of the index; and the Sub-Fund’s holding of any such constituent securities may
not exceed their respective weightings in the underlying index, except where the weightings are exceeded
as a result of changes in the composition of the underlying index and the excess is only transitional and
temporary in nature.
The Manager and the Trustee have confirmed that the Sub-Fund has complied with this limit during the
period from 1 January 2016 to 30 June 2016.