habitat selection of band-tailed pigeons by … hughes... · artificial vs. natural band-tailed ......
TRANSCRIPT

HABITAT SELECTION OF BAND-TAILED PIGEONS
by
Kathleen M. Hughes
_________________________________
A Thesis Submitted to the Faculty of the
SCHOOL OF NATURAL RESOURCES
In Partial Fulfillment of the Requirements For the Degree of
MASTER OF SCIENCE
WITH A MAJOR IN WILDLIFE AND FISHERIES SCIENCE
In the Graduate College
THE UNIVERSITY OF ARIZONA
2007

STATEMENT BY AUTHOR This thesis has been submitted in partial fulfillment of requirements for an advanced degree at the University of Arizona and is deposited in the University Library to be made available to borrowers under rules of the Library. Brief quotations from this thesis are allowable without special permission, provided that accurate acknowledgment of source is made. Requests for permission for extended quotation from or reproduction of this manuscript in whole or in part may be granted by the head of the major department or the Dean of the Graduate College when in his or her judgment the proposed use of the material is in the interests of scholarship. In all other instances however, permission must be obtained from the author.
SIGNED: ______________________________________
APPROVAL BY THESIS COMMITTEE
This thesis has been approved on the date shown below
______________________________________________ Date: ________________ Dr. Courtney J. Conway Associate Professor, Wildlife and Fisheries Science ______________________________________________ Date: ________________ Dr. R. William Mannan Professor, Wildlife and Fisheries Science ______________________________________________ Date: ________________ Robert J. Steidl Associate Professor, Wildlife and Fisheries Science

3
ACKNOWLEDGMENTS
This project was funded by the Webless Migratory Game Bird Research Program, the Arizona Game and Fish Department Heritage Fund, the U.S. Fish and Wildlife Service, the U.S.G.S. - Arizona Cooperative Fish and Wildlife Research Unit, the University of Arizona, the Sulliman Memorial Award, and T & E, Inc.
I would like to thank Kathleen Farley, Bob Fogg, David Fox, Andrea Francis, Greg Gryniewicz, Kristin Hemmelgarn, Johanna Havelaar, Jonathan Horst, Chris Kirkpatrick, Dominic LaRoche, Didio Martinez, Eduardo Martinez-Leyva, Kate Moray, Chris Murray, Julie Murray, Judith Ramirez, and Nicola Ventolini for their help with fieldwork and nest making. Mike Cooper, Linda Currin, Mike Stanley, Arthur Faul, Debbie Fagan, Susan Bensen, and Susan Bennet allowed us to trap pigeons at their homes in Summerhaven. Thory Smith, Jim Heffelfinger, and Sandy Lanham provided radio telemetry flights. Moez Ali, Christine Hannum, and Diane Tilton helped enter and proof data.
Carson Coates and Mickey Reed helped extensively with GIS. T. Deecken, G. Gonzales, G. Helbing, L. Jones, B., J. Magehee, Bonnie Stolp, and Josh Taiz assisted with access to study areas. Clait Braun, Mike Casazza, Lee Fitzhugh, Jerome Leonard, and Todd Sanders provided insight into working with band-tailed pigeons. Brad Mueller assisted with transmitter logistics. Bob Peterson and the University of Arizona Steward Observatory provided field housing. Jim deVos and D. Dolton provided project support. Carol Yde provided administrative assistance for which I am very grateful. Matt Smith, Vicki Garcia, Alice Boyle, Chris Kirkpatrick, Mark Ogonowski, Alberto Macias-Duerte, Kathi Borgmann, Sonya Steckler, Kevin Bonine, Bret Pasch, Andrea Litt, and Erica Geiger provided useful comments and discussion. I would like to thank my committee members, Dr. Bill Mannan and Dr. Bob Steidl, for their help and guidance. I would also like to thank my advisor, Dr. Courtney Conway, for his encouragement, mentoring, and support. Finally, I am grateful to my family for their support.

4
DEDICATION
This thesis is dedicated to my parents, Tim and Jean Hughes, and to Stephan
Leimroth without whose support this project never would have been completed.
5
TABLE OF CONTENTS
LIST OF TABLES...............................................................................................................7
LIST OF FIGURES .............................................................................................................8
ABSTRACT.........................................................................................................................9
INTRODUCTION .............................................................................................................12
PRESENT STUDY............................................................................................................13
REFERENCES ..................................................................................................................16
APPENDIX A.
NESTING SUCCESS AND NEST-SITE SELECTION IN BAND-TAILED PIGEONS........................................................................................................................................... 18
ABSTRACT.......................................................................................................................18
INTRODUCTION .............................................................................................................19
STUDY AREA ..................................................................................................................22
METHODS ........................................................................................................................23 Trapping and Radio-telemetry........................................................................................23
Breeding Biology and Mortality Factors........................................................................24
Habitat Sampling............................................................................................................24
Analyses .........................................................................................................................25
RESULTS ..........................................................................................................................27 Trapping and Radio-telemetry........................................................................................27
Breeding Biology and Mortality Factors........................................................................27
Habitat Sampling............................................................................................................28
DISCUSSION....................................................................................................................30 Movements .....................................................................................................................30
Breeding Biology and Mortality Factors........................................................................30
Nest-site Characteristics .................................................................................................32
MANAGEMENT IMPLICATIONS .................................................................................34
6
TABLE OF CONTENTS - CONTINUED
ACKNOWLEDGMENTS .................................................................................................35
LITERATURE CITED ......................................................................................................36
APPENDIX B. DOES RISK OF NEST PREDATION INFLUENCE NEST-SITE SELECTION IN BAND-TAILED PIGEONS?......................................................................................... 45
ABSTRACT.......................................................................................................................45
INTRODUCTION .............................................................................................................47
METHODS AND MATERIALS.......................................................................................51 Artificial Nest Experiment .............................................................................................52
Nest Predator Abundance and Distribution....................................................................54
Cone and Acorn Abundance...........................................................................................55
Analyses .........................................................................................................................56
RESULTS ..........................................................................................................................59 Nest Predation in Mixed-Conifer Forest and Oak Woodlands.......................................59
Artificial vs. Natural Band-Tailed Pigeon Nests............................................................60
Abundance of Avian and Mammalian Nest Predators ...................................................61
Cone and Acorn Abundance on the Probability of Nest Predation................................61
DISCUSSION....................................................................................................................63 Conclusion......................................................................................................................67
ACKNOWLEDGMENTS .................................................................................................68
LITERATURE CITED ......................................................................................................69
APPENDIX C.
THE INSTITUTIONAL ANIMAL CARE AND USE COMMITTEE (IACUC).........85

7
LIST OF TABLES
Table A.1. Vegetation and landscape features measured at 11 band-tailed pigeon nests and within a 25-m radius centered on nests in southeastern Arizona, 2002-2004 (the features measured within a 25-m radius of nests were also measured at 30 randomly selected points. ........................................................................................... 41
Table A.2. Nest-site characteristics at band-tailed pigeon nests in southeastern Arizona, 2002-2004 (n = 11). ............................................... 42
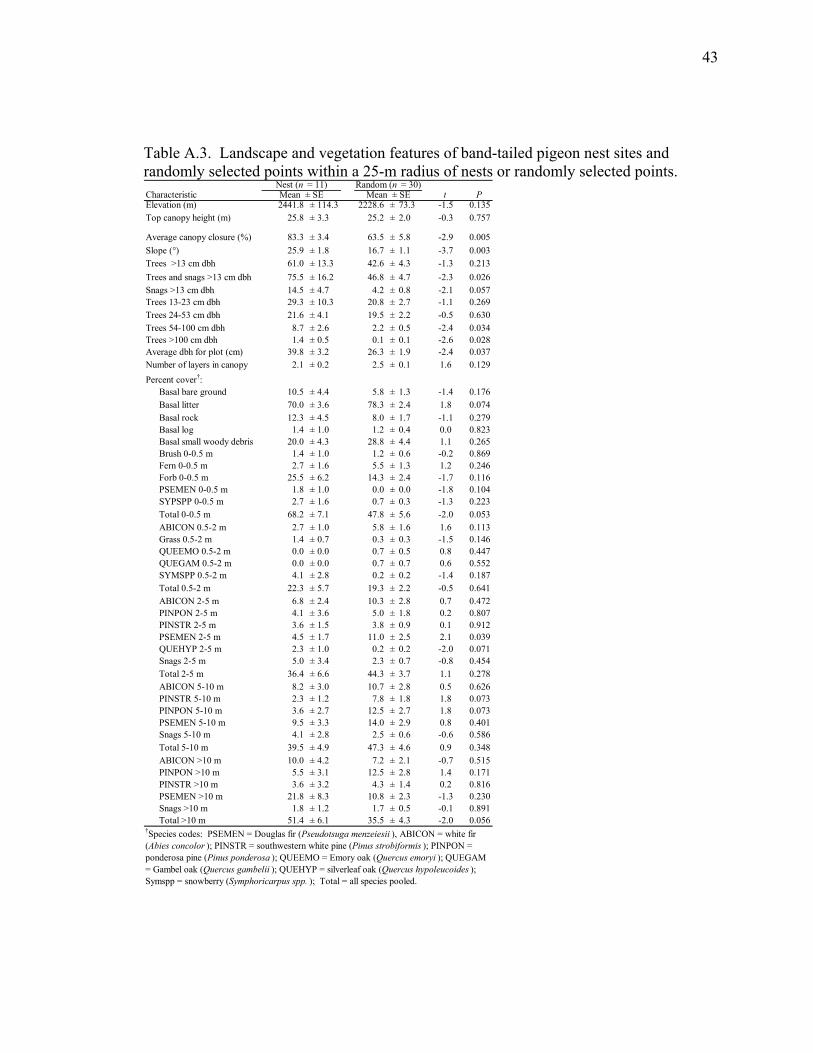
Table A.3. Landscape and vegetation features of band-tailed pigeon nest sites and randomly selected points within a 25-m radius of nests or randomly selected points. ....................................................................... 43
Table A.4. Logistic regression models for band-tailed pigeon nest sites vs. random sites in southeastern Arizona, 2002-2004. The model estimates are for the likelihood of nest sites vs. random sites. The full model for nest sites vs. random sites was significant (-log-likelihood = 2.1, G2 = 43.6, P < 0.0001). ........................................... 44
Table B.1. Number of artificial nests placed within each of 4 mountain ranges and 2 plant communities in southeastern Arizona during 2003 and 2004. . ......................................................................................... 77
Table B.2. The risk of nest predation for artificial nests in southeastern Arizona varied among mountain ranges and plant communities, and was influenced by elevation, nest tree features, nest size, and abundance of potential nest predators. Results are based on 2-tailed t-tests, likelihood ratio chi-square tests, and simple linear regressions. ...................................................................................... 78
Table B.3. Results of two logistic regressions for binomial counts using stepwise variable selection (P = 0.20 to enter, P = 0.10 to remain). In each model, the risk of artificial nest depredation within forests in southeastern Arizona was the response variable. The two models were based on 1) nest clusters (n = 136) from 2003 and 2004 pooled, and 2) nest clusters (n = 109) from 2004 only. . ........................................................................................ 79

8
LIST OF FIGURES
Figure B.1. Layout of an artificial nest cluster showing location of artificial nests, point-count survey stations, and food abundance transects. I sampled 136 of these nest clusters in 2003 and 2004, southeastern Arizona. ...................................................................... 80
Figure B.2. The probability of artificial nest predation was positively related to nest concealment in 2004, but negatively related to nest concealment in 2003, southeastern Arizona. .............................................. 81
Figure B.4. The relationship between the probability of artificial nest predation and nest concealment differed among mountain ranges, southeastern Arizona. ..................................................................... 82
Figure B.3. The relationship between the probability of artificial nest predation and nest tree dbh differed among mountain ranges, southeastern Arizona. ................................................................................. 83
Figure B.5. The probability of artificial nest predation was not related to cone and acorn abundance after accounting for other variables that explain nest predation risk, southeastern Arizona. .............................. 84

9
ABSTRACT
Band-tailed pigeons are migratory game birds whose populations have declined
throughout their range. Understanding the habitat requirements and the underlying
reasons for habitat choices of band-tailed pigeons, and identifying potential causes for
declines will help management agencies develop plans to recover populations. My
objectives in this study were to identify vegetation characteristics and landscape features
that influence nest-site selection of band-tailed pigeons and determine whether these
vegetation and landscape characteristics affect nesting success. Additionally, nest
predation is a selective pressure thought to influence avian distribution and breeding
habitat selection. I tested two predictions of the hypothesis that band-tailed pigeons nest
more frequently in areas with a reduced risk of nest predation. Finally, variation in the
abundance of main food resources for common nest predators has been implicated in
affecting the probability of nest predation in forested systems. I tested one prediction of
the alternative prey hypothesis.
10
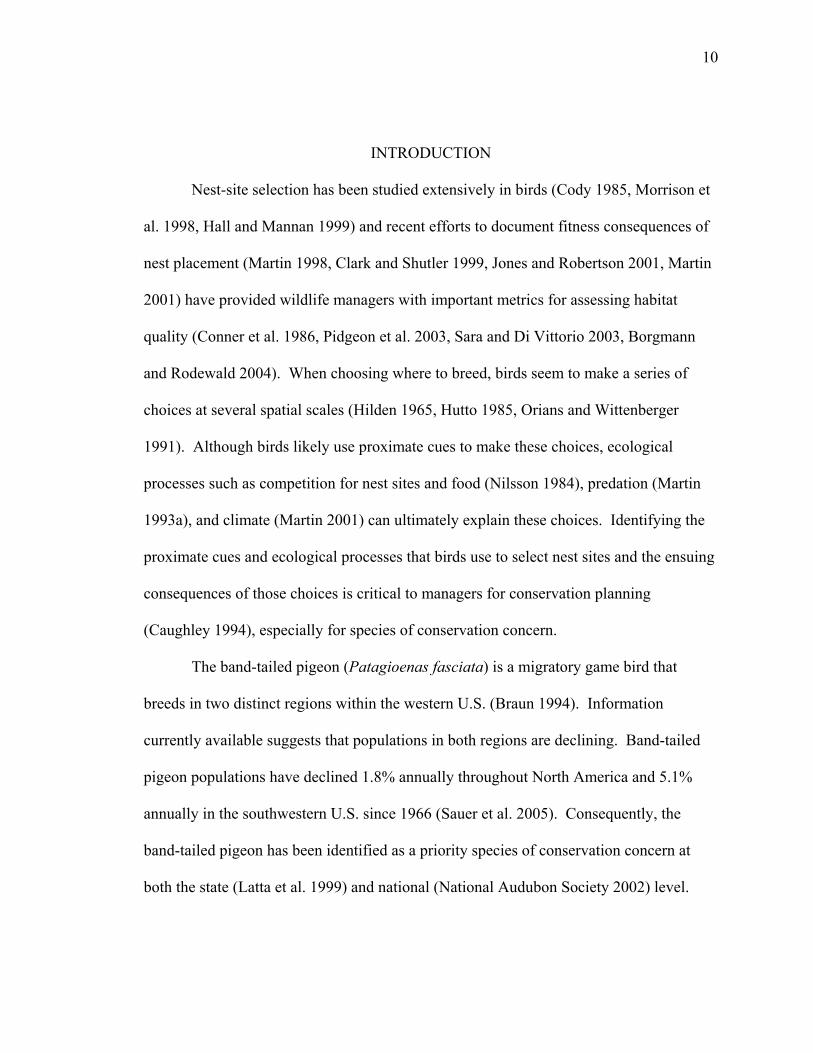
INTRODUCTION
Nest-site selection has been studied extensively in birds (Cody 1985, Morrison et
al. 1998, Hall and Mannan 1999) and recent efforts to document fitness consequences of
nest placement (Martin 1998, Clark and Shutler 1999, Jones and Robertson 2001, Martin
2001) have provided wildlife managers with important metrics for assessing habitat
quality (Conner et al. 1986, Pidgeon et al. 2003, Sara and Di Vittorio 2003, Borgmann
and Rodewald 2004). When choosing where to breed, birds seem to make a series of
choices at several spatial scales (Hilden 1965, Hutto 1985, Orians and Wittenberger
1991). Although birds likely use proximate cues to make these choices, ecological
processes such as competition for nest sites and food (Nilsson 1984), predation (Martin
1993a), and climate (Martin 2001) can ultimately explain these choices. Identifying the
proximate cues and ecological processes that birds use to select nest sites and the ensuing
consequences of those choices is critical to managers for conservation planning
(Caughley 1994), especially for species of conservation concern.
The band-tailed pigeon (Patagioenas fasciata) is a migratory game bird that
breeds in two distinct regions within the western U.S. (Braun 1994). Information
currently available suggests that populations in both regions are declining. Band-tailed
pigeon populations have declined 1.8% annually throughout North America and 5.1%
annually in the southwestern U.S. since 1966 (Sauer et al. 2005). Consequently, the
band-tailed pigeon has been identified as a priority species of conservation concern at
both the state (Latta et al. 1999) and national (National Audubon Society 2002) level.

11
Our knowledge of basic breeding biology and habitat requirements remains poor
for the interior subspecies of band-tailed pigeon (Keppie and Braun 2000, Pacific Flyway
Study Committee and Central Flyway Webless Migratory Game Bird Technical
Committee 2001). Therefore, my initial objectives in this study were to: 1) identify
vegetation characteristics and landscape features that influence nest-site selection of
band-tailed pigeons, and 2) determine whether these vegetation and landscape
characteristics affect nesting success.
Additionally, the band-tailed pigeon is a good species for examining habitat
selection at large spatial scales because individuals 1) are apparently willing to travel
>100 km between foraging and nesting sites (Keppie and Braun 2000, Kirkpatrick et al.
2005) and 2) do not defend territories like many other montane forest birds. Band-tailed
pigeons forage in both oak woodlands and mixed-conifer forest but primarily nest in
mixed-conifer forest. Nest predation is a pervasive selective pressure thought to
influence avian distribution and breeding habitat selection in birds (Nilsson 1984, Martin
1993a, Sieving and Wilson 1998), and may explain why band-tailed pigeons nest
primarily in mixed-conifer forest. I tested two predictions of the hypothesis that band-
tailed pigeons are nesting more frequently in areas where they can reduce the risk of nest
predation: 1) mixed-conifer forests would have a lower risk of nest predation compared
to other plant communities in which they forage, and 2) the relative abundance of avian
and mammalian nest predators would be lower in mixed-conifer forests than in oak
woodlands. I compared the artificial nest results with results from natural band-tailed

12
pigeon nests to determine if the difference in nest predation between the 2 plant
communities was similar for both artificial nests and natural nests.
Finally, some studies have suggested that variation in predation risk is related to
variation in the abundance of main food sources available to nest predators (the
alternative prey hypothesis; Lack 1954, Anglestam et al. 1984). I tested a prediction of
the alternative prey hypothesis: that cone and acorn abundance would be negatively
correlated with the risk of nest predation in mixed-conifer forest and oak woodlands.
13
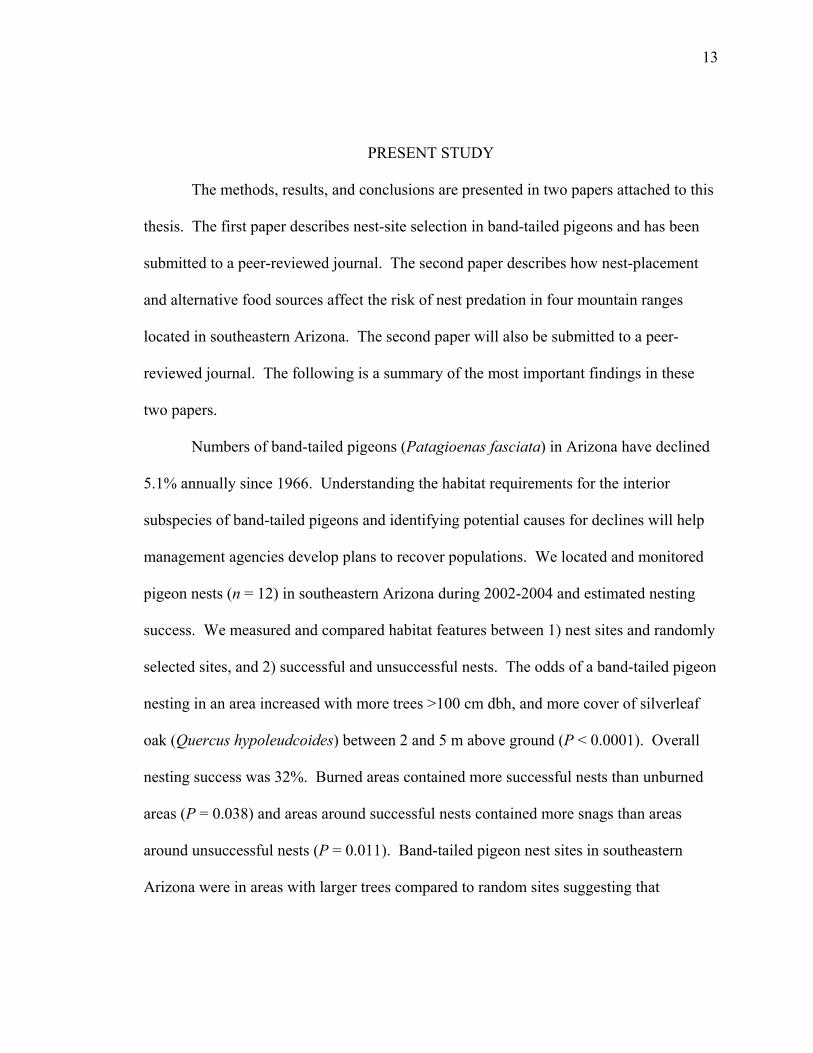
PRESENT STUDY The methods, results, and conclusions are presented in two papers attached to this
thesis. The first paper describes nest-site selection in band-tailed pigeons and has been
submitted to a peer-reviewed journal. The second paper describes how nest-placement
and alternative food sources affect the risk of nest predation in four mountain ranges
located in southeastern Arizona. The second paper will also be submitted to a peer-
reviewed journal. The following is a summary of the most important findings in these
two papers.
Numbers of band-tailed pigeons (Patagioenas fasciata) in Arizona have declined
5.1% annually since 1966. Understanding the habitat requirements for the interior
subspecies of band-tailed pigeons and identifying potential causes for declines will help
management agencies develop plans to recover populations. We located and monitored
pigeon nests (n = 12) in southeastern Arizona during 2002-2004 and estimated nesting
success. We measured and compared habitat features between 1) nest sites and randomly
selected sites, and 2) successful and unsuccessful nests. The odds of a band-tailed pigeon
nesting in an area increased with more trees >100 cm dbh, and more cover of silverleaf
oak (Quercus hypoleudcoides) between 2 and 5 m above ground (P < 0.0001). Overall
nesting success was 32%. Burned areas contained more successful nests than unburned
areas (P = 0.038) and areas around successful nests contained more snags than areas
around unsuccessful nests (P = 0.011). Band-tailed pigeon nest sites in southeastern
Arizona were in areas with larger trees compared to random sites suggesting that

14
observed population declines may have been due, in part, to removal of large trees as part
of forest management practices over the past century.
Band-tailed pigeons nest more commonly in mixed-conifer forests, but forage in
both mixed-conifer forests and oak woodlands. We examined the hypothesis that band-
tailed pigeons in Arizona nest more frequently in coniferous forests because the risk of
nest predation is lower relative to oak woodlands. We tested two predictions of this
hypothesis. We tested the prediction that mixed-conifer forests have a lower risk of nest
predation compared to oak woodlands. We used artificial nests baited with quail eggs to
compare the relative risk of nest predation between mixed-conifer forest and oak
woodlands. We compared the artificial nest results with results from natural band-tailed
pigeon nests to determine if the pattern in risk of nest predation observed with artificial
nests was similar to the pattern observed with natural nests. We also tested the prediction
that the relative abundance of avian and mammalian nest predators was lower in mixed-
conifer forests compared to oak woodlands. We used point-count surveys to compare the
relative abundance of avian and mammalian nest predators between the 2 plant
communities. We also tested the alternative prey hypothesis. We estimated the relative
abundance of main food sources (conifer cones, acorns) available to common nest
predators to determine if the abundance of these main food sources influences the
probability of nest predation within mixed-conifer forest and oak woodlands. In support
of the nest predation hypothesis, both the risk of nest predation (P = 0.0002) and predator
abundance (P = 0.039) were lower in coniferous forests than in oak woodlands. Results
of the artificial nest experiment were comparable to results from natural nests (interaction

15
between nest type and plant community, P = 0.829). We did not find a relationship
between the abundance of main food sources for potential nest predators and the risk of
nest predation (P = 0.156). Our results suggest that the risk of nest predation likely
influences habitat selection in band-tailed pigeons.
We recommend additional studies to further clarify the preferred nest-site
characteristics of band-tailed pigeons, identify the factors responsible for population
declines, and identify factors responsible for the low nesting success observed during this
study. Additionally, forest management practices such as thinning, road building, and
prescribed fire can increase the abundance of small mammals (Kyle and Block 2000,
Converse et al. 2006a, Converse et al. 2006b) and thereby increase the risk of nest
predation. Therefore, research is needed to determine how these practices affect
predation risk particularly in mixed-conifer forests and other areas that normally have a
lower relative risk of nest predation.

16
REFERENCES
Anglestam, P., E. Lindstrom, and P. Widen. 1984. Role of predation in short-term population fluctuations of some birds and mammals in Fennoscandia. Oecologia 62:199-208.
Borgmann, K. L., and A. D. Rodewald. 2004. Nest predation in an urbanizing landscape: the role of exotic shrubs. Ecological Applications 14:1757-1765.
Braun, C. E. 1994. Band-tailed Pigeon. Pages 60-74 in T. C. Tacha and C. E. Braun, editors. Migratory shore and upland game bird management in North America. International Association of Fish and Wildlife Agencies, Washington, D. C., USA.
Caughley, G. 1994. Directions in conservation biology. Journal of Animal Ecology 63:215-244.
Clark, R. G., and T. D. Shutler. 1999. Avian habitat selection: pattern from process in nest-site use by ducks. Ecology 80:272-287.
Cody, M. L., editor. 1985. Habitat selection in birds. Academic Press, Inc., Orlando, Florida, USA.
Conner, R. N., M. E. Anderson, and J. G. Dickson. 1986. Relationships among territory size, habitat, song, and nesting success of northern cardinals. Auk 103:23-31.
Hall, L. S., and R. W. Mannan. 1999. Multiscaled habitat selection by elegant trogons in southeastern Arizona. Journal of Wildlife Management 63:451-461.
Hildén, O. 1965. Habitat selection in birds: a review. Annales Zoologici Fennici 2:53-75.
Hutto, R. L. 1985. Habitat selection by non-breeding, migratory land birds. Pages 455-476 in M. L. Cody, editor. Habitat selection in birds. Academic Press, New York, New York, USA.
Jones, J., and R. J. Robertson. 2001. Territory and nest-site selection of cerulean warblers in eastern Ontario. Auk 118:727-735.
Keppie, D. M., and C. E. Braun. 2000. Band-tailed pigeon: Columba fasciata. Account 530 in A. Poole and F. Gill, editors. Birds of North America, The Academy of Natural Sciences, Philadelphia, and American Ornithologists' Union, Washington, D.C., USA.
Kirkpatrick, C., C. J. Conway, K. Hughes, and J. C. deVos. 2005. An evaluation of survey methods for monitoring interior populations of band-tailed pigeons. U.S. Geological Survey Wildlife Report #2005-03, Arizona Cooperative Fish and Wildlife Research Unit, Tucson, Arizona, USA.
17
Lack, D. L. 1952. The natural regulation of animal numbers. Clarendon Press, Oxford, UK.
Latta, M. J., C. J. Beardmore, and T. E. Corman. 1999. Arizona Partners in Flight bird conservation plan. Version 1.0. Arizona Game and Fish Department Technical Report 142, Phoenix, Arizona, USA.
Martin, T. E. 1993a. Nest predation among vegetation layers and habitat types: revising the dogmas. American Naturalist 141:897-913.
Martin, T. E. 1998. Are microhabitat preferences of coexisting species under selection and adaptive? Ecology 79:656-670.
Martin, T. E. 2001. Abiotic vs. biotic influences on habitat selection of coexisting species: climate change impacts? Ecology 82:175-188.
Morrison, M. L., B. G. Marcot, and R. W. Mannan. 1998. Wildlife-habitat relationships: concepts & applications. Second edition. University of Wisconsin Press, Madison, Wisconsin, USA.
National Audubon Society. 2002. Audubon Watchlist. <http://www.audubon.org/bird/watchlist/index.html> Accessed 9 May 2006.
Nilsson, S. G. 1984. The evolution of nest-site selection among hole-nesting birds: the importance of nest predation and competition. Ornis Scandinavica 15:167-175.
Orians, G. H., and J. F. Wittenberger. 1991. Spatial and temporal scales in habitat selection. American Naturalist 137:S29-S49.
Pacific Flyway Study Committee and Central Flyway Webless Migratory Game Bird Technical Committee. 2001. Pacific and central flyways management plan for the Four Corners populations of band-tailed pigeons. Pacific Flyway Council, U.S. Fish and Wildlife Service, Portland, Oregon, USA.
Pidgeon, A. M., V. C. Radeloff, and N. E. Mathews. 2003. Landscape-scale patterns of black-throated sparrow (Amphispiza bilineata) abundance and nest success. Ecological Applications 13:530-542.
Sara, M., and M. Di Vittorio. 2003. Factors influencing the distribution, abundance and nest-site selection of an endangered Egyptian vulture (Neophron percnopterus) population in Sicily. Animal Conservation 6:317-328.
18
APPENDIX A
NESTING SUCCESS AND NEST-SITE SELECTION IN BAND-TAILED PIGEONS
Abstract
Numbers of band-tailed pigeons (Patagioenas fasciata) in North America have
declined nearly 4% per year since 1980. Understanding the habitat requirements for the
interior subspecies of band-tailed pigeons and identifying potential causes for declines
will help management agencies develop plans to recover populations. We located and
monitored band-tailed pigeon nests (n = 12) in southeastern Arizona during 2002-2004
and estimated nesting success. We measured and compared habitat features between 1)
nest sites and randomly selected sites, and 2) successful and unsuccessful nests. The
odds of a band-tailed pigeon nesting in an area increased with more trees >100 cm dbh,
and more cover of silverleaf oak (Quercus hypoleudcoides) between 2 and 5 m above
ground (P < 0.0001). Overall nesting success was 32%. Burned areas contained more
successful nests than unburned areas (P = 0.038) and areas around successful nests
contained more snags than areas around unsuccessful nests (P = 0.011). Band-tailed
pigeon nest sites in southeastern Arizona were in areas with larger trees compared to
random sites suggesting that observed population declines may have been due, in part, to
removal of large trees as part of forest management practices over the past century. We
recommend additional studies to further clarify the preferred nest-site characteristics of
band-tailed pigeons, identify the factors responsible for population declines, and identify
factors responsible for the low nesting success observed during this study.
19
Introduction
Nest-site selection has been studied extensively in birds (Cody 1985, Morrison et
al. 1998, Hall and Mannan 1999) and recent efforts to document fitness consequences of
nest placement (Martin 1998, Clark and Shutler 1999, Jones and Robertson 2001, Martin
2001) have provided important insights for wildlife managers. For example, vegetation
and landscape features that correlate with reproductive success provide metrics for
assessing habitat quality (Conner et al. 1986, Pidgeon et al. 2003, Sara and Di Vittorio
2003, Borgmann and Rodewald 2004). Identifying the proximate cues that birds use to
select nest sites and the ensuing consequences of those choices is critical to managers for
conservation planning (Caughley 1994), especially for species of conservation concern.
The band-tailed pigeon (Patagioenas fasciata) is a migratory game bird that
breeds in two distinct regions within the western U.S. (Braun 1994). The coastal
subspecies (P. f. monilis) breeds from southern California to British Columbia, whereas
the interior subspecies (P. f. fasciata) breeds in Colorado, Utah, New Mexico, and
Arizona (Keppie and Braun 2000). Information currently available suggests that
populations of both subspecies are declining. In the late 1800’s, flocks of band-tailed
pigeons were compared to those of the passenger pigeon (Ectopistes migratorius; Bendire
1892). Flocks greater than 50 birds are now rarely observed away from mineral springs
in the Pacific Coast region and numbers have declined nearly 4% annually since 1980
throughout the pigeon’s range (Sauer et al. 2005). Breeding populations in Oregon have
declined by 70% since 1950 (Keppie and Braun 2000). Reliable trend estimates for the
interior subspecies are not available, but recent surveys indicate an 84% decline since the

20
1970’s for the interior subspecies in 1 mountain range in Arizona (Kirkpatrick et al.
2005). Most states still consider band-tailed pigeons game birds, yet annual estimates of
both hunter participation and number of pigeons harvested decreased by 87% between
1970 and 1996 (Pacific Flyway Study Committee and Central Flyway Webless Migratory
Game Bird Technical Committee 2001). Consequently, the band-tailed pigeon has been
identified as a priority species of conservation concern at both the state (Latta et al. 1999)
and national (National Audubon Society 2002) level.
Recent research has provided useful information on the natural history of band-
tailed pigeon in Oregon (Leonard 1998, Sanders 1999), but knowledge of basic breeding
biology and habitat requirements remains poor for the interior subspecies of band-tailed
pigeon (Keppie and Braun 2000, Pacific Flyway Study Committee and Central Flyway
Webless Migratory Game Bird Technical Committee 2001). This lack of information is
largely due to low nesting densities and the difficulty of locating nests which are not
easily found using typical nest-searching techniques (Martin and Geupel 1993). More
information on the breeding biology, habitat, and potential causes of mortality of band-
tailed pigeons is necessary to effectively determine the underlying causes of population
declines (Fitzhugh 1970, Braun 1994, Pacific Flyway Study Committee and Central
Flyway Webless Migratory Game Bird Technical Committee 2001). Therefore, our
objectives in this study were to: 1) identify vegetation characteristics and landscape
features that influence nest-site selection of band-tailed pigeons; 2) determine whether
these vegetation and landscape characteristics affect nesting success; and 3) examine

21
whether low reproductive success may be contributing to the observed population
declines.
22
Study Area
We studied band-tailed pigeons within the Coronado National Forest, primarily
within the Santa Catalina Mountains, Pima County, Arizona, USA. Our study area was
approximately 20 km northeast of Tucson, but we also included 1 band-tailed pigeon nest
located in the Chiricahua Mountains, Cochise County, approximately 160 km southeast
of Tucson. The Santa Catalina and Chiricahua Mountains are typical of Sky Island
mountain ranges; relatively small, high-elevation mountain ranges in the Sonoran desert
that are separated from other mountain ranges by desert basins (Marshall 1957, Warshall
1995). The mountains have rugged terrain and elevations range from 900 to 3000 m with
desert scrub and encinal oak woodlands at lower elevations, oak-pinyon-juniper (Quercus
spp-Pinus spp.-Juniperus spp.) and pine-oak woodlands at mid-elevations, and ponderosa
pine (Pinus ponderosa) and mixed-conifer forest at higher elevations. Annual
precipitation and temperature vary along an altitudinal gradient ranging from 900 to 3000
m. Low elevations experience temperatures between 4 – 38°C with 30 cm of
precipitation annually, whereas higher elevations experience temperatures between -6 –
24°C with 69 cm of precipitation annually (WALTER 2001). Most precipitation falls
during the brief but heavy summer monsoon rains and as light rain in the winter.

23
Methods
Trapping and Radio-telemetry
To help locate nests, we placed radio transmitters on adult band-tailed pigeons.
We used funnel traps (Braun 1976) baited with millet and sunflower seeds to capture
adult male and female pigeons. We trapped pigeons at 5 sites in the Santa Catalina
Mountains from 13 June to 22 August of 2002, 2 May to 16 June 2003, and 7 May to 10
August 2004. We placed radio-transmitters on adults with active crop glands indicating
reproductive activity. We primarily radio-marked males in 2002 because males incubate
eggs for more daylight hours than females (Curtis and Braun 1983) which facilitated
finding nests on foot. We primarily radio-marked females in 2003 and 2004 because
females incubate eggs during early morning hours (Neff 1947, Keppie and Braun 2000)
when telemetry flights were available. We used 7-g and 10-g transmitters in 2002 and
switched to 6-g transmitters in 2003 and 2004. We used 3 methods to attach radios to
pigeons: backpack, super glue (J. Leonard, Corvallis, Oregon, personal communication),
or chest-mount techniques (B. Mueller, American Wildlife Enterprises, personal
communication). The University of Arizona’s Institutional Animal Care and Use
Committee approved all methods (IACUC protocol # 02-010).
We tracked radio-marked pigeons 5 days per week. In addition to tracking radio-
marked pigeons from the ground, we located pigeons by flying transects in a fixed-wing
airplane (average 1 flight per month) throughout the Santa Catalina Mountains while
scanning for radio signals (Leonard 1998). We also made periodic flights outside the
Santa Catalina Mountains to search for birds that we were otherwise unable to locate.
24
We used a Global Positioning System (Garmin emap) receiver to obtain Universal
Transverse Mercator (UTM) coordinates for each radio-marked pigeon detected. We
searched for nests on foot in areas where we had located radio-marked pigeons.
Breeding Biology and Mortality Factors
We monitored each nest (n = 12) every 3 days until the nest failed or offspring
fledged. We recorded the presence and behavior of pigeons on each visit to nests to
estimate egg-laying dates, incubation and nestling periods, and hatching and fledging
success. We also recorded clutch size when we could see eggs through the bottom of
nests. We assumed a nest was successful when we observed a squab flying around near
the nest, or when we observed pigeon activity throughout the nestling period (25.5 days
after hatching) but we observed no activity around the nest after the nestling period
ended. We assumed a nest failed when we observed no pigeon activity around the nest or
saw no sign of a squab in or around the nest prior to the end of nestling period. When a
nest failed, we searched the area under the nest for signs of depredation. We attempted to
identify the cause of nest failure (and juvenile and adult mortality) when we found signs
of mortality.
Habitat Sampling
Once a nest was no longer active, we measured 13 features to describe
characteristics associated directly with the nest (Table A.1). We estimated diameter of
the largest supporting stem, nest dimensions, distance to overhead cover, and distance
from the nest to the bole when the nest was too high to measure these characteristics
directly. We also measured 11 landscape and vegetation features within a 25-m radius of
25
each nest and at 30 randomly selected points located within the Santa Catalina Mountains
(Table A.1). We used ArcView 3.3 to generate random points within the Santa Catalina
Mountains with the constraints that points be in undeveloped areas (e.g., not on roads or
within housing developments), >1676 m in elevation (lowest recorded elevation of a
band-tailed pigeon nest in Arizona; Neff 1947), <45° slopes, ≤1 km from a road (for ease
of access), and in areas either not burned or lightly burned during the 2002 Bullock fire
or the 2003 Aspen fire. Using point intercept (Elzinga et al. 1998), we estimated percent
vegetation cover for 6 height categories (basal, 0-0.5 m, 0.6-2 m, 2.1-5 m, 5.1-10 m, and
>10 m) at 5-m intervals along 25-m transects in 4 cardinal directions at each nest and
random site. For sampling heights ≥2 m, we estimated the plant species and frequency of
hits within our height categories using an imaginary line extending vertically from our
eyes. We used U.S. Forest Service GIS data to determine the burn status of nest and
random sites.
Analyses
Nesting Success. We used the daily exposure method (Mayfield 1961) to
calculate daily nest survival probability and overall nesting success based on a 44.5-day
nesting period (19-day incubation period and 25.5-day nestling period; Keppie and Braun
2000).
Habitat Characteristics. We used 2-tailed t-tests and Pearson’s chi-square tests to
compare vegetation and landscape features between nest sites and random sites, and
between successful and unsuccessful nests. We also used logistic regression with
stepwise variable selection (P < 0.20 to enter, P < 0.10 to remain) with plot type (nest or
26
random) as the response variable to identify characteristics that best distinguished nest
sites from random sites. We used the same approaches to identify characteristics that
best distinguished successful nests from unsuccessful nests, but also included the 13
variables that were nest-site specific for this analysis.
The cover variable “grass 0-0.5 m” was highly correlated with total cover 0-0.50
m (r = 0.85), so we excluded grass 0-0.5 m from the analyses. We excluded 5 features
associated directly with nests (distance from nest to bole, diameter of largest supporting
stem, distance to overhead cover, % overhead cover, and % side cover) from the
successful vs. unsuccessful nests logistic regression analysis because we failed to
measure these variables at ≥1 nest. Because the likelihood of a correlation between burn
status and number of snags seemed high, we analyzed the relationship between the
number of snags around nest sites and nesting success after accounting for burn status
using logistic regression.
We used Watson’s U2 test for goodness-of-fit to analyze nest aspect relative to the
bole, and Watson’s U2 test for non-parametric 2-sample testing for data containing ties to
compare terrain aspect between nest and random sites. Our small sample size of nests
prevented meaningful comparison of nest aspect relative to the bole or terrain aspect
between successful and unsuccessful nests.
27
Results
Trapping and Radio-telemetry
We captured 200 band-tailed pigeons (191 after hatch-year birds; 9 hatch-year
birds) during 2189 trap hours and radio-marked 50 of those birds (25 males and 2 females
in 2002, 1 male and 9 females in 2003, and 6 males and 7 females in 2004). We found 7
of 12 (58%) band-tailed pigeon nests by following radio-marked birds to the nest. We
also observed long-distance movements by 3 radio-marked male pigeons during aerial
surveys in 2003. These pigeons were captured in the Santa Catalina Mountains and
relocated via aerial radio telemetry in the Rincon Mountains (40 km away), Galiuro
Mountains (45 km away), and Huachuca Mountains (105 km away).
Breeding Biology and Mortality Factors
Nesting Success. We located 12 band-tailed pigeon nests (6 in 2002, 1 in 2003, 5
in 2004). We estimated that nests were initiated on 15 May, 18 June, 20 June, 28 June, 3
July, 10 July (median), 17 July, 21 July, 23 July, 8 August, and 21 August. Clutch size
was 1 for the 3 nests where we could confirm nest contents during incubation, and we
assumed clutch size was 1 for 5 nests found during the nestling stage that contained 1
squab each. Apparent nesting success for the 10 nests with known fate was 33%. All 6
nests found in 2002 failed, 1 nest found in 2003 fledged 1 squab, and 2 nests found in
2004 each fledged 1 squab, 2 nests failed, and the fate of 1 nest was unknown. We
attributed failures to predation (n = 4; 50%), weather (n = 1; 12%), and unknown causes
(n = 3; 38%). Daily nest survival and overall nesting success were 97.5% and 31.9%,
respectively.

28
Mortalities. We confirmed 6 mortalities of pigeons (n = 1 juvenile, n = 5 radio-
marked adults). One pigeon was depredated by a northern goshawk (Accipiter gentiles),
1 by an unknown raptor, 1 by a domestic cat, and 2 appeared to have been depredated by
foxes (Urocyon cinereoargenteus). An unknown predator killed 1 pigeon in a funnel
trap.
Habitat Sampling
Nest and Nest-site Features. We measured vegetation and landscape features at
11 of the 12 nests (fire fighters partially destroyed the vegetation around 1 nest in 2002
prior to when sampling could occur). We observed both males and females collecting
nesting material. Nests consisted of small diameter (2-5 mm) Douglas fir (Pseudostuga
menziesii) and white fir (Abies concolor) twigs. Nest dimensions averaged 24 x 29 cm (n
= 7, range 15 x 25 cm to 30 x 40 cm) and were located an average of 14.1 m (± 2.3)
above the ground in trees 22.9 m (± 3.3) tall (Table A.2).
Nest Sites vs. Random Sites. Nest sites differed from random sites with regards to
13 of 49 features compared (Table A.3). Overall, nest sites were found on steeper slopes,
and in areas with higher % canopy closure and larger trees than randomly selected sites.
We found no evidence that band-tailed pigeons disproportionately selected nest sites in
burned areas (χ2 = 2.1, P = 0.148). The density of trees >13 cm dbh was 30% greater at
nest sites (305 ± 67 trees/ha2) compared to random sites (213 ± 21 trees/ha2; t = -1.7, df =
39, P = 0.091). On a community level, fewer nests were placed in stands of encinal oak
and ponderosa pine and more nests were placed in stands of mixed-conifer and pine-oak
than expected (χ2 = 9.0, P = 0.030). Three variables distinguished nest sites from random

29
sites. The odds of a band-tailed pigeon nesting in an area increased with more large (54-
100 cm dbh) trees, and greater silverleaf oak cover between 2 and 5 m above ground
(Table A.4).
Successful vs. Unsuccessful Nests. More successful nests were in burned areas
than unburned areas (χ2 = 4.3, P = 0.038) and areas around successful nests contained
more snags (151.7 ± 31.3 snags/ha2) than areas around unsuccessful nests (27.9 ± 20.5
snags/ha2; t = 3.3, df = 8, P = 0.011). Snags were more numerous around successful
nests even after accounting for burn status (G2 = 6.7, P = 0.010).

30
Discussion
Movements
Several radio-marked pigeons traveled long distances (up to 105 km) between
montane forests in 4 different mountain ranges. Such travels represent the first
documentation of long-distance movements between mountain ranges for band-tailed
pigeons during the breeding season in southeastern Arizona. Several authors (Neff 1947,
Smith 1968, Gutierrez et al. 1975) have mentioned the nomadic tendency of band-tailed
pigeons in response to fluctuations in food availability, but breeding site fidelity has also
been documented (MacGregor and Smith 1955, Braun 1972, Leonard 1998, C.
Kirkpatrick, personal observation). Band-tailed pigeons in Oregon traveled on average 5
km from nest sites to foraging areas and the longest distance traveled was 51 km
(Leonard 1998). Band-tailed pigeons in Colorado traveled as far as 65 km from nest sites
to foraging areas (Braun 1972). Distances between Sky Island mountain ranges (and
available habitat) are relatively large and may force band-tailed pigeons in southeastern
Arizona to commute farther to find food or appropriate nesting habitat compared to
Oregon and Colorado. Although we were not able to determine activities of pigeons in
these other mountain ranges, band-tailed pigeons may be nesting in one range and
foraging in another to take advantage of dependable food sources in residential areas.
Breeding Biology and Mortality Factors
Our results agree with those from other studies of breeding band-tailed pigeons in
that breeding activity peaked in June and July in the Santa Catalina Mountains (Fitzhugh
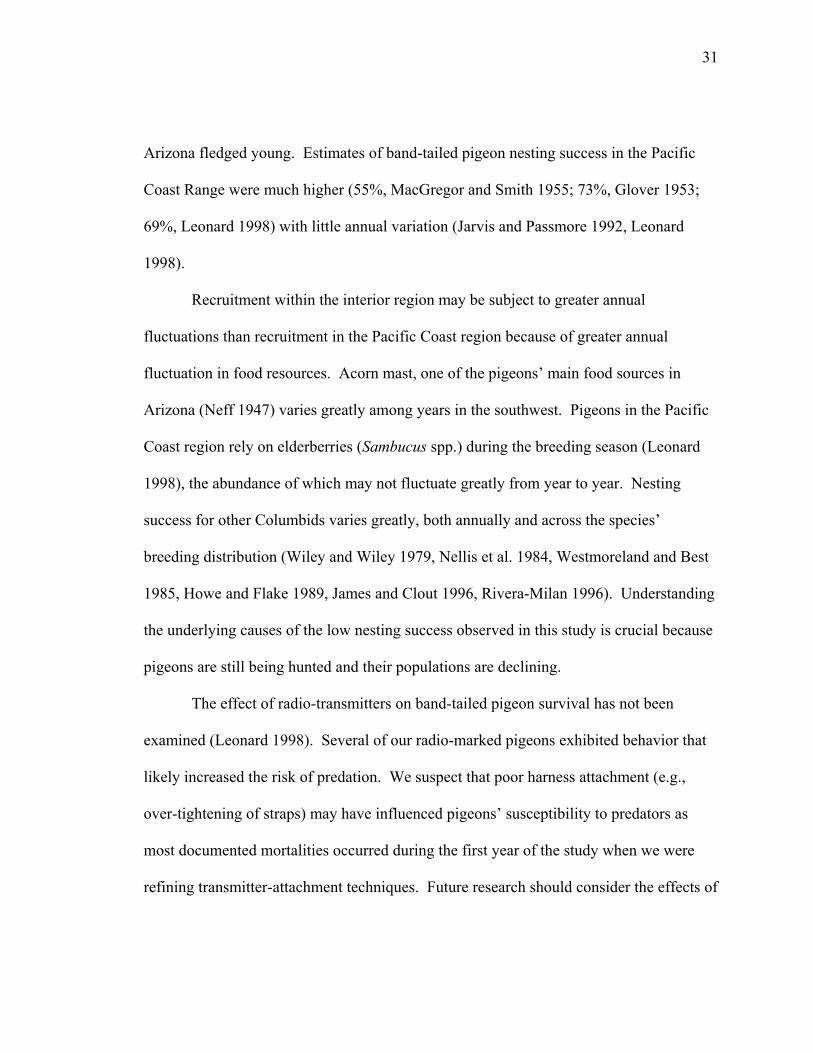
1974, Leonard 1998). Only 33% of band-tailed pigeon nests monitored in southeastern
31
Arizona fledged young. Estimates of band-tailed pigeon nesting success in the Pacific
Coast Range were much higher (55%, MacGregor and Smith 1955; 73%, Glover 1953;
69%, Leonard 1998) with little annual variation (Jarvis and Passmore 1992, Leonard
1998).
Recruitment within the interior region may be subject to greater annual
fluctuations than recruitment in the Pacific Coast region because of greater annual
fluctuation in food resources. Acorn mast, one of the pigeons’ main food sources in
Arizona (Neff 1947) varies greatly among years in the southwest. Pigeons in the Pacific
Coast region rely on elderberries (Sambucus spp.) during the breeding season (Leonard
1998), the abundance of which may not fluctuate greatly from year to year. Nesting
success for other Columbids varies greatly, both annually and across the species’
breeding distribution (Wiley and Wiley 1979, Nellis et al. 1984, Westmoreland and Best
1985, Howe and Flake 1989, James and Clout 1996, Rivera-Milan 1996). Understanding
the underlying causes of the low nesting success observed in this study is crucial because
pigeons are still being hunted and their populations are declining.
The effect of radio-transmitters on band-tailed pigeon survival has not been
examined (Leonard 1998). Several of our radio-marked pigeons exhibited behavior that
likely increased the risk of predation. We suspect that poor harness attachment (e.g.,
over-tightening of straps) may have influenced pigeons’ susceptibility to predators as
most documented mortalities occurred during the first year of the study when we were
refining transmitter-attachment techniques. Future research should consider the effects of

32
radio-transmitters on the survival of band-tailed pigeons, nesting success of radio-marked
birds, and on the bias such effects may have on their results.
Nest-site Characteristics
Nests and Nest Sites. Characteristics at 12 nests in southeastern Arizona were
similar to studies from other areas (MacGregor and Smith 1955, Peeters 1962, Curtis and
Braun 1983, Leonard 1998). We found similar results between our study and a study in
Oregon (Leonard 1998) for nest-tree height, distance to closest overhead cover, and
density of trees >13 cm dbh. Some nest-site specific features differed slightly from those
in Oregon; the crown base height of Arizona nest trees averaged >3 m higher, nest
heights were 4 m greater, and nests were placed 0.5 m farther from the main bole on
average than nests found in Oregon. These differences may simply reflect a greater
availability of larger trees at our study site compared to the Oregon study site. Average
slope across Arizona nest sites (26°) was similar to Colorado nest sites (Curtis and Braun
1983), whereas slopes for Oregon nest sites averaged 18°.
The majority of band-tailed pigeon nests (>73%) in Arizona were found in large,
coniferous trees within mixed-conifer forest, which is similar to nest placement in other
regions (Glover 1953, MacGregor and Smith 1955, Peeters 1962, Curtis and Braun 1983,
Leonard 1998). Nest trees in Arizona had an average dbh over twice that of nest trees in
Oregon. Some nests in Oregon were found in shrubs and the inclusion of shrub dbh
measurements may have lowered the average nest-tree dbh in Oregon. Another possible
explanation for the difference in nest-tree dbh between the 2 regions is that widespread
33
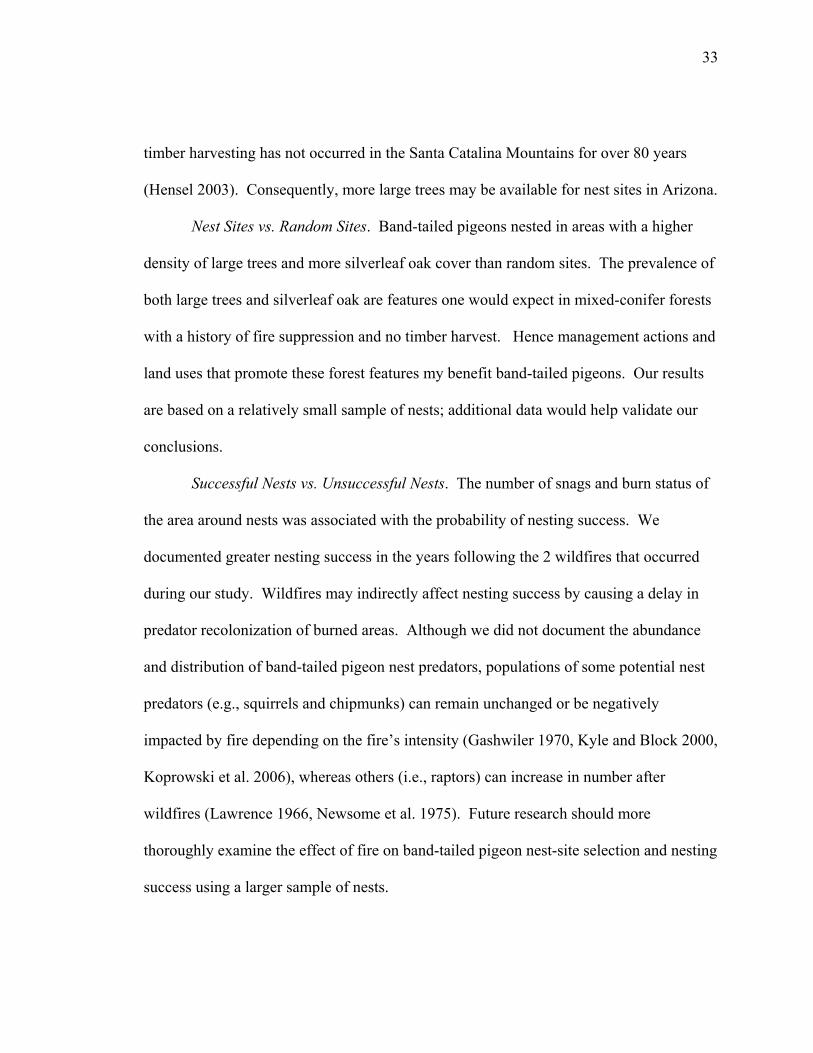
timber harvesting has not occurred in the Santa Catalina Mountains for over 80 years
(Hensel 2003). Consequently, more large trees may be available for nest sites in Arizona.
Nest Sites vs. Random Sites. Band-tailed pigeons nested in areas with a higher
density of large trees and more silverleaf oak cover than random sites. The prevalence of
both large trees and silverleaf oak are features one would expect in mixed-conifer forests
with a history of fire suppression and no timber harvest. Hence management actions and
land uses that promote these forest features my benefit band-tailed pigeons. Our results
are based on a relatively small sample of nests; additional data would help validate our
conclusions.
Successful Nests vs. Unsuccessful Nests. The number of snags and burn status of
the area around nests was associated with the probability of nesting success. We
documented greater nesting success in the years following the 2 wildfires that occurred
during our study. Wildfires may indirectly affect nesting success by causing a delay in
predator recolonization of burned areas. Although we did not document the abundance
and distribution of band-tailed pigeon nest predators, populations of some potential nest
predators (e.g., squirrels and chipmunks) can remain unchanged or be negatively
impacted by fire depending on the fire’s intensity (Gashwiler 1970, Kyle and Block 2000,
Koprowski et al. 2006), whereas others (i.e., raptors) can increase in number after
wildfires (Lawrence 1966, Newsome et al. 1975). Future research should more
thoroughly examine the effect of fire on band-tailed pigeon nest-site selection and nesting
success using a larger sample of nests.
34
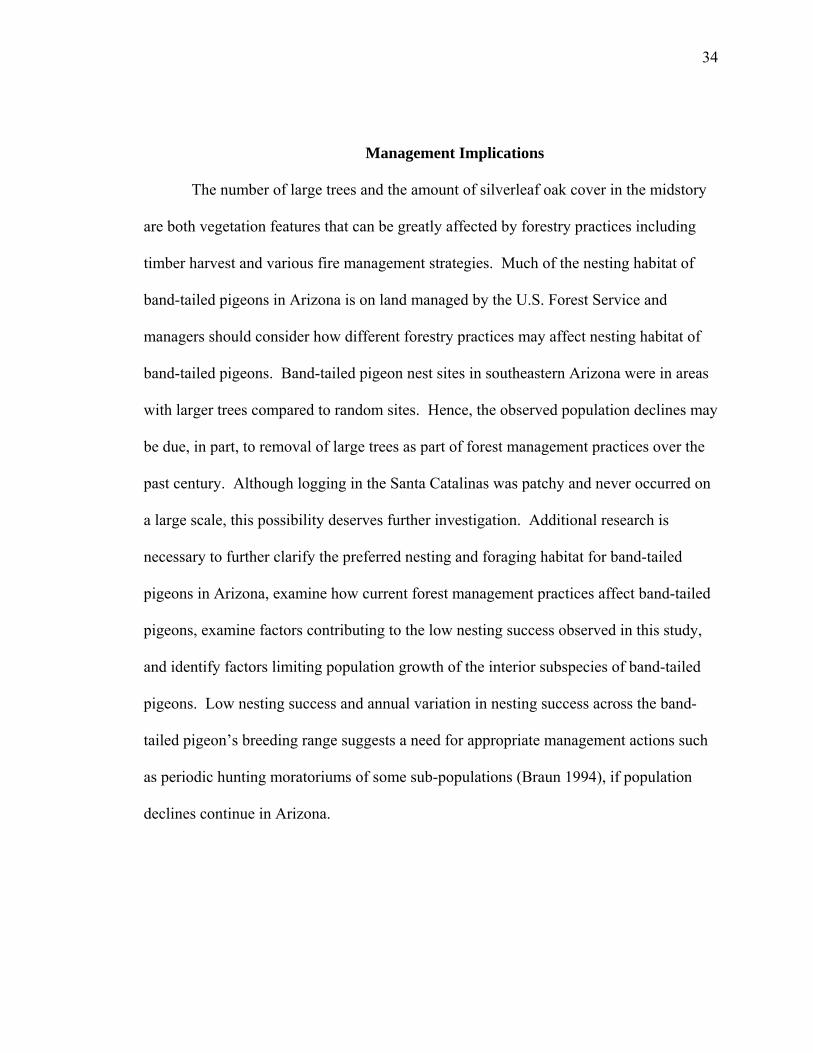
Management Implications
The number of large trees and the amount of silverleaf oak cover in the midstory
are both vegetation features that can be greatly affected by forestry practices including
timber harvest and various fire management strategies. Much of the nesting habitat of
band-tailed pigeons in Arizona is on land managed by the U.S. Forest Service and
managers should consider how different forestry practices may affect nesting habitat of
band-tailed pigeons. Band-tailed pigeon nest sites in southeastern Arizona were in areas
with larger trees compared to random sites. Hence, the observed population declines may
be due, in part, to removal of large trees as part of forest management practices over the
past century. Although logging in the Santa Catalinas was patchy and never occurred on
a large scale, this possibility deserves further investigation. Additional research is
necessary to further clarify the preferred nesting and foraging habitat for band-tailed
pigeons in Arizona, examine how current forest management practices affect band-tailed
pigeons, examine factors contributing to the low nesting success observed in this study,
and identify factors limiting population growth of the interior subspecies of band-tailed
pigeons. Low nesting success and annual variation in nesting success across the band-
tailed pigeon’s breeding range suggests a need for appropriate management actions such
as periodic hunting moratoriums of some sub-populations (Braun 1994), if population
declines continue in Arizona.

35
Acknowledgments
R. W. Mannan and R. J. Steidl provided advice on study design and review of
earlier versions of this manuscript. D. Fox, G. Gryniewicz, J. Havelaar, K. Hemmelgarn,
D. LaRoche, E. Martinez-Leyva, E. Nolte, C. Murray, C. Seal, and J. Warr conducted
fieldwork. M. Reed and C. Coates helped extensively with GIS. T. Deecken, G.
Gonzales, G. Helbing, L. Jones, B., J. Magehee, B. Stolp, and J. Taiz assisted with
permits and access to study areas and provided information on band-tailed pigeon
locations in southeastern Arizona. C. Braun, M. Casazza, L. Fitzhugh, J. Leonard, and T.
Sanders provided insight into working with band-tailed pigeons. B. Mueller assisted with
transmitter logistics. B. Peterson and the University of Arizona Steward Observatory
provided field housing. D. Dolton provided project support. Funding was provided by
the Webless Migratory Game Bird Research Program, the Arizona Game and Fish
Department Heritage Fund, the U.S. Fish and Wildlife Service, the U.S.G.S. Arizona
Cooperative Fish and Wildlife Research Unit, the University of Arizona, and T & E, Inc.

36
Literature Cited
Bendire, C. E. 1892. Life histories of North American birds with special reference to their breeding habits and eggs. U.S. Natural History Museum Special Bulletin 1, Washington D.C., USA.
Borgmann, K. L., and A. D. Rodewald. 2004. Nest predation in an urbanizing landscape: the role of exotic shrubs. Ecological Applications 14:1757-1765.
Braun, C. E. 1972. Movements and hunting mortality of Colorado band-tailed pigeons. Transactions of the North American Wildlife and Natural Resources Conference 37:326-334.
Braun, C. E. 1976. Methods for locating, trapping and banding band-tailed pigeons in Colorado. Colorado Division of Wildlife Special Report Number 39, Fort Collins, Colorado, USA.
Braun, C. E. 1994. Band-tailed pigeon. Pages 61-74 in T. C. Tacha, and C. E. Braun editors. Migratory Shore and Upland Game Bird Management in North America. Allen Press Lawrence, Kansas, USA.
Caughley, G. 1994. Directions in conservation biology. Journal of Animal Ecology 63:215-244.
Clark, R. G., and D. Shutler. 1999. Avian habitat selection: pattern from process in nest-site use by ducks. Ecology 80:272-287.
Cody, M. L., editor. 1985. Habitat selection in birds. Academic Press, Inc., Orlando, Florida, USA.
Conner, R. N., M. E. Anderson, and J. G. Dickson. 1986. Relationships among territory size, habitat, song, and nesting success of northern cardinals. Auk 103:23-31.
Curtis, P. D., and C. E. Braun. 1983. Radiotelemetry location of nesting band-tailed pigeons in Colorado. Wilson Bulletin 95:464-466.
Elzinga, C. L., D. W. Salzer, and J. W. Willoughby. 1998. Measuring and monitoring plant populations. Bureau of Land Management, National Applied Resource Sciences Center, Denver, Colorado, USA.
Fitzhugh, E. L. 1970. Literature review and bibliography of the band-tailed pigeon of Arizona, Colorado, New Mexico, and Utah. Arizona Game and Fish Commission Special Report, Phoenix, Arizona, USA.

37
Fitzhugh, E. L. 1974. Chronology of calling, egg laying, crop gland activity, and breeding among wild band-tailed pigeons in Arizona. Dissertation, University of Arizona, Tucson, Arizona, USA.
Gashwiler, J. S. 1970. Plant and mammal changes on a clearcut in west-central Oregon. Ecology 51:1018-1026.
Glover, F. A. 1953. A nesting study of the band-tailed pigeon (Columba f. fasciata) in Northwestern California. California Fish and Game 39:397-407.
Gutierrez, R. J., C. E. Braun, and T. P. Zapatka. 1975. Reproductive biology of the band-tailed pigeon in Colorado and New Mexico. Auk 92:665-677.
Hall, L. S., and R. W. Mannan. 1999. Multiscaled habitat selection by elegant trogons in southeastern Arizona. Journal of Wildlife Management 63:451-461.
Hensel, S. 2003. Look to the mountains. Mt. Lemmon's Women's Club, Mt. Lemmon, Arizona, USA.
Howe, F. P., and L. D. Flake. 1989. Nesting ecology of mourning doves in a cold desert ecosystem. Wilson Bulletin 101:467-472.
James, R. E., and M. N. Clout. 1996. Nesting success of New Zealand pigeons (Hemiphaga novaeseelandiae) in response to a rat (Rattus rattus) poisoning programme at Wenderholm Regional Park. New Zealand Journal of Ecology 20:45-51.
Jarvis, R. L., and M. F. Passmore. 1992. Ecology of band-tailed pigeons in Oregon. U.S. Fish and Wildlife Service Report No. 6, Washington, D.C., USA.
Jones, J., and R. J. Robertson. 2001. Territory and nest-site selection of cerulean warblers in eastern Ontario. Auk 118:727-735.
Keppie, D. M., and C. E. Braun. 2000. Band-tailed pigeon: Columba fasciata. Pages 1-28 in A. Poole, and F. Gill editors. Birds of North America. The Academy of Natural Sciences and American Ornithologists' Union, Washington, D.C., USA.
Kirkpatrick, C., C. J. Conway, K. Hughes, and J. C. deVos. 2005. An evaluation of survey methods for monitoring interior populations of band-tailed pigeons. Wildlife Research Report #2005-03. U.S.G.S. - Arizona Cooperative Fish and Wildlife Research Unit, Tucson, Arizona, USA.
Koprowski, J. L., K. M. Leonard, C. A. Zugmeyer, and J. L. Jolley. 2006. Direct effects of fire on endangered Mt. Graham red squirrels. Southwestern Naturalist 51: 59-63.

38
Kyle, S. C. and W. M. Block. 2000. Effects of wildfire severity on small mammals in northern Arizona ponderosa pine forests. Pages 163-168 in Fire and forest ecology: innovative silviculture and vegetation management, proceedings of the 21st Tall Timbers fire ecology conference. 14-16 April 1998, Tallahassee, Florida, USA.
Latta, M. J., C. J. Beardmore, and T. E. Corman. 1999. Arizona Partners in Flight bird conservation plan. Version 1.0. Arizona Game and Fish Department Technical Report 142, Phoenix, Arizona, USA.
Lawrence, G. E. 1966. Ecology of vertebrate animals in relation to chaparral fire in the Sierra Nevada Foothills. Ecology 47:278-291.
Leonard, J. P. 1998. Nesting and foraging ecology of band-tailed pigeons in western Oregon. Dissertation, Oregon State University, Corvallis, Oregon, USA.
MacGregor, W. G., and W. M. Smith. 1955. Nesting and reproduction of the band-tailed pigeon in California. California Fish and Game 41:315-326.
Marshall, J. T. 1957. Birds of the pine-oak woodland in southern Arizona and adjacent Mexico. Pacific Coast Avifauna 32. Cooper Ornithological Society, Berkeley, California, USA.
Martin, T. E. 1998. Are microhabitat preferences of coexisting species under selection and adaptive? Ecology 79:656-670.
Martin, T. E. 2001. Abiotic vs. biotic influences on habitat selection of coexisting species: climate change impacts? Ecology 82:175-188.
Martin, T. E., and G. R. Geupel. 1993. Nest-monitoring plots: methods for locating nests and monitoring success. Journal of Field Ornithology 64:507-519.
Mayfield, H. 1961. Nesting success calculated from exposure. Wilson Bulletin 73:255-261.
Morrison, M. L., B. G. Marcot, and R. W. Mannan. 1998. Wildlife-habitat relationships: concepts & applications. Second edition. University of Wisconsin Press, Madison, Wisconsin, USA.
National Audubon Society. 2002. Audubon Watchlist. <http://www.audubon.org/bird/watchlist/index.html> Accessed 9 May 2006.
Neff, J. A. 1947. Habits, food, and economic status of the band-tailed pigeon. U.S. Fish and Wildlife Service North American Fauna No. 58, Washington, D.C., USA.

39
Nellis, D. W., R. A. Dewey, M. A. Hewitt, S. Imsand, R. Philibosian, and J. A. Yntema. 1984. Population status of Zenaida doves and other Columbids in the Virgin Islands. Journal of Wildlife Management 48:889-894.
Newsome, A., E. J. McIlroy, and P. Catling. 1975. The effects of an extensive wildfire on populations of twenty ground vertebrates in south-east Australia. Proceedings of the Ecological Society of Australia 9:107-123.
Pacific Flyway Study Committee and Central Flyway Webless Migratory Game Bird Technical Committee. 2001. Pacific and central flyways management plan for the Four Corners populations of band-tailed pigeons. Pacific Flyway Council, U.S. Fish and Wildlife Service, Portland, Oregon, USA.
Peeters, H. J. 1962. Nuptial behavior of the band-tailed pigeon in the San Francisco Bay Area. Condor 64:445-470.
Pidgeon, A. M., V. C. Radeloff, and N. E. Mathews. 2003. Landscape-scale patterns of black-throated sparrow (Amphispiza bilineata) abundance and nest success. Ecological Applications 13:530-542.
Rivera-Milan, F. F. 1996. Nest density and success of Columbids in Puerto Rico. Condor 98:100-113.
Sanders, T. A. 1999. Habitat availability, dietary mineral supplement, and measuring abundance of band-tailed pigeons in western Oregon. Dissertation, Oregon State University, Corvallis, Oregon, USA.
Sara, M., and M. Di Vittorio. 2003. Factors influencing the distribution, abundance and nest-site selection of an endangered Egyptian vulture (Neophron percnopterus) population in Sicily. Animal Conservation 6:317-328.
Sauer, J. R., J. E. Hines, and J. Fallon. 2005. The North American breeding bird survey, results and analysis 1966-2005. Version 6.2.2006. U.S.G.S. Patuxent Wildlife Research Center, Laurel, Maryland. <http://www.mbrpwrc.usgs.gov/bbs/bbs.html> Accessed 17 Nov 2006.
Smith, W. A. 1968. The band-tailed pigeon in California. California Fish and Game 54:4-16.
Wildfire Alternatives (WALTER). 2001. WALTER Santa Catalina and Rincon Mountain complex study area page. <http://walter.arizona.edu/overview/study_areas/catalina.asp>. Accessed 17 Nov 2006.

40
Warshall, P. 1995. The Madrean Sky Island Archipelago: a planetary overview. Pages 6-18 in L. F. DeBano, P. F. Ffolliott, A. Ortega-Rubio, G. J. Gottfried, R. H. Hamre, and C. B. Edminster, editors. Biodiversity and management of the Madrean Archipelago: The sky islands of southwestern United States and northwestern Mexico. U.S. Forest Service General Technical Report RM-GTR-264.
Westmoreland, D., and L. B. Best. 1985. Effects of researcher disturbance on mourning dove nesting success. Auk 102:774-780.
Wiley, J. W., and B. N. Wiley. 1979. The biology of the white-crowned pigeon. Wildlife Monographs No. 64.
41
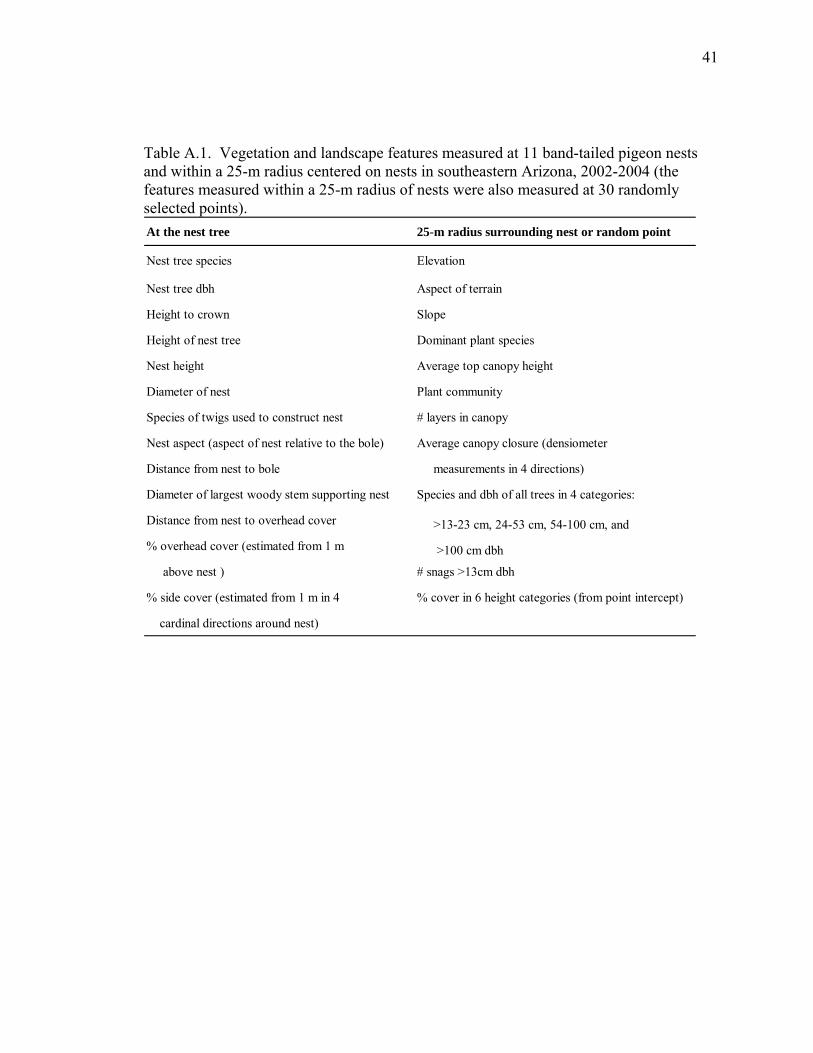
Table A.1. Vegetation and landscape features measured at 11 band-tailed pigeon nests and within a 25-m radius centered on nests in southeastern Arizona, 2002-2004 (the features measured within a 25-m radius of nests were also measured at 30 randomly selected points). At the nest tree 25-m radius surrounding nest or random point
Nest tree species Elevation
Nest tree dbh Aspect of terrain
Height to crown Slope
Height of nest tree Dominant plant species
Nest height Average top canopy height
Diameter of nest Plant community
Species of twigs used to construct nest # layers in canopy
Nest aspect (aspect of nest relative to the bole) Average canopy closure (densiometer
Distance from nest to bole measurements in 4 directions)
Diameter of largest woody stem supporting nest Species and dbh of all trees in 4 categories:
Distance from nest to overhead cover >13-23 cm, 24-53 cm, 54-100 cm, and
% overhead cover (estimated from 1 m >100 cm dbh
above nest ) # snags >13cm dbh
% side cover (estimated from 1 m in 4 % cover in 6 height categories (from point intercept)
cardinal directions around nest)

42
Table A.2. Nest-site characteristics at band-tailed pigeon nests (n = 11) in southeastern Arizona, 2002-2004.
Characteristic
Nest tree dbh (cm) 64.5 ± 11.4
Height to crown (m) 8.9 ± 2.3
Nest tree height (m) 22.9 ± 3.3
Nest height (m) 14.1 ± 2.3
Distance from nest to bole (m) 1.6 ± 0.4
Diameter of largest woody stem supporting nest (cm) 4.8 ± 0.4
Distance from nest to overhead cover (m) 0.5 ± 0.1
Overhead cover (%) 49.3 ± 12.2
Average side cover (%) 54.6 ± 9.4
mean ± SE
.
43
Table A.3. Landscape and vegetation features of band-tailed pigeon nest sites and randomly selected points within a 25-m radius of nests or randomly selected points. Characteristic t PElevation (m) 2441.8 ± 114.3 2228.6 ± 73.3 -1.5 0.135Top canopy height (m) 25.8 ± 3.3 25.2 ± 2.0 -0.3 0.757
Average canopy closure (%) 83.3 ± 3.4 63.5 ± 5.8 -2.9 0.005Slope (°) 25.9 ± 1.8 16.7 ± 1.1 -3.7 0.003Trees >13 cm dbh 61.0 ± 13.3 42.6 ± 4.3 -1.3 0.213Trees and snags >13 cm dbh 75.5 ± 16.2 46.8 ± 4.7 -2.3 0.026Snags >13 cm dbh 14.5 ± 4.7 4.2 ± 0.8 -2.1 0.057Trees 13-23 cm dbh 29.3 ± 10.3 20.8 ± 2.7 -1.1 0.269Trees 24-53 cm dbh 21.6 ± 4.1 19.5 ± 2.2 -0.5 0.630Trees 54-100 cm dbh 8.7 ± 2.6 2.2 ± 0.5 -2.4 0.034Trees >100 cm dbh 1.4 ± 0.5 0.1 ± 0.1 -2.6 0.028Average dbh for plot (cm) 39.8 ± 3.2 26.3 ± 1.9 -2.4 0.037Number of layers in canopy 2.1 ± 0.2 2.5 ± 0.1 1.6 0.129Percent cover†:
Basal bare ground 10.5 ± 4.4 5.8 ± 1.3 -1.4 0.176Basal litter 70.0 ± 3.6 78.3 ± 2.4 1.8 0.074Basal rock 12.3 ± 4.5 8.0 ± 1.7 -1.1 0.279Basal log 1.4 ± 1.0 1.2 ± 0.4 0.0 0.823Basal small woody debris 20.0 ± 4.3 28.8 ± 4.4 1.1 0.265Brush 0-0.5 m 1.4 ± 1.0 1.2 ± 0.6 -0.2 0.869Fern 0-0.5 m 2.7 ± 1.6 5.5 ± 1.3 1.2 0.246Forb 0-0.5 m 25.5 ± 6.2 14.3 ± 2.4 -1.7 0.116PSEMEN 0-0.5 m 1.8 ± 1.0 0.0 ± 0.0 -1.8 0.104SYPSPP 0-0.5 m 2.7 ± 1.6 0.7 ± 0.3 -1.3 0.223Total 0-0.5 m 68.2 ± 7.1 47.8 ± 5.6 -2.0 0.053ABICON 0.5-2 m 2.7 ± 1.0 5.8 ± 1.6 1.6 0.113Grass 0.5-2 m 1.4 ± 0.7 0.3 ± 0.3 -1.5 0.146QUEEMO 0.5-2 m 0.0 ± 0.0 0.7 ± 0.5 0.8 0.447QUEGAM 0.5-2 m 0.0 ± 0.0 0.7 ± 0.7 0.6 0.552SYMSPP 0.5-2 m 4.1 ± 2.8 0.2 ± 0.2 -1.4 0.187Total 0.5-2 m 22.3 ± 5.7 19.3 ± 2.2 -0.5 0.641ABICON 2-5 m 6.8 ± 2.4 10.3 ± 2.8 0.7 0.472PINPON 2-5 m 4.1 ± 3.6 5.0 ± 1.8 0.2 0.807PINSTR 2-5 m 3.6 ± 1.5 3.8 ± 0.9 0.1 0.912PSEMEN 2-5 m 4.5 ± 1.7 11.0 ± 2.5 2.1 0.039QUEHYP 2-5 m 2.3 ± 1.0 0.2 ± 0.2 -2.0 0.071Snags 2-5 m 5.0 ± 3.4 2.3 ± 0.7 -0.8 0.454Total 2-5 m 36.4 ± 6.6 44.3 ± 3.7 1.1 0.278ABICON 5-10 m 8.2 ± 3.0 10.7 ± 2.8 0.5 0.626PINSTR 5-10 m 2.3 ± 1.2 7.8 ± 1.8 1.8 0.073PINPON 5-10 m 3.6 ± 2.7 12.5 ± 2.7 1.8 0.073PSEMEN 5-10 m 9.5 ± 3.3 14.0 ± 2.9 0.8 0.401Snags 5-10 m 4.1 ± 2.8 2.5 ± 0.6 -0.6 0.586Total 5-10 m 39.5 ± 4.9 47.3 ± 4.6 0.9 0.348ABICON >10 m 10.0 ± 4.2 7.2 ± 2.1 -0.7 0.515PINPON >10 m 5.5 ± 3.1 12.5 ± 2.8 1.4 0.171PINSTR >10 m 3.6 ± 3.2 4.3 ± 1.4 0.2 0.816PSEMEN >10 m 21.8 ± 8.3 10.8 ± 2.3 -1.3 0.230Snags >10 m 1.8 ± 1.2 1.7 ± 0.5 -0.1 0.891Total >10 m 51.4 ± 6.1 35.5 ± 4.3 -2.0 0.056
†Species codes: PSEMEN = Douglas fir (Pseudotsuga menzeiesii ), ABICON = white fir (Abies concolor ); PINSTR = southwestern white pine (Pinus strobiformis ); PINPON = ponderosa pine (Pinus ponderosa ); QUEEMO = Emory oak (Quercus emoryi ); QUEGAM = Gambel oak (Quercus gambelii ); QUEHYP = silverleaf oak (Quercus hypoleucoides ); Symspp = snowberry (Symphoricarpus spp. ); Total = all species pooled.
Mean ± SENest (n = 11) Random (n = 30)
Mean ± SE

44
Table A.4. Logistic regression models for band-tailed pigeon nest sites vs. random sites in southeastern Arizona, 2002-2004. The model estimates are for the likelihood of nest sites vs. random sites. The full model for nest sites vs. random sites was significant (log-likelihood = 2.1, G2 = 43.6, P < 0.0001).
Explanatory variable β ± SE G 2 P
Intercept 3.8 ± 1.1
# trees 54-100 cm dbh -0.4 ± 0.2 17.2 < 0.0001
Silverleaf oak cover 2-5 m -0.9 ± 0.3 14.5 0.0001

45
APPENDIX B
DOES RISK OF NEST PREDATION INFLUENCE NEST-SITE SELECTION IN
BAND-TAILED PIGEONS?
Abstract
Band-tailed pigeons have declined throughout their breeding range.
Understanding the factors that influence nest-site selection is important for effective
management efforts. We examined the hypothesis that band-tailed pigeons in Arizona
nest more frequently in coniferous forests because the risk of nest predation is lower
relative to oak woodlands. We tested two predictions of this hypothesis. We tested the
prediction that mixed-conifer forests have a lower risk of nest predation compared to oak
woodlands. We used artificial nests baited with quail eggs to compare the relative risk of
nest predation between mixed-conifer forest and oak woodlands. We compared the
artificial nest results with results from natural band-tailed pigeon nests to determine if the
pattern in risk of nest predation observed with artificial nests was similar to the pattern
observed with natural nests. We also tested the prediction that the relative abundance of
avian and mammalian nest predators was lower in mixed-conifer forests compared to oak
woodlands. We used point-count surveys to compare the relative abundance of avian and
mammalian nest predators between the 2 plant communities. We also tested the
alternative prey hypothesis. We estimated the relative abundance of main food sources
(conifer cones, acorns) available to common nest predators to determine if the abundance
of these main food sources influences the probability of nest predation within mixed-
conifer forest and oak woodlands. In support of the nest predation hypothesis, both the

46
risk of nest predation (P = 0.0002) and predator abundance (P = 0.039) were lower in
coniferous forests than in oak woodlands. Results of the artificial nest experiment were
comparable to results from natural nests (interaction between nest type and plant
community, P = 0.829). We did not find a relationship between the abundance of main
food sources for potential nest predators and the risk of nest predation (P = 0.156). Our
results suggest that the risk of nest predation likely influences habitat selection in band-
tailed pigeons.

47
Introduction
Habitat preferences are presumably adaptive (Jones and Robertson 2001) because
selecting an appropriate breeding site can provide an individual with the resources
necessary for successful reproduction (Martin 1998). Habitat selection has likely
evolved, in part, as a result of differential reproductive success in different environments
(Clark and Shutler 1999). When choosing where to breed, birds seem to make a series of
choices at several spatial scales (Hilden 1965, Hutto 1985, Orians and Wittenberger
1991). Although birds likely use proximate cues to make these choices, ecological
processes such as competition for nest sites and food (Nilsson 1984), predation (Martin
1993a), and climate (Martin 2001) can ultimately explain these selective choices. Some
birds, such as crossbills (Loxia spp.), choose where to breed based on variation in food
abundance at regional scales (Benkman 1987). For other birds, such as band-tailed
pigeons (Patagioenas fasciata), the ecological processes responsible for habitat
preferences (and the spatial scales on which they operate) remain unknown.
The band-tailed pigeon is a good species for examining habitat selection at large
spatial scales because individuals: 1) are apparently willing to travel >100 km between
foraging and nesting sites (Keppie and Braun 2000, Kirkpatrick et al. 2005), and 2) do
not defend territories like many other montane forest birds. Moreover, the band-tailed
pigeon has been identified as a species of conservation concern at both the state (Altman
1999, Latta et al. 1999, Colorado Partners in Flight 2000, New Mexico Partners in Flight
2001) and national level (Rich et al. 2004, U.S.F.W.S. 2005, National Audubon Society
2002). Band-tailed pigeons are migratory game birds whose populations have declined
48
1.8% annually throughout North America and 5.1% annually in the southwestern U.S.
since 1966 (Sauer et al. 2005). A >84% decline is reported for 1 mountain range in
Arizona (Kirkpatrick et al. 2005). Throughout their range, band-tailed pigeons usually
place their nests in firs or pines (MacGregor and Smith 1955, Peeters 1962, Leonard
1998, Hughes et al., in review) within forested areas dominated by conifers (Leonard
1998, Hughes et al., in review). They also nest and forage in oak woodlands in Arizona
(Neff 1947), but less frequently. One hypothesis that might explain why band-tailed
pigeons prefer to nest in coniferous forests compared to other plant communities is to
avoid areas with high risk of nest predation.
Nest predation is a pervasive selective pressure thought to influence avian
distribution and breeding habitat selection in birds (Nilsson 1984, Martin 1993a, Sieving
and Wilson 1998). For example, nest predation accounts for up to 80% of nest failures
across a wide range of bird species within all major plant communities (Ricklefs 1969,
Martin 1993a, Sieving and Wilson 1998). Probability of nest predation can be affected
by nest height and nesting substrate (Ricklefs 1969, Nilsson 1984, Martin 1993a,
Borgmann and Rodewald 2004), plant composition and cover (Martin 1993b), forest
patch size (Andren and Angelstam 1988, Hoover et al. 1995, Keyser et al. 1998), and
aspect of the surrounding landscape (Rauter et al. 2002). Despite recognition of nest
predation as an important selective pressure, relatively few empirical studies have
examined how nest predation varies among different plant communities within a region
(but see Martin 1993a, Sietz and Zegers 1993, Bayne et al. 1997, Sieving and Willson
1998, Pidgeon et al. 2003) and the mechanisms responsible for such variation.

49
One step in evaluating whether the risk of nest predation potentially influences a
bird’s decision regarding where to breed is documenting the influence of nest placement
on the probability of nest predation. To test the hypothesis that band-tailed pigeons are
nesting more frequently in areas where they can reduce the risk of nest predation, we
predicted that mixed-conifer forests (where band-tailed pigeons usually nest) would have
a lower risk of nest predation compared to other plant communities in which they forage
(e.g. oak woodlands). We used artificial nests baited with quail eggs to compare the
relative risk of nest predation between mixed-conifer forest and oak woodlands in
southeastern Arizona. We compared the artificial nest results with results from natural
band-tailed pigeon nests to determine if the pattern in risk of nest predation observed with
artificial nests was similar to the pattern observed with natural nests. We also tested a
second prediction of the predation-risk hypothesis. We predicted that the relative
abundance of avian and mammalian nest predators would be lower in coniferous forests
compared to oak woodlands. We conducted point-count surveys to compare the relative
abundance of avian and mammalian nest predators between plant communities.
We were also interested in why the risk of nest predation might differ between
plant communities. Some studies have suggested that variation in predation risk is
related to variation in the abundance of main food sources available to nest predators (the
alternative prey hypothesis; Lack 1954, Anglestam et al. 1984). In particular, variation in
the abundance of acorns and conifer seeds have been implicated in affecting the
probability of nest predation because these are the main food sources for common nest
predators in forested systems but their availability varies annually (Martin and Joron
50
2003, Nour et al. 1993, Ostfeld et al. 1996). However, the relationship between food
abundance for potential nest predators (in the form of conifer seeds and acorns) and nest
predation has rarely been tested (McShea 2000). We tested a prediction of the alternative
prey hypothesis: that cone and acorn abundance would be negatively related to the risk of
nest predation in mixed-conifer forest and oak woodlands.
This study has important implications for the effective management of band-tailed
pigeons within coniferous forests of the western U.S. Identifying the proximate and
ultimate factors that influence nest placement in band-tailed pigeons will help develop
management plans to maximize reproductive success and reverse population declines.
This information can also help identify natural and anthropogenic events that have caused
habitat degredation (Caughly 1994, Paine et al. 1996, Koko and Sutherland 2001) for
band-tailed pigeons. Additionally, comparing the probability of nest predation among
plant communities may help explain patterns of nest-site selection in other canopy-
nesting species within montane woodlands of the southwestern U.S.

51
Methods and Materials
We conducted this study within the Santa Catalina (Pima County), Pinaleno
(Graham County), Huachuca, and Chiricahua (both in Cochise County) Mountain Ranges
in the Coronado National Forest, Arizona in 2003 and 2004. These are typical Sky Island
mountain ranges; high-elevation mountain ranges that are separated from one another by
low-elevation desert basins (Warshall 1995). The 4 mountain ranges have rugged terrain
and elevations range from 900 to 3000 m with desert scrub and encinal oak woodlands at
lower elevations, oak-pinyon-juniper (Quercus spp.-Pinus spp.-Juniperus spp.) and pine-
oak woodlands at mid-elevations, and ponderosa pine (Pinus ponderosa) and mixed-
conifer forest at higher elevations (Marshall 1957, Warshall 1995). Temperatures vary
between 4 – 38°C with 30 cm of precipitation annually at lower elevations, and between
-6 – 24°C with 69 cm of precipitation annually at higher elevations (WALTER 2001).
Most precipitation falls during 2 distinct time periods: brief but heavy summer monsoon
rains and light winter rains.
Potential mammalian nest predators include red squirrels (Tamiasciurus
hudsonicus grahamensis), Abert’s squirrels (Sciurus aberti), Arizona gray squirrels
(Sciurus arizonicus), Chiricahuan fox squirrels (Sciurus nayaritensis chiricahuae), coatis
(Nasua nasua), and ringtails (Bassariscus astutus). Potential avian nest predators include
Steller’s jays (Cyanocitta stelleri), Mexican jays (Aphelocoma ultramarine), house wrens
(Troglodytes aedon), Bewick’s wrens (Thryomanes bewickii), and common ravens
(Corvus corax).
52
Artificial Nest Experiment
We placed artificial nests in each of two plant communities (mixed-conifer forest
and oak woodland) within 4 mountain ranges over a two-year period. Artificial nests
have been used in many studies to examine relative predation risk (Martin 1987, Yahner
and Cypher 1987, Sieving and Willson 1998, Berry 2002, Borgmann and Rodewald
2004) and researchers using both natural and artificial nests have shown that the risk of
nest predation often differs between plant communities (Janzen 1978, Picman 1988,
Sieving and Willson 1998) and among nesting substrates (ground, shrub, canopy; Martin
1993a). However, studies using artificial nests are criticized for not accurately measuring
the true risk of predation because they lack important parental behaviors such as nest
defense and egg concealment by brooding parents. Additionally, predators of artificial
nests have differed from those of natural nests in some studies (Willebrand and
Marcstrom 1988, Thompson and Burhans 2003) which may lead to erroneous patterns of
predation risk that do not reflect patterns of predation risk on natural nests. Nevertheless,
the daily predation risk of artificial nests was similar to that of natural nests in some
studies (Thompson and Burhans 2003), and spatial patterns of predation risk was similar
for natural and artificial nests in other studies (Moore and Robinson 2004). The
experimental value provided by artificial nests may outweigh the drawbacks as long as
their validity as surrogates for natural nests is evaluated (Major and Kendal 1996).
We used cluster sampling to compare nesting success between mixed-conifer and
oak woodlands. We used ArcView 3.3 to generate random points within these 2 plant
communities with the constraints that points were: 1) 100 – 1000 m from a passable road

53
(i.e., no jeep trails), 2) on slopes <45°, 3) ≥400 m apart, and 4) within one of the
following Arizona GAPVEG forest types: Englemann spruce (Picea engelmannii)-mixed
conifer, ponderosa pine-mixed conifer, Douglas fir (Pseudotsuga menziesii)-mixed
conifer (madrean), Douglas fir-mixed conifer (Rocky Mountain), encinal oak (madrean
evergreen forest). An apriori power analysis for a comparison of proportions revealed
that a sample size of 408 nests per plant community was sufficient to detect a 10%
difference between plant communities (alpha = 0.05, beta = 0.20). We placed 3-6 ( x =
5.8) artificial nests near each random point (hereafter referred to as nest cluster) and used
a different random point for each nest cluster (Table B.1). We placed and checked
artificial nests during 3 discrete time periods occurring within the band-tailed pigeon
breeding season placing nest clusters. We only placed artificial nests during the mid-
season nesting period in 2003 (8 July - 16 August) and placed artificial nests during all 3
nesting periods in 2004 (23 May - 26 June 2004, 30 June - 4 August 2004, 9 August - 11
September 2004).
We constructed artificial nests that simulated band-tailed pigeon nests by gluing
together Douglas fir and white fir (Abies concolor) twigs (10 to 150 twigs per nest;
Keppie and Braun 2000) and fastened the nests to branches with fishing line. We dusted
the nests with fine soil to eliminate glue shine. Because band-tailed pigeon nests in
Arizona have been found 100 m apart (Kirkpatrick et al. 2005), we spaced nests within a
cluster 100 m apart in locations with the most cover (Figure B.1). Band-tailed pigeons
place their nests 2 – 36 m above the ground (Leonard 1998). Therefore, we used a ladder
to position artificial nests between 2 – 11 m above the ground. Band-tailed pigeons have

54
a clutch size of 1, so we used 1 fresh bobwhite quail (Colinus virginianus) egg per
artificial nest. Band-tailed pigeon eggs are 40 mm in length and bobwhite quail eggs are
25% smaller (30 mm in length; Ehrlich et al. 1988). We marked nests with flagging an
average of 6.0 m (95% C.I. = 5.6 - 6.4 m) from each nest.
We measured characteristics surrounding each artificial nest including elevation,
nest height, nest tree dbh, and percent nest concealment. Nest concealment was
calculated as the average of 6 visual estimates: percent cover at 1 m in 4 cardinal
directions, and percent cover from 1 m above and below the nest (Martin et al. 1997).
Although we attempted to make average-sized band-tailed pigeon nests (24 x 29 cm; K.
Hughes, unpublished data), nest sizes varied slightly, so we also recorded relative sizes
(small = 1, medium = 2, large = 3) for each artificial nest.
We checked nest status 19 days (range = 17 – 22) after placement (the average
incubation period of band-tailed pigeons is 19 days; Braun 1994). We considered nests
depredated when: 1) no egg was found in the nest or on the ground within 10 m of the
nest, 2) eggs found on the ground showed signs of predation (e.g., puncture marks), or 3)
eggs found in the nest showed signs of predation.
Nest Predator Abundance and Distribution
We estimated the relative abundance of avian and mammalian nest predators by
conducting 10-minute point-count surveys at 2 locations spaced 200 m apart within each
nest cluster both at the beginning and the end of the artificial nest experiment (Figure
B.1). On each survey, we recorded the number of four potential mammalian nest
predators seen or heard: red squirrels, Abert’s squirrels, Arizona gray squirrels, and

55
Chiricahuan fox squirrels. In addition to recording all mammals heard or seen during
point-count surveys, we systematically recorded all visual observations and sign of
squirrels and coatis while placing and checking artificial nests. We also recorded the
number of four potential avian nest predators seen or heard: Steller’s jays, Mexican jays,
house wrens, and Bewick’s wrens.
Cone and Acorn Abundance
In 2004, we used methods similar to Brotons and Herrando (2003) to estimate the
relative abundance of conifer cones and acorns, the main food sources of potential nest
predators in this system (Hoffmeister 1986, Erhlich et al. 1988). Within each nest cluster,
we walked 2 100-m long, 10-m wide belt transects separated by 100 m (Figure B.1). We
used a 2-tiered approach to estimate relative abundance of cones or acorns and recorded
1) the proportion of branches on each tree that had cones or acorns present within 5
classes, and 2) the density of cones or acorns on these branches (light, medium, or heavy)
because the density of cones or acorns varied from branch to branch within a tree and
among trees. For each tree (oak ≥15 cm dbh; conifer ≥20 cm dbh), we recorded the dbh
and estimated the proportion of branches that had cones or acorns according to the
following classification scale: 0 = no cones or acorns present; 1 = <5% of branches
contain at least 1 cone or acorn; 2 = 6-25% of branches contain cones or acorns; 3 = 26-
50% of branches contain cones or acorns; 4 = 51-75% of branches contain cones or
acorns; 5 = >75% of branches contain cones or acorns (tier 1). We rated and recorded the
density (heaviness) of the acorn or cone crop on each tree on a load scale: 1 = light, 2 =
medium, or 3 = heavy (tier 2). Finally, we multiplied the class scale (tier 1) by the load
56
scale (tier 2) for each tree within the plot to obtain cone or acorn abundance for each tree.
We averaged the relative abundance of cones and acorns for all trees within each nest
cluster (for the 2 transects combined) for each of the 2 visits. We used the estimate of
relative abundance for cones and acorns within each nest cluster that was highest for the
2 visits as the index of cone and acorn abundance for that nest cluster. Both cones and
acorns were used in both plant communities because mixed-conifer forests contain oaks
in the understory, and encinal oak woodlands often contain pinyon pines.
Analyses
We used logistic regression and all artificial nests with known fate (n = 767 nests)
to evaluate whether 2 criticized features of artificial nests affected the risk of nest
predation: distance from flagging to each nest and nest size. We also investigated the
relationship between random placement of nest clusters and the probability of nest
predation because 13 of the 136 nest clusters were placed non-randomly for logistical
reasons.
We used double-observer trials in 2004 (Nichols et al. 2000, Conway and Simon
2003) to estimate detection probability for potential avian nest predators. Personnel
conducting point-count surveys in 2003 were more experienced and than those in 2004.
Therefore, we used results from the double-observer trials to adjust the 2004 observer
estimates for avian nest predator detection probability. We did not adjust the number of
mammals detected because we had too few mammal detections to calculate detection
probability and most mammals were detected visually while placing and checking nests.
We used the maximum number of avian (adjusted for detection probability) and

57
mammalian (unadjusted) nest predators detected within 150 m for the two visits
combined (4 point-count surveys) for an estimate of nest predator abundance. We used t-
tests with nest cluster as the sample unit to compare predator abundance for each group
of nest predators between the two plant communities.
We used t-tests, chi-square tests, and simple linear regression analyses to examine
the relationship between the response variable (depredated or intact) and each of 9
explanatory variables. We used all nests with known fate for t-tests and chi-square tests
(n = 767 nests). For linear regressions, we used the proportion of nests depredated per
nest cluster as the response variable (n = 136 nest clusters). We used logistic regression
for binomial counts with stepwise variable selection (P = 0.20 to enter, P = 0.10 to
remain) to select a model that best explained the probability of nest predation for all nests
with known fate. We modeled the response variable as the proportion of nests
depredated/the proportion of nests with known fate per nest cluster and accounted for 8
additional variables: year, nesting period, mountain range, plant community, and 5
characteristics measured at each artificial nest (the average elevation, nest tree dbh, nest
height, nest concealment, and nest size per nest cluster) along with all 2-way interactions.
We examined natural band-tailed pigeon nests in the Catalina Mountains (n = 10,
data collected from 2002-2004, Kirkpatrick et al. 2005) to determine if the probability of
predation differed between artificial nests (data from 2004 in Catalina Mountains) and
natural nests. We examined both nest fate through hatching (nest building and incubation
stages) and nest fate through fledging (building, incubation, and nestling stages). We
then examined whether differences in nest predation between plant communities within
58
the Catalina Mountains were consistent for both artificial and natural nests. We used
logistic regression with stepwise variable selection (P = 0.20 to enter, P = 0.10 to remain)
and nest fate through hatching as the response variable and plant community, nest type
(natural or artificial), nest tree dbh, nest height, and all 2-way interactions as possible
explanatory variables.
To determine if alternative food abundance influenced the probability of nest
predation within mixed-conifer and oak woodlands, we used data collected from the 4
mountain ranges in 2004 only (n = 109 nest clusters) because we only collected data for
cone and acorn abundance during 2004. We used logistic regression for binomial counts
with stepwise variable selection (P < 0.20 to enter, P < 0.10 to remain) to obtain a second
nest predation risk model for 2004 only. We modeled the response variable as the
proportion of nest depredated/the proportion of nests with known fate per nest cluster,
and included the following explanatory variables: nesting period, mountain range, plant
community, the 5 characteristics measured at each artificial nest, the of index cone and
acorn abundance, and all 2-way interactions. For statistical tests, we transformed
variables where appropriate to better meet assumptions of parametric tests. We used JMP
IN statistical analysis software for all analyses (SAS Institute, Inc. 2003). We report
untransformed means and odds with 95% confidence intervals in parentheses.
59
Results
We placed a total of 784 artificial nests (n = 157 in 2003, n = 627 in 2004; Table
B.1) in 136 nest clusters. We placed nests an average of 2.8 m (95% C.I. = 2.7 - 2.9 m)
off the ground in 18 different tree species with an average dbh of 22 cm (95% C.I. = 21 –
23 cm). Average nest concealment around nests was 31% (95% C.I.= 30 - 32%). We
were able to determine fate for 767 nests: 80% of all nests were depredated, 17%
remained intact, and 3% had unknown fate (nest or egg likely destroyed by weather).
The distance at which we placed flags from nests did not differ between
depredated and intact nests (Table B.2; t741 = -1.3, P = 0.196). Larger nests had a lower
risk of nest predation than smaller nests (Table B.2; t729 = 1.9, P = 0.057) so we included
nest size as a possible explanatory variable in the models for nest predation risk. The
probability of predation did not differ between randomly placed nest clusters and non-
randomly placed nest clusters (Table B.2; G2 = 1.2, P = 0.279), therefore we used all
nests with known fate in the analyses.
Nest Predation in Mixed-Conifer Forest and Oak Woodlands
The probability of nest predation differed among mountain ranges, plant
communities, elevation, nest tree dbh, and nest size, and was positively related to jay
abundance and total predator abundance (Table B.2). Logistic regression resulted in a
model for the risk of artificial nest predation containing the main effect plant community
and the following interactions: year and nest concealment, mountain range and dbh, and
mountain range and nest concealment (Table B.3; G2 = 84.2, P < 0.0001).
The odds of a nest being depredated for artificial nests placed in mixed-conifer
60
forest were 1.6 times (95% C.I. = 1.2, 2.0) lower than in oak woodlands (G2 = 13.6, P =
0.0002). The risk of nest predation was negatively related to nest concealment in 2003
and positively related to nest concealment in 2004 (Figure B.2). The relationship
between the risk of nest predation and nest concealment also differed among mountain
ranges (Figure B.3, G2 = 9.6, P = 0.002). A high risk of nest predation in the Chiricahuas
(x̄ = 0.91, 95% C.I. = 0.87 - 0.93) was associated with lower than average nest
concealment (x̄ = 29%, 95% C.I. = 27% - 31%), whereas in the Huachucas, a relatively
low risk of nest predation (x̄ =0.85, 95% C.I. = 0.79 - 0.91) was associated with higher
than average nest concealment (x̄ =34%, 95% C.I. = 30% - 38%).
The relationship between the risk of nest predation and nest tree dbh differed
among mountain ranges (Figure B.4; G2 = 3.4, P = 0.064). However, average nest tree
dbh did not differ among mountain ranges (ANOVA, F = 2.1, P = 0.100) and the odds of
artificial nest predation were 1.02 times (95% C.I. = 0.99 - 1.05) higher in the Chiricahua
and Huachuca Mountains compared to the Catalina and Pinaleno Mountains.
Artificial vs. Natural Band-Tailed Pigeon Nests
The risk of nest predation did not differ between natural and artificial nests when
we used the entire nesting cycle (nest building through nestling stages; G2 = 0.2, P =
0.660). Sixty seven percent of natural nests vs. 74% of artificial nests were depredated
during the entire nesting cycle. However, predation risk differed between natural and
artificial nests when we only used the nest building and incubation stages for
comparisons (G2 = 11.5, P = 0.0007). Twenty percent of natural nests vs. 74% of
artificial nests were depredated during the incubation stage. The odds that natural nests

61
were depredated were 0.21 times lower (95% C.I. = 0.07, 0.61) during the building and
incubation stages. However, the pattern in risk of nest predation in mixed-conifer forests
and oak woodlands did not differ between natural and artificial nests; the interaction
between nest type and plant community was not significant (Wald χ2 = 0.4, P = 0.829).
Abundance of Avian and Mammalian Nest Predators
Average detection probability for observers in 2004 was 0.34 (range 0.30 – 0.48).
We detected more predators overall (x̄ = 5.4, 95% C.I. = 4.7 - 6.2; t134 = -2.1, P = 0.039)
and more jays (x̄ = 4.3, 95% C.I. = 3.8 - 4.8; t134 = -3.9, P < 0.0001) in oak woodlands
than in mixed-conifer forests (all predators x̄ = 4.5, 95% C.I. = 3.9 - 5.1; jays x̄ = 2.9,
95% C.I. = 2.4 - 3.4). However, we detected more wrens in mixed-conifer forest (x̄ =
1.3, 95% C.I. = 1.0 - 1.5) than in oak woodlands (x̄ = 1.1, 95% C.I. = 0.8 - 1.4), although
this difference was not significant (t134 = 0.9, P = 0.361). Although we detected very few
mammals (n = 23) during point-count surveys and incidentally while checking artificial
nests, I detected more mammals in mixed-conifer forest (x̄ = 0.3, 95% C.I. = 0.2 - 0.5)
than in oak woodlands (x̄ = 0.0, 95% C.I. = -0.1 - 0.1; t134 = 3.9, P = 0.0002).
Cone and Acorn Abundance and the Probability of Nest Predation
The abundance of cones and acorns did not vary between plant communities (t107
= 1.2, P = 0.242) nor among mountain ranges (F3, 105 = 0.3, P = 0.807). Nest predation
risk for 2004 was very similar to that for both years combined. Plant community, and the
interactions between mountain range and nest concealment, nesting period and dbh, and
dbh and nest size influenced the risk of nest predation in 2004 (Table B.3; G2 = 65.6, P <
0.0001). The abundance of cones and acorns was not related to the risk of nest predation,

62
after accounting for these other variables (Figure 5; G2 = 2.0, P = 0.156).
63
Discussion
Few studies address ultimate causation underlying observed patterns in habitat
selection at the landscape level because habitat quality measurements (e.g., nesting
success) combined with population abundance data are typically lacking at this scale
(Pidgeon et al. 2003). Birds may first make decisions regarding where to breed at large
spatial scales (e.g., at the scale of the plant community) prior to making decisions
regarding nest placement at finer spatial scales (Kotliar and Wiens 1990). However, nest
placement at fine spatial scales is the focus of most habitat selection studies in birds.
Therefore, predation may influence nest-site selection on a landscape scale in addition to
influencing decisions at the scale of the nest (nest height, concealment, nest substrate;
Marini 1997, Martin and Joron 2003).
The risk of nest predation was lower in mixed-conifer forest than in oak
woodlands in southeastern Arizona. This pattern is the opposite of patterns observed in
coniferous forests and deciduous woodlands in more northern latitudes (Bayne et al.
1997, Seiving and Willson 1998). The difference may be in part due to the difference in
predator assemblages between southeastern Arizona and other regions. Nevertheless, my
results support the hypothesis that the risk of nest predation influences habitat selection in
band-tailed pigeons. The risk of nest predation was lower in plant communities where
band-tailed pigeons occur most frequently and are known to commonly nest (mixed-
conifer forest) than in plant communities where they have been known to forage (Neff
1947) but are detected and nest less frequently (Kirkpatrick et al. 2005).
The relationship between nest concealment and the risk of nest predation differed

64
between 2003 (negative relationship) and 2004 (positive relationship). The relationship
between nest concealment and the risk of nest predation also varied among mountain
ranges. Nest concealment has been shown to affect the risk of nest predation in some
studies (Nice 1937, Nolan 1978, Best and Stauffer 1980, Martin and Roper 1988) but not
others (Clark and Nudds 1991, Filliater et al. 1994, Willson and Gende 2000, Remes
2005a). Poorly concealed nests have a higher probability of being depredated by birds
than other nest predators (Clark and Nudds 1991, Remes 2005a). The realization that
nest concealment may stymie visually stimulated predators (i.e., birds; Yahner and
Wright 1985) but not systematic searchers and olfactory stimulated predators (e.g.,
mammals) has lead some authors to suggest that placing nests in highly concealed
locations is not always the best nest-placement strategy (Filliater et al. 1994).
Although we placed nests in locations with the most cover relative to other places
in close proximity, our nest placement choices were constrained by a lack of available
cover below 6 m within both mixed-conifer forest and oak woodlands due to their
physiognomy. Additionally, mixed-conifer forests in southeastern Arizona are mature
stands containing many large trees with high canopy cover and a sparse understory
(Brown 1994). Most oaks in Arizona’s woodlands are evergreen but can be drought
deciduous in the late spring; leaves are replaced with the onset of the monsoon in mid to
late summer (McClaren and McPherson 1999, K. Hughes, pers. observation). The
interval between leaf drop and replacement is extremely variable annually and sometimes
replacement begins before leaf drop is complete. The amount and onset of summer
monsoon rains (and hence leaf drop and replacement) can vary greatly among the
65
mountain ranges in the region. This variation could explain why nest concealment and
risk of nest predation differed between years and among mountain ranges. Additionally,
years of high mammal or corvid abundance may increase the risk of nest predation in this
system whether or not nests are well concealed if nests are placed in trees containing
cones or acorns for which these taxa are foraging. The relationship between the risk of
nest predation and nest tree dbh differed among mountain ranges but the differences were
small. Therefore, these relationships may not be biologically meaningful.
The risk of nest predation was influenced by whether or not a nest was natural or
artificial. Artificial nest studies have been criticized because they often do not provide
accurate estimates of predation risk in natural nests (Willebrand and Marcstrom 1988,
Reitsma et al. 1990, Burke et al. 2003, Whelan and Burhans 2003, Moore and Robinson
2004). Adult behavior may both provide cues to predators (Inglis 1977, Vickery et al.
1992, Conway and Martin 2000, Martin et al. 2000, Tewksbury et al. 2002) and deter
predation (Samelius and Alisauskas 2001, Remes 2005b, Andersson and Waldeck 2006).
Lower predation risk has been reported in nests with increased nest attendance (Inglis
1977, Samelius and Alisauskas 2001, Remes 2005b, Andersson and Waldeck 2006).
Band-tailed pigeons have nearly constant nest attendance with only 2 obvious periods of
parental activity (incubation switch between male and female in morning and afternoon)
during the incubation stage. The lack of nest attendance at artificial nests may facilitate
predation by some nest predators (i.e., wrens) that would otherwise not have access to
eggs if adults were defending the nest (Davison and Bollinger 2000). Additionally,
incubating birds may provide additional camouflage while on the nest (Burke et al.
66
2003), but few studies have adequately tested this hypothesis. Because band-tailed
pigeons sit extremely still while on nests and activity at the nest is limited, the lack of
concealment from a brooding adult at artificial nests and a high rate of nest attendance at
natural nests likely contributed to the difference in predation risk between natural and
artificial nests. Despite the difference in risk of nest predation between natural and
artificial nests in this study, the differences in predation risk between plant communities
was consistent for both natural and artificial nests.
Overall predator abundance was greater in oak woodlands than in mixed-conifer
forest. Both wrens and mammals tended to be relatively more abundant in mixed-conifer
forest than in oak woodlands. Although we lack evidence indicating that birds were the
main predators of artificial nests in this study, low overall nest concealment and high
relative abundance of jays in both oak woodlands and mixed-conifer forests is consistent
with this assumption (jays are visual predators; Yahner and Wright 1985). Even so, we
observed a squirrel attacking a natural band-tailed pigeon nest while an adult was
incubating (Kirkpatrick et al. 2005).
We found no relationship between cone and acorn abundance and nest predation
risk. The lack of relationship could be because: 1) our measures of cone and acorn
abundance were inaccurate, 2) cone and acorn abundance does not affect the risk of nest
predation in this system, 3) predation risk is affected by cone and acorn abundance the
previous year rather than the same year, or 4) cone and acorn abundance affect nest
predation via a numerical response. A study in the eastern United States found that acorn
crop in one year accurately predicted the risk of nest predation among artificial nests the

67
following year (McShea 2000). Higher numbers of granivorous mammals (including
squirrels) as a result of increased food abundance from the previous fall led to increased
predation risk the following summer.
Conclusion
The risk of artificial nest predation varied between oak woodlands and mixed-
conifer forest across four mountain ranges in southeastern Arizona. This pattern was
consistent for both artificial nests and natural band-tailed pigeon nests in the Santa
Catalina Mountains. These results suggest that nest predation may be an important factor
involved in habitat selection of band-tailed pigeons at a landscape level. Band-tailed
pigeons across their range are declining, and most band-tailed pigeon nests in Arizona
fail due to predation (Hughes et al., in review). Forest management practices such as
thinning, road building, and prescribed fire can increase the abundance of small mammals
(Kyle and Block 2000, Converse et al. 2006a, Converse et al. 2006b) and thereby
increase the risk of nest predation. Therefore, research is needed to determine how these
practices affect predation risk particularly in mixed-conifer forests and other areas that
normally have a lower relative risk of nest predation.
More research on the effects of variability in predation risk across the landscape is
needed to determine how nest placement and nest predation influence habitat selection at
the landscape scale. Artificial nests provide an easy way to test patterns of relative
predation risk across large spatial scales. Future research examining why the risk of nest
predation varies across the landscape in southeastern Arizona may expand our
understanding of distributional patterns of nesting birds.
68
Acknowledgments
R. W. Mannan and R. J. Steidl provided advice on study design and reviews of
earlier versions of this manuscript. K. Farley, B. Fogg, A. Francis, G. Gryniewicz, C.
Hannum, K. Hemmelgarn, J. Horst, D. Martinez, K. Moray, C. Murray, J. Murray, J.
Ramirez, D. Tilton, and N. Ventolini helped with nest construction, fieldwork, and data
entry. M. Reed helped extensively with GIS. T. Deecken, G. Gonzales, G. Helbing, L.
Jones, J. Magehee, B. Stolp, and J. Taiz assisted with permits and access to study areas.
B. Peterson and the University of Arizona Steward Observatory provided field housing in
the Santa Catalina Mountains. Funding was provided by the Webless Migratory Game
Bird Research Program, the Arizona Game and Fish Department Heritage Fund, the U.S.
Fish and Wildlife Service, the U.S.G.S. Arizona Cooperative Fish and Wildlife Research
Unit, the University of Arizona, Silliman Memorial Award, and T & E, Inc.
69
Literature Cited
Altman, B. 1999. Conservation strategy for landbirds in coniferous forests of western Oregon and Washington. Version 1.0. <http://www.orwapif.org/pdf/western_forest.pdf> Oregon-Washington Partners in Flight. Accessed 23 January 2007.
Andren, H., and P. Angelstam. 1988. Elevated predation rates as an edge effect in habitat islands: experimental evidence. Ecology 69:544-547.
Andersson, M., and P. Waldeck. 2006. Reproductive tactics under severe egg predation: an eider’s dilemma. Oecologia 148:350-355.
Anglestam, P., E. Lindstrom, and P. Widen. 1984. Role of predation in short-term population fluctuations of some birds and mammals in Fennoscandia. Oecologia 62:199-208.
Bayne, E. M., K. A. Hobson, and P. Fargey. 1997. Predation on artificial nests in relation to forest type: contrasting the use of quail and plasticine eggs. Ecography 20:233-239.
Benkman, C. W. 1987. Food profitability and the foraging ecology of crossbills. Ecological Monographs 57:251-267.
Berry, L. 2002. Predation rates of artificial nests in the edge and interior of a southern Victorian forest. Wildlife Research 29:341-345.
Best, L. B., and D. F. Stauffer. 1980. Factors affecting nesting success in riparian bird communities. Condor 82:149-158.
Braun, C. E. 1994. Band-tailed Pigeon. Pages 60-74 in T. C. Tacha and C. E. Braun, editors. Migratory shore and upland game bird management in North America. International Association of Fish and Wildlife Agencies, Washington, D. C., USA.
Brotons, L., and S. Herrando. 2003. Effect of increased food abundance near forest edges on flocking patterns of Coal Tit Parus ater winter groups in mountain coniferous forests. Bird Study 50:106-111.
Brown, D. E., editor. 1994. Biotic communities: southwestern United States and Northwestern Mexico. University of Utah Press, Salt Lake City, Utah, USA.

70
Burke, D. M., K. Elliot, L. Moore, W. Dunford, E. Nol, J. Philips, S. Holmes, and K. Freemark. 2003. Patterns of nest predation on artificial and natural nests in forests. Conservation Biology 18:381-388.
Caughley, G. 1994. Directions in conservation biology. Journal of Animal Ecology 63:215-244.
Clark, R. G., and D. Nudds. 1991. Habitat patch size and duck nesting success: the crucial experiments have not been performed. Wildlife Society Bulletin 19:534-543.
Clark, R. G., and T. D. Shutler. 1999. Avian habitat selection: pattern from process in nest-site use by ducks. Ecology 80:272-287.
Colorado Partners in Flight. 2000. Colorado land bird conservation plan. <http://www.rmbo.org/pif/bcp/phy62/ppine/btpi.htm> Accessed 23 January 2007.
Conway, C. J., and J. C. Simon. 2003. Comparison of detection probability associated with burrowing owl survey methods. Journal of Wildlife Management 67:501-511.
Conway, C. J., and T. E. Martin. 2000. Evolution of passerine incubation behavior: influence of food, temperature, and nest predation. Evolution 54: 227-242.
Converse, S. J., G. C. White, and W. M. Block. 2006a. Small mammal responses to thinning and wildfire in ponderosa pine-dominated forests of the southwestern United States. Journal of Wildlife Management 70:1711-1722.
Converse, S.J., W.M. Block, and G.C. White. 2006b. Small mammal population and habitat responses to forest thinning and prescribed fire. Forest Ecology and Management 228:263-273.
Davison, W. B., and E. Bollinger. 2000. Predation rates on real and artificial nests of grassland birds. Auk 117:147-153.
Ehrlich, P. R., D. S. Dobson, and D. Wheye. 1988. The birder’s handbook; a field guide to the natural history of North American birds. Simon and Shuster, Inc., New York, New York, USA.
Filliater, T. S., R. Breitwisch, and P. M. Nealen. 1994. Predation on northern cardinal nests: does choice of nest site matter? Condor 96:761-768.
Hildén, O. 1965. Habitat selection in birds: a review. Annales Zoologici Fennici 2:53-75.

71
Hoffmeister, D. F. 1986. Mammals of Arizona. The University of Arizona Press and the Arizona Game and Fish Department, Tucson, Arizona, USA.
Hoover, J. P., M. C. Brittingham, and L. J. Goodrich. 1995. Effects of forest patch size on nesting success of wood thrushes. Auk 112:146-155.
Hughes, K. M., C. J. Conway, and C. Kirkpatrick. In review. Nesting success and nest-site selection in band-tailed pigeons.
Hutto, R. L. 1985. Habitat selection by non-breeding, migratory land birds. Pages 455-476 in M. L. Cody, editor. Habitat selection in birds. Academic Press, New York, New York, USA.
Inglis, I. R. 1977. The breeding behavior of the pink-footed goose: behavioural correlates of nesting success. Animal Behaviour 25:747-764.
Janzen, D. H. 1978. Predation intensity on eggs on the ground in two Costa Rican Forests. American Midland Naturalist 100:467-470.
Jones, J., and R. J. Robertson. 2001. Territory and nest-site selection of cerulean warblers in eastern Ontario. Auk 118:727-735.
Keppie, D. M., and C. E. Braun. 2000. Band-tailed pigeons (Columba fasciata). The Birds of North America, Vol. 530. (A. Poole and F. Gill, eds.). The Academy of Natural Sciences, Washington, D.C., USA.
Keyser, A. J., G. E. Hill, and E. C. Soehren. 1998. Effects of forest fragment size, nest density, and proximity to edge on the risk of predation to ground-nesting passerine birds. Conservation Biology 12:986-994.
Kirkpatrick, C., C. J. Conway, K. Hughes, and J. C. deVos. 2005. An evaluation of survey methods for monitoring interior populations of band-tailed pigeons. U.S. Geological Survey Wildlife Report #2005-03, Arizona Cooperative Fish and Wildlife Research Unit, Tucson, Arizona, USA.
Koko, H., and W. J. Sutherland. 2001. Ecological traps in changing environments: ecological and evolutionary consequences of a behaviorally mediated Allee effect. Evolutionary Ecology Research 3:537-551.
Kotliar, N. B., and J. A. Wiens. 1990. Multiple scales of patchiness and patch structure: a hierarchical framework for the study of heterogeneity. Oikos 59:253-260.
Kyle, S. C. and W. M. Block. 2000. Effects of wildfire severity on small mammals in northern Arizona ponderosa pine forests. Pages 163-168 in Fire and forest ecology: innovative silviculture and vegetation management, proceedings of the
72
21st Tall Timbers fire ecology conference. 14-16 April 1998, Tallahassee, Florida, USA.
Lack, D. L. 1952. The natural regulation of animal numbers. Clarendon Press, Oxford, UK.
Latta, M. J., C. J. Beardmore, and T. E. Corman. 1999. Arizona Partners in Flight bird conservation plan. Version 1.0. Arizona Game and Fish Department Technical Report 142, Phoenix, Arizona, USA.
Leonard, J. P. 1998. Nesting and foraging ecology of band-tailed pigeons in western Oregon. Ph.D. dissertation. Oregon State University, Corvallis, Oregon, USA.
MacGregor, W. G., and W. M. Smith. 1955. Nesting production of the band-tailed pigeon in California. California Department of Fish and Game 41(4):315-326.
Major, R. E., and C. E. Kendal. 1996. The contribution of artificial nest experiments to understanding avian reproductive success: a review of methods and conclusions. Ibis 138:138-307.
Marshall, J. T. 1957. Birds of the pine-oak woodland in southern Arizona and adjacent Mexico. Pacific Coast Avifauna 32. 125 pp.
Marini, M. A. 1997. Predation-mediated bird nest diversity: an experimental test. Canadian Journal of Zoology 75:317-323.
Martin, J.-L., and M. Joron. 2003. Nest predation in forest birds: influence of predator type and predator’s habitat quality. Oikos 102:641-653.
Martin, T. E. 1987. Artificial nest experiments: effects of nest appearance and type of predator. Condor 89:925-928.
Martin, T. E., C. R. Paine, C. J. Conway, W. M. Hochachka, P. Allen, and W. Jenkins. 1997. BBIRD field protocol. Montana Cooperative Wildlife Research Unit, University of Montana, Missoula, Montana, USA.
Martin, T. E., and J. J. Roper. 1988. Nest predation and nest-site selection of a western population of the hermit thrush. Condor 90:51-57.
Martin, T. E. 1993a. Nest predation among vegetation layers and habitat types: revising the dogmas. American Naturalist 141:897-913.
Martin, T. E. 1993b. Nest predation and nest sites. Bioscience 43:523-532.
Martin, T. E. 1998. Are microhabitat preferences of coexisting species under selection and adaptive? Ecology 79:656-670.

73
Martin, T. E., J. Scott, and C. Menge. 2000. Nest predation increases with parental activity: separating nest site and parental activity effects. Proceedings of the Royal Society of London B 267:2287-2293.
Martin, T. E. 2001. Abiotic vs. biotic influences on habitat selection of coexisting species: climate change impacts? Ecology 82:175-188.
McClaren, M. P., and G. R. McPherson. 1999. Oak savanna in the American Southwest. Pages 275-287 in R. C. Anderson, J. S. Fralish, and J. M. Baskin, editors. Savannas, barrens, and rock outcrop plant communities of North America. Cambridge University Press, New York, New York, USA.
McShea, W. J. 2000. The influence of acorn crops on annual variation in rodent and bird populations. Ecology 81:228-238.
Moore, R. P., and W. D. Robinson. 2004. Artificial bird nests, external validity, and bias in ecological field studies. Ecology 85:1562-1567.
National Audubon Society. 2002. Audubon Watchlist. <http://www.audubon.org/bird/watchlist/index.html> Accessed 9 May 2006.
Neff, J. A. 1947. Habits, food, and economic status of the band-tailed pigeon. U. S. Fish and Wildlife Service, North American Fauna Number 58.
New Mexico Partners in Flight. 2001. Ponderosa Pine. <http://www.hawksaloft.org/pif/pp.htm> Accessed 23 January 2007.
Nice, M. M. 1937. Studies in the life history of the song sparrow. Volume 1. Transactions of the Linnaean Society. New York, New York, USA.
Nichols, J. D., J. E. Hines, J. R. Sauer, F. W. Fallon, and P. J. Hegland. 2000. A double-observer approach for estimating detection probability and abundance from point counts. Auk. 117:393-408.
Nilsson, S. G. 1984. The evolution of nest-site selection among hole-nesting birds: the importance of nest predation and competition. Ornis Scandinavica 15:167-175.
Nolan, V., Jr. 1963. Reproductive success of birds in a deciduous scrub habitat. Ecology 44:305-321.
Nolan, V., Jr. 1978. Ecology and behavior of the prairie warbler, Dendroica discolor. Ornithological Monographs 26:1-595.
Nour, N., E. Matthysen, and A. A. Dhondt. 1993. Artificial nest predation and habitat fragmentation: different trends in bird and mammal predators. Ecography 16:111-116.

74
Orians, G. H., and J. F. Wittenberger. 1991. Spatial and temporal scales in habitat selection. American Naturalist 137:S29-S49.
Ostfeld, R. S., C. G. Jones, and J. O. Wolff. 1996. Of mice and mast: ecological connections in eastern deciduous forests. BioScience 46:323-330.
Paine, L., D. J. Undersander, D. W. Sample, G. A. Bartelt, and T. A. Schatteman. 1996. Cattle trampling of simulated ground nests in rotationally grazed pastures. Journal of Range Management 49:294-300.
Picman, J. 1988. Experimental study of predation on eggs of ground-nesting birds: effects of habitat and nest distribution. Condor 90:124-131.
Pidgeon, A. M., V. C. Radeloff, and N. E. Mathews. 2003. Landscape-scale patterns of black-throated sparrow (Amphispiza bilineata) abundance and nest success. Ecological Applications 13:530-542.
Rauter, C. M., H.-U. Reyer, and K. Bollmann. 2002. Selection through predation, snowfall and microclimate on nest-site preferences in the water pipit Anthus spinoletta. Ibis 144:433-444.
Reitsma, L. R., R. T. Holmes, and T. W. Sherry. 1990. Effects of removal of red squirrels, Tamiasciurus hudsonicus, and eastern chipmunks, Tamias striatus, on nest predation in a northern hardwood forest: an artificial nest experiment. Oikos 57:375-380.
Remes, V. 2005a. Birds and rodents destroy different nests: a study of blackcap Sylvia atricapilla using the removal of nest concealment. Ibis 147:213-216.
Remes, V. 2005b. Nest concealment and parental behaviour interact in affecting survival in the blackcap (Sylvia atricapilla): an experimental evaluation of the parental compensation hypothesis. Behavioral Ecology and Sociobiology 58:326-333.
Rich, T. D., C. J. Beardmore, H. Berlanga, P. J. Blancher, M. S. W. Bradstreet, G. S. Butcher, D. W. Demarest, E. H. Dunn, W. C. Hunter, E. E. Iñigo-Elias, J. A. Kennedy, A. M. Martell, A. O. Panjabi, D. N. Pashley, K. V. Rosenberg, C. M. Rustay, J. S. Wendt, and T. C. Will. 2004. Partners in Flight North American Landbird Conservation Plan. Cornell Lab of Ornithology. Ithaca, NY, USA.
Ricklefs, R. E. 1969. An analysis of nesting mortality in birds. Smithsonian Contributions to Zoology 9:1-48.
Roos, S. 2002. Functional response, seasonal decline and landscape differences in nest predation risk. Oecologia 133:608-615.

75
Samelius, G., and R. T. Alisauskas. 2001. Deterring arctic fox predation: the role of parental nest attendance by lesser snow geese. Canadian Journal of Zoology 79:861-866.
SAS Institute, Inc. 2003. JMP IN statistical analysis software. Version 5.1. SAS Institute, Inc., Cary, North Carolina, USA.
Sauer, J. R., J. E. Hines, and J. Fallon. 2005. The North American breeding bird survey, results and analysis 1966-2005. Version 6.2.2006. U.S.G.S. Patuxant Wildlife Research Center, Laurel, Maryland. <http://www.mbr-pwrc.usgs.gov/bbs/bbs.html> Accessed 17 Nov 2006.
Seitz, L. C., and D. A. Zegers. 1993. An experimental study of nest predation in adjacent deciduous, coniferous and successional habitats. Condor 95:297-304.
Sieving, K. E., and M. F. Willson. 1998. Nest predation and avian species diversity in northwestern forest understory. Ecology 79:2391-2402.
Tewksbury, J. J., T. E. Martin., S. J. Hejl, M. J. Kuehn, and J. W. Jenkins. 2002. Parental care of a cowbird host: caught between the costs of egg-removal and nest predation. Proceedings of the Royal Society of London B 269:423-429.
Thompson, F. R., and D. E. Burhans. 2003. Differences in predators of artificial and real songbird nests: evidence of bias in artificial nest studies. Conservation Biology 18:373-380.
United States Fish and Wildlife Service (U.S.F.W.S.). 2005. The U.S. Fish and Wildlife Service’s focal species strategy for migratory birds: measuring success in bird conservation. U.S.F.W.S. Division of Migratory Bird Management, Arlington, VA, USA.
Vickery, P. D., M. L. Hunter, Jr., and J. V. Wells. 1992. Evidence of incidental nest predation and its affects on nests of threatened grassland birds. Oikos 63:281-288.
Warshall, P. 1995. The Madrean Sky Island Archipelago: a planetary overview. Pages 6-18 in L. F. DeBano, P., F. Ffolliott, A. Ortega-Rubio, G. J. Gottfried, R. H. Hamre, and C. B. Edminster, editors. Biodiversity and management of the Madrean Archipelago: The sky islands of southwestern United States and northwestern Mexico. U.S. Forest Service General Technical Report RM-GTR 264.
Wildfire Alternatives (WALTER). 2001. WALTER Santa Catalina and Rincon Mountain complex study area page.

76
<http://walter.arizona.edu/overview/study_areas/catalina.asp>. Accessed 17 Nov 2006.
Willebrand, T., and V. Marcstrom. 1988. On the danger of using dummy nests to study predation. Auk 105:378-379.
Willson, M. F., and S. M. Gende. 2000. Nesting success of forest birds in southeast Alaska and adjacent Canada. Condor 102:314-324.
Yahner, R. H., and A. L. Wright. 1985. Depredation of artificial ground nests: effects of edge and plot age. Journal of Wildlife Management 49:508-513.
Yahner, R. H., and B. L. Cypher. 1987. Effects of nest location on depredation of artificial arboreal nests. Journal of Wildlife Management 51:178-181.

77
Table B.1. Number of artificial nests placed within each of 4 mountain ranges and 2 plant communities in southeastern Arizona during 2003 and 2004.
Mountain Range Oak Woodlands
Mixed-Conifer Forest
Total per Mountain Range
Catalinas 23 139 162Chiricahuas 123 118 241Huachucas 145 57 202Pinalenos 78 101 179Total 369 415 784
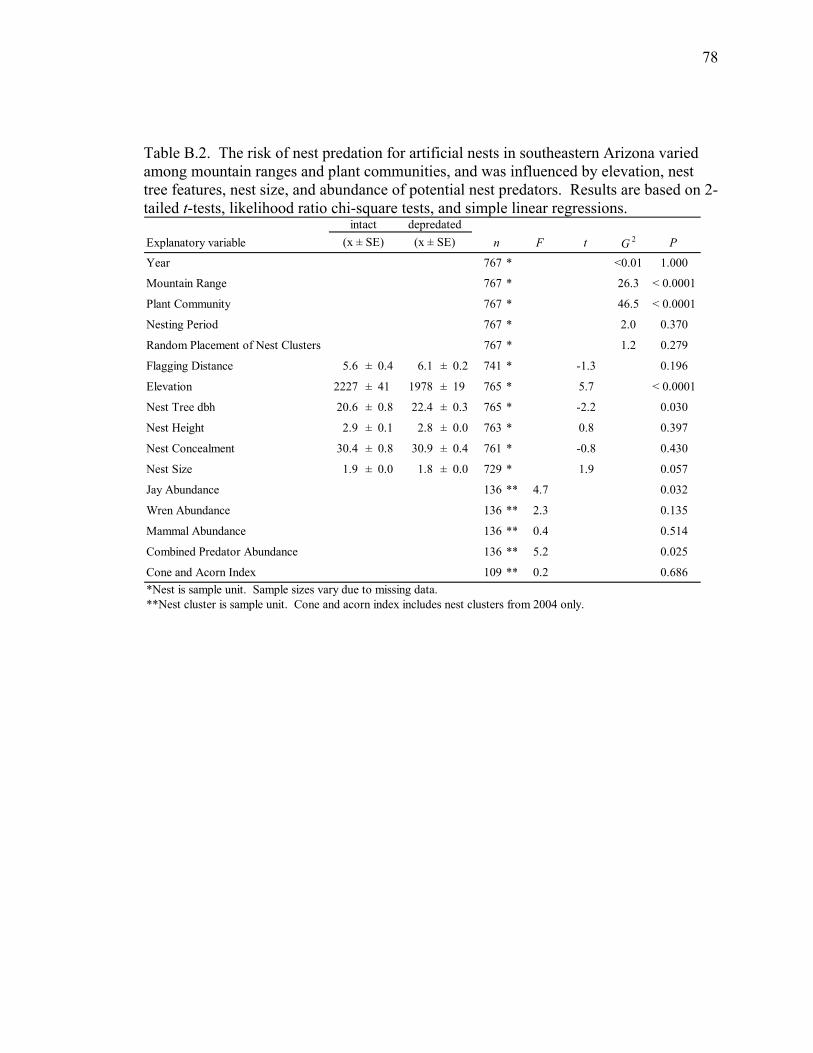
78
Table B.2. The risk of nest predation for artificial nests in southeastern Arizona varied among mountain ranges and plant communities, and was influenced by elevation, nest tree features, nest size, and abundance of potential nest predators. Results are based on 2-tailed t-tests, likelihood ratio chi-square tests, and simple linear regressions.
Explanatory variable n F t G 2 P
Year 767 * <0.01 1.000
Mountain Range 767 * 26.3 < 0.0001
Plant Community 767 * 46.5 < 0.0001
Nesting Period 767 * 2.0 0.370
Random Placement of Nest Clusters 767 * 1.2 0.279
Flagging Distance 5.6 ± 0.4 6.1 ± 0.2 741 * -1.3 0.196
Elevation 2227 ± 41 1978 ± 19 765 * 5.7 < 0.0001
Nest Tree dbh 20.6 ± 0.8 22.4 ± 0.3 765 * -2.2 0.030
Nest Height 2.9 ± 0.1 2.8 ± 0.0 763 * 0.8 0.397
Nest Concealment 30.4 ± 0.8 30.9 ± 0.4 761 * -0.8 0.430
Nest Size 1.9 ± 0.0 1.8 ± 0.0 729 * 1.9 0.057
Jay Abundance 136 ** 4.7 0.032
Wren Abundance 136 ** 2.3 0.135
Mammal Abundance 136 ** 0.4 0.514
Combined Predator Abundance 136 ** 5.2 0.025
Cone and Acorn Index 109 ** 0.2 0.686*Nest is sample unit. Sample sizes vary due to missing data.**Nest cluster is sample unit. Cone and acorn index includes nest clusters from 2004 only.
(x ± SE) (x ± SE)intact depredated

79
Table B.3. Results of two logistic regressions for binomial counts using stepwise variable selection (P = 0.20 to enter, P = 0.10 to remain). In each model, the risk of artificial nest depredation within forests in southeastern Arizona was the response variable. The two models were based on 1) nest clusters (n = 136) from 2003 and 2004 pooled, and 2) nest clusters (n = 109) from 2004 only. Error! Not a valid link.
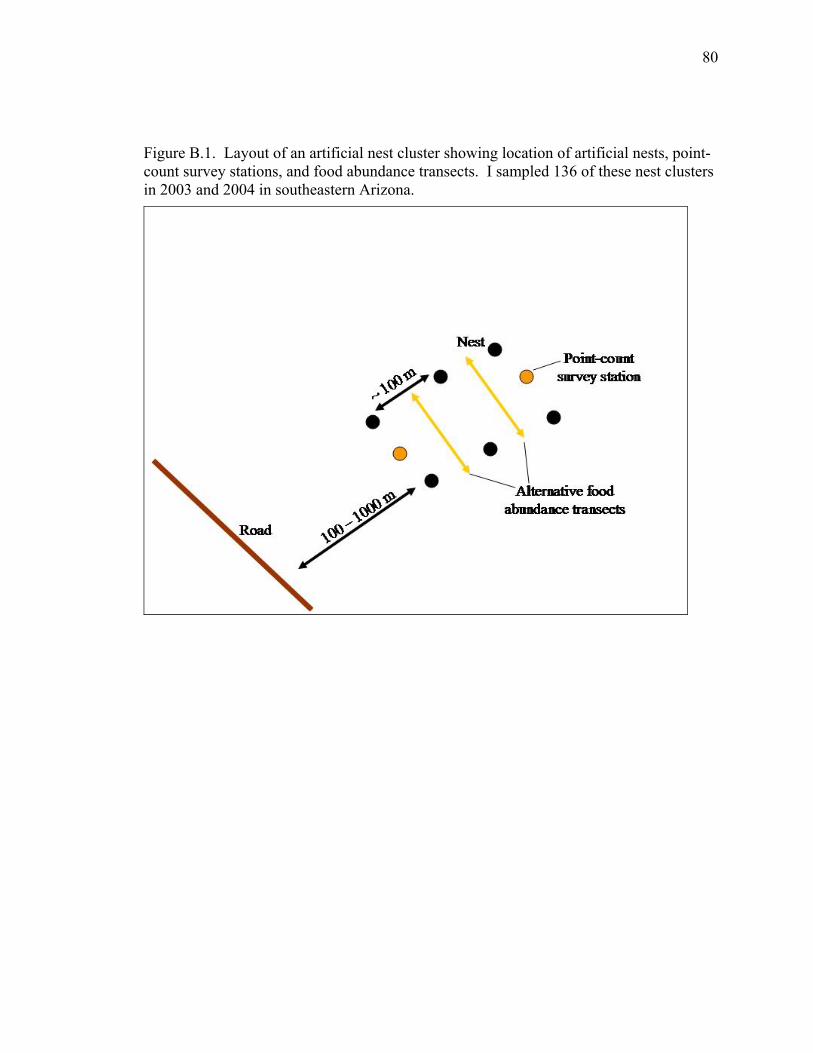
80
Figure B.1. Layout of an artificial nest cluster showing location of artificial nests, point-count survey stations, and food abundance transects. I sampled 136 of these nest clusters in 2003 and 2004 in southeastern Arizona.

81
Figure B.2. The probability of artificial nest predation was positively related to nest concealment in 2004, but negatively related to nest concealment in 2003, southeastern Arizona.
nest concealment (%)
10 - 24 25 - 39 40 - 65
prop
ortio
n of
nes
ts d
epre
date
d
0.4
0.5
0.6
0.7
0.8
0.9
1.0
20032004
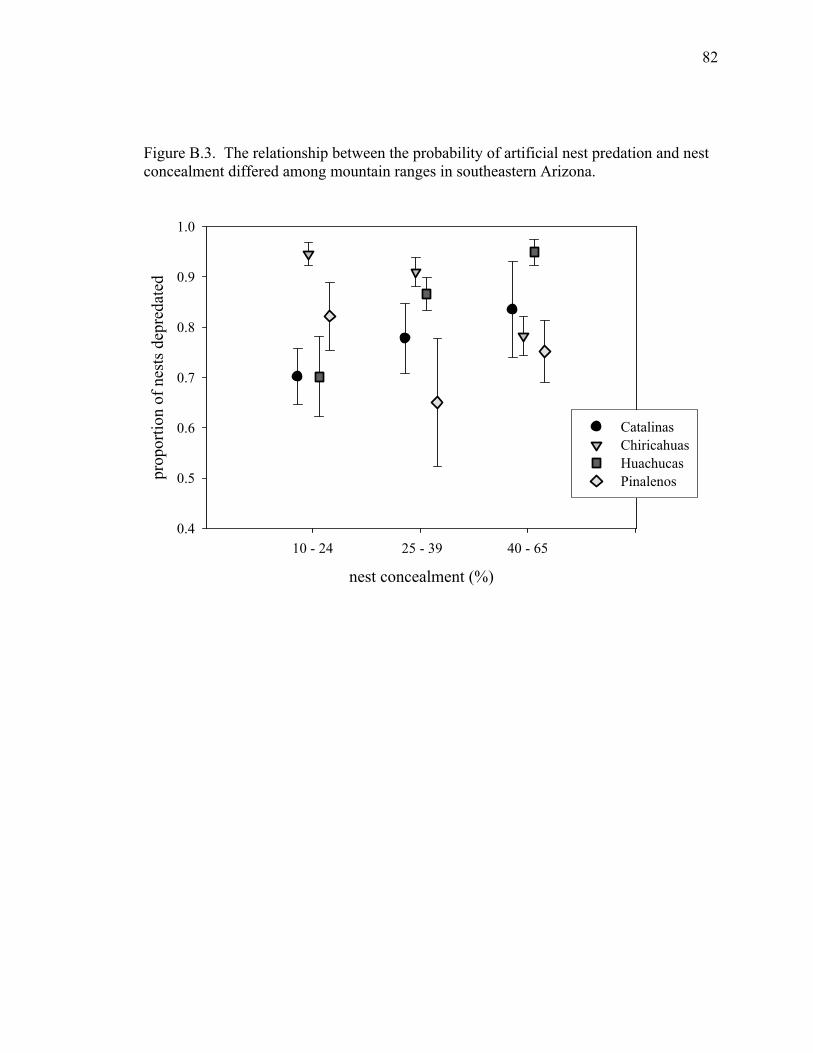
82
Figure B.3. The relationship between the probability of artificial nest predation and nest concealment differed among mountain ranges in southeastern Arizona.
nest concealment (%)
10 - 24 25 - 39 40 - 65
prop
ortio
n of
nes
ts d
epre
date
d
0.4
0.5
0.6
0.7
0.8
0.9
1.0
CatalinasChiricahuasHuachucasPinalenos

83
Figure B.4. The relationship between the probability of artificial nest predation and nest tree dbh differed among mountain ranges in southeastern Arizona.
nest tree dbh (cm)
0 - 14.9 15 - 24.9 25 - 40
prop
ortio
n of
nes
ts d
epre
date
d
0.4
0.5
0.6
0.7
0.8
0.9
1.0
CatalinasChiricahuasHuachucasPinalenos
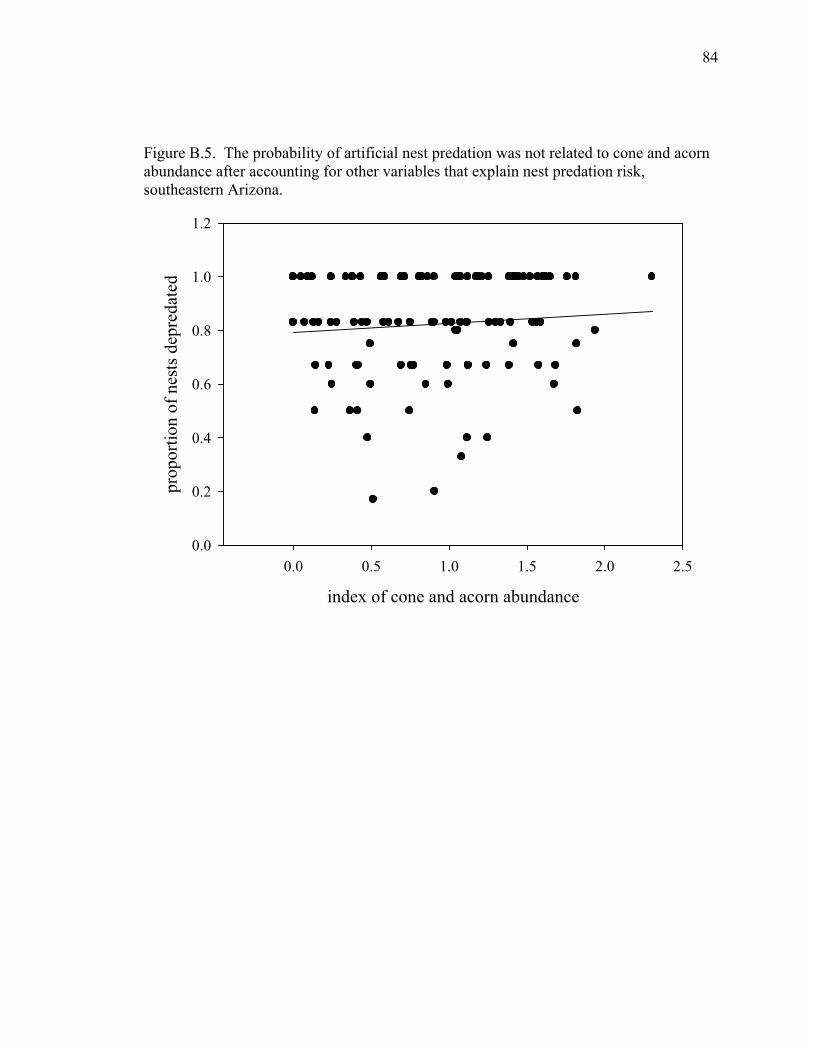
84
Figure B.5. The probability of artificial nest predation was not related to cone and acorn abundance after accounting for other variables that explain nest predation risk, southeastern Arizona.
index of cone and acorn abundance
0.0 0.5 1.0 1.5 2.0 2.5
prop
ortio
n of
nes
ts d
epre
date
d
0.0
0.2
0.4
0.6
0.8
1.0
1.2

85
APPENDIX C. THE INSTITUTIONAL ANIMAL CARE AND USE COMMITTEE (IACUC)