habitat selection and behavioural strategies of …
TRANSCRIPT

HABITAT SELECTION AND BEHAVIOURAL STRATEGIES OF STONE’S SHEEP IN THE BESA-PROPHET
Part 2 of Project “An Ecosystem Approach to Habitat Capability Modelling and
Cumulative Effects Management”
Katherine L. Parker and Andrew B. D. Walker Natural Resources and Environmental Studies
University of Northern British Columbia Prince George, British Columbia V2N 4Z9
MK-2001-2002-91, MK-2002-2003-01, MK-2003-2004-01, MK-2004-2005-11, MK 2005-2006-19, MK 2006-2007-09
Prepared for: Muskwa-Kechika Advisory Board
March 2007
J. Ayotte

Besa-Prophet Stone’s Sheep
2
TABLE OF CONTENTS
EXECUTIVE SUMMARY .......................................................................................................3
INTRODUCTION.....................................................................................................................4
PROJECT OBJECTIVES..........................................................................................................5
STUDY AREA..........................................................................................................................5
ACTIVITIES/TECHNIQUES/FINDINGS: ..............................................................................7
Ranges and Movements .........................................................................................................7
Mortality...............................................................................................................................10
Stress Hormones...................................................................................................................11
Behavioural Observations and Fine-scale Habitat Measurements.......................................13
Habitat Use and Selection ....................................................................................................22
Habitat Use in Relation to Pre-tenure Plans.........................................................................36
MANAGEMENT RECOMMENDATIONS...........................................................................42
ACKNOWLEDGMENTS.......................................................................................................44
LITERATURE CITED............................................................................................................46
Besa-Prophet Stone’s Sheep
3
EXECUTIVE SUMMARY
This research comprised the majority of Andrew Walker’s Masters of Science research at the University of Northern British Columbia.
Baseline information on Stone’s sheep (Ovis dalli stonei) and their habitats is needed because of increased industrial development and recreational activity in the mountains of northern British Columbia. The overall goal of this study was to quantify habitat selection and behavioural strategies of female Stone’s sheep in the Besa and Prophet watersheds of the Muskwa-Kechika Management Area. We used radio-telemetry data obtained from global positioning satellite (GPS) collars on 33 female Stone’s sheep, remote-sensing imagery of vegetation communities, and assessments of predation risk from concurrent studies on grizzly bears (Ursus arctos) and wolves (Canis lupus) in the same area to assess habitat use and selection. We determined proportional use of different vegetation types as well as of the biophysical zones and habitat suitability classes used in pre-tenure planning for the study area. We developed resource selection models to quantify the combinations of variables that sheep were actually choosing or avoiding from what was available to them. These models showed that strategies sometimes differed among groups of sheep, but that there also were general consistencies in selection for steep slopes at relatively high elevations, ridge-like topography, and south aspects in most seasons.
We conducted behavioural observations and fine-scale habitat and vegetation measurements to characterize habitat use by female Stone’s sheep with lambs and those without lambs during spring and early summer. Nursery groups spent shorter durations of time active, more time active in solid-rock-escape features, and less time in shrub habitat. They also tended to be closer to nearest-escape features and to larger nearest-escape features, presumably to reduce the risk of predation. Regardless of maternal status, however, Stone’s sheep used lower-elevation plant communities in spring and moved up in elevation while tracking plants with high nutritional value as the growing season progressed. We also documented naturally occurring levels of stress hormones in Stone’s sheep using fecal glucocorticoids to establish a baseline to which impacts associated with future access can be compared.
This research provides a comprehensive analysis of habitat selection and use by Stone’s sheep, a species for which the life-history characteristics increase susceptibility to environmental and anthropogenic disturbance. The findings also help characterize the ungulate landscape of the Besa-Prophet area to better understand interactions within the large mammal predator-prey system.

Besa-Prophet Stone’s Sheep
4
INTRODUCTION Stone’s sheep (Ovis dalli stonei) are one of 2 subspecies of thinhorn sheep (the other
being Dall’s sheep (Ovis dalli dalli)). They are named for A. J. Stone, who collected the first specimens in 1897 on the headwaters of the Stikine River in British Columbia (Valdez and Krausman 1999). Stone’s sheep reside in British Columbia north of the 50th parallel and in southern Yukon (Valdez and Krausman 1999). They are typically found in subalpine / alpine habitats with access to steep rocky terrain, and show strong fidelity to particular ranges (Luckhurst 1973).
Availability of suitable winter-spring habitats and adequate escape terrain for predator evasion are generally assumed to be the 2 most important factors limiting thinhorn populations. For Stone’s sheep, windswept alpine areas with low snow accumulations are critical (Seip 1983). Although escape terrain has not been quantified specifically for Stone’s sheep, it probably varies with the habitats and predators associated with individual groups. Stone’s sheep depend on alpine vegetation for their nutritional requirements and have specific demands for mineral licks that can alter seasonal distributions and patterns of range use (Luckhurst 1973, Seip 1983, Paquet and Demarchi 1999). Stone’s sheep and other North American wild sheep show a strong affinity to specific seasonal ranges and sites (Geist, 1971, Worley et al., 2004). This seasonal affiliation may affect distribution, risk of predation, and ability of a population to adapt to disturbances and changing habitats.
Wild sheep are sensitive to disturbance (MacArthur et al. 1982, Stockwell et al. 1991, Bleich et al. 1994, Frid 2003) and populations may be constrained by risk from predation, anthropogenic access, and disease (Demarchi and Hartwig 2004). Habitats for Stone’s sheep have been relatively secure to date, but increasing fossil-fuel exploration, development and recreational use on critical sheep ranges may alter habitats or disrupt habitat use with potentially harmful consequences to sheep.
Information from this study contributes both to the conservation of Stone’s sheep and to effective land-use planning. Stone’s sheep are a highly visible species of special concern in the mountains of British Columbia and Yukon, and unlike other ungulates found there, Stone’s sheep are found nowhere else in the world. The plant communities associated with higher elevations are fragile with slow recovery rates. Alteration or destruction of highly selected plant communities could seriously affect sheep populations dependent upon them (Luckhurst 1973). Knowledge of habitat selection (including behaviours and fine-scale habitat use), current stress levels and mortality rates helps provide a foundation to maintain Stone's sheep populations and effectively document any impacts that anthropogenic or environmental disturbance may have on this species in the future.

Besa-Prophet Stone’s Sheep
5
PROJECT OBJECTIVES The overall goal of this study was to quantify habitat selection and behavioural
strategies of female Stone’s sheep in the Besa-Prophet area. To do this we used global positioning satellite (GPS) radio-collars, behavioural observations of ewes with and without lambs, remote-sensing imagery of vegetation communities, assessments of predation risk from concurrent studies on grizzly bears (Ursus arctos) and wolves (Canis lupus) in the same area, and habitat selection modelling. We also documented naturally occurring levels of stress in Stone’s sheep to provide a baseline for which impacts associated with future access can be compared. These data and analyses are helpful in characterizing the ungulate landscape of the Besa-Prophet watershed. They contribute to a better understanding of interactions within the large mammal predator-prey system.
Specific objectives were to:
1) monitor seasonal movements and range use by Stone’s sheep, and in so doing, obtain preliminary assessments of mortality rates from marked sheep;
2) establish baseline (naturally occurring) levels of stress using non-invasive measures of fecal stress hormones;
3) determine which habitat attributes are most important in habitat selection and assess differences relative to maternal status; and
4) assess habitat use relative to pre-tenure zones in the Besa-Prophet Pre-tenure Planning Area.
STUDY AREA The Muskwa-Kechika Management Area (MKMA) in northern British Columbia
covers approximately 6.4 million ha. This study occurred in the southern part of the 204,245 ha Besa-Prophet Pre-tenure Planning area within the MKMA between 57° 20' and 57° 40'N and 123° 10' and 123° 45'W (Fig. 1) in the foothills of the northern Rockies. Valleys at ~800-1300 m elevation are lined with white spruce (Picea glauca), lodgepole pine (Pinus contorta) and trembling aspen (Populus tremuloides) on dry sites, and black spruce (Picea mariana), willow-birch (Salix spp., Betula glandulosa) communities on poorly drained sites. South aspects often have burned grassland vegetation and deciduous trees. Subalpine habitats at higher elevations (~1300-1600 m) are characterized by an abundance of willow and scrub birch, as well as balsam fir (Abies lasiocarpa), white spruce and various grasses, sedges and fescues (Festuca spp.). The alpine tundra zone occurs at the highest elevations (~1600-2200 m) and is dominated by rock with sparse vegetation, rounded peaks and plateaus with plant communities consisting of fine grasslands (fescues and grasses), herbs, bryophytes and lichens (Meidinger and Pojar 1991).

Besa-Prophet Stone’s Sheep
6
Figure 1. Besa-Prophet study area in relation to the Besa-Prophet Pre-tenure Planning Area in the Muskwa-Kechika Management Area of northern British Columbia.
There is relatively little human access into the Besa-Prophet region, but the southern Neves area with Neves Creek and Ten Mile Lakes has a permanent outfitter camp and a government-designated all-terrain vehicle (ATV) trail along the length of the Neves valley (Fig. 2). The majority of human activity occurs during the summer and fall with the start of hunting seasons. Some snowmobile activity is present during winter. Several seismic lines also have been established in the Neves valley (Fig. 2). Although no significant industrial development has taken place yet, this southern portion of the study area may see oil and gas exploration in the future. The northern Duffield area of the study area, encompassing Duffield, Townsley, and Richards Creeks, is extremely remote and lacks any permanent anthropogenic development. The Neves and Duffield areas are separated by the Besa River (Fig. 2). Data from GPS-collared Stone’s sheep indicated that there were no movements of individuals between these two areas (Fig. 2).

Besa-Prophet Stone’s Sheep
7
Figure 2. Areas used by 5 groups of female Stone’s sheep, determined from locations of individuals with Global Positioning System (GPS) radio-collars, in the Besa-Prophet area of northern British Columbia, 2002-2003. Individuals were assigned to groups based on their use of a particular mineral lick.
ACTIVITIES/TECHNIQUES/FINDINGS:
Ranges and Movements Thirty six adult female Stone’s sheep were captured and fitted with GPS radio-collars
(SimplexTM Televilt, Lindesberg, Sweden) in December 2001 - January 2002 and January - March 2003. Collars were programmed to record locations 4 times daily. Data were retrieved during remote downloads 3 times per year, as well as when collars were recovered at the end of a 2-year sampling period. We retrieved 42,420 GPS locations from 33 of the 36 collared Stone’s sheep between January 2002 and December 2003. Of those locations 35,482 had

Besa-Prophet Stone’s Sheep
8
consecutive 6-h fixes. The number of GPS locations recorded as a percentage of the number of attempted GPS locations was 73.4 ± 2.80 % (mean ± SE).
We monitored collared individuals in 5 groups: Neves, Tenmile, Firstfork, Townsley and Richards (Fig. 2). Individual animals were grouped together based on the major lick used within their yearly distribution. GPS locations indicated that female sheep used mineral licks most during late summer and early fall, although GPS locations were recorded at licks in every season except late winter. No individual travelled outside of its group’s distribution to another lick.
We used movement rates, behaviour, patterns of range use, and the lambing and breeding biology of thinhorn sheep to delineate 6 seasons for our data analyses in this study (Table 1). Distances moved by Stone’s sheep between 6-h GPS fixes ranged from no movement between fixes to a maximum straight-line distance of 8,496 m (which included movement to a lick). Movement rates were similar between 2002 and 2003 (Fig. 3A). Average movement rates across years decreased through the rut and winter seasons to a low in late winter of 23.8 ± 1.36 m/hr (mean ± SE) and increased through the lambing and summer seasons to a high in fall of 98.8 ± 3.71 m/hr (Fig. 3B).
Table 1. Seasons, dates and biological rationale for grouping data from radio-collared Stone’s sheep in the Besa-Prophet study area.
Season Date Biology Early winter (EW)
1 January – 28 February
Formation of sex-specific groups following ruta.
Late winter (LW)
1 March – 14 May
Smallest range use sizea,c; movement to subalpine slopes in preparation for plant greeninga,c.
Lambing (L)
15 May – 14 June
Two days before the mean onset and two days after the mean end dates of lambingd. Parturient females become solitarya,b,c,d; onset of plant greeninga,b,c,d,e.
Summer (S)
15 June – 14 August
Movement to higher elevationsa,b,c; high use of mineral licksa,b,c; formation of nursery groupsa,b,d.
Fall (F)
15 August – 31 October
Senescence of vegetatione; movement to lower elevations in relation to burn vegetationc.
Rut (R)
1 November – 31 December
Males and females form mixed sex groups on or near winter range; ewes come into estrusa,d.
aGeist (1971), bLuckhurst (1973), cSeip (1983), dNichols and Bunnell (1999), eLay (2005)

Besa-Prophet Stone’s Sheep
9
EW LW L S F R
Mov
emen
t rat
e (m
/ hr
)
0
20
40
60
80
100
120
140
Month
Mov
emen
t rat
e (m
/ hr
)
0
20
40
60
80
100
120
140
23 25
24
23
17
21
26
23
20
23
17
17
17
2020
23
20
21
2119 20
12
13
(A)
(B)
17
J F M A M J J A S O N D J F M A M J J A S O N D 2002 2003
______________________ ______________________
29
Season
25
18
22
33
28
Figure 3. (A) Monthly and (B) seasonal movement rates (m/hr, mean ± SE) of Stone’s sheep in the Besa-Prophet study area between January 2002 and December 2003. Values above error bars indicate the number of individuals that were averaged to calculate means and standard errors. EW = early winter, LW = late winter, L = lambing, S = summer, F = fall, R = rut; as defined in Table 1.
Annual home ranges were determined by minimum convex polygons (Jennrich and Turner 1969) around GPS locations for each individual. For animals with >1 year of data (n = 16), annual ranges averaged 35.5 km2, with a minimum of 15.8 and a maximum of 61.2 km2. Group ranges averaged 74.4 km2, with the Richards and First Fork groups each using the smallest areas (~54 km2), the Townsley group covering ~74 km2, the Neves group using ~84 km2, and the Ten Mile group with the largest area of ~106 km2, encompassing both sides of the Neves Valley (Fig. 2).

Besa-Prophet Stone’s Sheep
10
Mortality Mortalities of adult female Stone’s sheep in the Besa-Prophet area were determined
after remotely downloading collars and reviewing individual locations. Collars were retrieved as soon as logistically possible, but sometimes months after an individual had died. We were therefore unable to verify causes of mortality, which could have resulted from either poor nutritional condition or predation. We estimated the time of death as the first of 4 consecutive GPS locations in which the cumulative distance moved did not exceed 25 m. Mortalities were highest between late winter and summer: 8 of the 9 mortalities occurred between 13 April and 5 August (Fig. 4). Annual mortality rates were 22.7 % (5 of 22 collared individuals) in 2002 and 14.3 % (3 of 21 collared individuals) in 2003, averaging 18.5 % over the 2-year period. One additional mortality occurred in 2004, but was excluded in a calculation of yearly mortality rate because most collars already had been retrieved. Luckhurst (1973) also observed late-winter and early-spring mortalities of adult Stone’s sheep in the same study area 30 years previously. Mortality rates in the Besa-Prophet area were similar to the range of 20.0 % and 14.8 % documented for adult Dall’s sheep ewes from the Yukon and Northwest territories (Hoefs and Cowan 1979, Simmons et al. 1984). Dall’s sheep in the Yukon experienced greatest mortalities during late winter and lambing following a severe and prolonged winter (Burles and Hoefs 1984).
Season
Early w
inter
Late w
inter
Lambin
g
Summer Fall Rut
Num
ber o
f mor
talit
ies
0
1
2
3
4
Figure 4. Seasonal mortalities of Stone’s sheep ewes collared between December 2001 and January 2004 (n = 33) in the Besa-Prophet study area. EW = early winter, LW = late winter, L = lambing, S = summer, F = fall, R = rut; as defined in Table 1.

Besa-Prophet Stone’s Sheep
11
Mortalities of Stone’s sheep in the Besa-Prophet typically occurred at upper elevations, except for the last mortality in January 2004, which occurred along Neves creek adjacent to the upper Neves lick. Individuals often spent more than one day at this lick, which provides escape terrain along its steep banks (Luckhurst 1973), but requires travel through closed conifer forests over several hundred meters to access it. Closed vegetation types such as conifer and subalpine spruce were the vegetation types most consistently avoided by female Stone’s sheep in the Besa-Prophet (Walker 2005).
Stress Hormones Measures of stress have been obtained traditionally from glucocorticoids (corticosterone
and cortisol) in blood, but these measures are often inflated because of the rapid response to stress during handling (Harlow et al. 1987, Moberg 1987). In contrast, excretion of glucocorticoids in feces is determined largely by the time needed for the glucocorticoids to travel through the digestive system. Because sheep have relatively long digestive systems with slow passage rates, there is a temporal delay in glucocorticoid response in fecal samples of at least 10 - 12 hrs (Millspaugh and Washburn 2004). Fecal measures therefore reflect average concentrations of circulating glucocorticoids and are ideal for measuring long-term stress in wild animals. In addition, collection of samples can be accomplished without disturbance.
We collected fecal samples during early winter (December and January), late winter (March and April) and summer (July) of 2002 and 2003. To minimize samples coming from the same individuals, we selected at least three different sites occupied by sheep within the Neves and Duffield ranges each year. We only collected fresh samples; in late winter this entailed pellets that were on top of the last snowfall and were not frost-burnt or discoloured from weathering. We did not collect samples from lambs, easily distinguished by small pellets, and only went to ranges unoccupied by rams. We froze all fecal specimens within 2 hrs of collection and sent them to Prairie Diagnostic Services (Saskatoon, Saskatchewan) for analyses.
Both corticosterone and cortisol were detectable in the feces of Stone’s sheep and fluctuated seasonally with higher levels in summer than late winter (Fig. 5). The elevated levels in summer probably reflect seasonal metabolic rhythms and increased energetic costs of movement. Cortisol is generally considered to be the most prevalent glucocorticoid of large mammals (Millspaugh and Washburn 2004), but in Stone’s sheep, corticosterone provided a less variable measure than cortisol in every season. Both stress hormones were similar for sheep in the Neves and Duffield areas, even though anthropogenic access to the Neves Valley is greater. Presumably the glucocorticoid concentrations represent relatively undisturbed levels of stress or habituation by the Neves Valley individuals to this type of anthropogenic disturbance or indicate that the disturbance was far enough away to not elicit a response by sheep.
Because wild sheep do not readily expand their ranges or colonize new areas, they are especially susceptible to local anthropogenic and environmental stressors. Fecal glucocorticoids currently serve as the best measure for monitoring the physiological response to stressors with a non-invasive and easily attainable source of data. By describing baseline

Besa-Prophet Stone’s Sheep
12
levels of glucocorticoids in Stone’s sheep, we provide a reference to gauge the physiological effect of potential disturbances associated with future resource extraction and increased access. We recommend measuring corticosterone concentrations in Stone’s sheep because of lower within-season variation than cortisol and easy recovery (Wasser et al. 2000).
(A)
SeasonEarly winter Late winter Summer
Cor
tisol
(ng/
g)
20
30
40
50
60
70
Cor
ticos
tero
ne (n
g/g)
20
30
40
50
60
70
16
13
20
14
12
10
Duffield Neves
a
b
c
ab
b
a
(B)
Figure 5. (A) Corticosterone and (B) cortisol concentrations (mean ± SE) in fecal samples collected from Stone’s sheep in the Besa-Prophet study area of northern British Columbia during early winter, late winter and summer of 2002 and 2003. For both glucocorticoids, values next to error bars in (A) are sample sizes from the Neves Valley population; values next to error bars in (B) are sample sizes for the Duffield population. For each glucocorticoid, seasons sharing the same letters next to the mean values were not significantly different from each other.

Besa-Prophet Stone’s Sheep
13
Behavioural Observations and Fine-scale Habitat Measurements Average adult group size of female Stone’s sheep in the Besa-Prophet was 4.3 ± 0.3 (n
= 78, range 1-12). Groups with lambs (3.9 ± 0.4, n = 35) and groups without lambs (4.7 ± 0.5, n = 43) were similar (P = 0.448). In these measures of group size, we included any rams >1 year of age, but excluded lambs because of the close dependence they have with their mothers. Stone’s sheep ewes tended to be in nursery and non-nursery groups. The nursery groups had an average of 0.82 lambs/ewe during the spring and summer, indicating that most females in nursery groups had lambs.
Behavioural observations were conducted to determine if female Stone’s sheep with lambs allocated their time or habitat use differently than ewes without lambs. Following these observations, we made fine-scale habitat assessments to define site-specific attributes of habitat use that were not likely to be identified using locations from GPS telemetry and habitat classifications based on remote-sensing imagery. Stone’s sheep ewes were observed during daylight hours from May through July in 2002 and 2003 on relatively accessible ranges of 10 different mountains separated by major creeks or river drainages. Most sites used by sheep were accessed on horseback, with occasional helicopter transport (Fig. 6). Observations were made using binoculars and/or spotting scopes at distances of 50-500 m from the sheep. Care was taken not to disturb sheep and observations were discontinued if animals exhibited alert behaviour towards the observer or towards any anthropogenic stimulus.
Figure 6. Travel to Stone’s sheep ranges in the Besa-Prophet area for behavioural observations.
A. Anderson
K. Parker G. Blackburn

Besa-Prophet Stone’s Sheep
14
Numbers of successful observation periods (a minimum of 25 minutes of observation) after accessing remote locations are shown in Table 2. We continuously recorded behaviours (foraging, walking, standing, alert, nursing and out of sight) for 93 individuals using a small handheld clock-equipped computer (HP 200LX; Hewlett Packard, Corvallis, Oregon, USA). Sheep were considered alert when standing with their heads and ears upright, fixed in a particular direction, mutually exclusive of chewing, ingesting food or participating in other behaviours. We removed all active bouts that were less than ~5.5 min from analyses because most of these short active periods represented times that animals changed their bedding position. Complete active bouts were those in which an animal was observed continuously from the time it stood up after bedding until it lay down again. Complete inactive bouts were defined as bouts in which animals were observed throughout an entire bedding period. Ewes without lambs had longer active periods, as determined from complete active bouts (39.0 min ± 4.4 SE, n = 31), than ewes with lambs (25.0 ± 3.1 min; n = 20); lying bouts were very similar between maternal and non-maternal groups (Fig. 7).
During activity periods, both maternal and nonmaternal Stone’s sheep tended to spend about two-thirds of their time foraging (Fig. 8). Some time (12-16 %) was allocated towards standing and walking; and sheep were alert (vigilant) 3-4 % of the active period. Maternal ewes also spent ~2 % of active periods nursing lambs. Individual nursing bouts declined from an average of 31 sec in early June to 12 sec in late July, although there was high variation around these means (Fig. 9).
Table 2. Behavioural observations of Stone’s sheep and fine-scale habitat assessments of use in the Duffield and Neves drainages of the Besa-Prophet study area, summers 2002-2003.
Duffield Neves Total Behavioural Observations (n) 29 64 93 Hours of Observation 38.0 87.6 125.6 Habitat Assessments (n) 28 50 78

Besa-Prophet Stone’s Sheep
15
Mean active and inactive times for Stone's sheep ewes during complete bouts
0
500
1000
1500
2000
2500
All ewes Ewe without lamb Ewe with lamb
Tim
e (s
ec)
ActiveInactive
Figure 7. Duration (mean ± SE) of complete active and inactive bouts of adult female Stone’s sheep in June and July, 2002-2003.
Specific behaviours of active Stone's sheep ewes
0.00
0.10
0.20
0.30
0.40
0.50
0.60
0.70
0.80
Feeding Standing Walking Alert Nursing
Pro
porti
on
Ewe with lamb (n = 44)Ewe without lamb (n = 56)
Figure 8. Proportion (mean ± SE) of active periods spent feeding, standing, walking, alert and nursing by adult female Stone’s sheep in June and July, 2002-2003.

Besa-Prophet Stone’s Sheep
16
(A)
Prop
ortio
n of
act
ive
time
spen
t nur
sing
0.00
0.02
0.04
0.06
0.08
0.10
0.12
0.14
Julian week
24 25 26 27 28 29 30
Mea
n nu
rsin
g bo
ut le
ngth
(sec
)
10
20
30
40(B)
4
11
6
5 6
44
4 11
6
56
44
Figure 9. Proportion of active time (mean ± SE) spent nursing lambs (A) by adult female Stone’s sheep and duration (B) of the nursing bouts (mean ± SE) in June and July, 2002-2003. Values above error bars in (A) indicate the number of ewes for which data were averaged by week. Duration of nursing bouts were averaged per lamb during an observation period; the values above error bars in (B) indicate the number of lambs for which mean data were then averaged by week. Julian week 24 began on 9 June in 2002 and 8 June in 2003.
Sites used by sheep were identified by recording the locations of observed individuals at 5-min intervals. Locations were plotted on a hand-drawn map for fine-scale habitat sampling which took place approximately 1-2 days after behavioural observations. We drew polygons around plotted locations and determined the center of each use site on a line drawn down the center of the longest axis of the activity polygon. This provided the middle point for a 50-m transect that ran the bearing of the longest axis (Fig. 10). We used the line-intercept method

Besa-Prophet Stone’s Sheep
17
along each 50-m transect to determine vegetation cover by 4 forage classes: herbaceous (graminoids and forbs), shrubs, trees and mosses/lichens. Elevation (m) and slope (°) were measured from the middle of the transect. At 5 stations (12.5-m intervals) along each transect, we measured distance to the nearest-escape feature (broken rock or solid rock). We defined solid-rock-escape features as cliffs and steep rocky outcrops. Distance to nearest-escape feature was the closest distance to one of these features. Area (ha) of an escape feature was determined by measuring the height and width of the escape feature.
Figure 10. Example of a hand-drawn map showing locations where observations of activity were made for a Stone’s sheep individual in relation to topographical features. A polygon was drawn around these locations and then the red line was drawn down the center of the longest axis of the activity polygon. The centre of this red line was used as the centre of the transect for which vegetation, slope, aspect, elevation, and distances to nearest escape features were measured during the week following behavioural observations.

Besa-Prophet Stone’s Sheep
18
We also recorded percent cover by plant species, bare ground/rock and litter, and plant phenology as a measure of forage quality within 1×1-m2 quadrats at each of the 5 stations along the transects (Fig. 11). Phenology was described for each species on a scale from 1 to 7 as emergent, new shoot, leaves unfurled, budding, flowering, fruiting or seeded. We assigned the most frequently occurring phenological stage by species among the 5 quadrats to each site. We calculated a relative availability index (m3) of forage quantity by multiplying the quadrat area (1 m2) by the cover of each plant species (%) and the average height (m) of that species.
Figure 11. Fine-scale habitat sampling of sites used by Stone’s sheep in the Besa-Prophet area.
Based on our behavioural observations, Stone’s sheep females without lambs spent most of their active and inactive time in herbaceous and shrub habitats (Fig. 12). The ewes with lambs also spent a large portion of time in herbaceous habitats, but they spent more of their active time (35 %) in solid-rock-escape features than ewes without lambs (17 %). Spending less time in brushier habitats with lower visibility and more time in escape terrain may help to reduce predation risk. In contrast to their active bouts, the ewes with lambs spent very little time bedded in cliffs and outcrops (solid-rock-escape features, 2 %) and more time bedded in broken-rock escape features such as scree and talus (33 %). Because Stone’s sheep are fairly cryptic in rocky habitats, the use of broken-rock habitat while bedded may be an anti-predator response capitalizing on this. Broken rock can also be noisy, and approaching terrestrial predators may be more easily detected.
A. Anderson G. Blackburn
A. Walker

Besa-Prophet Stone’s Sheep
19
Prop
ortio
n of
act
ive
time
0.0
0.2
0.4
0.6
(A)
(B)
Habitat
Herbace
ous
Shrubs
Trees
Broken
rock
Solid r
ock
Prop
ortio
n of
inac
tive
time
0.0
0.2
0.4
0.6
Ewe without lamb (n=52)Ewe with lamb (n=41)
Ewe without lamb (n=56)Ewe with lamb (n=34)
*
*
*
*
Figure 12. The proportion (mean ± SE) of (A) active and (B) inactive times that maternal and nonmaternal Stone’s sheep ewes spent in different habitats in the Besa-Prophet area of northern British Columbia. * indicates significant difference (P < 0.05).
When comparing the habitat attributes used by nursery and non-nursery groups of Stone’s sheep, the differences again may reflect maternal strategies to avoid predators. Ewes with lambs tended to be closer to the nearest-escape feature (average of 8.6 m versus 14 m), and associated with larger nearest-escape features (1.7 versus 0.41 ha) and larger broken-rock-escape features (1.6 versus 0.47 ha) than non-nursery groups (Table 3). These escape features were typically 3-4 times larger for groups with lambs. When lambs were present, groups were never observed >69 m from an escape feature. This contrasts with the 150 m observed for a group without lambs. The ewes with lambs used habitats that averaged less than half as much shrub cover as sites used by groups without lambs.

20
Besa-Prophet Stone’s Sheep
Table 3. Intrasexual differences in habitat attributes (mean ± SE, minimum (min) and maximum (max)) used by groups of female Stone’s sheep in the Besa-Prophet area of northern British Columbia, 2002-2003.
Feature
Ewes with lambs n = 35
Ewes without lambs n = 43
P
mean ± SE min max mean ± SE min max Vegetation features Availability index (m3) 0.043 ± 0.0076 0.001 0.179 0.061 ± 0.0092 0.005 0.253 0.076 Phenology (stage)
2.94 ± 0.091 2.0 5.0 2.70 ± 0.113 1.0 5.0 0.036
Topographic features Slope (°) 37.4 ± 1.50 23.5 60 34.8 ± 1.36 18.5 55 0.204 Distance to nearest broken rock (m)
21 ± 5.8 0 169.2 21 ± 4.1 0 149.8 0.163
Broken-rock area (ha) 1.6 ± 0.48 0.01 12.00 0.47 ± 0.135 0.002 4.50 0.003 Distance to nearest solid rock (m)
25 ± 5.1 0.1 113.6 30 ± 5.0 1.8 161.4 0.220
Solid-rock area (ha) 0.68 ± 0.204 0.01 6.00 0.343 ± 0.0815 0.002 2.40 0.127 Distance to nearest-escape feature (m)
8.6 ± 2.12 0 69.0 14 ± 3.5 0 149.8 0.029
Escape area (ha)
1.7 ± 0.48 0.01 12.00 0.41 ± 0.121 0.002 4.50 0.001
Ground Cover Herbaceous cover (%) 63 ± 5.1 2.0 100 73 ± 4.0 0.4 100 0.112 Shrub cover (%) 9.2 ± 2.90 0 77.7 22 ± 3.9 0 83.4 0.020 Tree cover (%) 1.5 ± 0.75 0 20.1 1.5 ± 0.62 0 22.6 0.765 Moss/lichen cover (%) 22 ± 5.2 0 100 20 ± 4.5 0 100 0.523 Soil/rock cover (%) 44 ± 5.2 3.4 100 26 ± 4.0 0 100 0.004

Besa-Prophet Stone’s Sheep
21
Plant communities used by nursery and non-nursery groups of Stone’s sheep were similar, and both groups associated with communities on a temporal and elevational gradient. As the growing season progressed, Stone’s sheep generally moved up in elevation (Fig. 13). They were associated with low-elevation shrub communities earlier in the growing season and with higher elevation communities with more moss and lichen cover later in the summer. All Stone’s sheep ewes appeared to track a phenological stage. More than 90 % of the use sites that we measured had plants in phenological stage 3 or less, and these typically were characterized by plants with unfurled leaves and no visual reproductive structures. This new plant growth is usually highly digestible with the highest protein content, and is therefore the best forage quality. Stone’s sheep ewes with lambs used sites with plants in slightly older phenological stage (2.94 on our scale of 1 to 7) than ewes without lambs (2.70) (Table 3). Because maternal females, with higher physiological demands than ewes without lambs, used sites of slightly poorer quality (older phenological stage) with no differences in the amount of forage at those sites (availability index, Table 3), the differences in habitats used by nursery and non-nursery groups appear to reflect the trade-offs related to predation constraints. Stone’s sheep with lambs spent more time in solid-rock-escape features and less time in shrub habitat while associating with sites closer to escape features, having larger escape features and containing more exposed soil and rock.
Date
13-M
ay
27-M
ay10
-Jun
24-Ju
n08
-Jul
22-Ju
l
Elev
atio
n (m
)
1500
1600
1700
1800
1900
2000
2100Ewe without lamb (r = 0.67, P < 0.001)Ewe with lamb (r = 0.48, P = 0.002)
Figure 13. Elevation of sites used by maternal and nonmaternal Stone’s sheep ewes from mid-May to August (2002-2003) in the Besa-Prophet area of northern British Columbia.
Besa-Prophet Stone’s Sheep
22
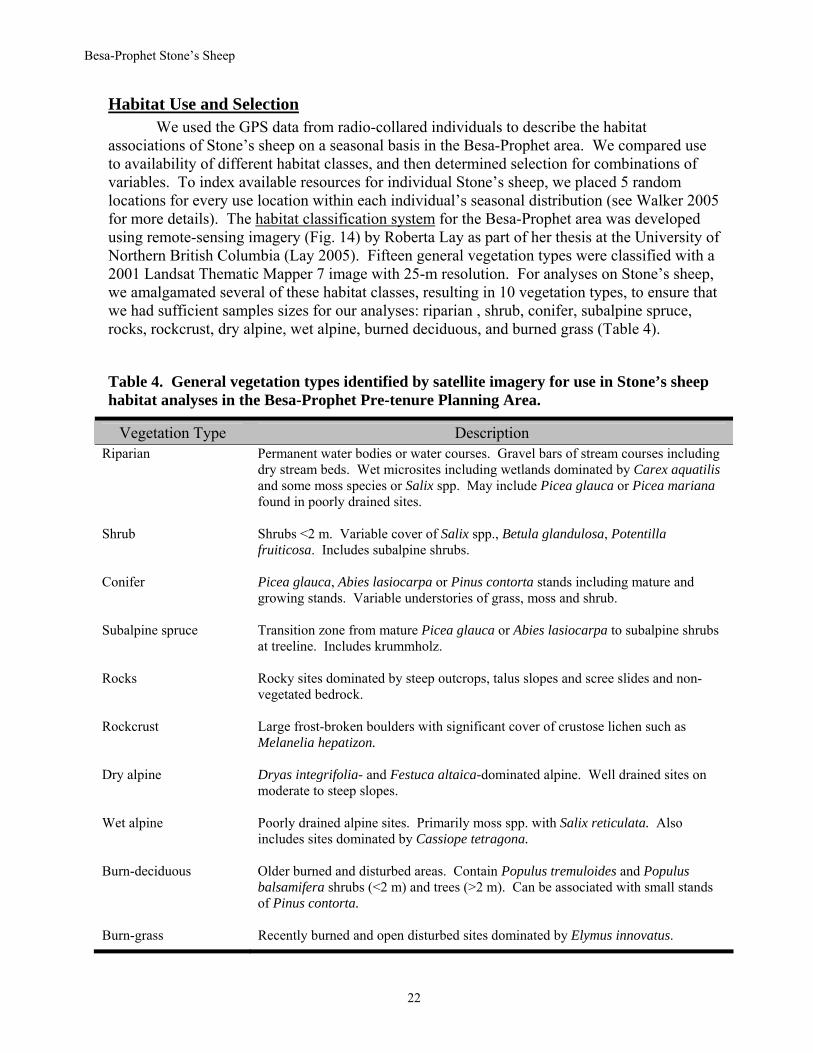
Habitat Use and Selection We used the GPS data from radio-collared individuals to describe the habitat
associations of Stone’s sheep on a seasonal basis in the Besa-Prophet area. We compared use to availability of different habitat classes, and then determined selection for combinations of variables. To index available resources for individual Stone’s sheep, we placed 5 random locations for every use location within each individual’s seasonal distribution (see Walker 2005 for more details). The habitat classification system for the Besa-Prophet area was developed using remote-sensing imagery (Fig. 14) by Roberta Lay as part of her thesis at the University of Northern British Columbia (Lay 2005). Fifteen general vegetation types were classified with a 2001 Landsat Thematic Mapper 7 image with 25-m resolution. For analyses on Stone’s sheep, we amalgamated several of these habitat classes, resulting in 10 vegetation types, to ensure that we had sufficient samples sizes for our analyses: riparian , shrub, conifer, subalpine spruce, rocks, rockcrust, dry alpine, wet alpine, burned deciduous, and burned grass (Table 4).
Table 4. General vegetation types identified by satellite imagery for use in Stone’s sheep habitat analyses in the Besa-Prophet Pre-tenure Planning Area.
Vegetation Type Description Riparian Permanent water bodies or water courses. Gravel bars of stream courses including
dry stream beds. Wet microsites including wetlands dominated by Carex aquatilis and some moss species or Salix spp. May include Picea glauca or Picea mariana found in poorly drained sites.
Shrub Shrubs <2 m. Variable cover of Salix spp., Betula glandulosa, Potentilla fruiticosa. Includes subalpine shrubs.
Conifer Picea glauca, Abies lasiocarpa or Pinus contorta stands including mature and growing stands. Variable understories of grass, moss and shrub.
Subalpine spruce Transition zone from mature Picea glauca or Abies lasiocarpa to subalpine shrubs at treeline. Includes krummholz.
Rocks Rocky sites dominated by steep outcrops, talus slopes and scree slides and non-vegetated bedrock.
Rockcrust Large frost-broken boulders with significant cover of crustose lichen such as Melanelia hepatizon.
Dry alpine Dryas integrifolia- and Festuca altaica-dominated alpine. Well drained sites on moderate to steep slopes.
Wet alpine Poorly drained alpine sites. Primarily moss spp. with Salix reticulata. Also includes sites dominated by Cassiope tetragona.
Burn-deciduous Older burned and disturbed areas. Contain Populus tremuloides and Populus balsamifera shrubs (<2 m) and trees (>2 m). Can be associated with small stands of Pinus contorta.
Burn-grass Recently burned and open disturbed sites dominated by Elymus innovatus.

23
Besa-Prophet Stone’s Sheep
Figure 14. Remote-sensing satellite image of the Besa-Prophet study area including outline of the Besa-Prophet Pre-tenure Planning Area and notable drainages and landscape features.
Muskwa
Prophet Klingzut Mountain
Besa
Neves
Keily
Redfern Lake
Trimble Lake
Richards
Sikanni
Pocketknife

Besa-Prophet Stone’s Sheep
24
Rock habitat was used most during all seasons by Stone’s sheep ewes (Fig. 15). Use (after averaging the proportions defined for each individual to reduce effects of uneven sample sizes among individuals) of this habitat ranged from a low of 24 % of GPS locations in fall to a high of 51 % in summer. During all seasons, more than 50 % of use locations were in rocks and dry alpine areas. The vegetation type most available to Stone’s sheep was conifer, at approximately ⅓ of the area. Fewer than 10 % of the use locations, however, occurred in conifers. Burned grass areas were used most in late winter.
Figure 15. Proportional use versus availability (+ SE) of vegetation types by Stone’s sheep ewes in the Besa-Prophet area of northern British Columbia. Standard errors were determined from averages for each individual by season as defined in Table 1.
Use vs Availability of Vegetation Types during Early Winter(n = 29 individuals)
0
0.1
0.2
0.3
0.4
0.5
0.6
Riparian
Shrub
Conifer
Subalp
ine spru
ceRock
s
Rockcru
st
Dry alp
ine
Wet alpi
ne
Burn-de
ciduo
us
Burn-gr
ass
Vegetation Type
Prop
ortio
n
UsedAvailable
Use vs Availability of Vegetation Types during Late Winter(n = 33 individuals)
0
0.1
0.2
0.3
0.4
0.5
0.6
Riparian
Shrub
Conifer
Subalp
ine spru
ceRock
s
Rockcru
st
Dry alp
ine
Wet alpi
ne
Burn-de
ciduo
us
Burn-gr
ass
Vegetation Type
Prop
ortio
n
UsedAvailable
Use vs Availability of Vegetation Types during Lambing(n = 28 individuals)
0
0.1
0.2
0.3
0.4
0.5
0.6
Riparian
Shrub
Conifer
Subalp
ine spru
ceRock
s
Rockcru
st
Dry alp
ine
Wet alpi
ne
Burn-de
ciduo
us
Burn-gr
ass
Vegetation Type
Prop
ortio
n
UsedAvailable
Use vs Availability of Vegetation Types during Summer(n = 25 individuals)
0
0.1
0.2
0.3
0.4
0.5
0.6
Riparian
Shrub
Conifer
Subalp
ine spru
ceRock
s
Rockcru
st
Dry alp
ine
Wet alpi
ne
Burn-de
ciduo
us
Burn-gr
ass
Vegetation TypePr
opor
tion
UsedAvailable
Use vs Availability of Vegetation Types during Fall(n = 22 individuals)
0
0.1
0.2
0.3
0.4
0.5
0.6
Riparian
Shrub
Conifer
Subalp
ine spru
ceRock
s
Rockcru
st
Dry alp
ine
Wet alpi
ne
Burn-de
ciduo
us
Burn-gr
ass
Vegetation Type
Prop
ortio
n
UsedAvailable
Use vs Availability of Vegetation Types during Rut(n = 18 individuals)
0
0.1
0.2
0.3
0.4
0.5
0.6
Riparian
Shrub
Conifer
Subalp
ine spru
ceRock
s
Rockcru
st
Dry alp
ine
Wet alpi
ne
Burn-de
ciduo
us
Burn-gr
ass
Vegetation Type
Prop
ortio
n
UsedAvailable

Besa-Prophet Stone’s Sheep
25
We quantified broad-scale seasonal selection with resource selection functions (RSFs) to quantify the combination of variables that sheep were actually choosing or avoiding from what was available to them. These models determine the probability of an area being used by an animal or group of animals and provide a broad-scale perspective of general patterns on the landscape (Boyce and McDonald 1999, Manly et al. 2002). They also accommodate any type of habitat variables (categorical and continuous) and easily incorporate spatial data acquired from Geographical Information Systems (GIS) or remote sensing (Boyce and McDonald 1999).
Our selection models typically included habitat class, elevation, slope, aspect, indices of forage biomass and quality, and an index of predation risk. Aspect was categorized into north (316° - 45°), east (46° - 135°), south (136° - 225°), west (226° - 315°), and no aspect (NAS). Pixels with slopes of <1° were assigned to the NAS category. During the spring/summer months, we extracted NDVI (Normalized Difference Vegetation Index) values from 2001 remote-sensing images (Landsat 5 Thematic Mapper and Landsat 7 ETM; Lay 2005). NDVI is related to leaf area and plant biomass. For all community types, plant biomass increased from June to July and August, and then declined in September (Fig. 16, from R. Lay, unpublished data). Shrubs, burned slopes, and subalpine areas were highest in plant biomass; gravel bars were lowest. We mapped this index of relative biomass across the entire study area (e.g., the darkest green areas along south-facing slopes had the greatest biomass in July, whereas the lowest biomass (reddest areas) was on rocky areas and glaciers in Fig. 16). We also determined the rate of change in green-ness for each vegetation community from the change in NDVI between months (Fig. 17). Highest rates of change were between June and July for shrubs, burned and disturbed areas, and subalpine areas, and much less change occurred on gravel bars and riparian areas. Change was relatively stable from July to August, and was negative from August to September as plants declined in green-ness. We used this information as an index of forage quality (highest rates of green-up are likely the most digestible, best quality forage), and mapped quality across the study area (e.g., the darkest green areas had the highest relative quality between June and July in Fig. 17).
To define predation risk to Stone’s sheep, we used resource selection functions with logistic regression models by season within year for data from GPS-collared wolves and grizzly bears in the Besa-Prophet area. Grizzly bears and wolves are assumed to be the most significant large mammal predators in the Muskwa-Kechika Management Area (Bergerud and Elliott 1998). These data are the foundation for Brian Milakovic’s PhD dissertation at the University of Northern British Columbia. The models included slope, aspect, elevation, vegetation type, fragmentation (an index of vegetation diversity) and distance to linear features. For each use location, we selected 5 random locations from individual bear and wolf pack ranges, as defined by a 100 % minimum convex polygon, to determine what predators were selecting from the area around them. In areas where data for wolf packs or bears were not available, we used a global model incorporating data from all bears or wolves to rank risk in those few parts of the landscape. We incorporated models for all packs and bears per season and year in a GIS.
Besa-Prophet Stone’s Sheep
26
Figure 16. Relative forage biomass, as indexed by NDVI, across the Besa-Prophet study area in July, and for comparison among vegetation classes from June through September.
Average NDVI Values in Summer by Vegetation Type
0.00
0.05
0.10
0.15
0.20
0.25
0.30
0.35
0.40
0.45
0.50
June July August September
Month
ND
VI
Carex spp.ShrubsLow productvity spruceGravel BarPineSubalpine spruceSpruceRiparian spruceDry alpineMoist alpineBurned/disturbed
0 5 10 15 202.5Kilometers¯
July

Besa-Prophet Stone’s Sheep
27
Average Change in NDVI in Summer by Vegetation Type
-0.30
-0.20
-0.10
0.00
0.10
0.20
0.30
0.40
Shr
ubs
Bur
ned/
dist
urbe
d
Sub
alpi
nesp
ruce
Moi
st a
lpin
e
Dry
alp
ine
Car
ex s
pp.
Pin
e
Low
pro
duct
vity
spru
ce Spr
uce
Gra
vel B
ar
Rip
aria
n sp
ruce
Cha
nge
in N
DVI
June-JulyJuly-AugAug-Sept
Figure 17. Relative forage quality, as indexed by change in NDVI, across the Besa-Prophet study area in June-July, and for comparison among vegetation classes from June to September.
0 5 10 15 202.5Kilometers¯
June-July

Besa-Prophet Stone’s Sheep
28
Resource selection function values from the predator-risk models are relative values that rank habitats based on a variety of topographical and vegetation features. Because RSF values are relative to each data set (e.g., pack, season, and year) and species (i.e., grizzly bear and wolf), we normalized or standardized the values to define risk across packs and species within each season. We then generated a risk surface to define which areas have the highest selection values for bears or wolves in each season. Where pack boundaries of wolves overlapped, we assigned the lowest risk value to each GIS pixel because there generally tends to be less pack vigilance along boundary areas (Mech 1994). We assumed that the risk of predation to Stone’s sheep from wolves and grizzly bears was directly related to selection values from the RSF of those species. Figure 18 is an example of grizzly bear risk in spring (e.g., the red areas across the study area had the highest bear risk).
Figure 18. Relative predation risk from grizzly bears in spring across the Besa-Prophet study area.
To quantify the habitat associations important to Stone’s sheep, we developed seasonal and annual RSF selection models for the 5 groups of sheep in the Besa-Prophet area: Neves, Tenmile, Firstfork, Townsley and Richards (Fig. 2) as well as general models across all sheep. We analyzed GPS telemetry locations by season (Table 1) in each year relative to the
0 5 10 15 202.5Kilometers¯
Spring
Besa-Prophet Stone’s Sheep
29
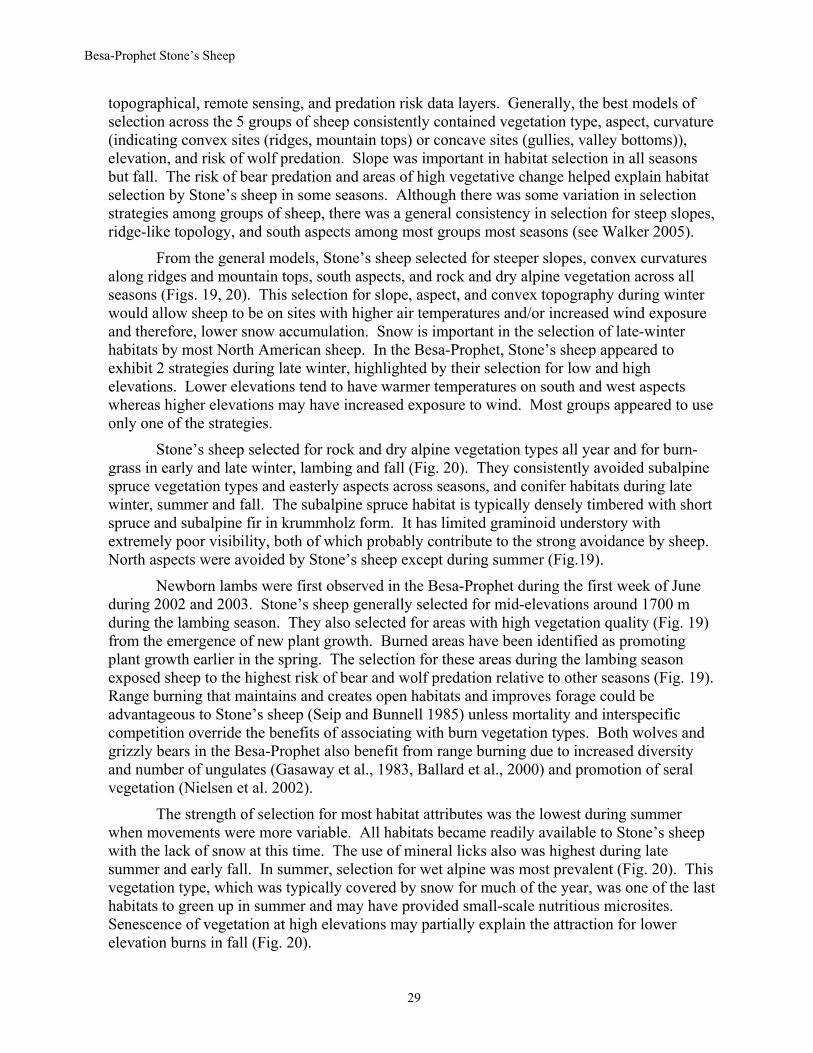
topographical, remote sensing, and predation risk data layers. Generally, the best models of selection across the 5 groups of sheep consistently contained vegetation type, aspect, curvature (indicating convex sites (ridges, mountain tops) or concave sites (gullies, valley bottoms)), elevation, and risk of wolf predation. Slope was important in habitat selection in all seasons but fall. The risk of bear predation and areas of high vegetative change helped explain habitat selection by Stone’s sheep in some seasons. Although there was some variation in selection strategies among groups of sheep, there was a general consistency in selection for steep slopes, ridge-like topology, and south aspects among most groups most seasons (see Walker 2005).
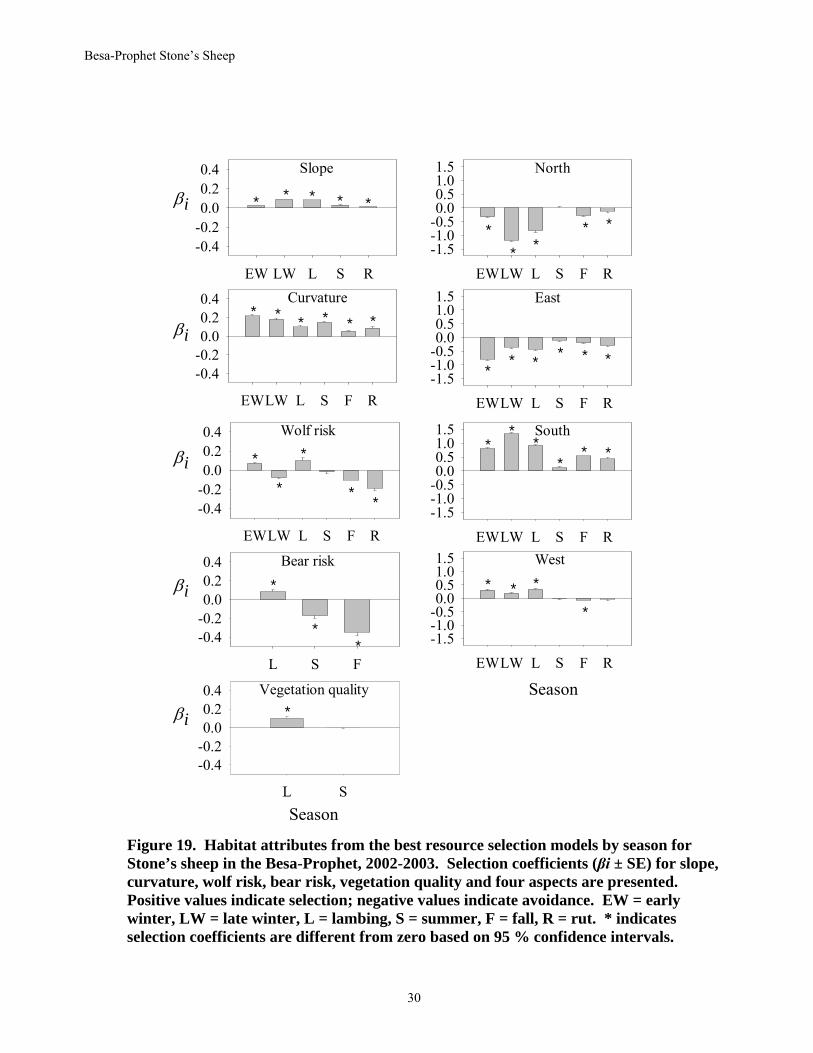
From the general models, Stone’s sheep selected for steeper slopes, convex curvatures along ridges and mountain tops, south aspects, and rock and dry alpine vegetation across all seasons (Figs. 19, 20). This selection for slope, aspect, and convex topography during winter would allow sheep to be on sites with higher air temperatures and/or increased wind exposure and therefore, lower snow accumulation. Snow is important in the selection of late-winter habitats by most North American sheep. In the Besa-Prophet, Stone’s sheep appeared to exhibit 2 strategies during late winter, highlighted by their selection for low and high elevations. Lower elevations tend to have warmer temperatures on south and west aspects whereas higher elevations may have increased exposure to wind. Most groups appeared to use only one of the strategies.
Stone’s sheep selected for rock and dry alpine vegetation types all year and for burn-grass in early and late winter, lambing and fall (Fig. 20). They consistently avoided subalpine spruce vegetation types and easterly aspects across seasons, and conifer habitats during late winter, summer and fall. The subalpine spruce habitat is typically densely timbered with short spruce and subalpine fir in krummholz form. It has limited graminoid understory with extremely poor visibility, both of which probably contribute to the strong avoidance by sheep. North aspects were avoided by Stone’s sheep except during summer (Fig.19).
Newborn lambs were first observed in the Besa-Prophet during the first week of June during 2002 and 2003. Stone’s sheep generally selected for mid-elevations around 1700 m during the lambing season. They also selected for areas with high vegetation quality (Fig. 19) from the emergence of new plant growth. Burned areas have been identified as promoting plant growth earlier in the spring. The selection for these areas during the lambing season exposed sheep to the highest risk of bear and wolf predation relative to other seasons (Fig. 19). Range burning that maintains and creates open habitats and improves forage could be advantageous to Stone’s sheep (Seip and Bunnell 1985) unless mortality and interspecific competition override the benefits of associating with burn vegetation types. Both wolves and grizzly bears in the Besa-Prophet also benefit from range burning due to increased diversity and number of ungulates (Gasaway et al., 1983, Ballard et al., 2000) and promotion of seral vegetation (Nielsen et al. 2002).
The strength of selection for most habitat attributes was the lowest during summer when movements were more variable. All habitats became readily available to Stone’s sheep with the lack of snow at this time. The use of mineral licks also was highest during late summer and early fall. In summer, selection for wet alpine was most prevalent (Fig. 20). This vegetation type, which was typically covered by snow for much of the year, was one of the last habitats to green up in summer and may have provided small-scale nutritious microsites. Senescence of vegetation at high elevations may partially explain the attraction for lower elevation burns in fall (Fig. 20).
Besa-Prophet Stone’s Sheep
30
EWLW L S F R-1.5-1.0-0.50.00.51.01.5
EW LW L S R
-0.4-0.20.00.20.4
L S F
-0.4-0.20.00.20.4
EWLW L S F R
-0.4-0.20.00.20.4
EWLW L S F R
-1.5-1.0-0.50.00.51.01.5
EWLW L S F R-1.5-1.0-0.50.00.51.01.5
EWLW L S F R
-0.4-0.20.00.20.4
*
*
*
Bear risk
βi
Slope
βi
Curvature
βi
Wolf risk
Season
North
East
South
* *
L S
-0.4-0.20.00.20.4
*Vegetation quality
βi
SeasonEWLW L S F R
-1.5-1.0-0.50.00.51.01.5
*
West
*
*
*
* *
* *
*
*
*
* *
* * * *
*
*
**
*
*
**
*
** * * * *
* * *
βi
Figure 19. Habitat attributes from the best resource selection models by season for Stone’s sheep in the Besa-Prophet, 2002-2003. Selection coefficients (βi ± SE) for slope, curvature, wolf risk, bear risk, vegetation quality and four aspects are presented. Positive values indicate selection; negative values indicate avoidance. EW = early winter, LW = late winter, L = lambing, S = summer, F = fall, R = rut. * indicates selection coefficients are different from zero based on 95 % confidence intervals.

Besa-Prophet Stone’s Sheep
31
EWLW L S F R-1.5-1.0-0.50.00.51.01.5
EWLW L S F R-1.5-1.0-0.50.00.51.01.5
EWLW L S F R-1.5-1.0-0.50.00.51.01.5
EWLW L S F R-1.5-1.0-0.50.00.51.01.5
EWLW L S F R-1.5-1.0-0.50.00.51.01.5
EWLW L S F R-1.5-1.0-0.50.00.51.01.5
EWLW L S F R-1.5-1.0-0.50.00.51.01.5
EWLW L S F R-1.5-1.0-0.50.00.51.01.5
EWLW L S F R-1.5-1.0-0.50.00.51.01.5
S F-1.5-1.0-0.50.00.51.01.5
Season Season
βi
βi
βi
βi
βi
Rockcrust
Subalpine spruce
Riparian
Shrub Dry alpine
Wet alpine
Burn-deciduous
Burn-grassRocks
Coniferous
**
**
**
*
* ** * *
*
*
*
*
*
*
* *
****
*
* * *
* **
** *
**
**
* *** *
Figure 20. Vegetation types and their selection coefficients (βi ± SE) from the best resource selection models by season for Stone’s sheep in the Besa-Prophet, 2002-2003. Positive values indicate selection; negative values indicate avoidance. EW = early winter, LW = late winter, L = lambing, S = summer, F = fall, R = rut. * indicates selection coefficients are different from zero based on 95 % confidence intervals.

Besa-Prophet Stone’s Sheep
32
To generate mapped surfaces showing areas of relatively high selection value for
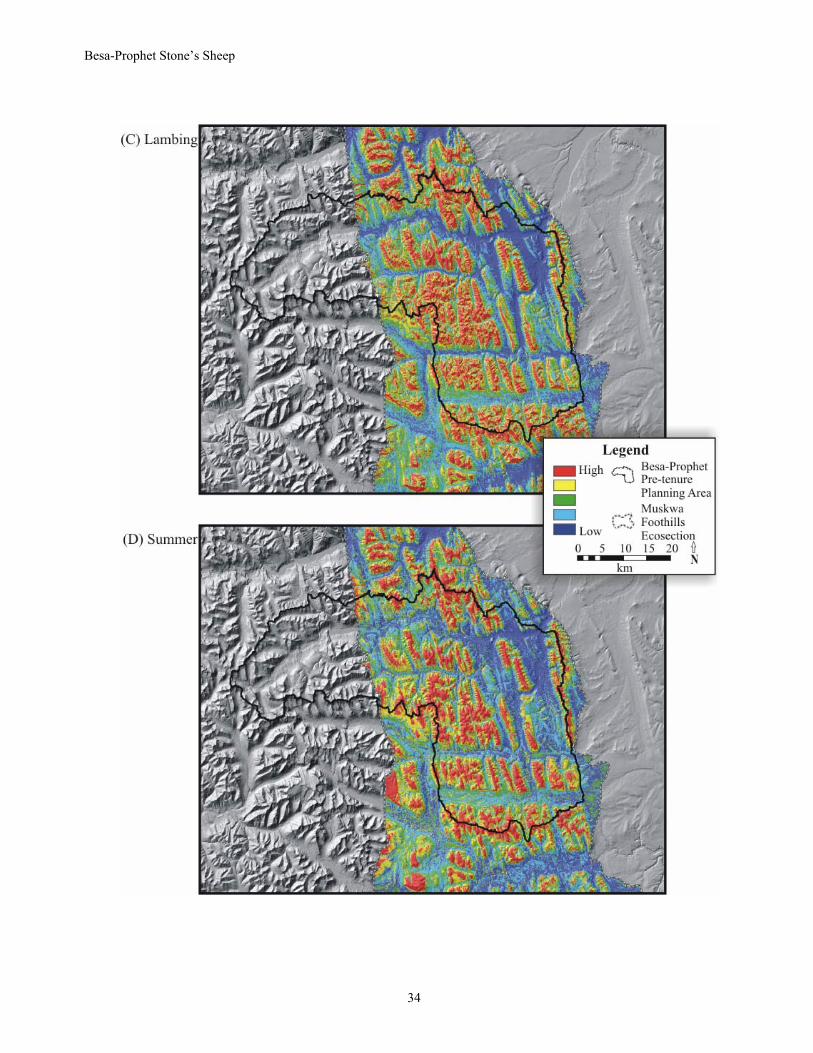
Stone’s sheep, the coefficients for the variables within each seasonal model were multiplied by their appropriate input layers and summed. Because the values are relative to each data set (e.g., season), they were scaled between zero and one and normalized for comparison among seasons. Each pixel within the mapped surface was given a relative value related to the relative selection value. All maps were plotted by quantiles of equal interval (0-0.2, 0.2-0.4, 0.4-0.6, 0.6-0.8, 0.8-1.0). Because seasonal selection maps were correlated between years (ranging from r = 0.81 during fall to r = 0.97 during early winter), we averaged the seasonal RSF values across years to create one map for each season over part of the Muskwa-Foothills ecosection (Fig. 21A-F). Areas that have the highest selection value for Stone’s sheep are on tops of ridges in spring, interspersed throughout the Besa-Prophet study area during summer, and on slopes bordering prominent valleys in fall.
Differences among the seasonal maps were most related to aspect, elevation and size of areas. Comparing early (Fig. 21A) and late winter (Fig. 21B), there was an increasing importance of south aspects, preference for lower elevations and smaller size of highly selected sites during late winter. With the beginning of the growing season and onset of lambing (Fig. 21C), Stone’s sheep associated with steep rocky areas in close proximity to areas where green-up was greatest. In summer (Fig. 21D) there was a marked increase in the size and contiguity of highly selected sites. Ridgelines and mountain tops, regardless of aspect, were used extensively during summer. In the fall, substantial use of burned areas by Stone’s sheep likely contributed to the relative increase in selection of south-facing slopes (Fig. 21E). Fall was also the only season when Stone’s sheep significantly avoided west aspects and the areas that were highly selected for were often associated with other aspects. During the breeding season (Fig. 21F) selection for steep slopes was least, even with an increase in selection for upper elevations. Early winter and rut are probably the hardest to differentiate except on the basis of slope; flatter sites along ridges and mountain tops were often rated as high selection value during rut. Some caution should be exercised when using these selection maps. Resource selection functions can result in unreliable estimates of selection if extrapolated beyond the definition of availability because available resources may differ between areas (Garshelis 2000). This limitation is most obvious in the designation of highly selected sites that do not have sheep or are rarely used by sheep. Klingzut Mountain, on the eastern edge of the Muskwa-Foothills boundary (Fig.14), is rarely if ever used by Stone’s sheep yet consistently contains areas ranked as high selection value. Therefore, expert knowledge regarding the distributions of animals outside the study area should be used to enhance the utility of selection models.

Besa-Prophet Stone’s Sheep
33
Fig. 21. Relative habitat selection value for Stone’s sheep ewes in the Muskwa-Foothills Ecosection.
Besa-Prophet Stone’s Sheep
34

Besa-Prophet Stone’s Sheep
35

Besa-Prophet Stone’s Sheep
36
Habitat Use in Relation to Pre-tenure Plans We compared the GPS use locations of the radio-collared Stone’s sheep in this study
with the habitat suitability index (HSI) model developed by Ministry of Environment staff (Rod Backmeyer, Fort St John) for Stone’s sheep during winter. The HSI model was based primarily on literature review and local accounts of high-use areas, and was developed to help rank the Besa-Prophet landscape using classes from 1 (high value) to 6 (low value) during pre-tenure planning processes. The Besa-Prophet Pre-tenure Plan incorporates a roll-up map from the HSI modelling efforts to be used across species. It categorizes habitats into zones, as defined by physical and topographical features (Table 5). We present our findings relative to both the Plan and suitability (HSI) models.
Table 5. Biophysical zones with wildlife value and management requirements in the pre-tenure planning areas of the Muskwa-Kechika Management Area (British Columbia Ministry of Sustainable Resource Management 2004). Not all biophysical zones are found in each plan area.
Code Pre-tenure Biophysical Zone
Description
LEW Wetlands – Low Elevation
Concentrated in valley bottoms and lowland areas. Consists of seasonal and year-round moisture saturated soils; watercourses and coniferous/deciduous forest patches can be dispersed throughout the wetland. Contains summer and critical winter habitat for moose, critical caribou habitat and high fisheries values. Various other wildlife species such as raptors, birds, rodents, furbearers, amphibians and reptiles inhabit this zone. High fisheries values are also found within this zone. The wetland zone is important for maintaining water quality and quantity.
HEW Wetlands – High Elevation
Located in mid to high elevation valley bottoms. Consists of seasonal and year-round moisture saturated soils. Minimal if any coniferous forest within or adjacent to this zone. Contains summer moose habitat, critical caribou winter habitat and year-round furbearer habitat.
MOS Mosaic Contains a mixture of forested and open habitats interspersed with wetlands, meadows, and forested lowlands and hills. The zone provides a mixture of foraging and security cover for ungulates. It contains critical winter habitat for moose and caribou; as well the older forested stands provide habitat for furbearer species.
IS Incised Stream Consists of steep-sloped stream-banks with flat upland areas. Important values include riparian habitat, fish, wildlife movement corridor and water quality and quantity. A mixture of ungulate security and foraging cover primarily on the uplands with a minor component on the steep slopes. Critical moose and elk winter habitat on the upland region.
MWA Warm Aspect Forest (moderate <45% slope)
Consists of both extensive tracks of coniferous tree species and open forested habitat on south-west aspect slopes of gentle to moderate sloped terrain and contains areas of old growth. Depending on the pre-tenure plan area, this zone can provide critical winter elk habitat depending on snow depths. Older forest stands are important year round habitat for a variety of furbearers, while younger willow stands provide critical winter moose habitat. Spring grizzly bear habitat is found on steeper slopes that experience early snowmelt.
CAF Cool Aspect Forest (<45% slope)
Consists of wet and cool forests that occur on gentle to moderately sloped terrain. Some forest stands may be interspersed with smaller interconnected wetland complexes. Older forested stands contain critical

Besa-Prophet Stone’s Sheep
37
winter caribou habitat and important year round habitat for a variety of furbearer species, while shrub areas provide critical moose habitat. Pockets of permafrost are found on north slopes in this habitat type. This zone is a wildlife movement corridor.
SWA Steep Slope Warm Aspect (>45% slope)
Consists of open and forested habitat on steep, southwest facing slopes. A variety of terrain features and habitat types are found in this zone including: alpine meadows, old growth forested stands, parkland, young forests, cliffs, rock outcrops and talus slopes. Furbearers are found in this zone. Steeper slopes are primarily open and provide critical winter Stone’s sheep habitat and important year round goat habitat. This zone also provides elk and moose winter habitat and birthing and rearing areas for Stone’s sheep, mountain goat and caribou. Higher zone elevations have lower biological productivity.
SCA Steep Slope Cool Aspect (>45% slope)
Consists of open and forested habitat on steep, northeast facing slopes, with pockets of permafrost found on north slopes. A variety of terrain features and habitat types are found in this zone including: alpine meadows, old growth forested stands, parkland, young forests, cliffs, rock outcrops and talus slopes. This zone is primarily mountainous terrain, highly visible throughout the plan area. Critical winter Stone’s sheep habitat borders a large portion of this zone. Steep slopes offer security habitat for caribou, elk and moose. This zone is important as a wildlife movement corridor, for Grizzly bear denning and furbearer habitat. Higher zone elevations have lower biological productivity.
HEP High Elevation Plateau Consists of high elevation plateaus, often surrounded by steep open and treed terrain. The plateaus are primarily open and consist of vegetation types that are particularly sensitive to disturbance due to low biological productivity, shallow soils and low moisture and nutrient conditions. Isolated pockets of coniferous forest are found on some plateaus. These areas are prone to strong winter winds and provide critical winter caribou habitat especially during winters of high snowfall.
FFP Forested Floodplain Low elevation zone and adjacent to the River Zone. Forested Floodplain zone width is variable, dependent on valley bottom topography. Forest cover is dominated by conifers. May contain stable side/back water channels. Provides foraging, security and thermal cover for a diverse range of wildlife, including: elk, moose, bear, and a variety of furbearers, raptors and songbirds.
RFP Major River Floodplain A low elevation zone characterized by braided streams bordered by a multi-layered forest canopy and understory. Waterflow varies throughout the year with peak flows generally occurring late spring and early summer. Year to year, the active water channel can change location within the floodplain. The zone provides foraging, security and thermal cover for a diverse range of wildlife, including: elk, moose, bear, furbearers, raptors, and songbirds. High fisheries values exist in this zone.
G Glacier Consists of areas that have year-round accumulations of ice and snow that exclude the establishment of any vegetation. During summer months, various ungulate species may use accessible portions of glaciers to mitigate high ambient temperatures and/or to seek a reprieve from blood sucking insects.
R River Stream flow varies throughout the year with peak flows generally occurring late spring and early summer. Year to year, the active channel can change location within this zone. High fisheries values exist in this zone. May contain forested islands.
RB River Breaks Consists of actively eroding unstable steep-sloped banks of various heights and lengths bordering watercourses.
Besa-Prophet Stone’s Sheep
38
The core areas used by Stone’s sheep in the Besa-Prophet are shown in Figure 2. These areas are based only on locations of radio-collared female sheep, and therefore, are a conservative estimate of use areas. Nonetheless, they are known use areas. Of note is that animals in the Ten Mile Lake area move back and forth across the Neves Valley. Similarly, Neves animals move across drainages between Mount Luckhurst and the Pocketknife area. These movements are likely to be affected if future access into the Besa-Prophet area follows valley bottoms. Each of the group areas is associated with one large mineral lick that receives greatest use in summer and fall. Even though Stone’s sheep may not spend much time in the corridors to and from licks per se, licks may play a significant role in the viability of each group (e.g., Ten Mile herd, Fig. 2).
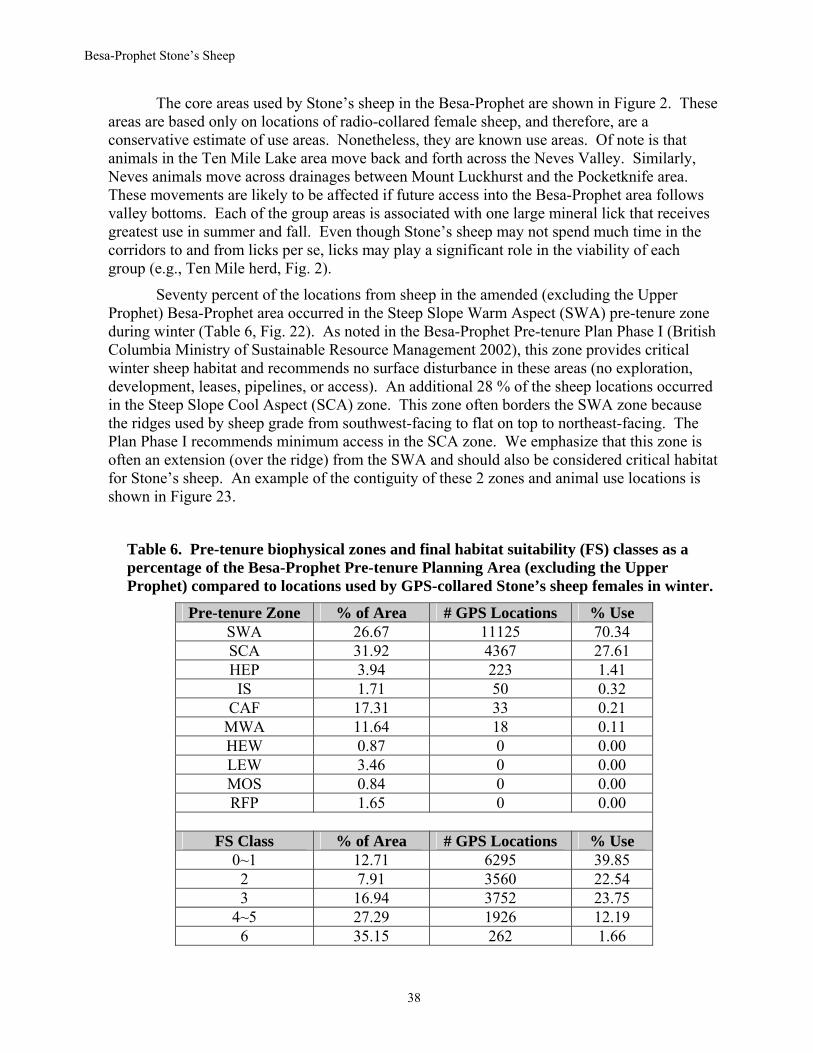
Seventy percent of the locations from sheep in the amended (excluding the Upper Prophet) Besa-Prophet area occurred in the Steep Slope Warm Aspect (SWA) pre-tenure zone during winter (Table 6, Fig. 22). As noted in the Besa-Prophet Pre-tenure Plan Phase I (British Columbia Ministry of Sustainable Resource Management 2002), this zone provides critical winter sheep habitat and recommends no surface disturbance in these areas (no exploration, development, leases, pipelines, or access). An additional 28 % of the sheep locations occurred in the Steep Slope Cool Aspect (SCA) zone. This zone often borders the SWA zone because the ridges used by sheep grade from southwest-facing to flat on top to northeast-facing. The Plan Phase I recommends minimum access in the SCA zone. We emphasize that this zone is often an extension (over the ridge) from the SWA and should also be considered critical habitat for Stone’s sheep. An example of the contiguity of these 2 zones and animal use locations is shown in Figure 23.
Table 6. Pre-tenure biophysical zones and final habitat suitability (FS) classes as a percentage of the Besa-Prophet Pre-tenure Planning Area (excluding the Upper Prophet) compared to locations used by GPS-collared Stone’s sheep females in winter.
Pre-tenure Zone % of Area # GPS Locations % Use SWA 26.67 11125 70.34 SCA 31.92 4367 27.61 HEP 3.94 223 1.41 IS 1.71 50 0.32
CAF 17.31 33 0.21 MWA 11.64 18 0.11 HEW 0.87 0 0.00 LEW 3.46 0 0.00 MOS 0.84 0 0.00 RFP 1.65 0 0.00
FS Class % of Area # GPS Locations % Use
0~1 12.71 6295 39.85 2 7.91 3560 22.54 3 16.94 3752 23.75
4~5 27.29 1926 12.19 6 35.15 262 1.66

Besa-Prophet Stone’s Sheep
39
Figure 22. Winter GPS locations of radio-collared female Stone’s sheep in the southern Besa-Prophet area, in relation to zones designated in the Besa-Prophet Pre-tenure Plan.
Management directions for the Neves Planning Unit in the original Besa-Prophet Pre-tenure Plan Phase I (British Columbia Ministry of Sustainable Resource Management 2002) do not emphasize the value of Stone’s sheep habitats, but rather concentrate on minimizing impacts to wetlands and the Redfern Trail. The Neves Valley, however, provides access to some of the most significant Stone’s sheep areas in the Besa-Prophet, and the steep warm aspect slopes (SWA) in the northern part of the unit should be guarded from commercial and recreational activities. Similarly, the adjacent Pocketknife Planning Unit provides critical areas for Stone’s sheep (Figs. 2, 14).
Across the Besa-Prophet, 62 % of the area was categorized as relatively poor class 4-6 suitability for Stone’s sheep. In contrast, 62 % of the locations for sheep were in the areas with the highest suitability (classes 1-3) (Table 6, Fig. 24). This emphasizes the importance of the higher-class areas that occur on only 38 % of the landscape. It also suggests that the evaluation used in the Ministry of Environment HSI modelling efforts reasonably reflects winter habitat values for Stone’s sheep. Slight differences in sample sizes between our GPS use locations relative to the pre-tenure biophysical zones and to habitat suitability classes occurred because of small differences in the boundaries of different map files.

Besa-Prophet Stone’s Sheep
40
Figure 23. Enlarged scale showing an example of the use of SWA and SCA zones in winter by radio-collared female Stone’s sheep in the southern Besa-Prophet area.

Besa-Prophet Stone’s Sheep
41
Winter Stone's sheep locations relative to Besa-Prophet pre-tenure zones
0
10
20
30
40
50
60
70
80
SWA SCA HEP IS CAF MWA
Pre-tenure Zone
Perc
ent (
%)
Percent of Stone's sheep winterlocations (n=15816)Percent of pre-tenure plan area
Winter Stone's sheep locations relative to winter habitat suitability classes
0
10
20
30
40
50
60
70
0~1 2 3 4~5 6
Habitat Suitability Class
Perc
ent (
%)
Percent of Stone's sheep winterlocations (n=15795)Percent of suitability classes in pre-tenure plan area
Figure 24. Winter GPS locations of radio-collared female Stone’s sheep in relation to pre-tenure biophysical zones designated in the Besa-Prophet Pre-tenure Plan and availability of winter habitat suitability classes (developed by British Columbia Ministry of Environment, Fort St John, BC).
Besa-Prophet Stone’s Sheep
42
MANAGEMENT RECOMMENDATIONS Rarely is there the opportunity to quantify the ecological relationships within relatively
undisturbed ecosystems and to obtain baseline control data that can be used subsequently to monitor impacts. The general trend in many ecological studies has been to examine a system that has already been impacted to some extent by human activity and then attempt to make inferences about how the system has changed. In our study, the potential to make important contributions towards maintaining predator-prey ecosystems is significant, especially because there has been relatively little human interference in the Besa-Prophet region to date. Our data from the Besa-Prophet provide inputs to a management and conservation framework that is based on observed, natural ecosystem function. We believe that planning processes should include knowledge of ecosystem-level processes, and that the challenge will be to compile and use data obtained at different scales (e.g., in-depth biological knowledge obtained from relatively small scales in studies such as ours, conservation area designs at larger scales, and cumulative impact frameworks). Sustainable management strategies for natural resources and effective planning processes in the Besa-Prophet must include details from studies such as this research on Stone’s sheep to best operationalize activity on the ground while still maintaining ecological integrity.
In order to minimize effects of development on Stone’s sheep, disturbances that allow access to specific sites (i.e., mineral licks) or alter important areas (e.g., winter range) should be kept low. Aircraft activity should be minimized around mid- and upper- elevations of south-facing aspects especially during winter and lambing. Strong selection for convex curvatures at upper elevations during summer indicates that aircraft activity near ridges and mountain tops is likely to disturb sheep at this time. Upper elevations on south- and west-facing aspects were consistently rated as highly selected by Stone’s sheep in the Muskwa-Foothills ecosection (Fig. 21A-F). Aircraft should travel well above the mountains or at low elevations along major drainages, away from mineral licks during summer and fall, to limit disturbances whenever possible. If roads and linear developments are necessary in the Besa-Prophet, access that restricts the movements of Stone’s sheep to mineral licks and different seasonal ranges should be minimized. Linear features should occur only in lower-elevation river valleys, but away from mineral licks and the areas used to access them. Movements by collared Stone’s sheep ewes indicated that the westerly portion of the Neves valley west of Tenmile Lake, the lower Neves valley along the eastern edge of Mt. Luckhurst, the valley separating Mt. Luckhurst from the mountain immediately east (locally known as Little Ram) and Richards Creek valley west of the confluence with Duffield Creek were regularly crossed by Stone’s sheep in order to access mineral licks (Fig. 2). If at all possible roads should not be developed within the Duffield Creek and Townsley Creek watersheds (Fig.2). These watersheds provide considerable amounts of contiguous habitat that are highly selected by Stone’s sheep (Fig. 21A-F). The drainages are often travelled through and across by Stone’s sheep accessing different ranges and licks. Fecal glucocorticoids could help to monitor physiological responses to future disturbance.

Besa-Prophet Stone’s Sheep
43
We recommend the following to incorporate this research into management decision-making and to follow up with projects that expand on our research findings in the Besa-Prophet:
1) Update the current Besa-Prophet Pre-tenure Plan. The Plan (British Columbia Ministry of Sustainable Resource Management 2004) allows for adaptive management and inclusion of new information. Our findings should be used to fine-tune the Plan if necessary. Inclusion of an appendix that provides recommended or suggested ways to minimize impacts on Stone’s sheep would be helpful to commercial and recreational users of the area. This could be accommodated easily by adding an appendix of much of the information that was provided for each of the Planning Units in the original Besa-Prophet Pre-tenure Plan Phase I (British Columbia Ministry of Sustainable Resource Management 2002).
2) Define timing and causes of mortality in Stone’s sheep populations. Data from our collared adult female Stone’s sheep suggested a fairly high rate of mortality (18.5 %). Besides not knowing the causes of that mortality (e.g., predation, poor body condition, habitat availability), we also do not know if this is representative of other age and sex classes of sheep. There is some anecdotal evidence based on few survey flights that highest levels of mortality on lambs may occur during fall (unlike the spring and early summer seasons for many other ungulates) (J. Elliott, pers. comm.).
3) Define consequences of range burning. If prescribed burns are enabling increases in elk (Cervus elaphus) populations in the Besa-Prophet, there is potential for competition between elk and Stone’s sheep during some times of the year. There is also the potential that with expanding elk populations, wolf numbers will also increase. If so, it is likely that wolves will expand into broader areas and encounter sheep, potentially playing a more significant role in the population dynamics of Stone’s sheep.
Additional details of all methodologies, analyses, and results can be found in Andrew Walker’s Master of Science thesis at the University of Northern British Columbia:
Walker, A.B.D. 2005. Habitat selection and behavioural strategies of Stone’s sheep in northern British Columbia. M.Sc. Natural Resources and Environmental Studies (Biology), University of Northern British Columbia, Prince George. 204 pp.
The following scientific articles also have been published:
Walker, A.B.D., K.L. Parker, and M.P. Gillingham. 2006. Behaviour, habitat associations and intrasexual differences of female Stone’s sheep. Canadian Journal of Zoology 84: 1187-1201.
Walker, A.B.D., K.L. Parker, M.P. Gillingham, D.D. Gustine, and R.J. Lay. 2007. Habitat selection and movements of Stone’s sheep in relation to vegetation, topography and risk of predation. 2007. Ecoscience 14: 55-70.

Besa-Prophet Stone’s Sheep
44
Walker, A.B.D. and K.L. Parker. 2007. Fecal glucocorticoid concentrations of free-ranging Stone’s sheep. In press. Biennial Symposium of the Northern Wild Sheep and Goat Council.
ACKNOWLEDGMENTS Support for this study was provided by the Muskwa-Kechika Trust Fund, the
Foundation for North American Wild Sheep (FNAWS), the British Columbia Ministry of Environment, and the University of Northern British Columbia’s Northern Land Use Institute.
We (Fig. 25) extend particular thanks to Greg Williams who helped familiarize us with the Besa-Prophet landscape. Greg’s knowledge of the area and the use of the Keily Creek airstrip and cabins were invaluable. Rob Woods, with the British Columbia Ministry of Environment, captured and collared all of the animals monitored in this study. In addition to his efforts, we thank pilots Olivier Amar, Neil Mavin, Andrew Moore, and Greg Williams. Behavioural observations were done by Greg Blackburn, Becky Cadsand, Jesse Laframboise, and Travis Lundberg (Figs. 26, 27). We appreciate those who also lent assistance in the field or lab (Jeremy Ayotte, Scott Emmons, Dave Gustine, Bobbi Lay, Brian Milakovic). We are grateful to Mike Gillingham, Doug Heard, and Chris Johnson for ecological and analytical contributions.
Figure 25. Authors Andrew Walker and Kathy Parker, University of Northern British Columbia.
M. Gillingham
R. Botting

Besa-Prophet Stone’s Sheep
45
Figure 26. Personnel conducting behavioural observations of Stone’s sheep in the Besa-Prophet, 2002: Greg Blackburn and Andrew Walker.
Figure 27. Personnel conducting behavioural observations of Stone’s sheep in the Besa-Prophet, 2003: Travis Lundberg, Jesse LaFramboise, Becky Cadsund, and Andrew Walker.
K.Parker

Besa-Prophet Stone’s Sheep
46
LITERATURE CITED Ballard, W.B., Krausman, P.R., Boe, S., Cunningham, S., and Whitlaw, H.A. 2000. Short-term
response of gray wolves (Canis lupus) to wildfire in northwestern Alaska. Canadian Field-Naturalist 114: 241-247.
Bergerud, A.T., and Elliott, J.P. 1998. Wolf predation in a multiple-ungulate system in northern British Columbia. Canadian Journal of Zoology 76: 1551-1569.
Bleich, V.C., Bowyer, R.T., Pauli, A.M., Nicholson, M.C., and Anthes, R.W. 1994. Mountain sheep (Ovis canadensis) and helicopter surveys: ramifications for the conservation of large mammals. Biological Conservation 70: 1-7.
Boyce, M.S., and McDonald, L.L. 1999. Relating populations to habitats using resource selection functions. Trends in Ecology and Evolution 14: 268-272.
British Columbia Ministry of Sustainable Resource Management 2002. Besa-Prophet Pre-Tenure Plan - Phase I. Available on the internet at: http://ilmbwww.gov.bc.ca/ilmb/lup/lrmp/northern/mk/pdf/MK_pretenure_besaprophet_Phase1.pdf (accessed on 28 March 2007).
British Columbia Ministry of Sustainable Resource Management 2004. Pre-Tenure Plans for Oil and Gas Development in the Muskwa-Kechika Management Area. Available on the internet at: http://www.empr.gov.bc.ca/subwebs/oilandgas/ptp/ptp.htm (accessed on 28 March 2007).
Burles, D.W., and Hoefs, M. 1984. Winter mortality of Dall sheep, Ovis dalli dalli, in Kluane National Park, Yukon. Canadian Field-Naturalist 98: 479-484.
Demarchi, R.A., and Hartwig, C.L. 2004. Status of thinhorn sheep in British Columbia. Wildlife Bulletin No. B-119. British Columbia Ministry of Water, Land and Air Protection, Victoria, British Columbia, Canada.
Frid, A. 2003. Dall's sheep responses to overflights by helicopter and fixed-wing aircraft. Biological Conservation 110: 387-399.
Garshelis, D.L. 2000. Delusions in habitat evaluation: measuring use, selection, and importance. In Research techniques in animal ecology: controversies and consequences. Edited by L. Boitani and T.K. Fuller. Columbia University Press, New York, New York, USA. pp. 111-164.
Gasaway, W.C., Stephenson, R.O., Davis, J.L., Shepherd, P.E.K., and Burris, O.E. 1983. Interrelationships of wolves, prey, and man in interior Alaska. Wildlife Monograph 84: 1-50.
Geist, V. 1971. Mountain sheep: a study in behavior and evolution. The University of Chicago Press, Chicago, Illinois, USA.

Besa-Prophet Stone’s Sheep
47
Harlow, H.J., Thorne, T,E, Williams, E.S., Belden, E.L., and Gern, W.A.. 1987. Cardiac frequency: a potential predictor of blood cortisol levels during acute and chronic stress exposure in Rocky Mountain bighorn sheep (Ovis canadensis canadensis). Canadian Journal of Zoology 65: 2028-2034.
Hoefs, M., and Cowan, I.M. 1979. Ecological investigation of a population of Dall sheep (Ovis dalli dalli Nelson). Syesis 12: 1-81.
Jennrich, R.I., and Turner, F.B. 1969. Measurement of noncircular home range (terrestrial vertebrates). Journal of Theoretetical Biology 22: 227-237.
Lay, R.J. 2005. Use of Landsat TM and ETM+ to describe intra-season change in vegetation with consideration for wildlife management. M.Sc. thesis, University of Northern British Columbia, Prince George, British Columbia, Canada.
Luckhurst, A.J. 1973. Stone sheep and their habitat. M.Sc. thesis, University of British Columbia, Vancouver, British Columbia, Canada.
MacArthur, R.A., Geist, V., and Johnston, R.H. 1982. Cardiac and behavioural responses of mountain sheep to human disturbance. Journal of Wildlife Management 46: 351-358.
Manly, B.F.J., McDonald, L.L., Thomas, D.L., McDonald, T.L., and Erickson, W.P. 2002. Resource selection by animals: statistical design and analysis for field studies. Kluwer Academic Publishers, Dordrecht, The Netherlands.
Meidinger, D., and Pojar, J. 1991. Ecosystems of British Columbia: special report series 6. British Columbia Ministry of Forests, Crown Publications Inc., Victoria, British Columbia, Canada.
Mech, L.D. 1994. Buffer zones of territories of gray wolves as regions of intraspecific strife. Journal of Mammalogy 75: 199-202.
Millspaugh, J.J., and Washburn, B.E. 2004. Use of fecal glucocorticoid metabolite measures in conservation biology research: considerations for application and interpretation. General and Comparative Endocrinology 138: 189-199.
Moberg, G.P. 1987. Problems in defining stress and distress in animals. American Veterinary Medical Association. Journal 191: 1207-1211.
Nichols, L., and Bunnell, F.L. 1999. Natural history of thinhorn sheep. In Mountain sheep of North America. Edited by R. Valdez and P.R. Krausman. The University of Arizona, Tuscon, Arizona, USA. Pp. 23-77.
Nielsen, S.E., Boyce, M.S., Stenhouse, G.B., and Munro, R.H.M. 2002. Modeling grizzly bear habitats in the Yellowhead ecosystem of Alberta: taking autocorrelation seriously. Ursus 13: 45-56.
Paquet, M.M., and Demarchi, R.A. 1999. Stone’s sheep of the northern Rockies: the effects of

Besa-Prophet Stone’s Sheep
48
access. Foundation for North American Wild Sheep, Cody, Wyoming, USA and Guide-Outfitters Association of B.C., Richmond, British Columbia Canada.
Seip, D.R. 1983. Foraging ecology and nutrition of Stone's sheep. Ph.D. thesis, University of British Columbia, Vancouver, British Columbia, Canada.
Seip, D.R., and Bunnell, F.L. 1985. Nutrition of Stone's sheep on burned and unburned ranges. Journal of Wildlife Management 49: 397-405.
Simmons, N.M., Bayer, M.B., and Sinkey, L.O. 1984. Demography of Dall's sheep in the Mackenzie Mountains, Northwest Territories. Journal of Wildlife Management 48: 156-162.
Stockwell, C.A., Bateman, G.C., and Berger, J. 1991. Conflicts in national parks: a case study of helicopters and bighorn sheep time budgets at the Grand Canyon. Biological Conservation 56: 317-328.
Valdez, R., and Krausman, P.R. 1999. Description, distribution, and abundance of mountain sheep in North America. In Mountain sheep of North America. Edited by R. Valdez and P.R. Krausman. The University of Arizona Press, Tucson, Arizona, USA. pp. 3-22.
Walker, A.B.D. 2005. Habitat selection and behavioural strategies of Stone’s sheep in northern British Columbia. M.Sc. thesis, University of Northern British Columbia, Prince George, British Columbia, Canada.
Wasser, S.K., Hunt, K.E., Brown, J.L., Cooper, K., Crockett, C.M., Bechert, U., Millspaugh, J.J., Larson, S., and Monfort, S.L. 2000. A generalized fecal glucocorticoid assay for use in a diverse array of nondomestic mammalian and avian species. General and Comparative Endocrinology 120: 260-275.
Worley, K., Strobeck, C., Arthur, C., Carey, J., Schwantje, H., Veitch, A., and Coltman, D.W. 2004. Population genetic structure of North American thinhorn sheep (Ovis dalli). Molecular Ecology 13: 2545-2556.