hab app harmful algal bloom classification - epa.gov · harmful algal bloom smart device...
TRANSCRIPT
HARMFUL ALGAL BLOOM SMART DEVICE APPLICATION AND FIXED CAMERA
MONITORING: USING MACHINE LEARNING TECHNIQUES FOR CLASSIFICATION OF
HARMFUL ALGAL BLOOMS
MICHAEL WATERS
NORTHERN KENTUCKY UNIVERSITY
DEPARTMENT OF MATHEMATICS AND STATISTICS
JIM LAZORCHAK & JOEL ALLEN, USEPA OFFICE OF RESEARCH AND DEVELOPMENT
OCTOBER 23, 2018

600+ Mile Long Ohio River Blue-Green Algae Bloom, Summer 2015
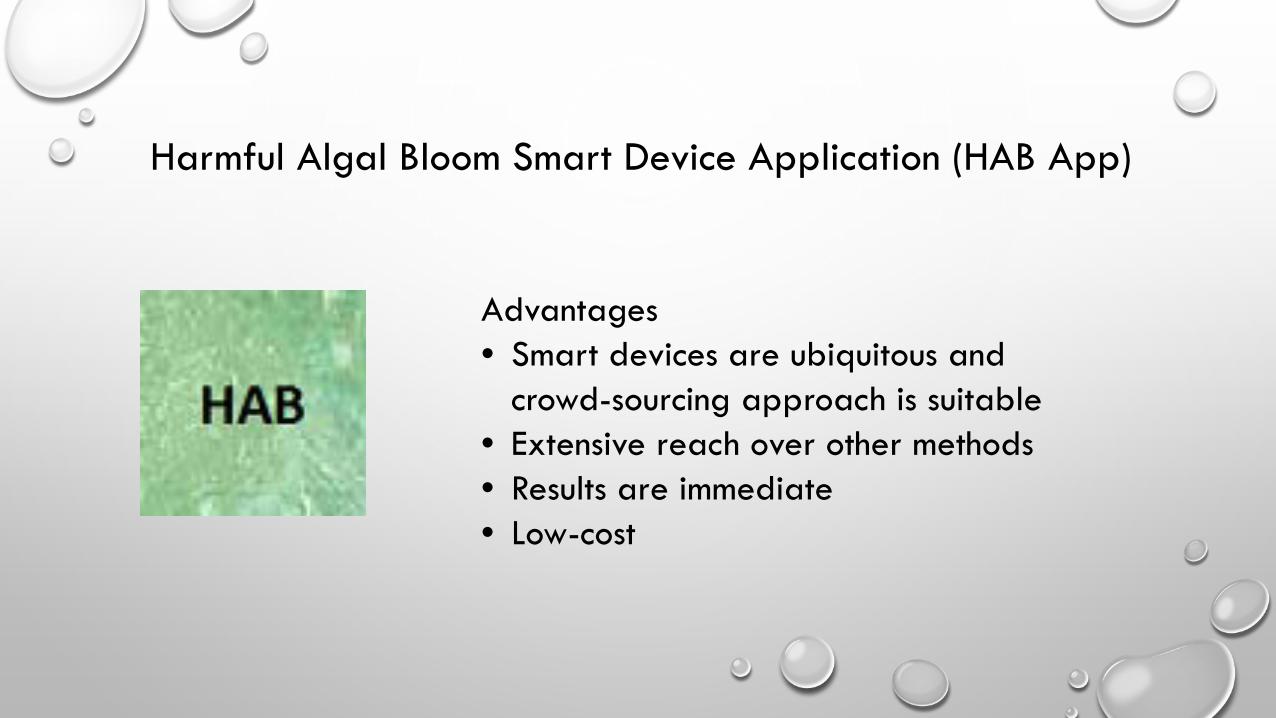
Harmful Algal Bloom Smart Device Application (HAB App)
Advantages• Smart devices are ubiquitous and
crowd-sourcing approach is suitable• Extensive reach over other methods• Results are immediate• Low-cost
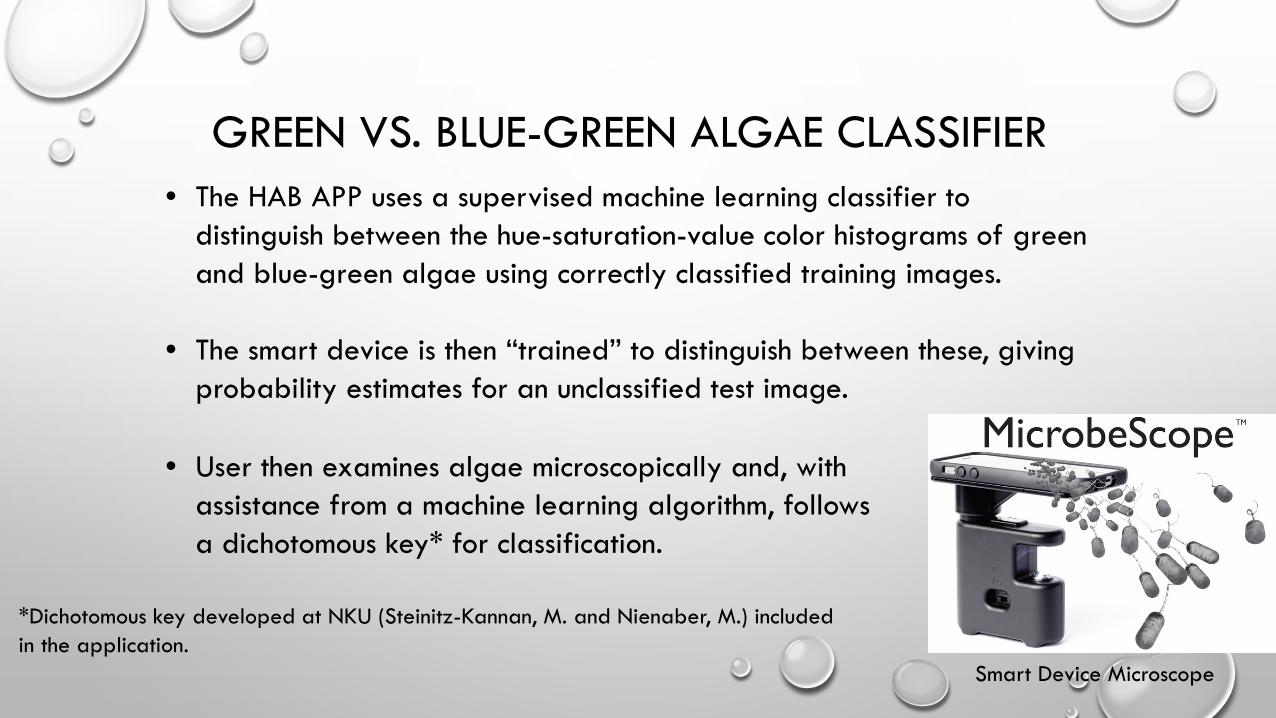
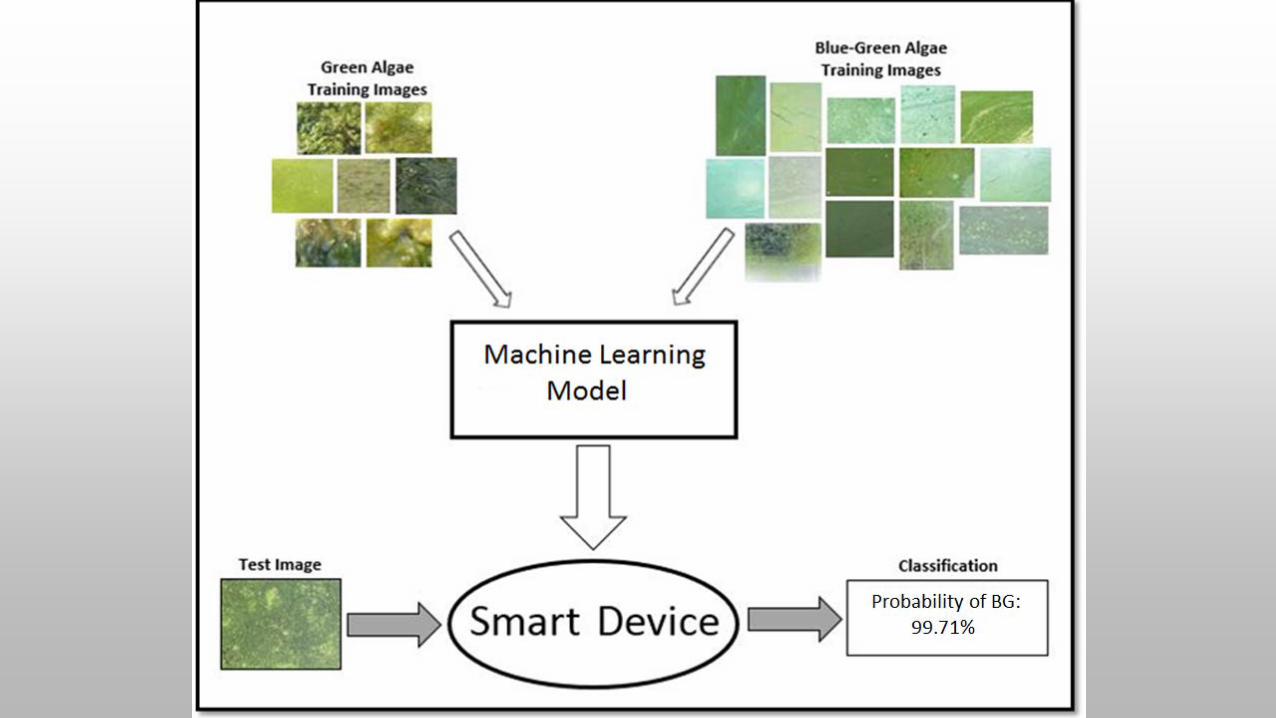
GREEN VS. BLUE-GREEN ALGAE CLASSIFIER• The HAB APP uses a supervised machine learning classifier to
distinguish between the hue-saturation-value color histograms of green and blue-green algae using correctly classified training images.
• The smart device is then “trained” to distinguish between these, giving probability estimates for an unclassified test image.
• User then examines algae microscopically and, with assistance from a machine learning algorithm, follows a dichotomous key* for classification.
Smart Device Microscope
*Dichotomous key developed at NKU (Steinitz-Kannan, M. and Nienaber, M.) included in the application.
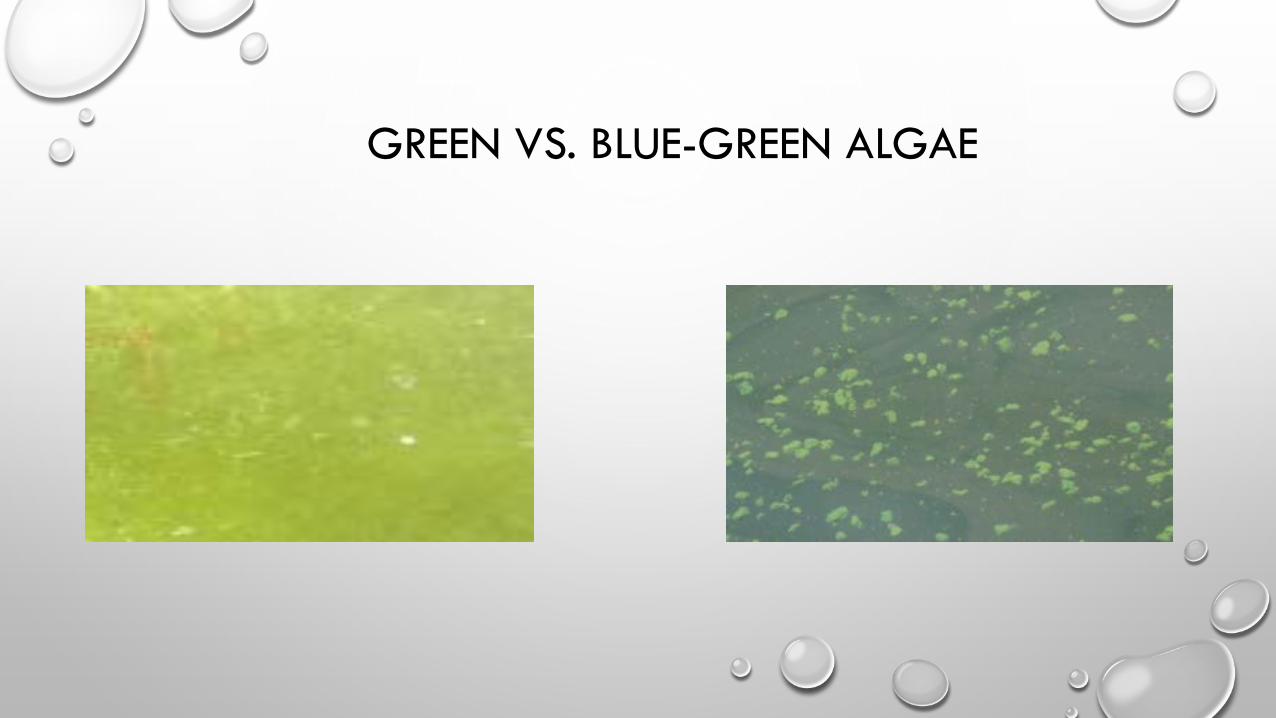
GREEN VS. BLUE-GREEN ALGAE
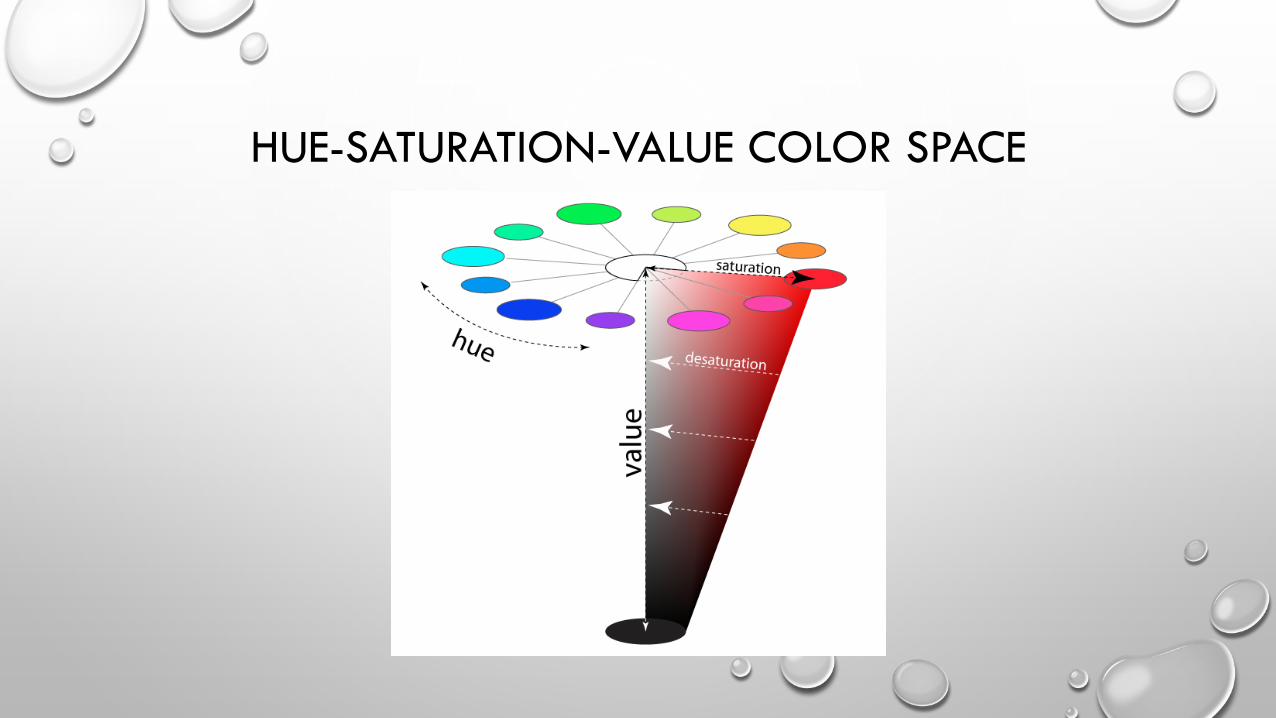
HUE-SATURATION-VALUE COLOR SPACE
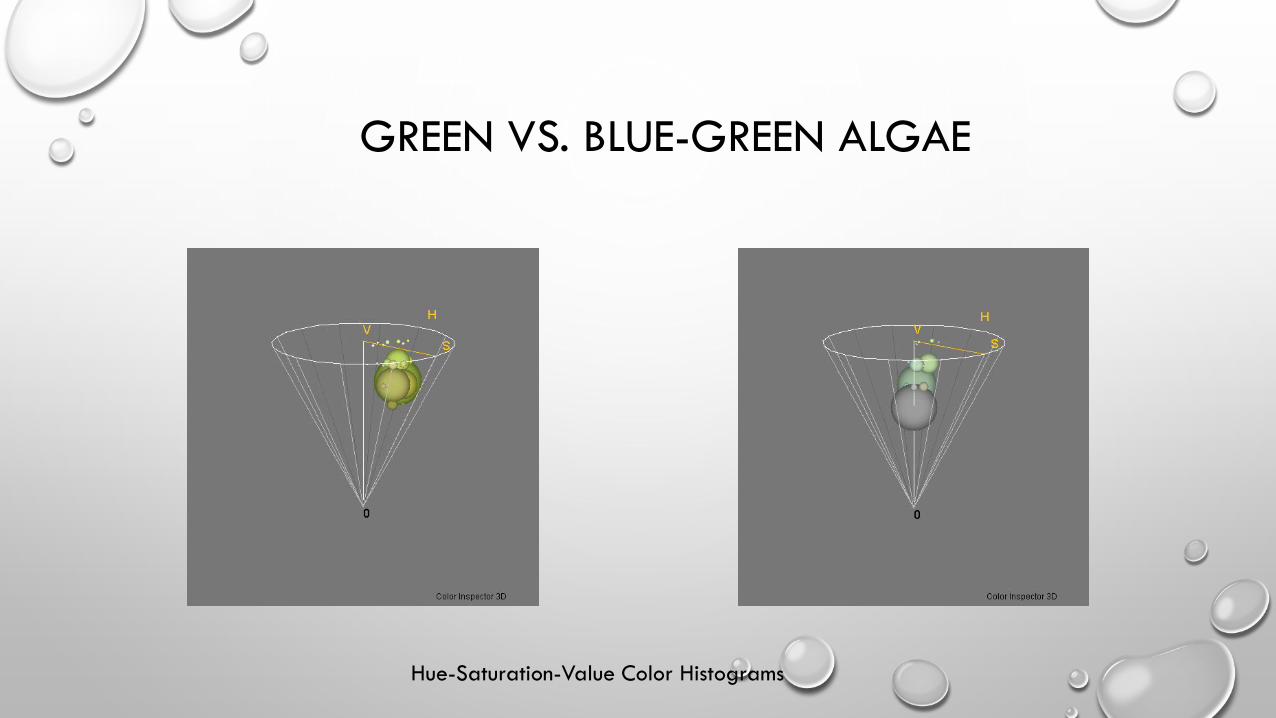
GREEN VS. BLUE-GREEN ALGAE
Hue-Saturation-Value Color Histograms
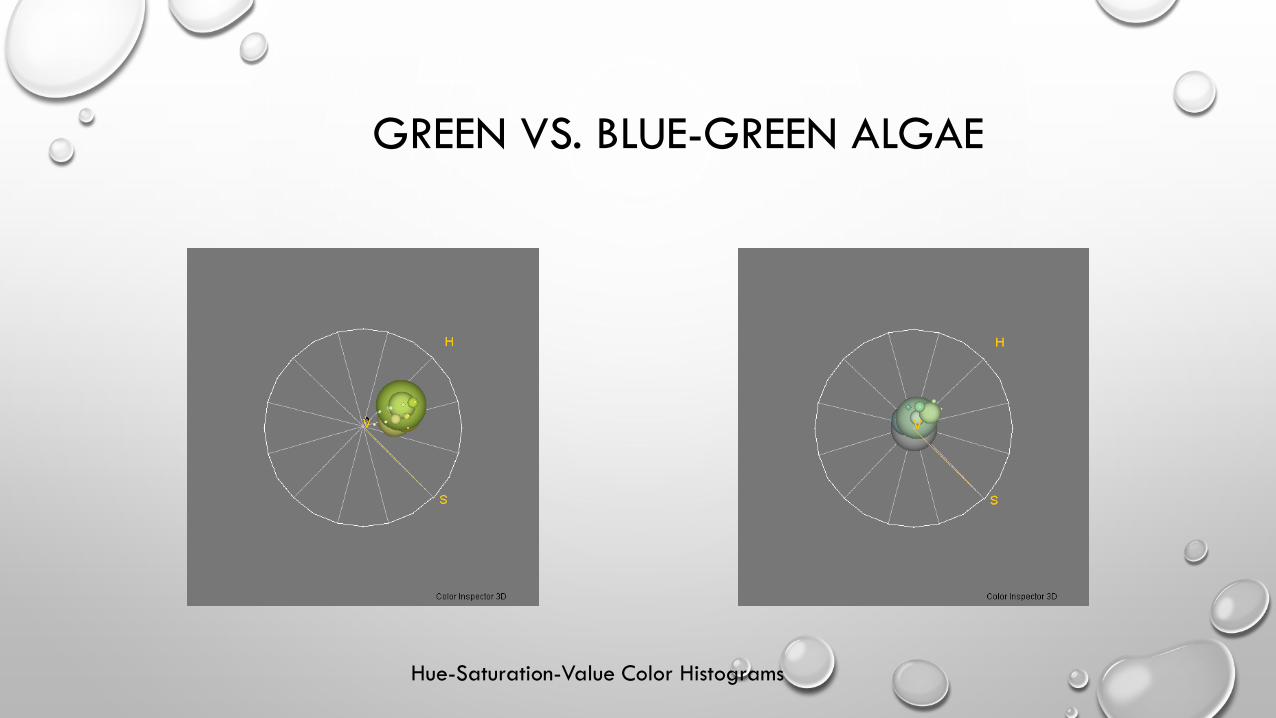
GREEN VS. BLUE-GREEN ALGAE
Hue-Saturation-Value Color Histograms
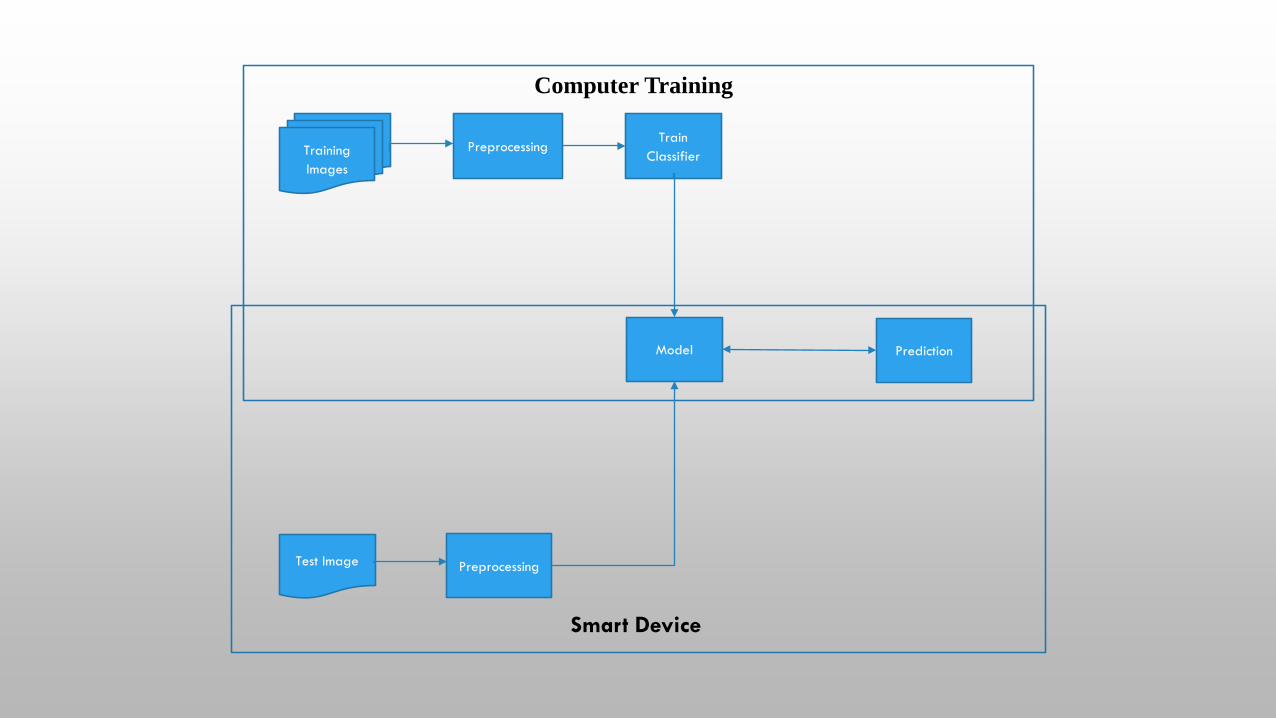
Training Images
PreprocessingTrain
Classifier
Model
Test Image Preprocessing
Prediction
Smart Device
Computer Training
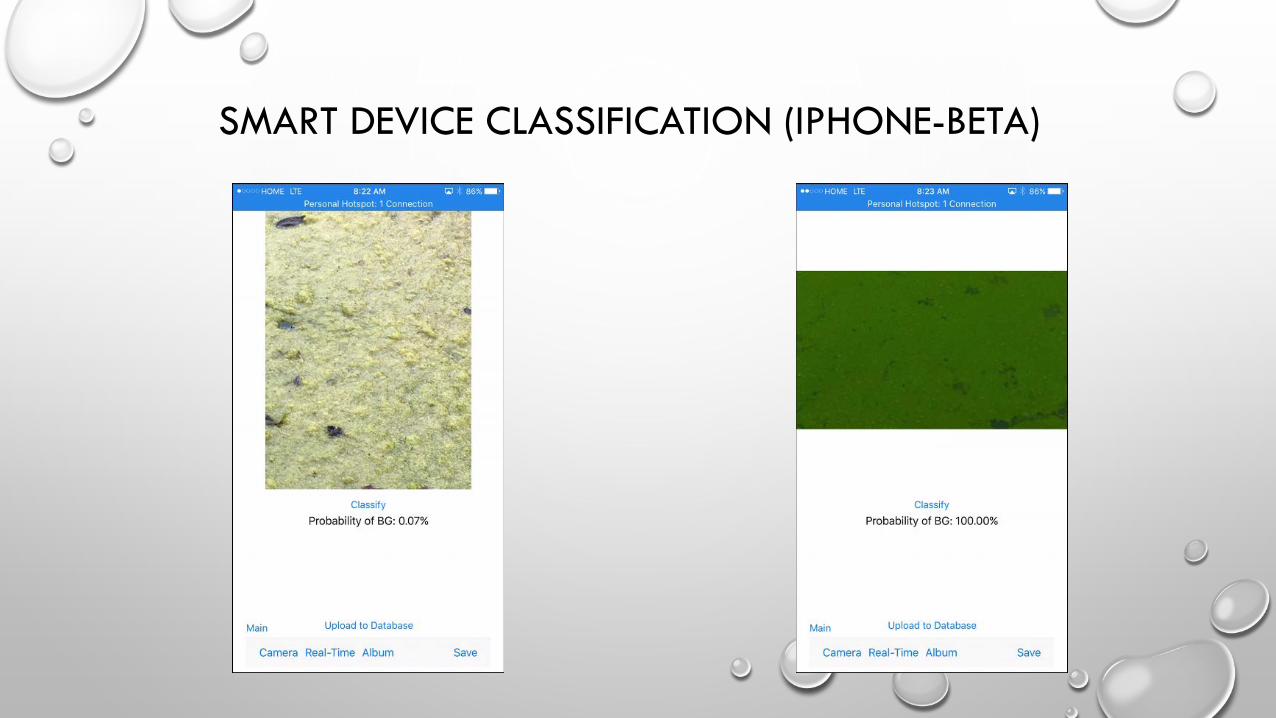
SMART DEVICE CLASSIFICATION (IPHONE-BETA)

PERFORMANCE
Confusion Matrix (70/30)n=52
PredictedGreen Blue-
Green
Act
ual Green 6 0
Blue-Green 0 9
95% Confidence Interval: (0.78,1)
Assuming a representative random sample of test images, we can be 95% confident that the accuracy is greater than 78%.

FIXED CAMERA MONITORING
• High Definition Security Camera with WiFi capability
• Powered by plug-in connection or solar array
• Images sent to server hourly during daylight hours
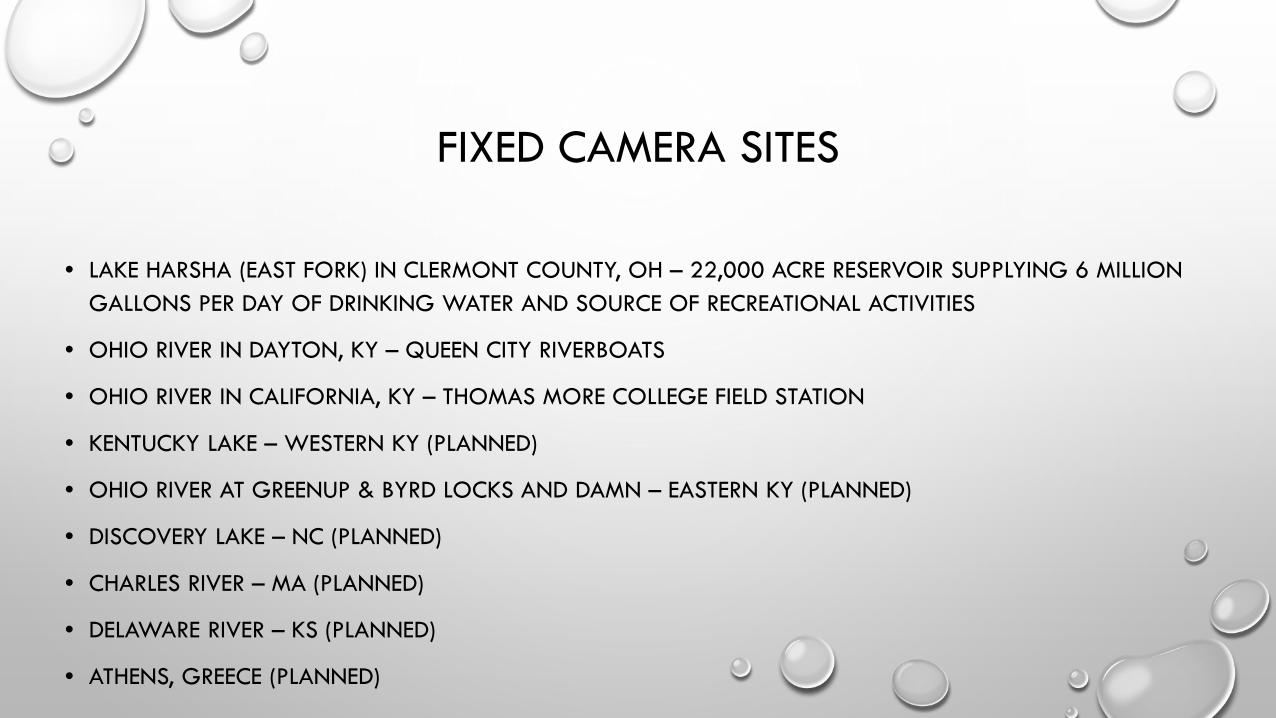
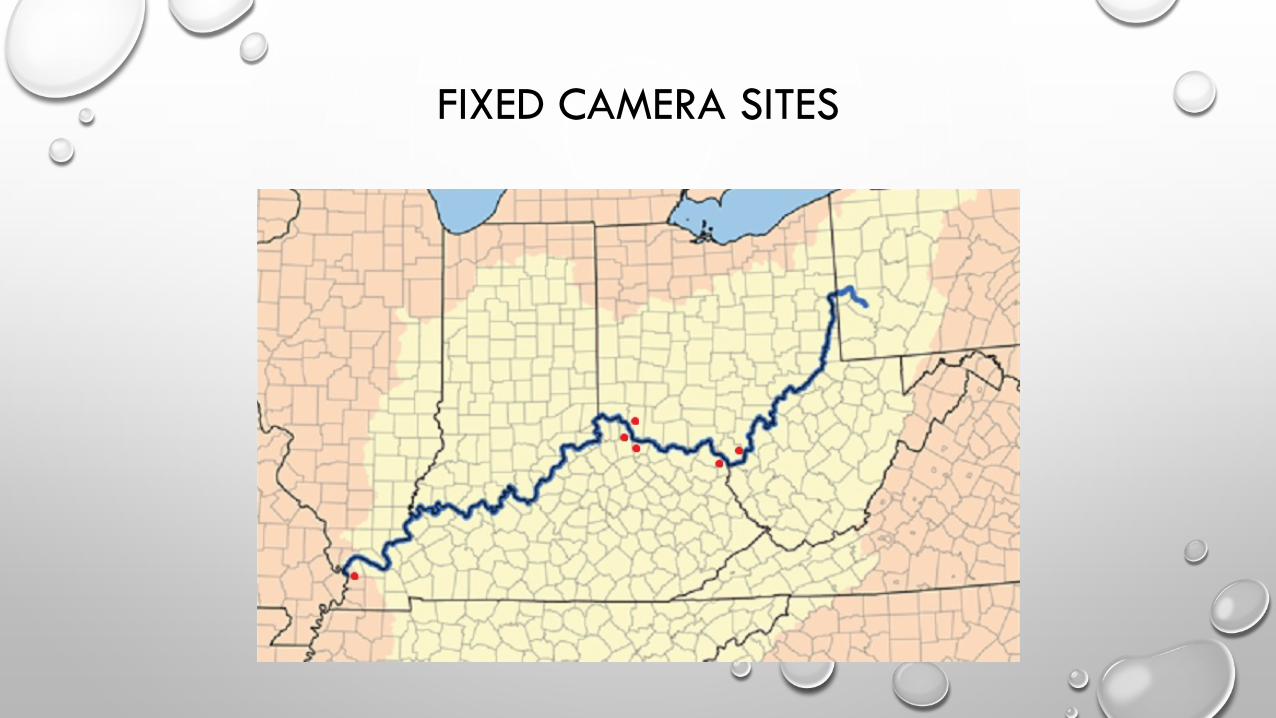
FIXED CAMERA SITES
• LAKE HARSHA (EAST FORK) IN CLERMONT COUNTY, OH – 22,000 ACRE RESERVOIR SUPPLYING 6 MILLION GALLONS PER DAY OF DRINKING WATER AND SOURCE OF RECREATIONAL ACTIVITIES
• OHIO RIVER IN DAYTON, KY – QUEEN CITY RIVERBOATS
• OHIO RIVER IN CALIFORNIA, KY – THOMAS MORE COLLEGE FIELD STATION
• KENTUCKY LAKE – WESTERN KY (PLANNED)
• OHIO RIVER AT GREENUP & BYRD LOCKS AND DAMN – EASTERN KY (PLANNED)
• DISCOVERY LAKE – NC (PLANNED)
• CHARLES RIVER – MA (PLANNED)
• DELAWARE RIVER – KS (PLANNED)
• ATHENS, GREECE (PLANNED)
FIXED CAMERA SITES
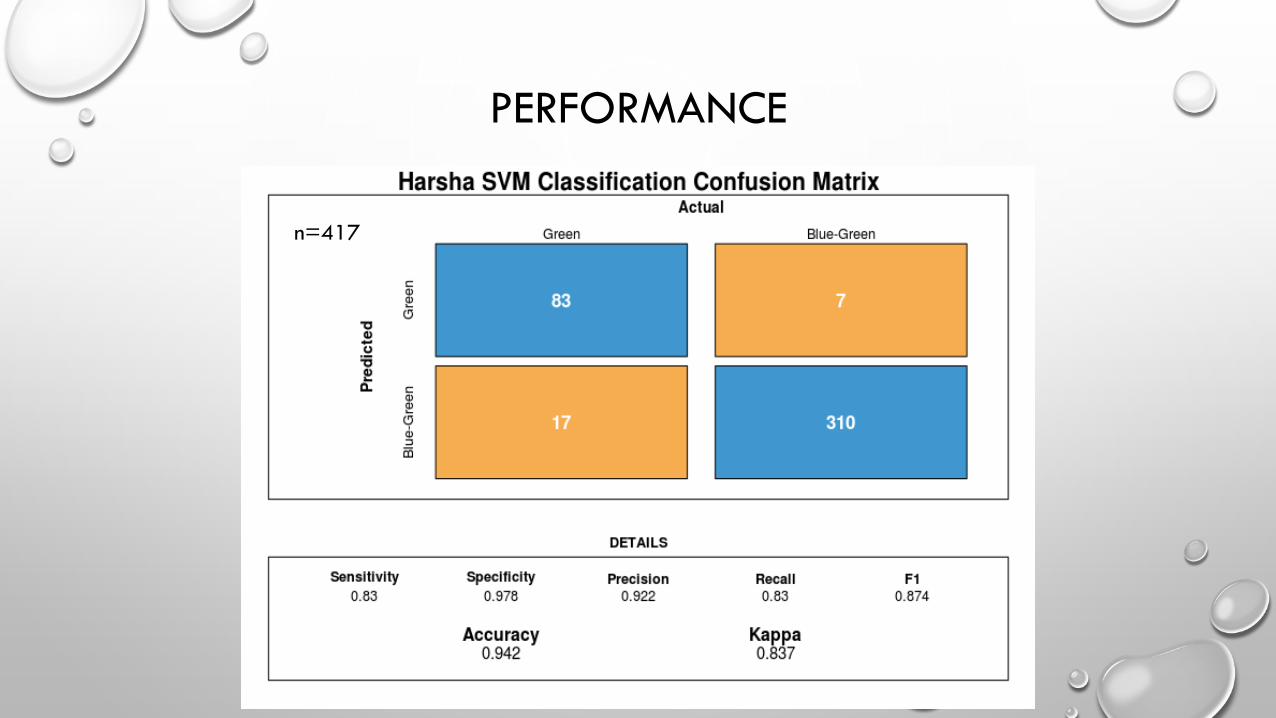
PERFORMANCE
n=417

SQL Server
R Statistics
Builds models forclassification
Smart Device
Camera 1(Harsha)
Camera 2
AdditionalCameras
Web Server
Models specificto location
.
.
.
Smart DeviceModel
Central Server
Raw images withclassificationvia URL connection
Raw imagesfrom camerasvia FTP
Verification by scientists in vitroand with otherdetection devices.
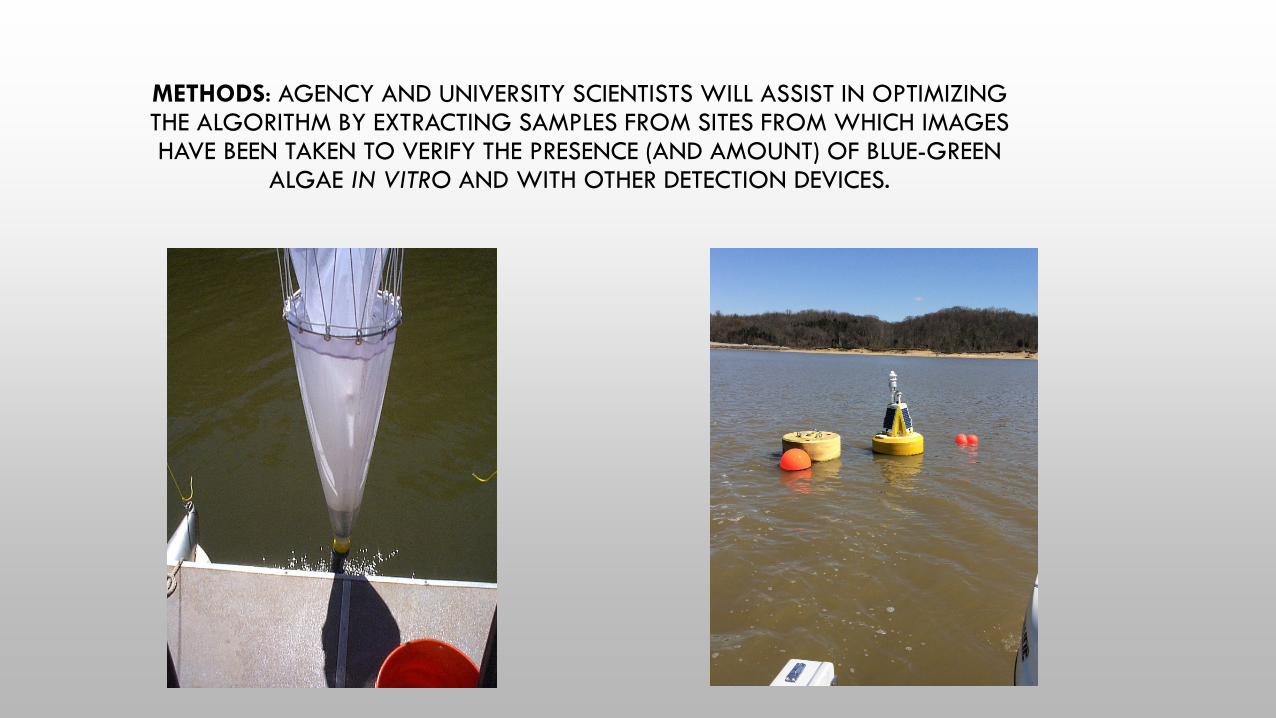
METHODS: AGENCY AND UNIVERSITY SCIENTISTS WILL ASSIST IN OPTIMIZING THE ALGORITHM BY EXTRACTING SAMPLES FROM SITES FROM WHICH IMAGESHAVE BEEN TAKEN TO VERIFY THE PRESENCE (AND AMOUNT) OF BLUE-GREEN
ALGAE IN VITRO AND WITH OTHER DETECTION DEVICES.
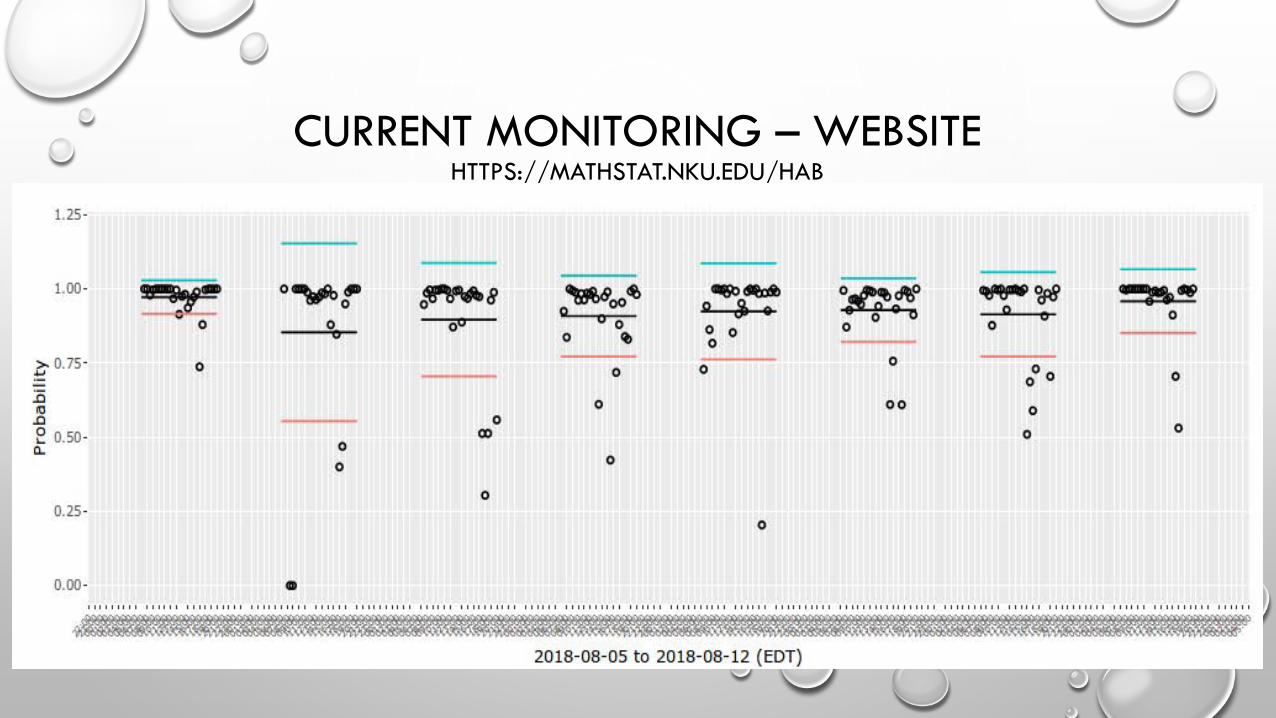
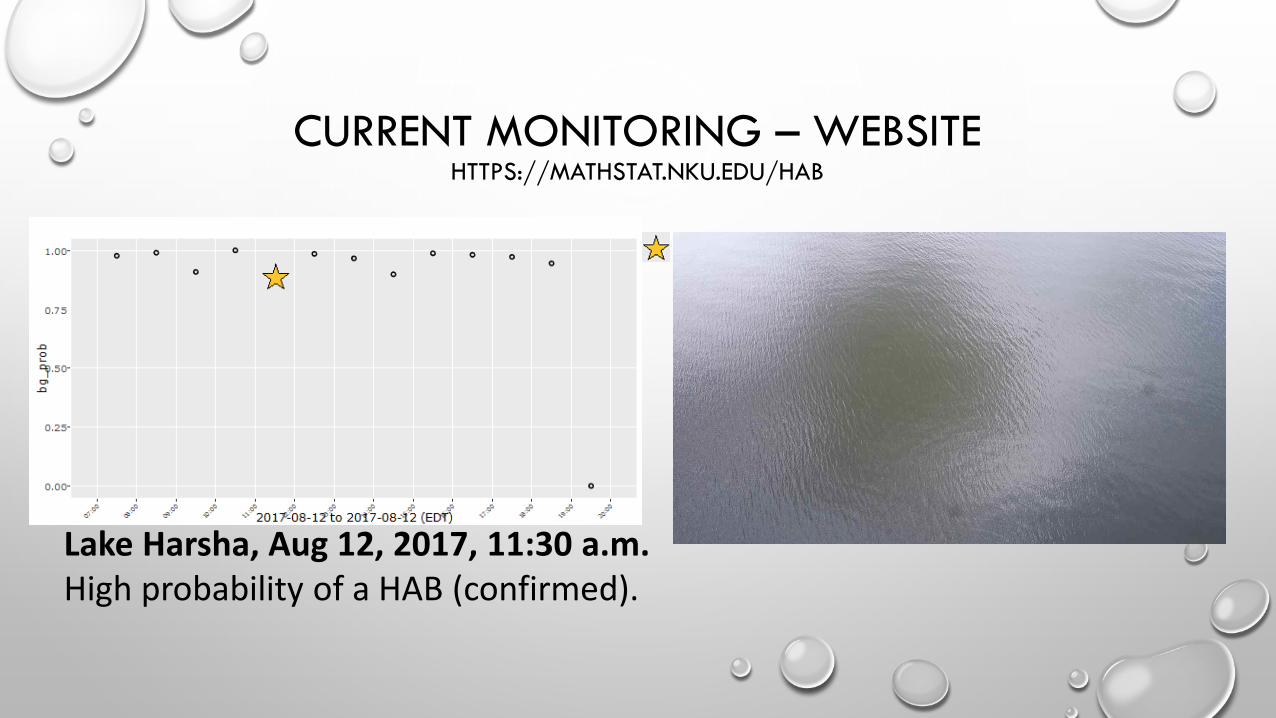
CURRENT MONITORING – WEBSITEHTTPS://MATHSTAT.NKU.EDU/HAB
CURRENT MONITORING – WEBSITEHTTPS://MATHSTAT.NKU.EDU/HAB
Lake Harsha, Aug 12, 2017, 11:30 a.m.High probability of a HAB (confirmed).
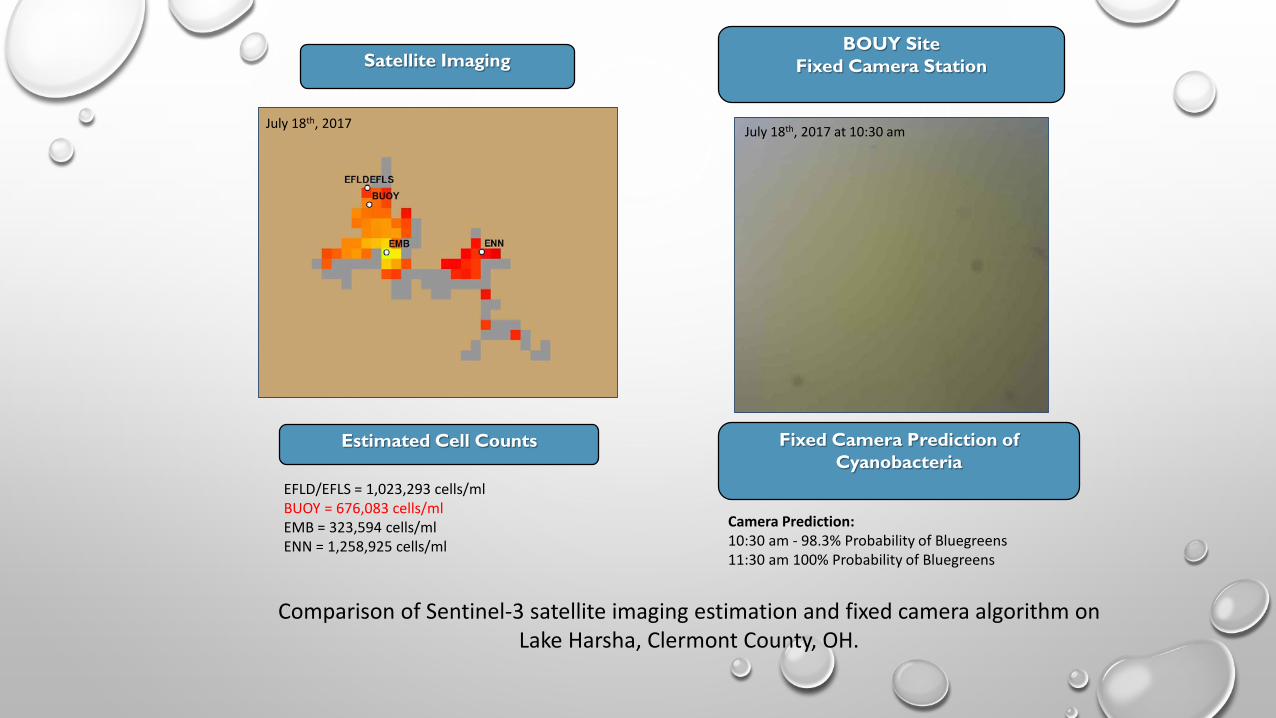
EFLD/EFLS = 1,023,293 cells/mlBUOY = 676,083 cells/mlEMB = 323,594 cells/mlENN = 1,258,925 cells/ml
Satellite Imaging
Estimated Cell Counts
Camera Prediction:10:30 am - 98.3% Probability of Bluegreens11:30 am 100% Probability of Bluegreens
BOUY SiteFixed Camera Station
Fixed Camera Prediction of Cyanobacteria
July 18th, 2017 at 10:30 amJuly 18th, 2017
Comparison of Sentinel-3 satellite imaging estimation and fixed camera algorithm on Lake Harsha, Clermont County, OH.

Hue-Saturation-Value Color Distributions for Lake Harsha – In Bloom07/18/17 – 08/13/17

7:30 am 8:30 9:30 10:30 11:30
12:30 pm 1:30 4:30
6:30 7:30
2:30 3:30
5:30
Hourly Hue Color Variation for Lake Harsha – In Bloom07/18/17 – 08/13/17
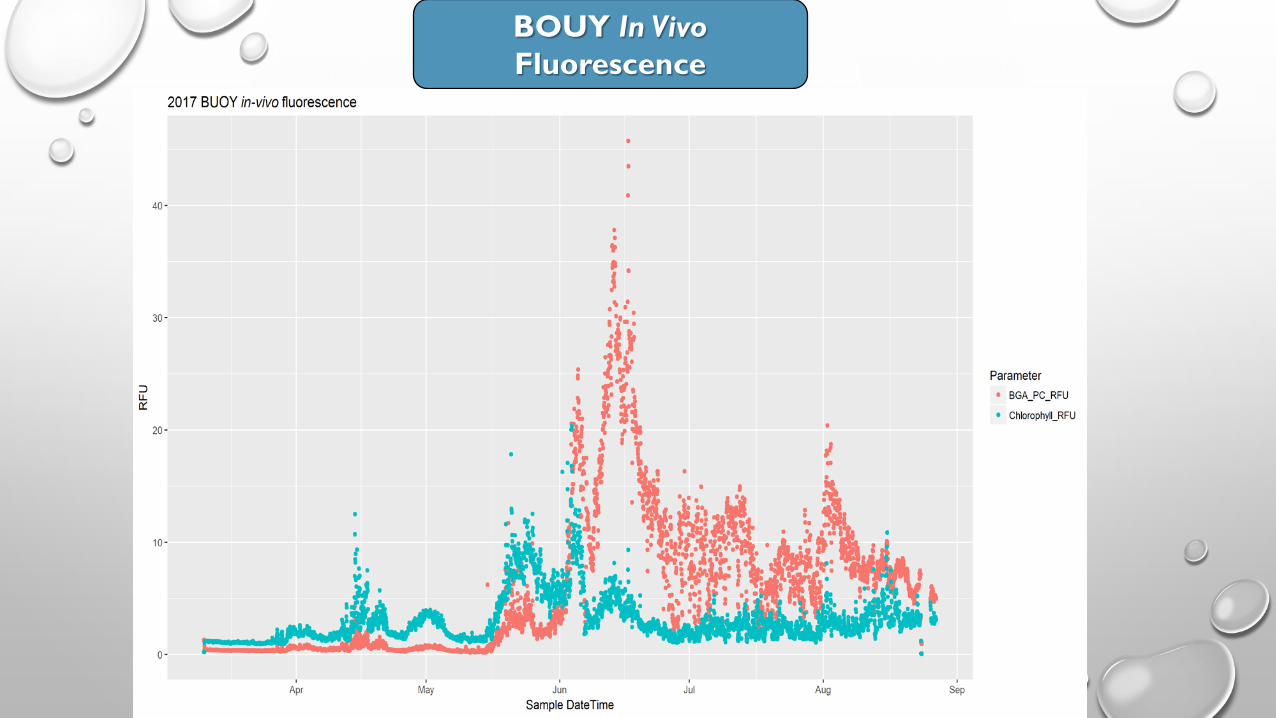
BOUY In Vivo Fluorescence
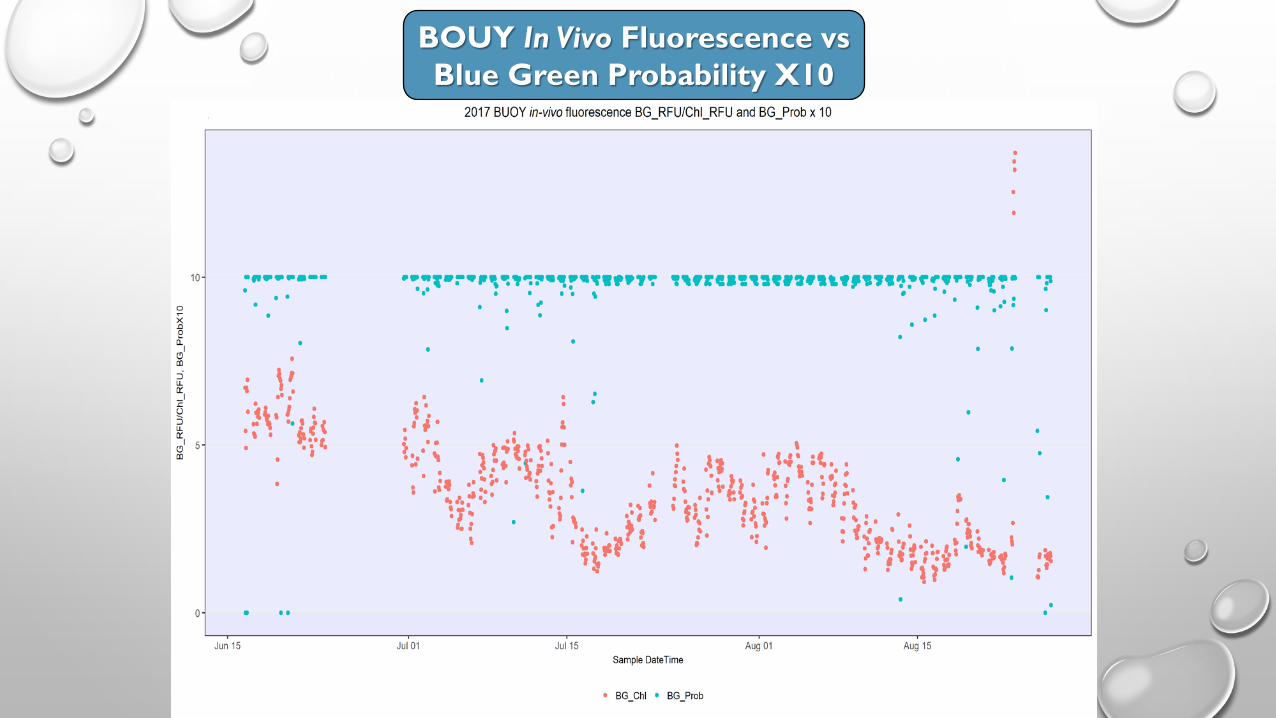
BOUY In Vivo Fluorescence vs Blue Green Probability X10

CURRENT MONITORING – WEBSITEHTTPS://MATHSTAT.NKU.EDU/HAB
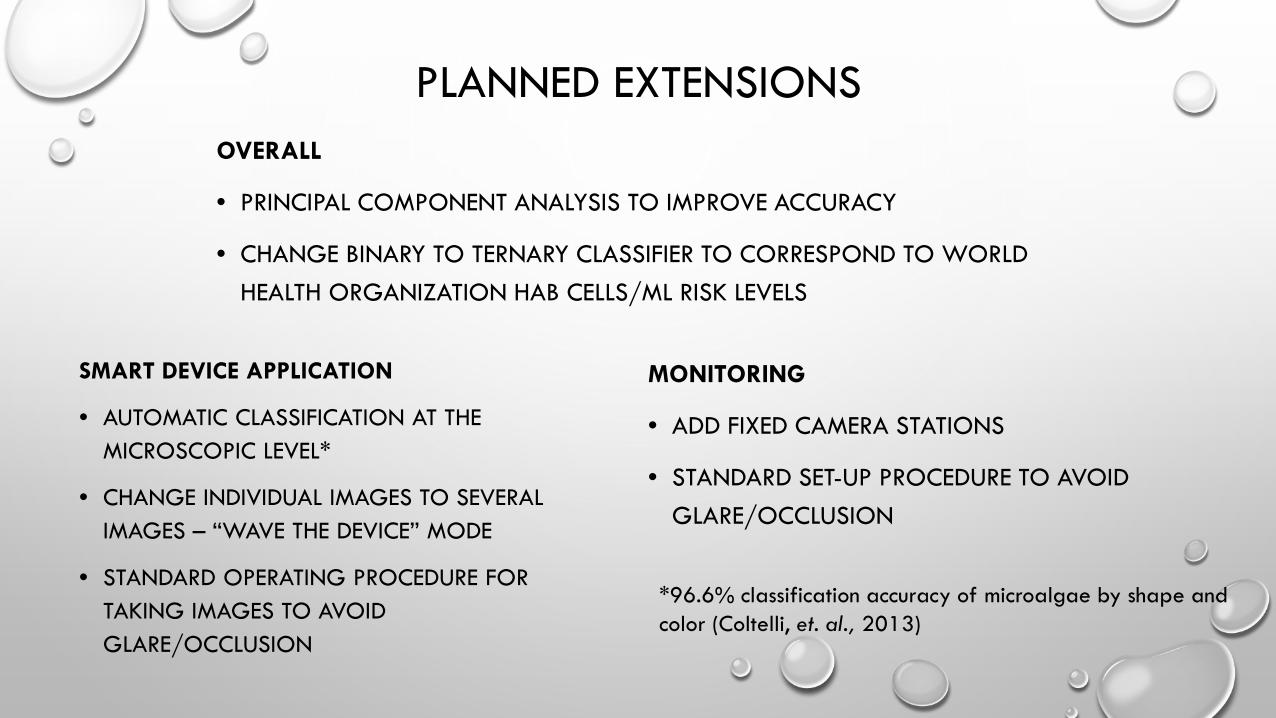
PLANNED EXTENSIONS
SMART DEVICE APPLICATION
• AUTOMATIC CLASSIFICATION AT THE MICROSCOPIC LEVEL*
• CHANGE INDIVIDUAL IMAGES TO SEVERAL IMAGES – “WAVE THE DEVICE” MODE
• STANDARD OPERATING PROCEDURE FOR TAKING IMAGES TO AVOID GLARE/OCCLUSION
MONITORING
• ADD FIXED CAMERA STATIONS
• STANDARD SET-UP PROCEDURE TO AVOID GLARE/OCCLUSION
*96.6% classification accuracy of microalgae by shape and color (Coltelli, et. al., 2013)
OVERALL
• PRINCIPAL COMPONENT ANALYSIS TO IMPROVE ACCURACY
• CHANGE BINARY TO TERNARY CLASSIFIER TO CORRESPOND TO WORLD HEALTH ORGANIZATION HAB CELLS/ML RISK LEVELS
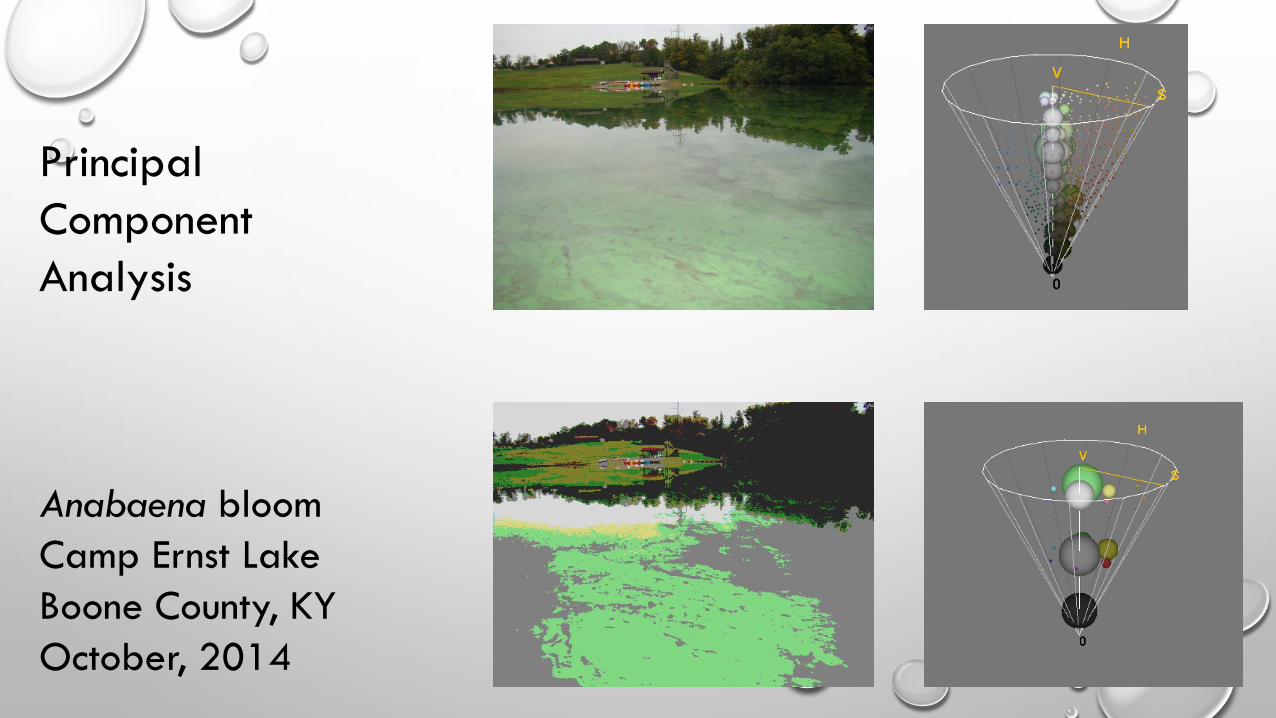
Principal Component Analysis
Anabaena bloom Camp Ernst LakeBoone County, KYOctober, 2014
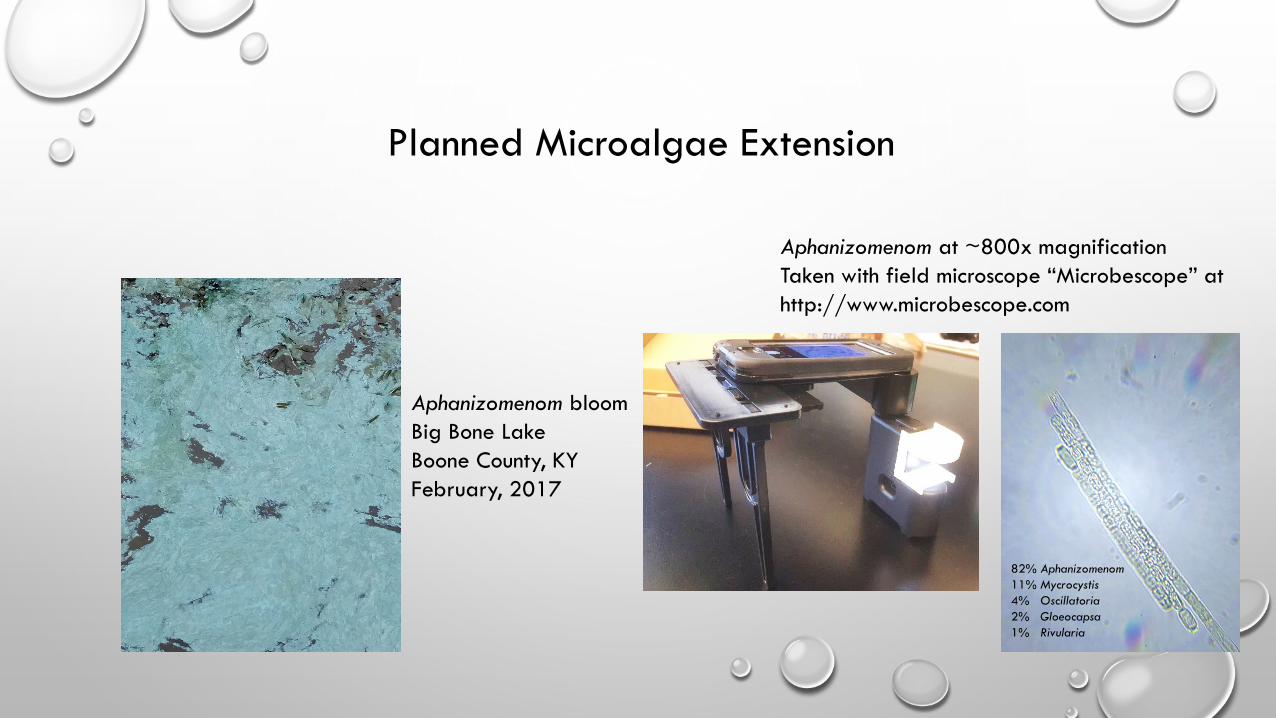
Planned Microalgae Extension
Aphanizomenom at ~800x magnificationTaken with field microscope “Microbescope” at http://www.microbescope.com
Aphanizomenom bloomBig Bone LakeBoone County, KYFebruary, 2017
82% Aphanizomenom11% Mycrocystis4% Oscillatoria2% Gloeocapsa1% Rivularia

AUTOMATED CLASSIFICATION
Anabaena Anabaenopsis Aphanizomenom Dolichospermum
Microcystis Nostoc Planktothrix

AUTOMATED CLASSIFICATION
• A convolutional neural network was created using Tensorflow to classify seven genera of harmful algae.
• Images were squared, changed to grayscale, and randomly rotated, reflected and translated to artificially augment the training set.
• Results included 53.3% accuracy in prediction of correct class.
VISION
• Artificial neural network using environmental variables (including water color) to provide a water quality index and to predict harmful water quality “events” such as harmful algal blooms
• Smart device application with downloadable models for classification (algae, macroinvertebrates, plankton, fish, other organisms), each using trained neural networks for classification

COLLABORATORS
• Environmental Protection Agency• Ecological Stewardship Institute at Northern Kentucky University• Northern Kentucky University Department of Mathematics and Statistics• Northern Kentucky University Department of Biological Sciences• Thomas More College Department of Biological Sciences• Marshall University Department of Biological Sciences• Ohio River Valley Sanitation Commission (ORSANCO)• Foundation for Ohio River Education (FORE)• Oakland University• Lake Superior State University• Wayne State University• Michigan Department of Environmental Quality• 4DOptical - Microbescope