h557/03 practical skills in physics sample question paper · h557/03 practical skills in physics ....
TRANSCRIPT
© OCR 2016 H557/03
[601/4745/3] DC (…) Turn over
A Level Physics B (Advancing Physics) H557/03 Practical skills in physics Sample Question Paper
Date – Morning/Afternoon Time allowed: 1 hour 30 minutes
You must have:
• the Data, Formulae and Relationships Booklet You may use:
• a scientific or graphical calculator
* 0 0 0 0 0 0 *
First name
Last name
Centre
number
Candidate
number
INSTRUCTIONS • Use black ink. You may use an HB pencil for graphs and diagrams. • Complete the boxes above with your name, centre number and candidate number. • Answer all the questions. • Write your answer to each question in the space provided. • Additional paper may be used if required but you must clearly show your candidate
number, centre number and question number(s). • Do not write in the bar codes.
INFORMATION • The total mark for this paper is 60. • The marks for each question are shown in brackets [ ]. • Quality of extended responses will be assessed in questions marked with an asterisk (*). • This document consists of 16 pages.
SPECIMEN
2
© OCR 2016 H557/03
SECTION A
Answer all the questions.
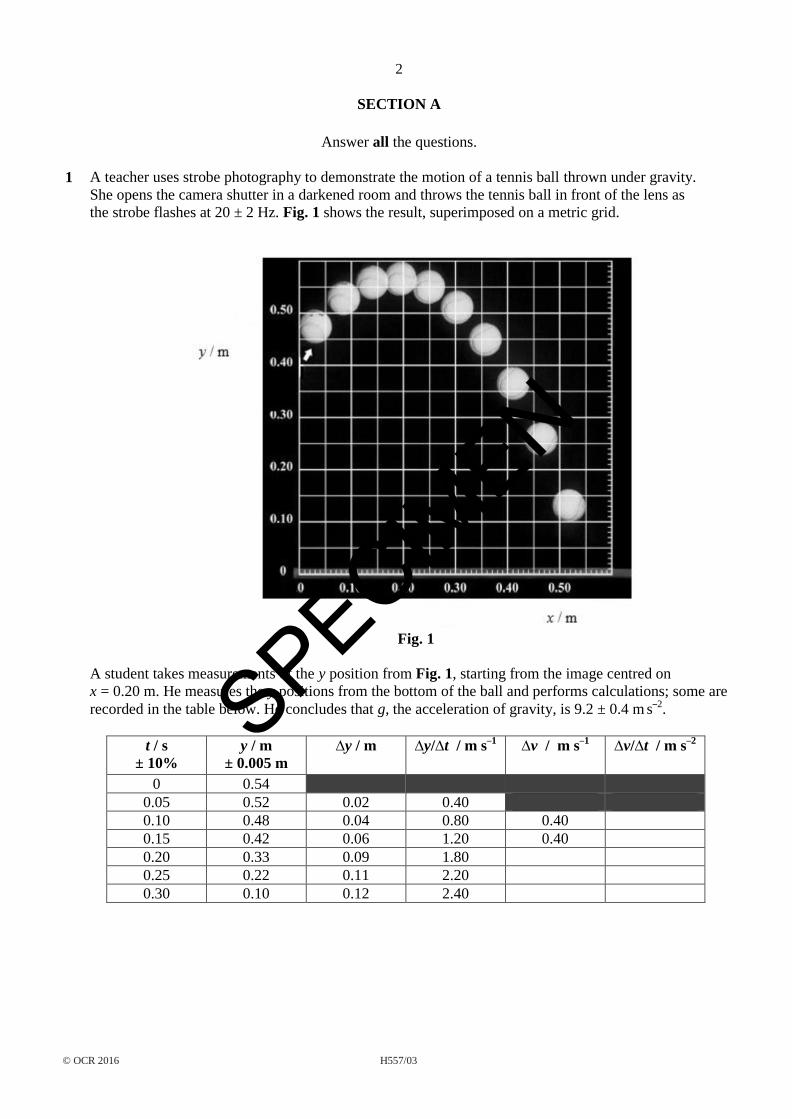
1 A teacher uses strobe photography to demonstrate the motion of a tennis ball thrown under gravity.
She opens the camera shutter in a darkened room and throws the tennis ball in front of the lens as
the strobe flashes at 20 ± 2 Hz. Fig. 1 shows the result, superimposed on a metric grid.
Fig. 1
A student takes measurements of the y position from Fig. 1, starting from the image centred on
x = 0.20 m. He measures the y positions from the bottom of the ball and performs calculations; some are
recorded in the table below. He concludes that g, the acceleration of gravity, is 9.2 ± 0.4 m s–2.
t / s
± 10%
y / m
± 0.005 m
∆y / m ∆y/∆t / m s–1 ∆v / m s–1 ∆v/∆t / m s–2
0 0.54
0.05 0.52 0.02 0.40
0.10 0.48 0.04 0.80 0.40
0.15 0.42 0.06 1.20 0.40
0.20 0.33 0.09 1.80
0.25 0.22 0.11 2.20
0.30 0.10 0.12 2.40
SPECIMEN

3
© OCR 2016 H557/03 Turn over
(a) (i) Record further values in the spaces provided to complete the data in the table.
[2]
(ii) Complete your own analysis of the data by calculating the mean value for g with an estimate
of its uncertainty.
g = …………….. ± ……………. m s–2 [2]
(iii) You are planning to improve the accuracy of this experiment to estimate g. Suggest and
explain which of the measured quantities is most worth improving to achieve this.
……………………………………………………………………………………………......
………………………………………………………………………………………………..
……………………………………………………………………………………………......
……………………………………………………………………………………………......
………………………………………………………………………………………………..
……………………………………………………………………………………………......
………………………………………………………………………………………………..
………………………………………………………………………………………. [2]
SPECIMEN

4
© OCR 2016 H557/03
(b) (i)* It is suggested that the horizontal velocity component of the motion is constant at 1.0 m s–1.
Test this hypothesis, making your method clear. Explain your judgement and conclusion.
You may wish to use the table provided to record values taken from Fig. 1.
[6]
(ii) The teacher states that the vertical and horizontal components of the motion shown illustrate
Newton’s first two laws of motion.
Explain how the two components of the motion could illustrate these laws of motion.
………………………………………………………………………………………………..
……………………………………………………………………………………………......
………………………………………………………………………………………………..
……………………………………………………………………………………………......
………………………………………………………………………………………………..
………………………………………………………………………………………. [2]
SPECIMEN
5
© OCR 2016 H557/03 Turn over
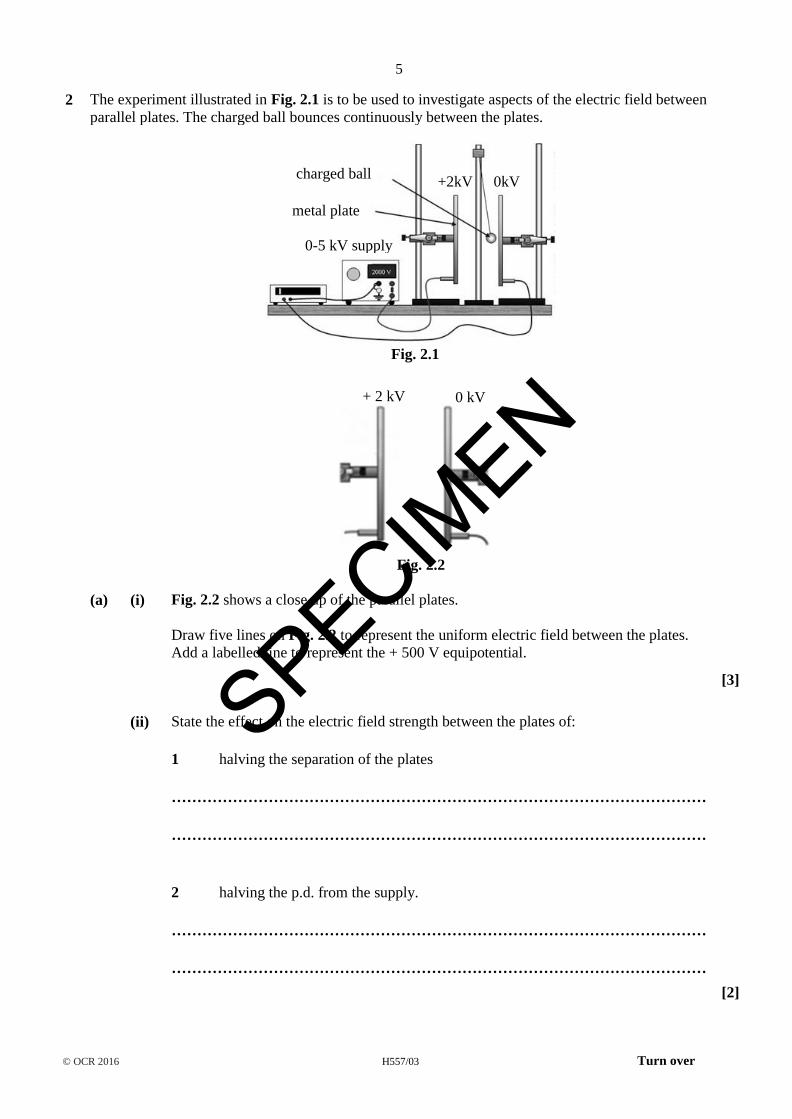
2 The experiment illustrated in Fig. 2.1 is to be used to investigate aspects of the electric field between
parallel plates. The charged ball bounces continuously between the plates.
Fig. 2.1
Fig. 2.2
(a) (i) Fig. 2.2 shows a close up of the parallel plates.
Draw five lines on Fig. 2.2 to represent the uniform electric field between the plates.
Add a labelled line to represent the + 500 V equipotential.
[3]
(ii) State the effect on the electric field strength between the plates of:
1 halving the separation of the plates
……………………………………………………………………………………………
……………………………………………………………………………………………
2 halving the p.d. from the supply.
……………………………………………………………………………………………
……………………………………………………………………………………………
[2]
+2kV
metal plate
charged ball 0kV
0-5 kV supply
+ 2 kV 0 kV
SPECIMEN

6
© OCR 2016 H557/03
(b) (i) Calculate the force on the ball when charged to +2.0 kV and placed between the plates with a
p.d. of 2.0 kV.
radius of ball = 2.0 × 10⁻² m
plate separation = 8.0 × 10⁻² m
force = ………………… N [3]
(ii) Calculate or state the work done by the electric field per coulomb on the ball as the ball moves
across half the separation of the plates.
work done per unit charge = …………………. J C–1 [1]
(c) The ball bounces between the plates at a constant rate.
Explain why the ball bounces at a constant rate although it gains energy from the electric field each
time it moves between the plates.
………………………………………………………………………………………………………….
………………………………………………………………………………………………………….
………………………………………………………………………………………………………….
………………………………………………………………………………………………………….
………………………………………………………………………………………………………….
………………………………………………………………………………………………………….
………………………………………………………………………………………………………….
………………………………………………………………………………………………………….
………………………………………………………………………………………………………. [2]
SPECIMEN
7
© OCR 2016 H557/03 Turn over
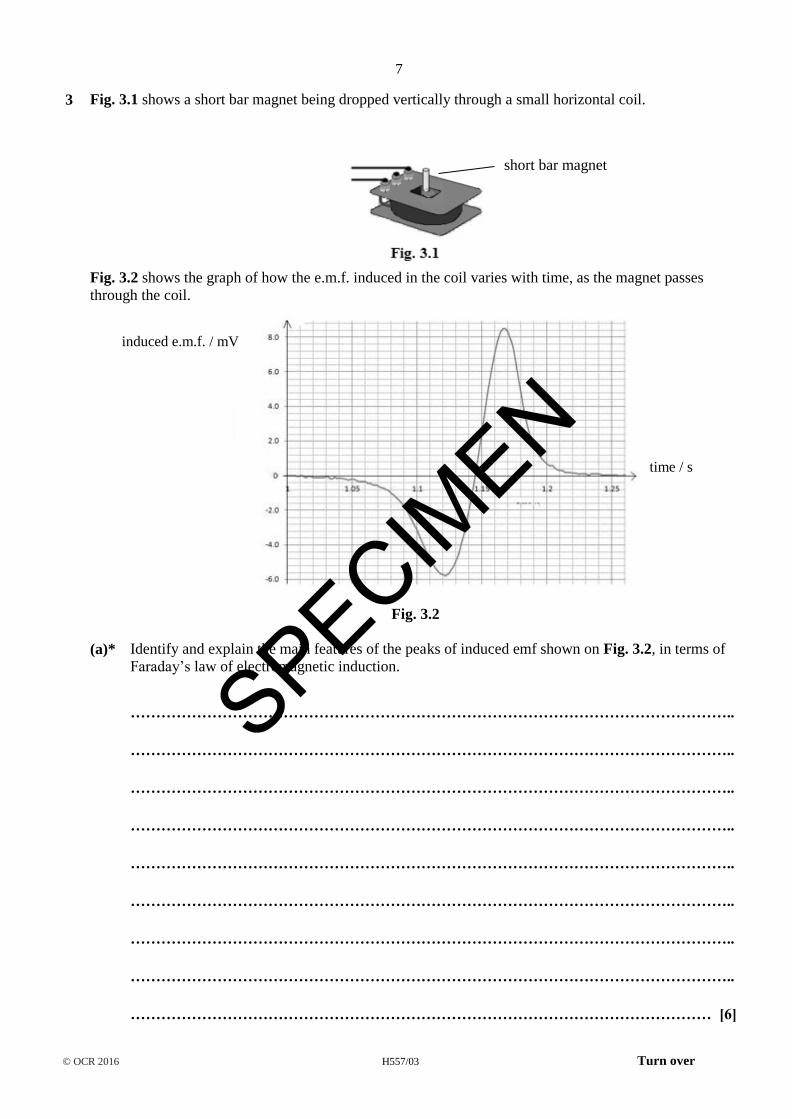
3 Fig. 3.1 shows a short bar magnet being dropped vertically through a small horizontal coil.
Fig. 3.2 shows the graph of how the e.m.f. induced in the coil varies with time, as the magnet passes
through the coil.
Fig. 3.2
(a)* Identify and explain the main features of the peaks of induced emf shown on Fig. 3.2, in terms of
Faraday’s law of electromagnetic induction.
………………………………………………………………………………………………………..
………………………………………………………………………………………………………..
………………………………………………………………………………………………………..
………………………………………………………………………………………………………..
………………………………………………………………………………………………………..
………………………………………………………………………………………………………..
………………………………………………………………………………………………………..
………………………………………………………………………………………………………..
…………………………………………………………………………………………………… [6]
short bar magnet
induced e.m.f. / mV
time / s
SPECIMEN

8
© OCR 2016 H557/03
(b) An experiment is being planned for dropping a much longer bar magnet through the small coil of
Fig. 3.1 and measuring the induced emf.
Sketch and label an apparatus diagram.
State one aspect that would need to be controlled in order to obtain accurate data and explain how
you would achieve this.
[3]
SPECIMEN

9
© OCR 2016 H557/03 Turn over
3 (c) Explain how the graph in Fig. 3.2 would change if:
1 a much longer bar magnet replaced the short bar magnet.
……………………………………………………………………………………………….
……………………………………………………………………………………………….
……………………………………………………………………………………………….
2 a much larger diameter coil replaced the small coil.
……………………………………………………………………………………………….
……………………………………………………………………………………………….
……………………………………………………………………………………………….
[4]
(d) The data in Fig. 3.2 were obtained using an 1100 turn coil.
Calculate the total flux linking the coil from when the magnet enters the coil to the point at which
the magnet is central within the coil.
flux linked = …………………….….Wb [2]
SPECIMEN
10
© OCR 2016 H557/03
SECTION B
Answer all the questions.
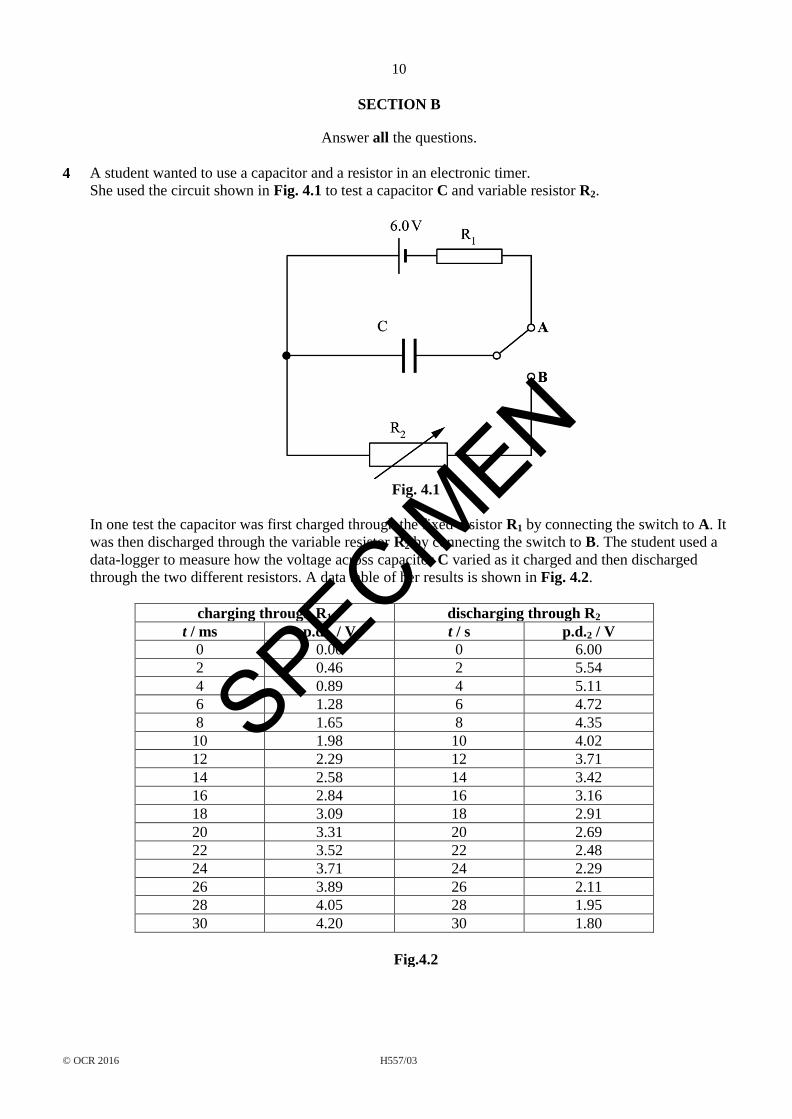
4 A student wanted to use a capacitor and a resistor in an electronic timer.
She used the circuit shown in Fig. 4.1 to test a capacitor C and variable resistor R2.
Fig. 4.1
In one test the capacitor was first charged through the fixed resistor R1 by connecting the switch to A. It
was then discharged through the variable resistor R2 by connecting the switch to B. The student used a
data-logger to measure how the voltage across capacitor C varied as it charged and then discharged
through the two different resistors. A data table of her results is shown in Fig. 4.2.
charging through R1 discharging through R2
t / ms p.d.1 / V t / s p.d.2 / V
0 0.00 0 6.00
2 0.46 2 5.54
4 0.89 4 5.11
6 1.28 6 4.72
8 1.65 8 4.35
10 1.98 10 4.02
12 2.29 12 3.71
14 2.58 14 3.42
16 2.84 16 3.16
18 3.09 18 2.91
20 3.31 20 2.69
22 3.52 22 2.48
24 3.71 24 2.29
26 3.89 26 2.11
28 4.05 28 1.95
30 4.20 30 1.80
Fig.4.2
SPECIMEN
11
© OCR 2016 H557/03 Turn over
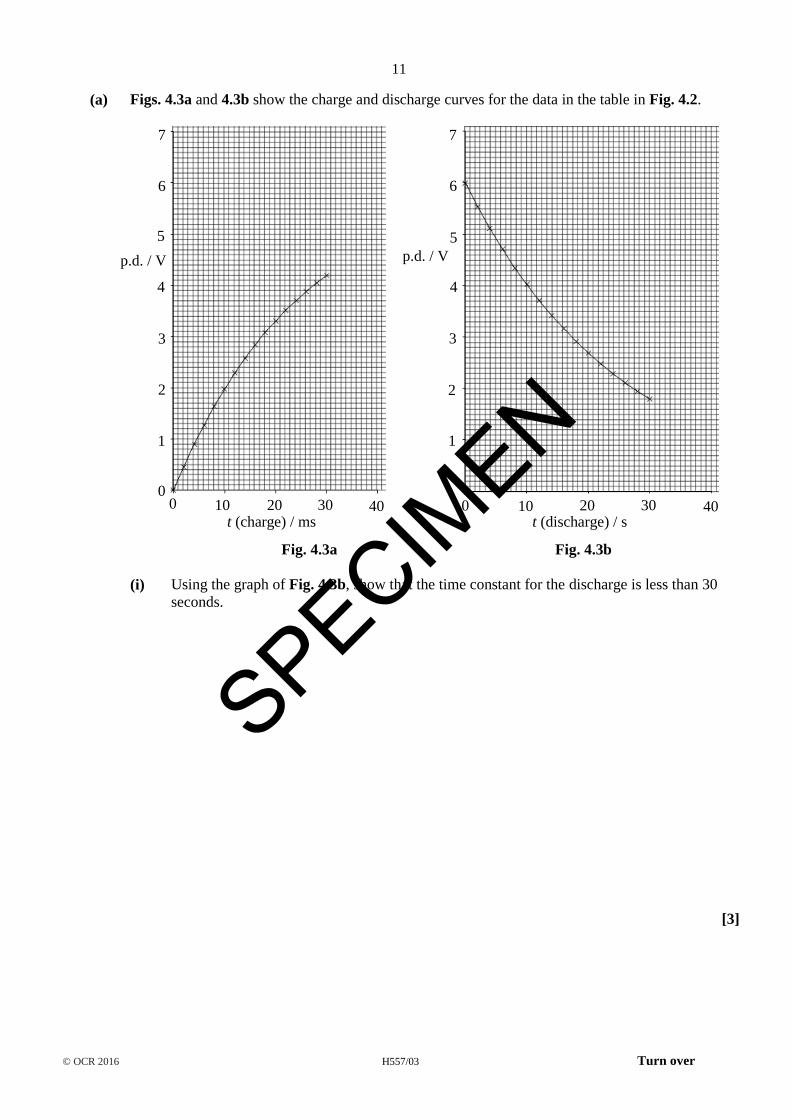
(a) Figs. 4.3a and 4.3b show the charge and discharge curves for the data in the table in Fig. 4.2.
Fig. 4.3a Fig. 4.3b
(i) Using the graph of Fig. 4.3b, show that the time constant for the discharge is less than 30
seconds.
[3]
p.d. / V
p.d. / V
t (charge) / ms t (discharge) / s
0 10 20 30 40 0 10 20 30 40 0
1
2
3
4
5
6
7
1
2
3
4
5
6
7
SPECIMEN

12
© OCR 2016 H557/03
(ii) The capacitor has a value of 4700 F. Show that the initial discharge current would be
about 1 mA.
[4]
(iii)* The student calculated the total amount of charge to flow from the capacitor in the first
30 seconds. She used two methods:
Method 1 – using the relationship Q = C V
Method 2 – using R
V I and the area under the I (t) graph where R is 5.0 kΩ
Show how the total charge flow may be calculated in both cases and comment on how the
two methods compare.
[6]
SPECIMEN

13
© OCR 2016 H557/03
(b) In the student’s proposed timer, the p.d. across R2 must fall to 1.0 V in less than 50 seconds.
Use suitable calculations to demonstrate whether the circuit meets this requirement.
[4]
(c) Calculate the value of the charging resistor R1.
resistance = ……………………… Ω [3]
END OF QUESTION PAPER
SPECIMEN

14
© OCR 2016 H557/03
BLANK PAGE
SPECIMEN

15
© OCR 2016 H557/03
BLANK PAGE
SPECIM
EN

16
© OCR 2016 H557/03
Copyright Information:
Q1: Strobe picture of tennis ball taken from © Joe Henderson / http://www.be.wednet.edu/Page/2737
Q2: Picture of shuttling ball taken from © www.tap.iop.org
OCR is committed to seeking permission to reproduce all third-party content that it uses in the assessment materials. OCR has attempted to
identify and contact all copyright holders whose work is used in this paper. To avoid the issue of disclosure of answer-related information to
candidates, all copyright acknowledgements are reproduced in the OCR Copyright Acknowledgements booklet. This is produced for each
series of examinations and is freely available to download from our public website (www.ocr.org.uk) after the live examination series.
If OCR has unwittingly failed to correctly acknowledge or clear any third-party content in this assessment material, OCR will be happy to correct
its mistake at the earliest possible opportunity.
For queries or further information please contact the Copyright Team, First Floor, 9 Hills Road, Cambridge CB2 1GE.
OCR is part of the Cambridge Assessment Group; Cambridge Assessment is the brand name of University of Cambridge Local Examinations
Syndicate (UCLES), which is itself a department of the University of Cambridge.
SPECIMEN

…day June 20XX – Morning/Afternoon A Level Physics B (Advancing Physics) H557/03 Practical skills in physics SAMPLE MARK SCHEME Duration: 1 hour 30 minutes MAXIMUM MARK 60
This document consists of 16 pages
SPECIMEN

H557/03 Mark Scheme June 20XX
2
MARKING INSTRUCTIONS
PREPARATION FOR MARKING
SCORIS
1. Make sure that you have accessed and completed the relevant training packages for on-screen marking: scoris assessor Online Training; OCR Essential Guide to Marking.
2. Make sure that you have read and understood the mark scheme and the question paper for this unit. These are posted on the RM Cambridge
Assessment Support Portal http://www.rm.com/support/ca
3. Log-in to scoris and mark the required number of practice responses (“scripts”) and the required number of standardisation responses.
YOU MUST MARK 10 PRACTICE AND 10 STANDARDISATION RESPONSES BEFORE YOU CAN BE APPROVED TO MARK LIVE SCRIPTS.
MARKING 1. Mark strictly to the mark scheme.
2. Marks awarded must relate directly to the marking criteria.
3. The schedule of dates is very important. It is essential that you meet the scoris 50% and 100% (traditional 50% Batch 1 and 100% Batch 2)
deadlines. If you experience problems, you must contact your Team Leader (Supervisor) without delay.
4. If you are in any doubt about applying the mark scheme, consult your Team Leader by telephone, email or via the scoris messaging system.
SPECIMEN
H557/03 Mark Scheme June 20XX
3
5. Work crossed out:
a. where a candidate crosses out an answer and provides an alternative response, the crossed out response is not marked and gains no marks
b. if a candidate crosses out an answer to a whole question and makes no second attempt, and if the inclusion of the answer does not cause a rubric infringement, the assessor should attempt to mark the crossed out answer and award marks appropriately.
6. Always check the pages (and additional objects if present) at the end of the response in case any answers have been continued there. If the
candidate has continued an answer there then add a tick to confirm that the work has been seen.
7. There is a NR (No Response) option. Award NR (No Response)
- if there is nothing written at all in the answer space
- OR if there is a comment which does not in any way relate to the question (e.g. ‘can’t do’, ‘don’t know’)
- OR if there is a mark (e.g. a dash, a question mark) which isn’t an attempt at the question.
Note: Award 0 marks – for an attempt that earns no credit (including copying out the question). 8. The scoris comments box is used by your Team Leader to explain the marking of the practice responses. Please refer to these comments
when checking your practice responses. Do not use the comments box for any other reason.
If you have any questions or comments for your Team Leader, use the phone, the scoris messaging system, or e-mail.
9. Assistant Examiners will send a brief report on the performance of candidates to their Team Leader (Supervisor) via email by the end of the marking period. The report should contain notes on particular strengths displayed as well as common errors or weaknesses. Constructive criticism of the question paper/mark scheme is also appreciated.
SPECIMEN
H557/03 Mark Scheme June 20XX
4
10. For answers marked by levels of response:
- Read through the whole answer from start to finish.
- Decide the level that best fits the answer – match the quality of the answer to the closest level descriptor.
- To select a mark within the level, consider the following:
Higher mark: A good match to main point, including communication statement (in italics), award the higher mark in the level Lower mark: Some aspects of level matches but key omissions in main point or communication statement (in italics), award lower mark in the level.
Level of response questions on this paper are 1(b)(i), 3(a), and 4(a)(iii).
SPECIMEN
H557/03 Mark Scheme June 20XX
5
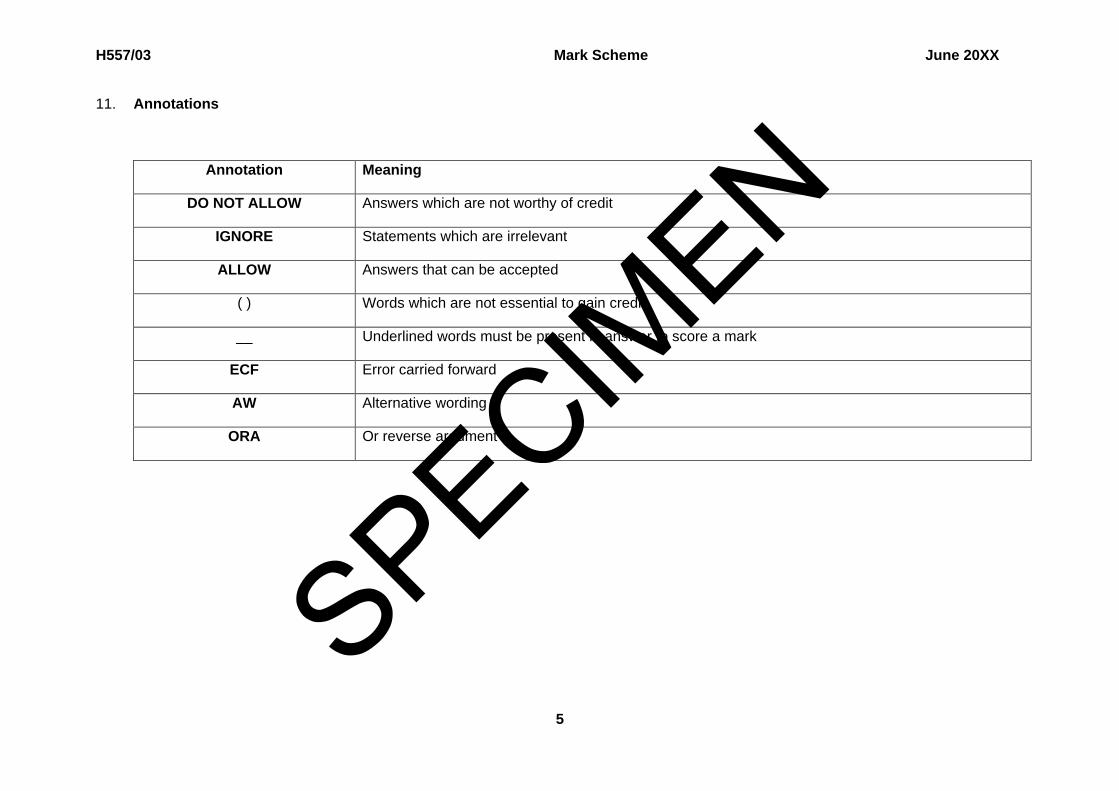
11. Annotations
Annotation Meaning
DO NOT ALLOW Answers which are not worthy of credit
IGNORE Statements which are irrelevant
ALLOW Answers that can be accepted
( ) Words which are not essential to gain credit
__ Underlined words must be present in answer to score a mark
ECF Error carried forward
AW Alternative wording
ORA Or reverse argument
SPECIMEN

H557/03 Mark Scheme June 20XX
6
12. Subject-specific Marking Instructions
INTRODUCTION Your first task as an Examiner is to become thoroughly familiar with the material on which the examination depends. This material includes: • the specification, especially the assessment objectives
• the question paper
• the mark scheme.
You should ensure that you have copies of these materials. You should ensure also that you are familiar with the administrative procedures related to the marking process. These are set out in the OCR booklet Instructions for Examiners. If you are examining for the first time, please read carefully Appendix 5 Introduction to Script Marking: Notes for New Examiners. Please ask for help or guidance whenever you need it. Your first point of contact is your Team Leader.
SPECIMEN
H557/03 Mark Scheme June 20XX
7
Question Answer Marks Guidance
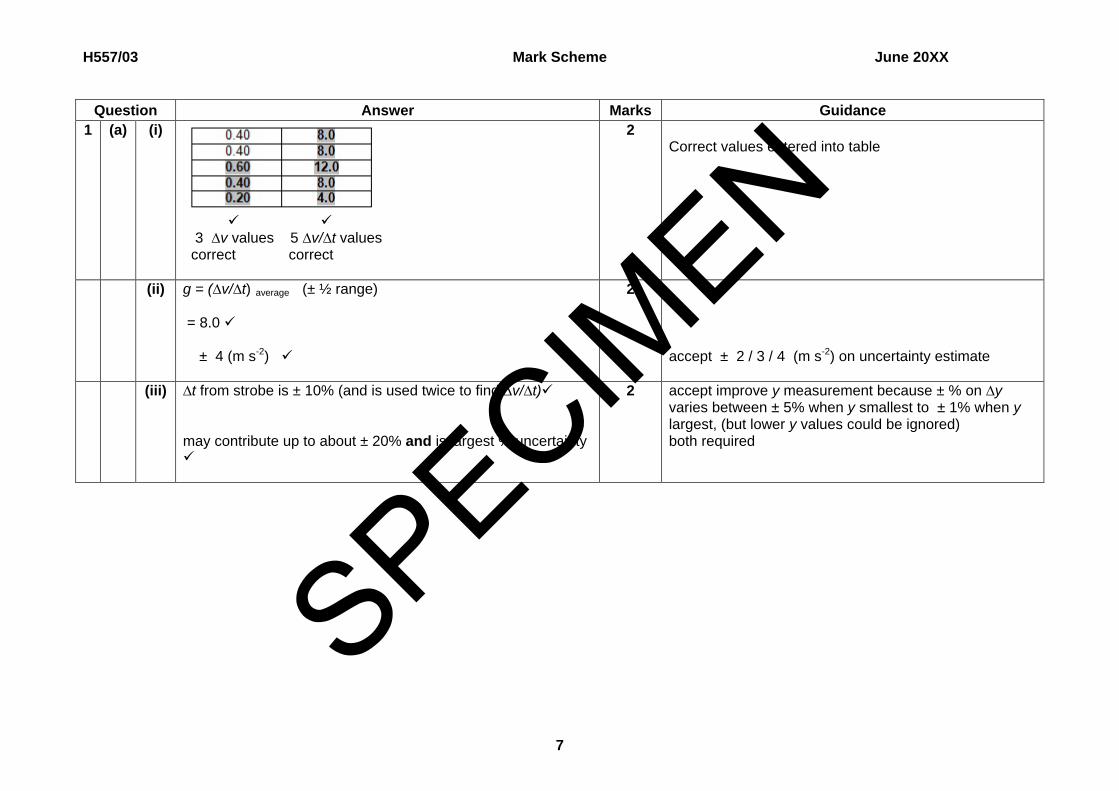
1 (a) (i)
3 ∆v values 5 ∆v/∆t values correct correct
2
Correct values entered into table
(ii) g = (∆v/∆t) average (± ½ range) = 8.0 ± 4 (m s-2)
2 accept ± 2 / 3 / 4 (m s-2) on uncertainty estimate
(iii) ∆t from strobe is ± 10% (and is used twice to find ∆v/∆t) may contribute up to about ± 20% and is largest % uncertainty
2
accept improve y measurement because ± % on ∆y varies between ± 5% when y smallest to ± 1% when y largest, (but lower y values could be ignored) both required
SPECIMEN
H557/03 Mark Scheme June 20XX
8
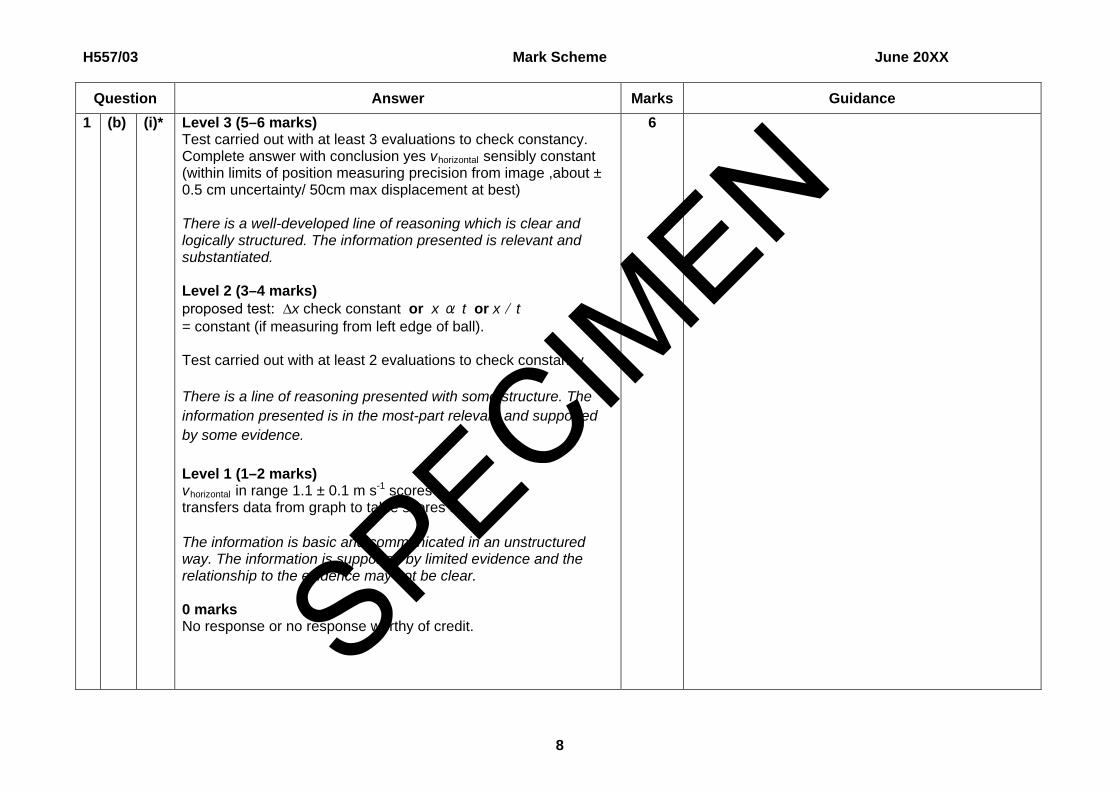
Question Answer Marks Guidance 1 (b) (i)* Level 3 (5–6 marks)
Test carried out with at least 3 evaluations to check constancy. Complete answer with conclusion yes vhorizontal sensibly constant (within limits of position measuring precision from image ,about ± 0.5 cm uncertainty/ 50cm max displacement at best) There is a well-developed line of reasoning which is clear and logically structured. The information presented is relevant and substantiated. Level 2 (3–4 marks) proposed test: ∆x check constant or x α t or x / t = constant (if measuring from left edge of ball). Test carried out with at least 2 evaluations to check constancy There is a line of reasoning presented with some structure. The information presented is in the most-part relevant and supported by some evidence. Level 1 (1–2 marks) vhorizontal in range 1.1 ± 0.1 m s-1 scores 2 transfers data from graph to table scores 1 The information is basic and communicated in an unstructured way. The information is supported by limited evidence and the relationship to the evidence may not be clear.
0 marks No response or no response worthy of credit.
6
SPECIMEN
H557/03 Mark Scheme June 20XX
9
Question Answer Marks Guidance
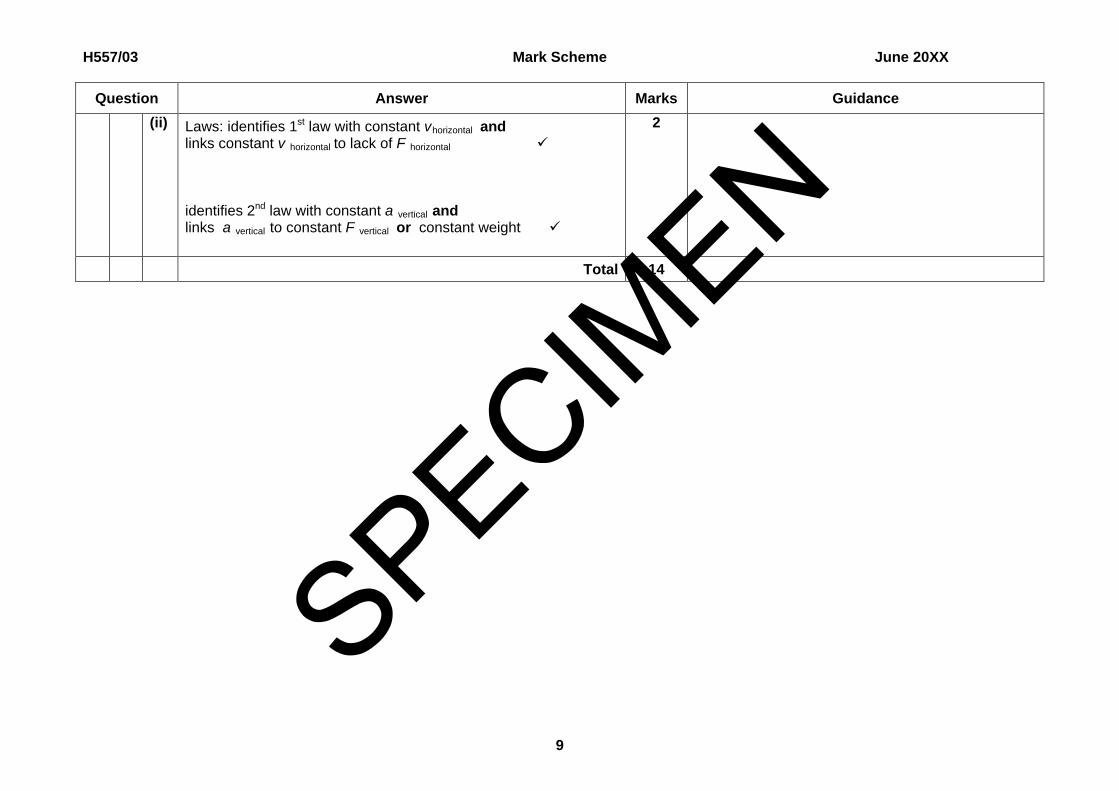
(ii)
Laws: identifies 1st law with constant vhorizontal and links constant v horizontal to lack of F horizontal identifies 2nd law with constant a vertical and links a vertical to constant F vertical or constant weight
2
Total 14
SPECIMEN
H557/03 Mark Scheme June 20XX
10
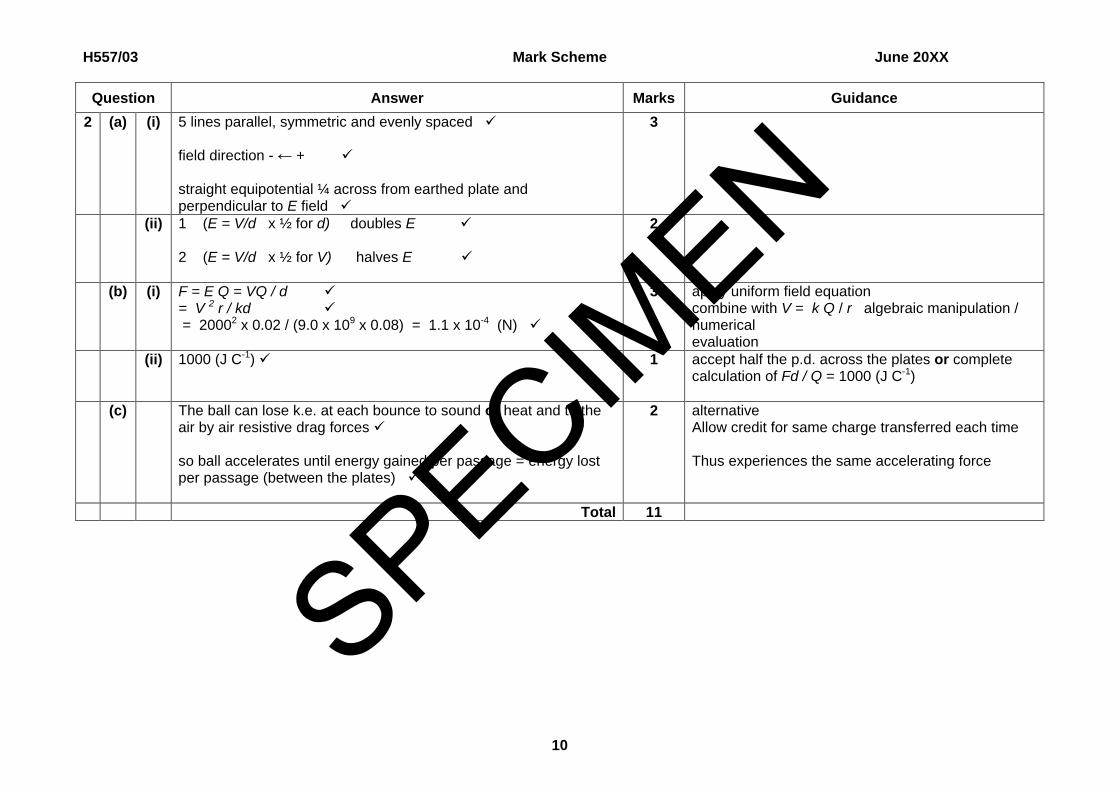
Question Answer Marks Guidance 2 (a) (i) 5 lines parallel, symmetric and evenly spaced
field direction - ← + straight equipotential ¼ across from earthed plate and perpendicular to E field
3
(ii) 1 (E = V/d x ½ for d) doubles E 2 (E = V/d x ½ for V) halves E
2
(b) (i) F = E Q = VQ / d = V 2 r / kd = 20002 x 0.02 / (9.0 x 109 x 0.08) = 1.1 x 10⁻⁴ (N)
3 apply uniform field equation combine with V = k Q / r algebraic manipulation / numerical evaluation
(ii) 1000 (J C-1)
1 accept half the p.d. across the plates or complete calculation of Fd / Q = 1000 (J C-1)
(c) The ball can lose k.e. at each bounce to sound or heat and to the air by air resistive drag forces so ball accelerates until energy gained per passage = energy lost per passage (between the plates)
2 alternative Allow credit for same charge transferred each time Thus experiences the same accelerating force
Total 11 SPECIM
EN
H557/03 Mark Scheme June 20XX
11
Question Answer Marks Guidance
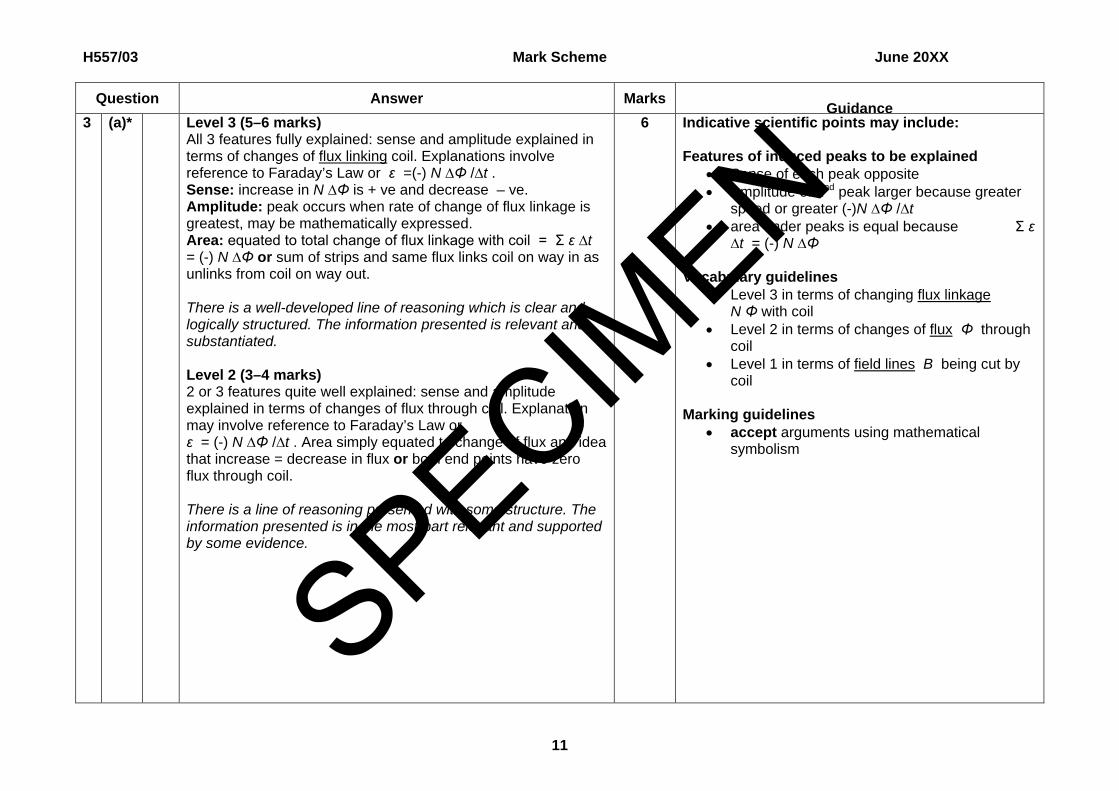
3 (a)* Level 3 (5–6 marks) All 3 features fully explained: sense and amplitude explained in terms of changes of flux linking coil. Explanations involve reference to Faraday’s Law or ε =(-) N ∆Φ /∆t . Sense: increase in N ∆Φ is + ve and decrease – ve. Amplitude: peak occurs when rate of change of flux linkage is greatest, may be mathematically expressed. Area: equated to total change of flux linkage with coil = Σ ε ∆t = (-) N ∆Φ or sum of strips and same flux links coil on way in as unlinks from coil on way out. There is a well-developed line of reasoning which is clear and logically structured. The information presented is relevant and substantiated. Level 2 (3–4 marks) 2 or 3 features quite well explained: sense and amplitude explained in terms of changes of flux through coil. Explanation may involve reference to Faraday’s Law or ε = (-) N ∆Φ /∆t . Area simply equated to change of flux and idea that increase = decrease in flux or both end points have zero flux through coil. There is a line of reasoning presented with some structure. The information presented is in the most-part relevant and supported by some evidence.
6 Indicative scientific points may include: Features of induced peaks to be explained
• Sense of each peak opposite • Amplitude of 2nd peak larger because greater
speed or greater (-)N ∆Φ /∆t • area under peaks is equal because Σ ε
∆t = (-) N ∆Φ Vocabulary guidelines
• Level 3 in terms of changing flux linkage N Φ with coil
• Level 2 in terms of changes of flux Φ through coil
• Level 1 in terms of field lines B being cut by coil
Marking guidelines
• accept arguments using mathematical symbolism
SPECIMEN
H557/03 Mark Scheme June 20XX
12
Question Answer Marks Guidance
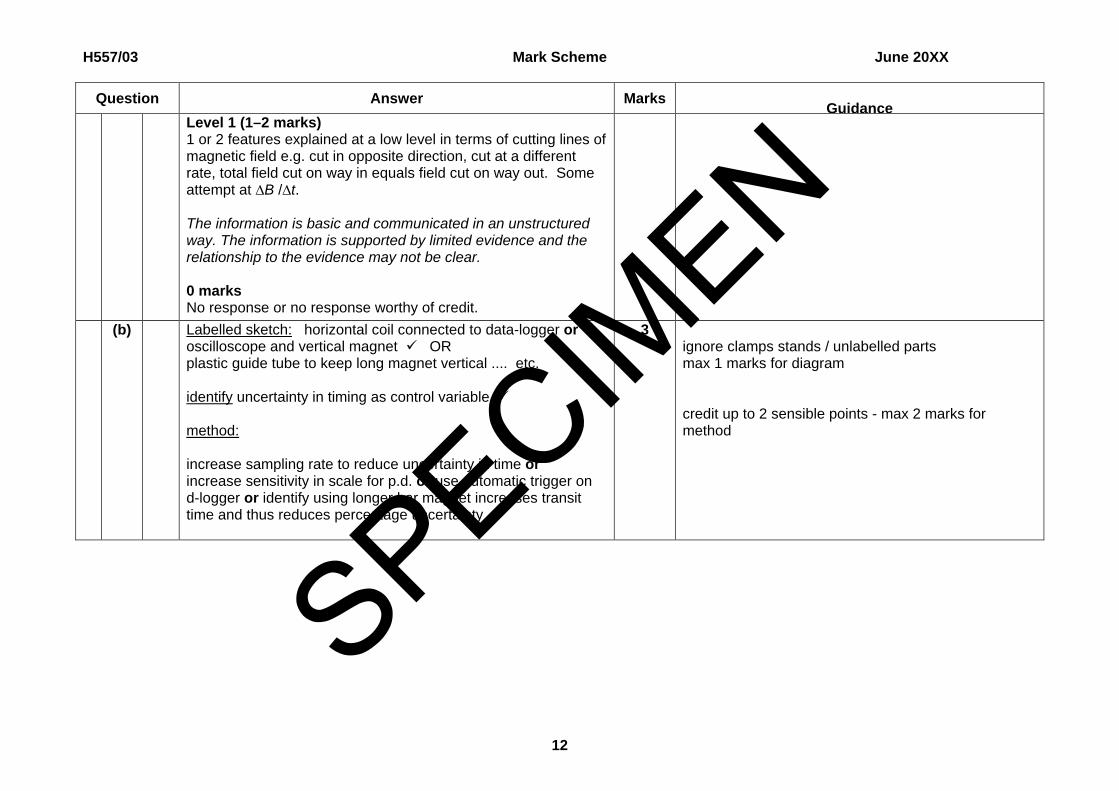
Level 1 (1–2 marks) 1 or 2 features explained at a low level in terms of cutting lines of magnetic field e.g. cut in opposite direction, cut at a different rate, total field cut on way in equals field cut on way out. Some attempt at ∆B /∆t. The information is basic and communicated in an unstructured way. The information is supported by limited evidence and the relationship to the evidence may not be clear. 0 marks No response or no response worthy of credit.
(b) Labelled sketch: horizontal coil connected to data-logger or oscilloscope and vertical magnet OR plastic guide tube to keep long magnet vertical .... etc. identify uncertainty in timing as control variable method: increase sampling rate to reduce uncertainty in time or increase sensitivity in scale for p.d. or use automatic trigger on d-logger or identify using longer bar magnet increases transit time and thus reduces percentage uncertainty
3
ignore clamps stands / unlabelled parts max 1 marks for diagram credit up to 2 sensible points - max 2 marks for method
SPECIMEN

H557/03 Mark Scheme June 20XX
13
Question Answer Marks Guidance
(c) 1 Peaks separate in time or a period of no emf between because only change in flux linking coil when magnetic poles enter or leave coil OR Second peak much greater amplitude and shorter duration due to higher velocity (under acceleration of gravity) as pole leaves coil and flux linkage changes at much greater rate 2 Very small or zero induced emf because flux of magnet loops close to magnet and does not reach to link with the much larger diameter coil
4
(d) Total flux linking coil = area under graph N Φ = Σ ε ∆t or counting squares or area ∆ (Φ = A / N = ½ x 0.08 x 5.8 x 10-3/ 1100) = 0.21 x 10⁻⁶ (Wb)
2
Total 15 SPECIM
EN
H557/03 Mark Scheme June 20XX
14
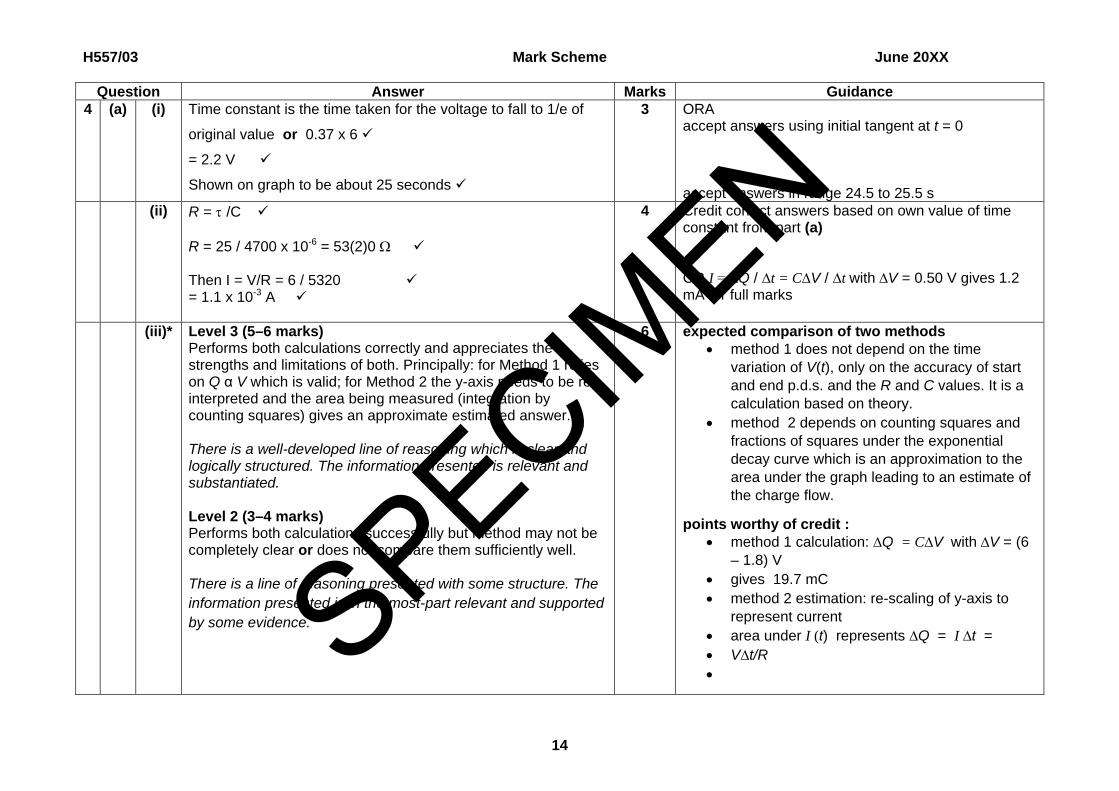
Question Answer Marks Guidance 4 (a) (i) Time constant is the time taken for the voltage to fall to 1/e of
original value or 0.37 x 6
= 2.2 V
Shown on graph to be about 25 seconds
3 ORA accept answers using initial tangent at t = 0 accept answers in range 24.5 to 25.5 s
(ii) R = τ /C R = 25 / 4700 x 10-6 = 53(2)0 Ω Then I = V/R = 6 / 5320 = 1.1 x 10⁻³ A
4
Credit correct answers based on own value of time constant from part (a) OR I = ∆Q / ∆t = C∆V / ∆t with ∆V = 0.50 V gives 1.2 mA for full marks
(iii)* Level 3 (5–6 marks) Performs both calculations correctly and appreciates the strengths and limitations of both. Principally: for Method 1 relies on Q α V which is valid; for Method 2 the y-axis needs to be re-interpreted and the area being measured (integration by counting squares) gives an approximate estimated answer. There is a well-developed line of reasoning which is clear and logically structured. The information presented is relevant and substantiated. Level 2 (3–4 marks) Performs both calculations successfully but method may not be completely clear or does not compare them sufficiently well. There is a line of reasoning presented with some structure. The information presented is in the most-part relevant and supported by some evidence.
6
expected comparison of two methods • method 1 does not depend on the time
variation of V(t), only on the accuracy of start and end p.d.s. and the R and C values. It is a calculation based on theory.
• method 2 depends on counting squares and fractions of squares under the exponential decay curve which is an approximation to the area under the graph leading to an estimate of the charge flow.
points worthy of credit : • method 1 calculation: ∆Q = C∆V with ∆V = (6
– 1.8) V • gives 19.7 mC • method 2 estimation: re-scaling of y-axis to
represent current • area under I (t) represents ∆Q = I ∆t = • V∆t/R • SPECIMEN
H557/03 Mark Scheme June 20XX
15
Question Answer Marks Guidance Level 1 (1–2 marks)
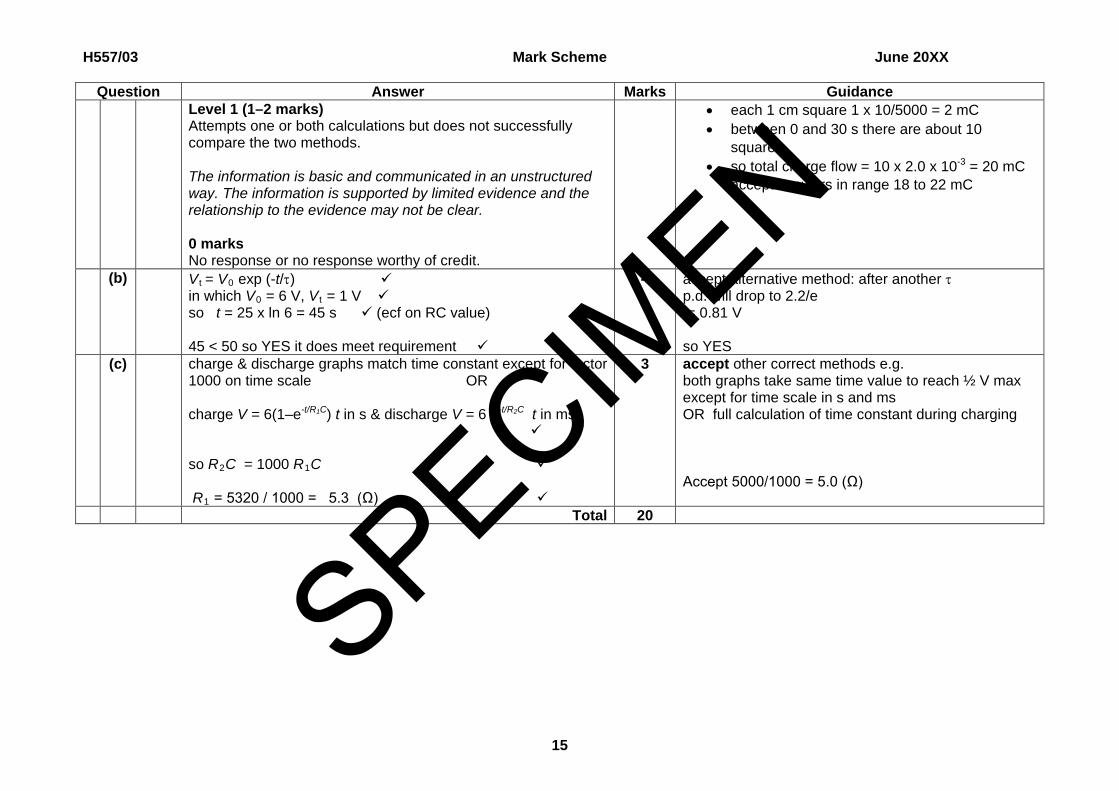
Attempts one or both calculations but does not successfully compare the two methods. The information is basic and communicated in an unstructured way. The information is supported by limited evidence and the relationship to the evidence may not be clear. 0 marks No response or no response worthy of credit.
• each 1 cm square 1 x 10/5000 = 2 mC • between 0 and 30 s there are about 10
squares • so total charge flow = 10 x 2.0 x 10-3 = 20 mC
accept answers in range 18 to 22 mC
(b) V t = V0 exp (-t/τ) in which V0 = 6 V, Vt = 1 V so t = 25 x ln 6 = 45 s (ecf on RC value) 45 < 50 so YES it does meet requirement
4
accept alternative method: after another τ p.d. will drop to 2.2/e = 0.81 V so YES
(c) charge & discharge graphs match time constant except for factor 1000 on time scale OR charge V = 6(1–e-t/R1C) t in s & discharge V = 6 e-t/R2C t in ms so R2C = 1000 R1C R1 = 5320 / 1000 = 5.3 (Ω)
3 accept other correct methods e.g. both graphs take same time value to reach ½ V max except for time scale in s and ms OR full calculation of time constant during charging
Accept 5000/1000 = 5.0 (Ω)
Total 20
SPECIMEN

H557/03 Mark Scheme June 20XX
16
BLANK PAGE
SPECIMEN