h1 results - capgemini capgemini investors en · respect to future financial results, events, ......
TRANSCRIPT

H1 RESULTS2015
Paris • July 30th, 2015
2 Copyright © 2015. All rights reserved
This presentation may contain forward-looking statements. Such statements may include projections,estimates, assumptions, statements regarding plans, objectives, intentions and/or expectations withrespect to future financial results, events, operations and services and product development, as well asstatements, regarding future performance or events. Forward-looking statements are generally identifiedby the words “expects”, “anticipates”, “believes”, “intends”, “estimates”, “plans”, “projects”, “may”, “would”“should” or the negatives of these terms and similar expressions. Although Cap Gemini’s managementcurrently believes that the expectations reflected in such forward-looking statements are reasonable,investors are cautioned that forward-looking statements are subject to various risks and uncertainties(including without limitation risks identified in Cap Gemini’s Registration Document available on CapGemini’s website), because they relate to future events and depend on future circumstances that may ormay not occur and may be different from those anticipated, many of which are difficult to predict andgenerally beyond the control of Cap Gemini. Actual results and developments may differ materially fromthose expressed in, implied by or projected by forward-looking statements. Forward-looking statementsare not intended to and do not give any assurances or comfort as to future events or results. Other thanas required by applicable law, Cap Gemini does not undertake any obligation to update or revise anyforward-looking statement.
This presentation does not contain or constitute an offer of securities for sale or an invitation orinducement to invest in securities in France, the United States or any other jurisdiction.
Disclaimer

Paul HERMELIN

€5,608 Revenues, +9.9% current growth YoY, +1.4% organically
Good Bookings momentum at €5,309M
€290M net profit, +21% YoY
Organic free cash flow of -86M€
8.7% Operating Margin, Strong progression of +80 bps YoY
Strong performance in H1
96,000 offshore employees out of a 178,500 total, Offshore leverage reaching 54% including IGATE
Closing of the IGATE transaction on July 1st4 Copyright © 2015. All rights reserved
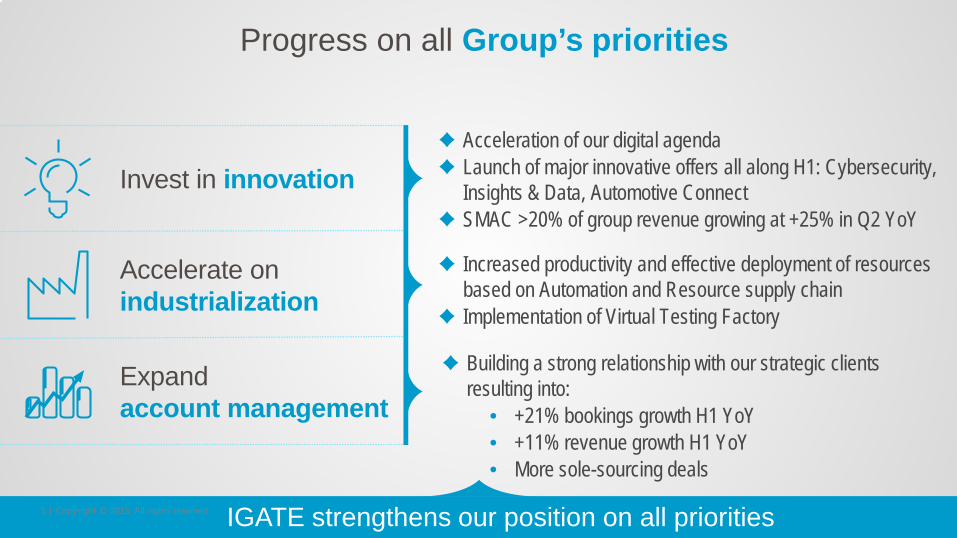
Progress on all Group’s priorities
Invest in innovation
Accelerate on industrialization
Expand account management
IGATE strengthens our position on all priorities
♦ Acceleration of our digital agenda♦ Launch of major innovative offers all along H1: Cybersecurity,
Insights & Data, Automotive Connect♦ SMAC >20% of group revenue growing at +25% in Q2 YoY
♦ Increased productivity and effective deployment of resources based on Automation and Resource supply chain
♦ Implementation of Virtual Testing Factory
♦ Building a strong relationship with our strategic clients resulting into:
• +21% bookings growth H1 YoY• +11% revenue growth H1 YoY• More sole-sourcing deals
5 Copyright © 2015. All rights reserved
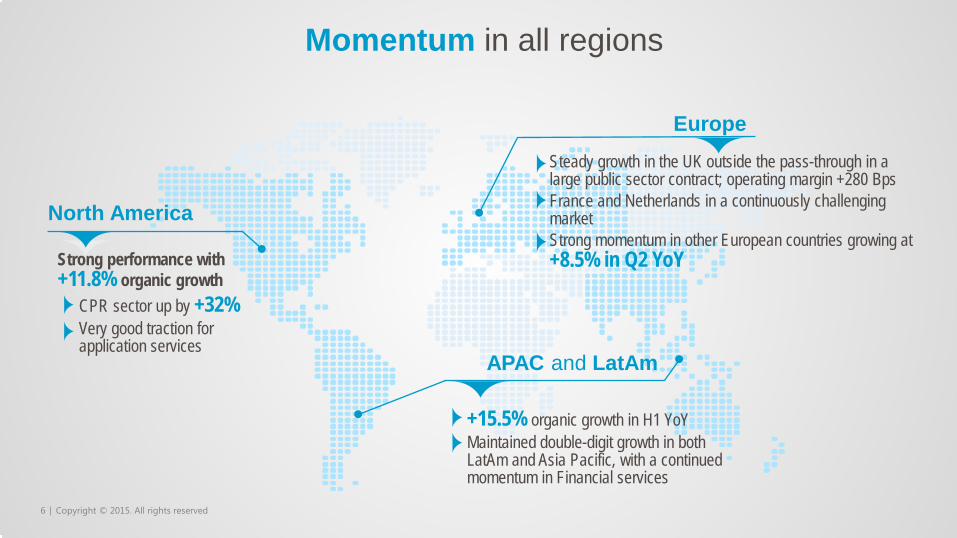
Momentum in all regions
North America
Strong performance with +11.8% organic growth
CPR sector up by +32%Very good traction for application services
EuropeSteady growth in the UK outside the pass-through in a large public sector contract; operating margin +280 BpsFrance and Netherlands in a continuously challenging market Strong momentum in other European countries growing at +8.5% in Q2 YoY
APAC and LatAm
+15.5% organic growth in H1 YoYMaintained double-digit growth in both LatAm and Asia Pacific, with a continued momentum in Financial services
6 Copyright © 2015. All rights reserved

Key wins in H1
Large deals Innovative deals
Large UKRetail Bank
7 Copyright © 2015. All rights reserved

A strong plan to drive a fast and successful integration
♦ IGATE CEO Ashok Vemuri joined Capgemini’sGroup Management Board
♦ Integration team in place♦ Thierry Delaporte, head of the Financial
Services Global Business Unit, ♦ and Srinivas Kandula, IGATE’s Chief People
Officer
♦ A consulting firm supports the integration process
PROJECT TEAM IN PLACE♦ Deliver annual cost and revenue synergies
♦ Revenue synergies $100-150M♦ Enhanced operating model $45-65M♦ Cost synergies $30-40M
♦ Combined efforts focused initially on clients in North America
♦ New structure in place by January 1, 2016
INTEGRATION PRIORITIES
8 Copyright © 2015. All rights reserved

Upgraded 2015 Full Year guidance including IGATE
Current revenue growth of 12%
Operating margin of 10.3%
> €600M organic free cash flow
9 Copyright © 2015. All rights reserved

Paul NANNETTI

11 Copyright © 2015. All rights reserved
Good sales momentum in an improving market
At constant rates and perimeter
Bookings evolution (€M)
Solid H1 bookings growth propelled by Strategic offers (17% YoY growth with Digital Customer Experience at 27%)
Next Gen AM bookings up by double digits with improving profitability
Strategic account sales up 21%
Good sales pipeline and demand generation for H2
Highlights
2 442 2 5992 095
3 492
2 692 2 617
1 000
Q1 14 Q2 14 Q3 14 Q4 14 Q1 15 Q2 15
Areva +5% (H1’15 vs H1’14) ex-Areva
12 Copyright © 2015. All rights reserved
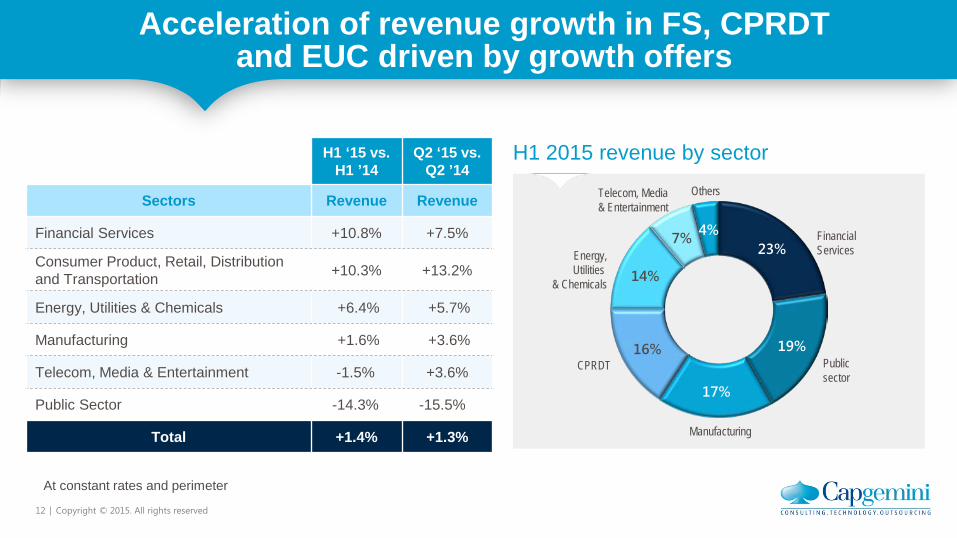
Acceleration of revenue growth in FS, CPRDT and EUC driven by growth offers
H1 2015 revenue by sectorH1 ‘15 vs. H1 ’14
Q2 ‘15 vs. Q2 ’14
Sectors Revenue Revenue
Financial Services +10.8% +7.5%
Consumer Product, Retail, Distribution and Transportation +10.3% +13.2%
Energy, Utilities & Chemicals +6.4% +5.7%
Manufacturing +1.6% +3.6%
Telecom, Media & Entertainment -1.5% +3.6%
Public Sector -14.3% -15.5%
Total +1.4% +1.3%
23%
19%
17%
16%
14%
7% 4% Financial Services
Public sector
Manufacturing
CPRDT
Energy,Utilities
& Chemicals
Telecom, Media & Entertainment
Others
At constant rates and perimeter
13 Copyright © 2015. All rights reserved
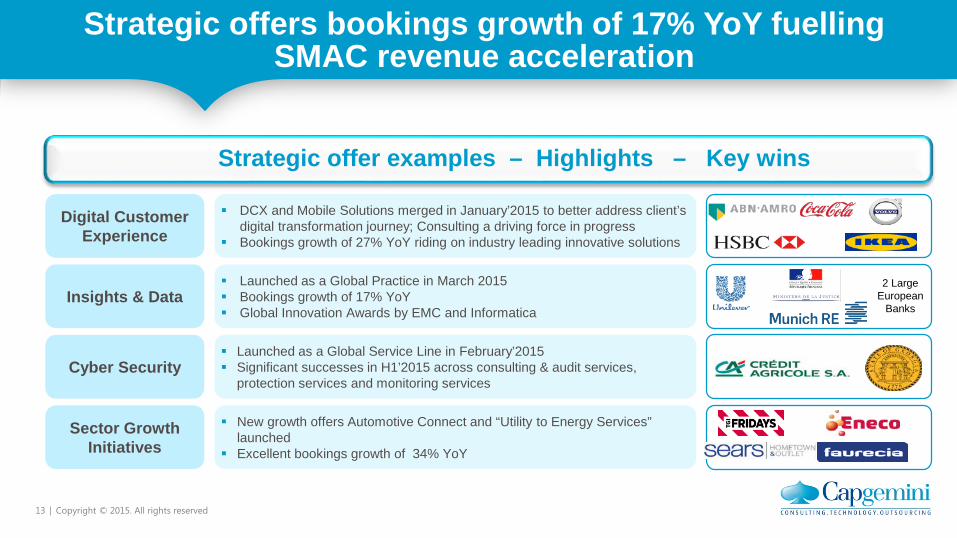
Strategic offers bookings growth of 17% YoY fuelling SMAC revenue acceleration
Strategic offer examples – Highlights – Key wins
2 Large European
Banks
Digital Customer Experience
Insights & Data
Cyber Security
Sector Growth Initiatives
DCX and Mobile Solutions merged in January’2015 to better address client’s digital transformation journey; Consulting a driving force in progress
Bookings growth of 27% YoY riding on industry leading innovative solutions
Launched as a Global Practice in March 2015 Bookings growth of 17% YoY Global Innovation Awards by EMC and Informatica
Launched as a Global Service Line in February’2015 Significant successes in H1’2015 across consulting & audit services,
protection services and monitoring services
New growth offers Automotive Connect and “Utility to Energy Services” launched
Excellent bookings growth of 34% YoY

14 Copyright © 2015. All rights reserved
Increased focus on co-innovation with partners across sectors and offerings
Google Apps/SAP Syclo integration Digital Workplace
Financial Services IP program OneShare SkySight
Insurance Connect (Guidewire on AWS)
Complete orchestration
Business Data Lake – Anomalous Behavior Detection
EMC ViPR SRM – Capgemini SR Oil & Gas – PO, PAM
Bluemix Innovation Lab
Energy Direct , GS Direct, Solution Direct, Mfg Direct
HCM Advantage, CRM Advantage
Insurance ACE ConnectedServices (IoT) Field Execution Mobility Solution
SAP on Hadoop (joint solution with Cloudera)
C4C integration with ODIGO
Security as a Service
Co-innovation
with Partners

15 Copyright © 2015. All rights reserved
Large deals in H1
Business Platform as a Service for new companyRetail
Application Development & Maintenance
Energy & Utilities
Application Development / Integration
Energy & Utilities
Application Management renewalManufacturing
Large European Energy company
Digital / Analytics partnership
Retail Banking
ICT services including Service Integration and Management (SIAM)
Energy & Utilities
New policy admin platform using PegaInsurance
BPO F&A renewalEntertainment
Operational Excellence Consulting and Project services
Retail Banking
Large European Retail bank
Modernizing IT infrastructure to enable digital transformation of banking activities.
Retail Banking
Infrastructure Services –Service IntegrationPublic Sector
Multi Tower renewal and new projectsTransport

AimanEZZAT

17 Copyright © 2015. All rights reserved
Financial Overview
(1) Amortization of intangible assets recognized in business combinations is included in « Other operating income and expense ». The first-half 2014 has been adjusted to reflect this change in presentation.
(2) Normalized Net Profit = Net profit corrected for the impact of restructuring costs and amortization of intangible assets acquired through business combinations net of tax
+1.4%organic growth
in M€ H1 2014 H1 2015 H1 2015 /H1 2014
Revenues 5,104 5,608 +9.9%
Operating expenses -4,702 -5,122
Operating margin 402 486 +21%
(% Revenues) 7.9% 8.7% +0.8pt
Other operating income and expenses (1) -48 -39
Operating profit 354 447 +26%
(% Revenues) 6.9% 8.0% +1.1pt
Net financial expense -34 -41
Income tax expense -91 -127
Non-controlling interests 11 11
Net Profit (Group Share) 240 290 +21%
(% Revenues) 4.7% 5.2% +0.5pt
Normalized Net Profit (Group Share) (2) 261 321
Normalized EPS in € 1.64 1.86 +13%
Organic Free cash flow (for the period) -148 -86 +62

18 Copyright © 2015. All rights reserved
-309
496
-313
455
-148
668
-86
H1 2012 FY 2012 H1 2013 FY 2013 H1 2014 FY 2014 H1 2015
Organic Free Cash Flow
In M€
(1) Before €235M exceptional contribution to a UK pension fund
Net cash30/06/2015€1,464M
(1)

19 Copyright © 2015. All rights reserved
Revenues Quarterly Evolution
H1 2015current growth +9.9% YoY
+2.3% +3.0% +2.8% +5.5% +1.5% +1.3%
Revenue
Currentgrowth YoY
Organicgrowth YoY
+0.2%
+2.7%
+5.7%
+10.4% +10.5%+9.3%
Q1 14 Q2 14 Q3 14 Q4 14 Q1 15 Q2 15
2,503M€
2,601M€
2,591M€
2,877M€
2,764M€ 2,844
M€

20 Copyright © 2015. All rights reserved
Q2 & H1 2015 Revenues by Main Geography
Year-on-Year
Organic Current Organic
In M€ Q2 2015 / Q2 2014 H1 2014 H1 2015 H1 2015 /
H1 2014H1 2015 / H1 2014
North America +12.0% 1,035 1,400 +35.2% +11.8%
UK & Ireland -14.8% 1,081 1,026 -5.1% -15.4%
France -1.8% 1,143 1,215 +6.3% -0.0%
Benelux +0.0% 529 531 +0.4% +0.4%
Rest of Europe +8.5% 924 964 +4.4% +5.7%
APAC & LATAM +9.2% 392 472 +20.1% +15.5%
TOTAL +1.3% 5,104 5,608 +9.9% +1.4%
Year-on-Year
Current
25%
22%
18%
17%
9%
8%
APAC & LATAM
NorthAmerica
France
UK & Ireland
Rest of Europe
Benelux

21 Copyright © 2015. All rights reserved
58%23%
15%4%
Q2 & H1 2015 Revenues by Business
Consulting Services
Application Services
Local Professional
Services
Other Managed Services
Q2 2015 / Q2 2014 H1 2015 / H1 2014
Consulting Services +5.5% +4.4%
Local Professional Services +0.3% +0.5%
Application Services +5.4% +5.1%
Other Managed Services -8.1% -6.7%
TOTAL +1.3% +1.4%
Organic Year-on-Year

22 Copyright © 2015. All rights reserved
Headcount Evolution
Offshore Headcount growth +15% Year-on-Year
ATTRITIONH1’2014 vs H1’2015
Attrition YTD Jun. 14 Jun. 15 Year-on-Year variation
Consulting Services 20.8% 19.4% -1.4pts
Local Professional Services 13.0% 15.9% +2.9pts
Application Services 17.0% 17.7% +0.7pts
Other Managed Services 16.9% 20.7% +3.8pts
TOTAL 16.3% 18.1% +1.8pts
HEADCOUNTDECEMBER 2014 TO JUNE 2015
143,643
4,981 -1,052
147,572
Dec. 2014 Net variationoffshore
Net variationonshore
June 2015
+2.7%
23 Copyright © 2015. All rights reserved
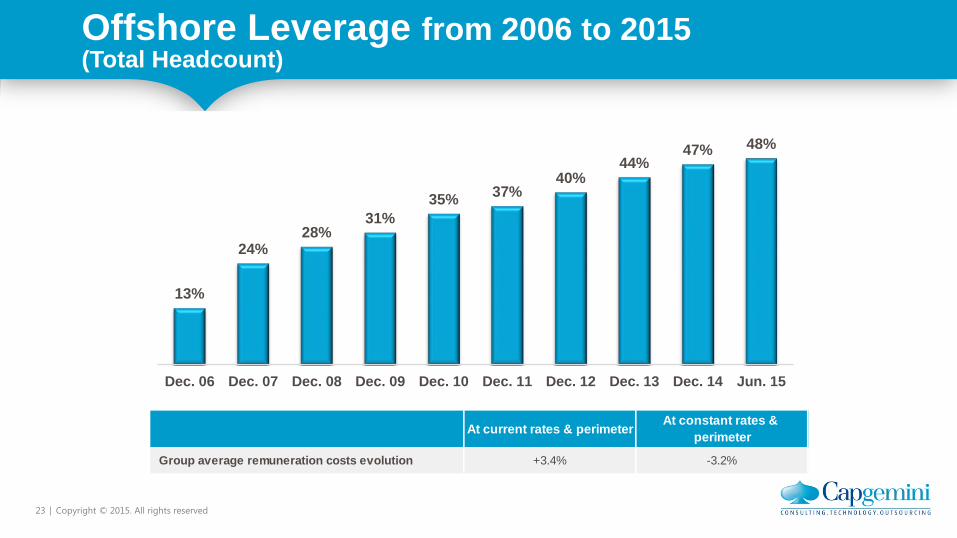
Offshore Leverage from 2006 to 2015(Total Headcount)
13%
24%28%
31%35% 37%
40%44%
47% 48%
Dec. 06 Dec. 07 Dec. 08 Dec. 09 Dec. 10 Dec. 11 Dec. 12 Dec. 13 Dec. 14 Jun. 15
At current rates & perimeter At constant rates & perimeter
Group average remuneration costs evolution +3.4% -3.2%

24 Copyright © 2015. All rights reserved
Operating Margin by Destination
In M€ H1 2014 H1 2015
Revenues 5,104 5,608
Cost of services rendered -3,868 -4,208
% of revenues -75.8% -75.0%
Gross margin 1,236 1,400
% of revenues 24.2% 25.0%
Selling Expenses -436 -466
% of revenues -8.5% -8.3%
General & Administrative Expenses -398 -448
% of revenues -7.8% -8.0%
Operating Margin 402 486
% of revenues 7.9% 8.7%

25 Copyright © 2015. All rights reserved
Operating Margin by Geography
In M€ Revenues Operating margin % Revenues Operating
margin %
North America 1,035 123 11.9% 1,400 185 13.3%
UK & Ireland 1,081 107 9.9% 1,026 130 12.7%
France 1,143 76 6.7% 1,215 76 6.2%
Benelux 529 47 8.9% 531 44 8.4%
Rest of Europe 924 72 7.9% 964 73 7.5%
APAC & LATAM 392 11 2.7% 472 16 3.2%
Not allocated - -34 - - -38 -
TOTAL 5,104 402 7.9% 5,608 486 8.7%
H1 2015H1 2014

26 Copyright © 2015. All rights reserved
Operating Margin by Business
H1 2014 H1 2015
Consulting Services 7.0% 8.1%
Local Professional Services 8.2% 8.7%
Application Services 9.3% 10.0%
Other Managed Services 7.3% 8.2%
TOTAL 7.9% 8.7%

27 Copyright © 2015. All rights reserved
Net Financial Expense and Income Tax Expense
In M€ H1 2014 H1 2015
Interest on bonds -18 -18
Other interest expenses and income from cash and cash equivalents 10 12
Net interest expense -8 -6
Other financial income & expenses -26 -35
Net financial expense -34 -41
In M€ H1 2014 H1 2015
Total income tax expense -91 -127
Effective tax rate 28.6% 31.2%

28 Copyright © 2015. All rights reserved
Net Profit Analysis
in M€ H1 2014 H1 2015
Operating margin 402 486
Other operating income and expenses -48 -39
of which
Restructuring costs -19 -35
Amortization of intangible assets acquired through business combinations (1) -10 -9
Other operating income - 35
Operating profit 354 447
Net financial expense -34 -41
Income tax expense -91 -127
Non-controlling interests 11 11
Net profit (Group share) 240 290
Normalized net profit (Group share)(2) 261 321
Number of shares outstanding end of June 159,063,915 172,155,421
EPS as of June 30 (non diluted) - in € 1.51 1.69
Normalized EPS as of June 30 (non diluted) - in € 1.64 1.86
(1) Amortization of intangible assets recognized in business combinations is included in « Other operating income and expense ». The first-half 2014has been adjusted to reflect this change in presentation.
(2) Normalized Net Profit = Net profit corrected for the impact of restructuring costs and amortization of intangible assets acquired through business combinations net of tax

29 Copyright © 2015. All rights reserved
H1 Achievement
Acquisition financing through Equity and Debt issue in volatile market
Cash Discipline and Investment control maintained
Improvement in Operating Margin by 80bps supporting the 10% OM trajectory
30 Copyright © 2015. All rights reserved
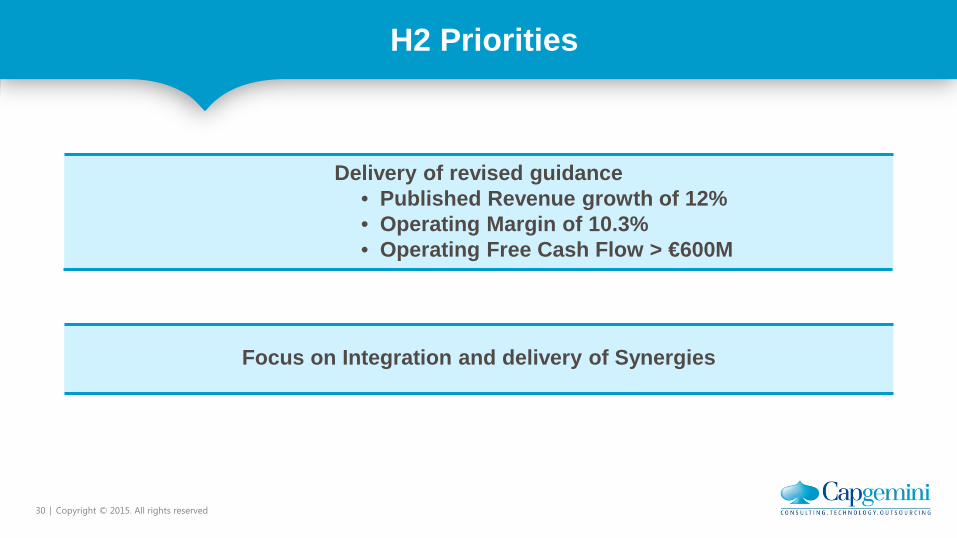
H2 Priorities
Delivery of revised guidance• Published Revenue growth of 12%• Operating Margin of 10.3%• Operating Free Cash Flow > €600M
Focus on Integration and delivery of Synergies

Appendix

32 Copyright © 2015. All rights reserved
1,218 1,132
1,464
-39
-528
-58-73
-49486
114
12343
38
CASH NET OF DEBT -Opening
YTD Operating marginBefore CRA
Amortization andProvisions
Tax Paid Other working capitalevolution
Net interest CAPEX, net ofdisposals
Other Cash Net of DebtBefore Investing andFinancing Activities
Dividends & Treasuryshares
Exchange rate diff. Debt increase & others CASH NET OF DEBT -Closing
Net Cash Evolution
33 Copyright © 2015. All rights reserved
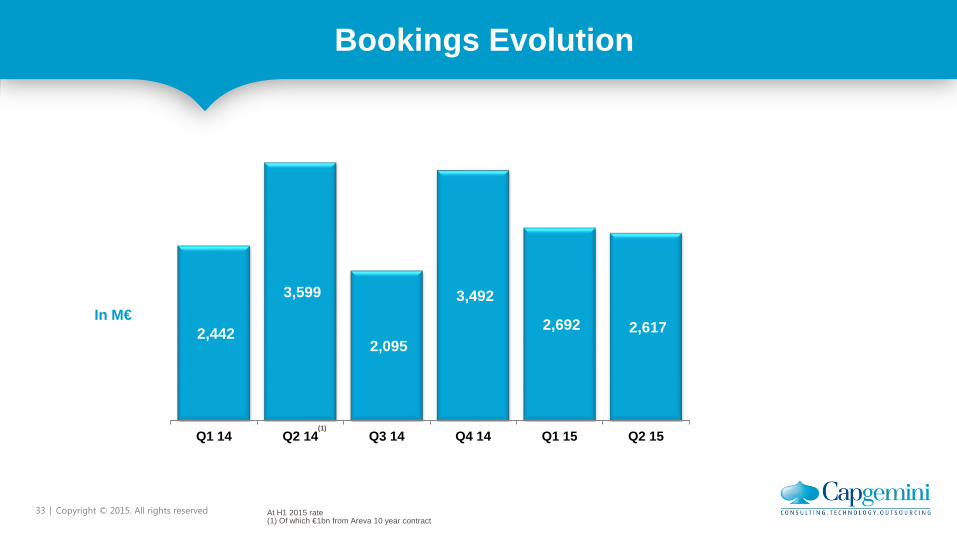
Bookings Evolution
In M€2,442
3,599
2,095
3,492
2,692 2,617
Q1 14 Q2 14 Q3 14 Q4 14 Q1 15 Q2 15(1)
At H1 2015 rate(1) Of which €1bn from Areva 10 year contract

34 Copyright © 2015. All rights reserved
Revenue Quarterly Evolution
Q1 2014 Q2 2014 Q3 2014 Q4 2014 Q1 2015 Q2 2015 H1 2015
in M€ published 2,503 2,601 2,591 2,877 2,764 2,844 5,608
Sequential current growth -4.0% +3.9% -0.4% +11.1% -3.9% +2.9% +2.6%
Sequential organic growth -3.6% +1.9% -2.5% +10.0% -7.3% +1.9% -2.0%
Year-on-Year current growth +0.2% +2.7% +5.7% +10.4% +10.5% +9.3% +9.9%
Year-on-Year organic growth +2.3% +3.0% +2.8% +5.5% +1.5% +1.3% +1.4%

35 Copyright © 2015. All rights reserved
Q2 2015 Revenues by Main Geography
26%
21%
18%
17%
9%
8%
APAC & LATAM
North America
France
UK & Ireland
Rest of Europe
Benelux
Current Organic Current Organic
In M€ Q2 14 Q1 15 Q2 15 Q2 15 / Q1 15
Q2 15 / Q1 15
Q2 15 / Q2 14
Q2 15 / Q2 14
North America 540 662 737 +11.2% +9.1% +36.6% +12.0%
UK & Ireland 542 504 523 +3.8% +0.7% -3.7% -14.8%
France 587 620 595 -4.2% -4.2% +1.4% -1.8%
Benelux 264 267 264 -1.1% -1.1% -0.0% -0.0%
Rest of Europe 458 471 493 +4.7% +4.2% +7.6% +8.5%
APAC & LATAM 210 240 232 -3.3% -1.1% +10.2% +9.2%
TOTAL 2,601 2,764 2,844 +2.9% +1.9% +9.3% +1.3%
Sequential Year-on-Year

36 Copyright © 2015. All rights reserved
58%23%
14%4%
Q2 2015 Revenues by Business
Sequential Year-on-Year
Organic Q2 15 / Q1 15 Q2 15 / Q2 14
Consulting Services +2.1% +5.5%
Local Professional Services -3.1% +0.3%
Application Services +3.6% +5.4%
Other Managed Services +1.0% -8.1%
TOTAL +1.9% +1.3%
Consulting Services
Application Services
Local Professional
Services
Other Managed Services

37 Copyright © 2015. All rights reserved
23%
19%
17%
16%
14%
7%4%
Q2 & H1 2015 Revenues by Sector
Organic Year-on-Year H1 15 / H1 14 Q2 15 / Q2 14
Financial Services +10.8% +7.5%
Energy, Utilities & Chemicals +6.4% +5.7%
Manufacturing +1.6% +3.6%
Consumer Product, Retail, Dist. & Transportation +10.3% +13.2%
Public Sector -14.3% -15.5%
Telecom, Media & Entertainment -1.5% +3.6%
TOTAL +1.4% +1.3%
Telecom, Media & Entertainment
Financial Services
Others
Energy, Utilities& Chemicals
Manufacturing
Consumer Product, Retail, Distribution &
Transportation
Public Sector
38 Copyright © 2015. All rights reserved
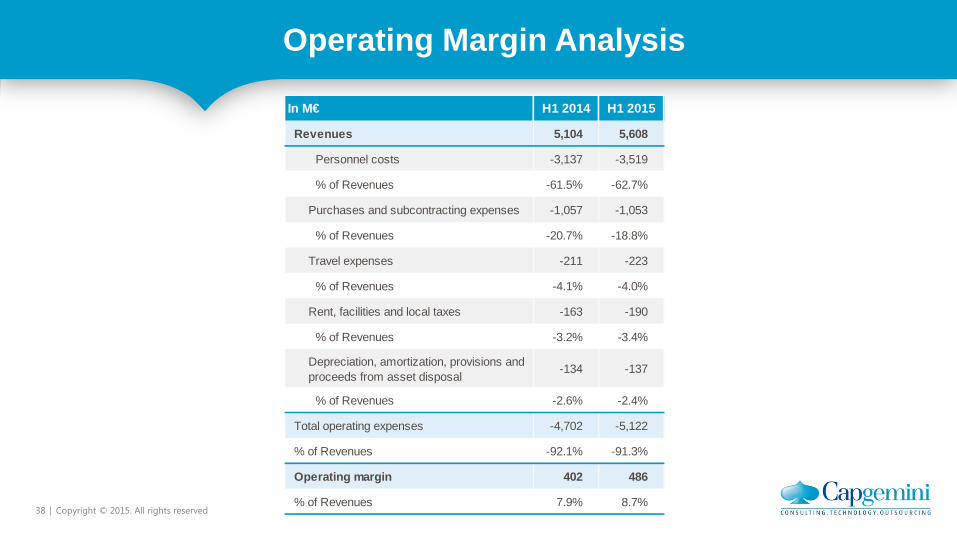
Operating Margin Analysis
In M€ H1 2014 H1 2015
Revenues 5,104 5,608
Personnel costs -3,137 -3,519
% of Revenues -61.5% -62.7%
Purchases and subcontracting expenses -1,057 -1,053
% of Revenues -20.7% -18.8%
Travel expenses -211 -223
% of Revenues -4.1% -4.0%
Rent, facilities and local taxes -163 -190
% of Revenues -3.2% -3.4%
Depreciation, amortization, provisions and proceeds from asset disposal
-134 -137
% of Revenues -2.6% -2.4%
Total operating expenses -4,702 -5,122
% of Revenues -92.1% -91.3%
Operating margin 402 486
% of Revenues 7.9% 8.7%
39 Copyright © 2015. All rights reserved
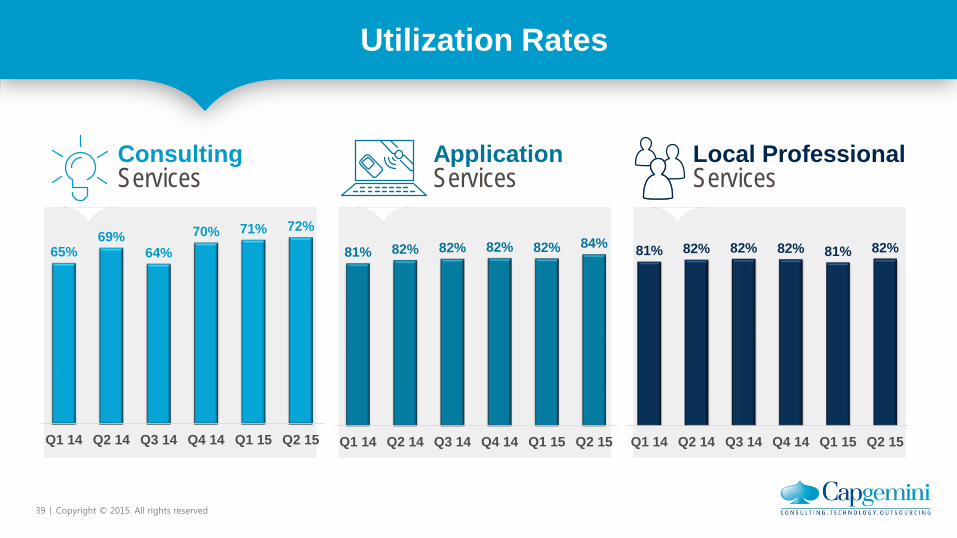
Utilization Rates
ConsultingServices
ApplicationServices
Local Professional Services
65%69%
64%70% 71% 72%
Q1 14 Q2 14 Q3 14 Q4 14 Q1 15 Q2 15
81% 82% 82% 82% 82% 84%
Q1 14 Q2 14 Q3 14 Q4 14 Q1 15 Q2 15
81% 82% 82% 82% 81% 82%
Q1 14 Q2 14 Q3 14 Q4 14 Q1 15 Q2 15
40 Copyright © 2015. All rights reserved
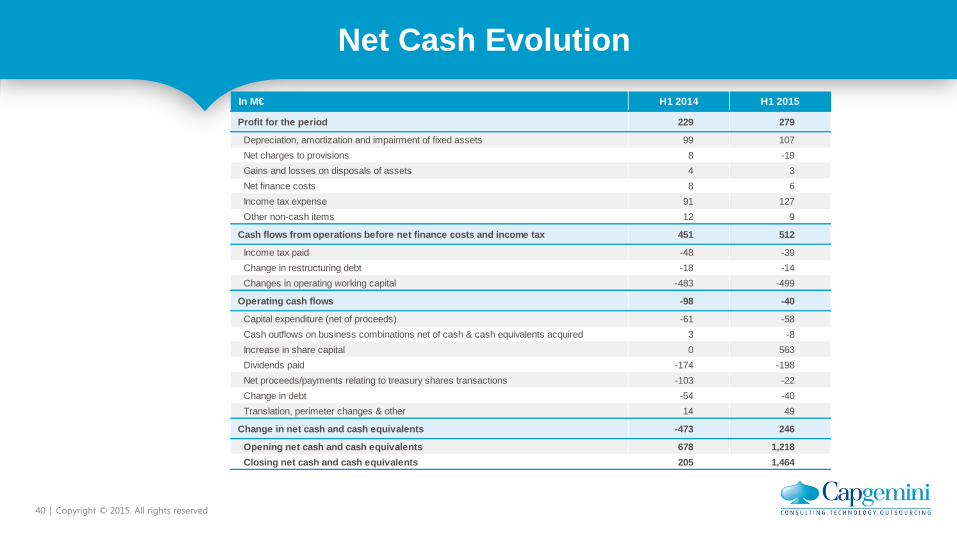
Net Cash EvolutionIn M€ H1 2014 H1 2015
Profit for the period 229 279
Depreciation, amortization and impairment of fixed assets 99 107Net charges to provisions 8 -19Gains and losses on disposals of assets 4 3Net finance costs 8 6Income tax expense 91 127Other non-cash items 12 9
Cash flows from operations before net finance costs and income tax 451 512
Income tax paid -48 -39Change in restructuring debt -18 -14Changes in operating working capital -483 -499
Operating cash flows -98 -40
Capital expenditure (net of proceeds) -61 -58Cash outflows on business combinations net of cash & cash equivalents acquired 3 -8Increase in share capital 0 563Dividends paid -174 -198Net proceeds/payments relating to treasury shares transactions -103 -22Change in debt -54 -40Translation, perimeter changes & other 14 49
Change in net cash and cash equivalents -473 246
Opening net cash and cash equivalents 678 1,218Closing net cash and cash equivalents 205 1,464

41 Copyright © 2015. All rights reserved
Balance Sheet
In M€ Dec 31,2014
Jun 30,2015 In M€ Dec 31,
2014Jun 30,
2015
Equity(1) 5,057 6,017
Non-controlling interests 26 14
Total equity 5,083 6,031
Goodwill 3,784 3,925 Long-term borrowings 914 922
Intangible assets 158 149 Deferred taxes 158 131
Property, plant & equipment 515 514 Provisions for pensions(2) 1,294 1,268
Deferred taxes 1,065 1,049 Non-current provisions 24 33
Other non-current assets 260 359 Other non-current liabilities 254 294
Total non-current assets 5,782 5,996 Total non-current liabilities 2,644 2,648
Short-term borrowings and bank overdrafts 102 3,445
Accounts & notes receivable 2,849 3,149 Accounts and notes payable 2,543 2,357
Current tax assets 46 11 Advances from cust. and billed in advance 776 846
Other current receivables 551 591 Current provisions 48 47
Cash management assets 90 92 Current tax liabilities 115 60
Cash and cash equivalents 2,141 5,741(3) Other current payables 148 146
Total current assets 5,677 9,584 Total current liabilities 3,732 6,901
Total Assets 11,459 15,580 Total Equity & Liabilities 11,459 15,580
ASSETS EQUITY & LIABILITIES
(1) attributable to owners of the company(2) and other post-employment benefits(3) Cash and cash equivalents includes the cash to finance the IGATE acquisition