h1 2018 results presentation - contourglobal...fy 2018 preliminary results presentation ... business...
TRANSCRIPT

FY 2018 Preliminary Results PresentationApril 5th, 2019

2
Disclaimer
The information contained in these materials has been provided by ContourGlobal plc (“ContourGlobal” or the “Company”) and has not been independently verified.No representation or warranty, express or implied, is made as to, and no reliance should be placed on, the fairness, accuracy, completeness or correctness of theinformation or opinions contained herein. It is not the Company’s intention to provide, and you may not rely on these materials as providing, a complete orcomprehensive analysis of the Company’s financial position or prospects. The information and opinions contained in these materials are provided as at the date ofthis presentation and are subject to change without notice. Neither the Company nor any of its affiliates, advisors or representatives shall have any liabilitywhatsoever (in negligence or otherwise) for any loss whatsoever arising from any use of this presentation or its contents or otherwise arising in connection with thispresentation.
Certain statements in this presentation are “forward-looking statements.” All statements other than statements of historical facts included in this presentation,including, without limitation, those regarding the Company’s financial position, business strategy, plans and objectives of management for future operations, areforward-looking statements. These statements involve a number of factors that could cause actual results to differ materially, including, but not limited to, changesin economic, business, social, political and market conditions, success of business and operating initiatives, and changes in the legal and regulatory environment andother government actions. Forward-looking statements contained in this presentation regarding past trends or activities should not be taken as a representation thatsuch trends or activities will continue in the future. Any forward-looking statement made during this presentation or in these materials speaks only as of the date onwhich it is made. The Company assumes no obligation to update or revise any forward-looking statements.
Information contained herein relating to markets, market size, market share, market position, growth rates, penetration rates and other industry data pertainingto the Company’s business is based on the Company’s estimates and is provided solely for illustrative purposes. In many cases, there is no readily available externalinformation to validate market-related analyses and estimates, thus requiring the Company to rely on internal surveys and studies. The Company has also compiled,extracted and reproduced market or other industry data from external sources, including third parties or industry or general publications, for the purposes ofits internal surveys and studies. Any such information may be subject to significant uncertainty due to differing definitions of the relevant markets and marketsegments described.
This presentation contains references to certain non-IFRS financial measures and operating measures. These supplemental measures should not be viewed in isolationor as alternatives to measures of the Company’s financial condition, results of operations or cash flows as presented in accordance with IFRS in its consolidatedfinancial statements. The non-IFRS financial and operating measures used by the Company may differ from, and not be comparable to, similarly titled measures usedby other companies. The non-IFRS adjustments for all periods presented are based upon information and assumptions available as of the date of this presentation.

3
Delivering on Commitments
(1) Includes full year earnings of Spanish CSP, which was acquired in May 2018 (+$40m of Adjusted EBITDA based on FY earnings)(2) CFADS as defined in Bond Indenture post cash overhead at the corporate level divided by corporate bond interest(3) Net corporate debt divided by CFADS plus distributions from Solar Italy farm down
Proposal to raise Dividend to $90m (13.4 USD cents per share) in 2018 and Dividend Growth Guidance to 10%
• Industry Leader in Health & Safety: LTI rate of 0.03
• Availability: 97% Renewable | 90% Thermal
• Two highly accretive investments delivering~$240m run-rate EBITDA
• Capital recycling through farm downs crystallizingsignificant value of underlying assets
• Final EPC provider for Kosovo to be selected inApril 2019
Adj. EBITDA
+19% growth vs. 2017A$610m
Prop. Adj. EBITDA
+23% growth vs 2017A$536m
Net Debt/ Adj. EBITDA
4.0x-4.5x target4.4x1
HoldCo DSCR
>5-6x Credit Rating Upgrade Threshold
6.1x2
2018 Key Financial Metrics Quality Business, Profitable, Selective Growth
FFO $302m +18% growth vs. 2017A
+18% growth vs. 2017AHoldCo Net Leverage
2.2x3 Sustainable leverage

4
513
610
2017 2018 2019 Run-rate Double Adj.EBITDA
Investing in selective profitable growth to achieve target of doubling 2017 Adj. EBITDA
• Introducing Proportionate Adj. EBITDA metric as an additional metric given farm downs
• Resilient Balance Sheet with $337m parent-level and $697m total cash (excluding the proceeds of the CSP farm downannounced in December 2018 and expected to close in Q2 2019 (€134m)). No incremental equity required to deliverremaining growth while accelerating dividend
• ~1.0 GW of acquisitions and developments currently in advanced stages
Adj. EBITDA close to doubling the 2017A Adj. EBITDA ($m) Prop. Adj. EBITDA ($m)
(1) Guidance includes acquisition of Mexico CHP assuming closing in June 2019 and ~$50m of gain on CSP Spain farm down expected to close in Q2 2019(2) Run-rate includes full year contribution of Mexico CHP acquisition on the basis of a first full year EBITDA of $110m
$720-$770Guidance1
$760-$810Run-rate2
434
536
2017 2018 2019 Run-rate DoubleProp. Adj.
EBITDA

5
Mexican Cogeneration Business Acquisition Signed in Jan 2019 on Track for COD and Close in H1 2019
• Acquisition of natural-gas fired combined heat & power assetswith 518MW of operational capacity at completion, potential for afurther 414MW in development
• Commissioning of 414 MW CGA 1 plant progressing with CODexpected in H1 2019.
• Successful COD condition precedent to transaction close. Alpekremains with construction risks
• $590m project financing underwritten by Scotia Bank to besyndicated in Q2
• +80% contracted revenues – on track for 90% contracted revenuesat transaction close
• Estimated Adj. EBITDA of $110m in first full year of operations
• Circular sent to shareholders; General Meeting to be held on April5th
Overview of Assets
CGA I: 414 MW Plant under commission
Transaction Highlights and Update:

6
Kosovo A Plant to be decommissioned at COD of new Kosovo plant
• Persistent shortages and unreliable electricity supplydue to peak capacity gap and high technical losses
• Kosovo businesses incur costs of more than€300 million due to unreliable power supply
• The new Kosovo plant will boost growth by ~2% inmid-term, on top of the forecasted 4.5% growth to 2022.
Kosovo Project UpdateImplementing Project is an Economic and Environmental Imperative
Sources: USAID – Impact from Electricity Supply on Kosovar Business, IMF Country Report No 18/30 – Republic of Kosovo and The Health and Environment Alliance (HEAL)
• Kosovo’s current plant is the most polluting in Europe,emitting 9 times more damaging particulate matter(PM2.5) than the average of coal plants in the Balkans
• Other emissions from existing power plants arealso health hazardous and contribute to Kosovo havingone of the highest rates of premature deaths in Europe
• New plant will significantly decrease all emissions,including CO2, resulting in significantly improvedenvironmental and health outcomes:
Significant Reduction in Pollution Will Improve Environment and Population Health
Reliable Electricity Supply Will Remove Major Impediment to Development
PM2.5 93% (Dust)
SOx 85% (Sulphur oxides)
NOx 93% (Nitrogen dioxide)
CO2 38% (Carbon dioxide)
6

7
EPC Contract • Final EPC provider to be announced in April 2019
• Highly competitive procurement process for turn key contract with virtually no construction risk for ContourGlobal
• Final proposals from global leaders in EPC and equipment supply
• State-of-the-art coal plant in accordance with EU and OECD Best Available technology
Financing• Financing consists of a mix of Development Finance
Institutions (“DFI”) and Export Credit Agencies (“ECA”)
• Financial Close – partially driven by timing of EPC
• ECA is driven by EPC bidder selection. ContourGlobal engaged with multiple parties
Kosovo Project UpdateSelection and Announcement of EPC Provider Imminent
Key Areas of Progress in 2018
Major Milestones
Political Risk Insurance (“PRI”)• ContourGlobal has been in discussion with private
market PRI providers since mid-2018
• Preliminary agreements totaling €360m
• Expect to execute final PRI package around financialclose
Project Agreements Effective Date May-2018
Receipt of EPC Technical Proposals Dec-2018
EPC Selection Announcement Apr-2019
Financial Closing and Notice to Proceed (NTP) H2 2019
Commercial Operations Date 2023
7

8
European Solar Platform Growth PlanHighly attractive valuation of minority farm downsPartnerships with high quality investors accelerate growth
• In H2 2018 ContourGlobal signed two minoritystake farm downs to Credit Suisse EnergyInfrastructure Partners (“CSEIP”)
(1) Purchase price at closing including locked box interest and upfront payment of expected refinancing proceeds. Closing happened in October 2018 (2) Farm down to close in Q2 2019(3) Includes 12MW Italian acquisition signed in February 2019 and to be closed in April 2019
• Agreement for future acquisitions anddevelopments in Solar Italy, plus a significantlydecreasing cost structure combined withincrease in operational metrics, furtheraccelerates growth expectations for business
• Partnership combines extensive industrynetwork, considerable transaction experienceand sector specific knowledge of two leadinginstitutions
CSEIP Partnership helps power future growth plan:
Farm downs crystalize high value of underlying assets:
Assets Stake Sold Purchase Price Net Equity Multiple
Italy + Slovakia 49% EUR 63m1 2.3x
Spain 49% EUR 134m2 1.9x
Portfolio Growth Plan (in MW):
• 40% capacity growth from 2017 to 2018
• Target is to more than double current portfolio until end of 2022
50
27
77 77
150
3535
35
7 7
7
8534 119
269
2017 2018 Current Portfolio Target
Italy Pipeline Slovakia Romania
8
3

9
Substantial Progress on Wind Repowering in AustriaTechnological advancements will increase the production of Phase I by 80%
• 149 MW wind portfolio in Austria to be repowered over 2 phases
• Repowering enables wind farms to significantly increase production and be granted additional attractive Feed-in-Tariff for 13– 20 years
• Significant higher energy production will drive an annualized EBITDA increase of approx. €5m for Phase I and of approx. €10mfor Phase II
Pre-Repowering Post-Repowering
Production (GWh, P50) FiT Expiry
Production (GWh, P50) CAPEX COD New FiT
Repowering Phase I (23 MW)
44.8 2016-2017 80.9(+80%)
€43m fully funded Jan-2019 (complete) and Q2 2019
Term: 13 yearsAverage Secured tariff of €87.4/MWh
Repowering Phase II (50 MW)
113.0 2017-2023 164.1(45%)
€71-82m (expected) 2022-2024 Term: 13 years
FiT Expiry 2026+ (76 MW)
176.4 2026+ Assessment in 2024
Scharndorf Repowering
Decommissioning of old turbines in Velm-Götzendorf
9

10
2. OperationsKarl SchnadtExecutive Vice President & Chief Operating Officer
KivuWatt – Methane Gas Extraction Facility & Power Plant (Rwanda) 10

11
0.03
0.18 0.18 0.19 0.24 0.26 0.26 0.26 0.30 0.35 0.36 0.360.44 0.46 0.50 0.54
0.66
0.88 0.90
1.21LTIRSelected Peers Top Quartile = 0.20US Utility Industry (Power Generation) = 0.50
Industry Leading Health & Safety PerformanceTarget Zero close, but still not achieved
Inka Wind Farm, Peru
Leading the Sector in Health and Safety Performance1
‘Target Zero’ Remains ContourGlobal’s Key Priority
Our 2018 TRIR(5) is 0.17 vs. a target of 0.16
(1) Source: peers information as 2017 reported in annual reports/sustainability reports published by companies normalized to basis of 200,000 working hours (2) Lost time injury rate (LTIR) is an industry standard reporting convention for calculating injuries in the workplace. Ltir measures recordable lost time incident (LTI) rates on the basis of 200,000 working hours (3) Selection of comparable peers from study performed by Black & Veatch with all major players in the us power generation sector and European companies (4) Based on the 2017 report for days away from work cases - injuries and illnesses from the bureau of labor statistics (5) TRIR: total recordable incident rate
4
3
2
11
LTIR
2
1 1
0.06
0.03 0.03
-0.02
0
0.02
0.04
0.06
0.08
0
0.5
1
1.5
2
2.5
2016 2017 2018# of LTIs LTIR

12
Divisional Operating Performance
93.0% 92.6% 90.2%
2016 2017 2018
Thermal – Equivalent Availability Factor1 (%)
Hydro – Equivalent Availability Factor1 (%)
92.3% 97.8% 98.5%
2016 2017 2018
Wind – Equivalent Availability Factor1 (%)
96.1% 92.7% 95.8%
2016 2017 2018
99.5% 99.2% 99.2% 95.3%
2016 2017 2018
Solar PV Solar CSP
Solar – Equivalent Availability Factor1 (%)
(1) Equivalent Availability factor refers to the actual amount of time a plant or group of plants is available to produce electricity
74% weighted average PPA minimum availability requirement
• Significant room between availability and average minimum PPA requirements
• Significant improvement in Brazil Wind operations driving improvement in wind EAF
12
• Further improvement in already excellent hydro availability; plants primarily rewarded on capacity or regulatory payments as opposed to individual plant generation
• 99%+ solar PV availability; integration and maintenance at CSP plants acquired in May 2018
13
41%
22%
41%
14%
21%
25%
52%
44%
24%
47%
12%
22%
32%
47%
Brazil Wind Austria Wind Peru Wind Solar PV Spanish CSP Vorotan Brazil Hydro
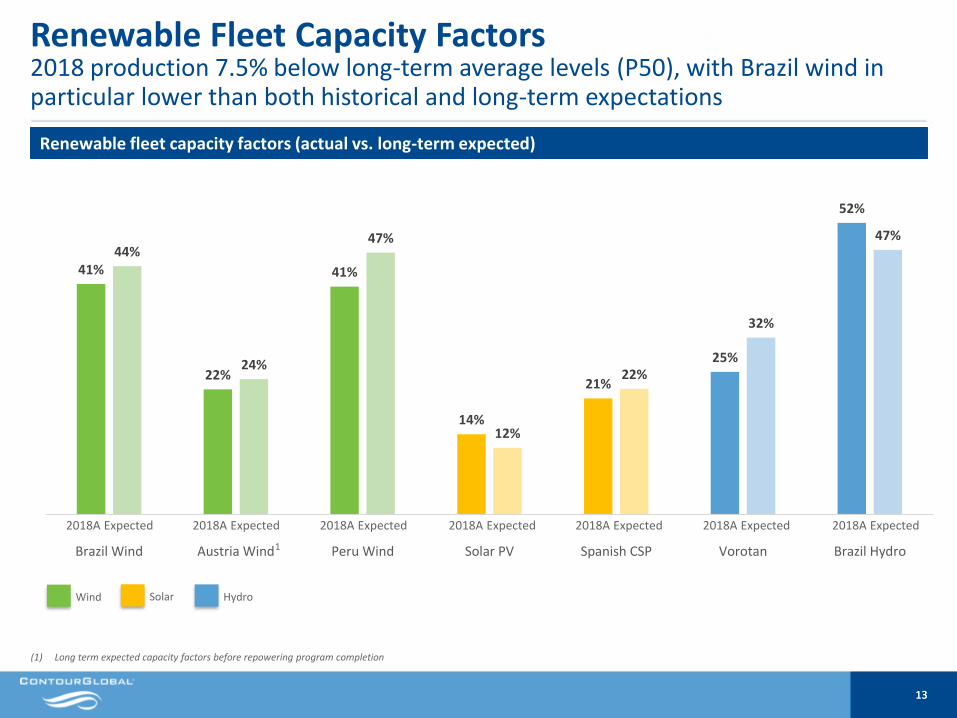
Renewable Fleet Capacity Factors2018 production 7.5% below long-term average levels (P50), with Brazil wind in particular lower than both historical and long-term expectations
Renewable fleet capacity factors (actual vs. long-term expected)
(1) Long term expected capacity factors before repowering program completion
1
Wind Solar Hydro
2018A
13
Expected 2018A Expected 2018A Expected 2018A Expected 2018A Expected 2018A Expected 2018A Expected

14
3. Financial ResultsLaurent Hullo
Asa Branca Wind Farm (Brazil) 14

15
256 302
2017 2018
434
536
576
2017 2018
513
610
650
2017 2018
Robust Financial PerformanceSignificant growth in Adjusted EBITDA, Proportionate Adjusted EBITDA and FFO
(1) Adjusted EBITDA and FFO are non-IFRS measures as defined in IPO Prospectus(2) Growth calculated between 2017 and 2018 including full year contribution of Spanish CSP(3) Pro forma numbers: Adjusted to reflect full year contribution of Spanish CSP.
Adjusted EBITDA1
($m)
+27%2 +29%2
FFO1
($m)
3
2018 Adj. EBITDA of $610m within the guidance range of $600-630m
Proportionate Adjusted EBITDA($m)
3
+33%2
15
330³

16
202
309
10 2
104 21
(23)
(7)
Adj. EBITDA 2017 Wind availability Wind resource Other Organic Acquisitions Farm-downs FX Impact andOther
Adj. EBITDA 2018
332 327
12
(10) (6)
Adj. EBITDA 2017 Maritsa French Caribbean FX Impact and Other Adj. EBITDA 2018
Successful Integration of New Assets Drives GrowthAdjusted EBITDA bridges
ADJUSTED EBITDA – THERMAL DIVISION ($m)
ADJUSTED EBITDA – RENEWABLE DIVISION ($m)
1
1
1
(1) Before Corporate Costs. 2017 Renewable EBITDA adjusted for reallocation between Renewable HoldCos and Corporate Overhead of approx. $9m(2) Spanish CSP Acquisition closed on May 10th 2018. Solar Italy and Biogas portfolio closed on December 4th, 2017 and March 22nd, 2018. Hydro Brazil closed on March 17th, 2017(3) Solar Italy and Slovakia farm downs closed on October 17th, 2018
1
53% increase
2%decrease
Better EAF in Brazil Wind
($20m) in Brazil Wind and ($3.5m) in Austria wind slightly offset by Peru Wind
Spanish CSP, Solar Italy and Biogas, Hydro Brazil2
Cash gain on 49% divestment of Solar Italy and Slovakia portfolios3
Change in revenue recognition standard and
policy (IFRS15)
One-off reversal of bad debt provision in 2017
16

17
Adj. EBITDA to Adj. Net Income1 Bridge
17
+$97m: Growth driven mainly by the CSP acquisition ($89m) and minority farm downs ($21m) slightly offset by low capacity factors in Brazil
+$10m: Costs mainly related to the Spanish CSP acquisition, Mexican CHP acquisition, as well as Solar Italy acquisition costs and farm down DD costs
+$21m: Cash gain on Solar Italy and Slovakia 49% farm downs booked directly in equity under IFRS rules
+$9m: Non-cash impact of financial assets’ revenue recognition under IFRS
+$54m: Higher D&A driven mainly by the Spanish CSP acquisition and full year impact of Brazil Hydros and Thermal acquired in March 2017
+$16m: Higher finance costs mainly due to the Spanish CSP acquisition ($25m) and one-off bond premium following July 2018 corporate bond refinancing ($22m) recognized in 2018. Partially offset by natural deleveraging of project financing and the $10m reduction of interest at corporate level
1 1
2
2
23
3
5
5
6
6
4
4
(1) Net income adjusted for one-off items
EBITDA to net income bridge ($m) Dec-18 Dec-17
Adjusted EBITDA 610.1 513.2
Share of adjusted EBITDA in associates (21.2) (21.6)
Share of profit in associates 2.9 5.0
Acquisition related items (19.6) (9.5)
Costs related to ContourGlobal Plc IPO (0.4) (12.7)
Cash gain on sale of minority interest (20.9) -
Restructuring costs (6.7) -
Private incentive plan (4.1) -
Other (36.4) (27.5)
EBITDA 503.7 446.9
Depreciation & Amortization (239.3) (185.6)
Finance costs net (236.6) (220.7)
Income tax (17.4) (27.1)
Net Income 10.4 13.5
Bond refinancing one-off cost 21.9 -
ContourGlobal Plc IPO costs 0.4 12.7
Acquisition related items 19.6 9.5
Restructuring costs 6.7 -
Private incentive plan (non cash, non PLC cost)
4.1 -
Adj. Net Income 63.1 35.7
Minorities (4.6) (5.9)
Net Income to ContourGlobal PLC shareholders
15.0 19.4
Adj. Net Income to ContourGlobal PLC shareholders
67.7 41.6

18
255.9
302.3
96.9
(11.7) (5.9)(20.9)
(11.2) (0.8)
2017 FFO Adj. EBITDA Interest paid Maintenancecapex
Cash gain onminority sale
Income tax paid Other 2018 FFO
Significant Cash Conversion Achieved in 2018Significant improvement in FFO in 2018 (+18% vs. 2017)
(1) Funds From Operations is defined as Cash Flow from Operating Activities excluding changes in working capital, less interest paid, less maintenance capital expenditure, less distribution to minorities. Funds from Operations is a non-IFRS measure.
2017 FFO to 2018 FFO ($m)1
Gain on Solar Italy and Solar Slovakia farm
downsContinuous growth in Adj. EBITDA
The cash conversion rate, which compares FFO to Adjusted EBITDA, remained fairly stable at 50% during the period.
50% cash conversion
50% cash conversion
18

19
Dec-18 LIQUIDITY – ($m) Dec-18 NET DEBT – ($m)
Ample Cash Resources to Support Future Growth and Dividend
• $2.9bn Net Debt as of December 31, 2018
• Committed to high value growth while maintaining strong BB credit ratings
• $414m liquidity at parent level, including $337m of cash and $77m undrawn capacity under our corporate level revolver. Thisis excluding the proceeds of the CSP farm down announced in December 2018 and expected to close in Q2 2019 (€134m)
• 2018 proposed final dividend of $63.3m, 9.5 USD cents per share, equates to full year dividend of $90m for 2018 (+12.5%increase from previous guidance) to be paid in May 2019
2,695 2,863
865
(697)
Project Debt Corporate Debt Cash Net Debt Dec-18 (IFRS)
19
360
774
337 77
Asset LevelCash
HoldCo LevelCash
Revolving CreditFacility
Total LiquidityDec-18

20
Optimized Debt/Capital StructureLong-term non-recourse Project Finance at asset level ensures sustainable debt ratios and significant dividend coverage at corporate level
20
Asset levelSignificant recurring cash flow from asset to corporate level…
Corporate level
Distributions to Corporate Level:
$275m1
Cash overhead at Corporate Level:
($32m)
Corporate Bond Interest Costs: ($34m)
Cash available for investment and dividends:
$210m
Key Corporate Metrics
DSCR: 6.1x (7.3x including distributions from Solar Italy farm down)2
Net Corporate Leverage: 2.2x3
Dividend Cover: 2.3x4
…results in consistently high corporate interest cover and
sustainable corporate leverage
(1) Including Solar Italy farm down proceeds of $40m(2) CFADS as defined in Bond Indenture post cash overhead at the corporate level divided by corporate bond interest(3) Net corporate debt divided by CFADS plus distributions from Solar Italy farm down(4) CFADS plus distributions from Solar Italy farm down after corporate bond interest divided by dividend guidance ($90m in 2018)

21
5.4x
4.6x
4.1x 4.4x
2015 2016 2017 2018
Average debt maturity extended to almost 10 years, interest cost reduced, corporate debt term extended1
Adj. IFRS Net Debt / Adj. EBITDA1, 2
(1) Adjusted Net Debt and Adjusted EBITDA are non-IFRS measures(2) ContourGlobal share of Net Debt at TermoemCali and Sochagota considered(3) Net Leverage Ratio includes full year earnings of Spanish CSP, which was acquired in May 2018 (+$40m of Adjusted EBITDA based on FY earnings)(4) Weighted average cost of debt excludes inflation CPA adjustment on Brazil debt as this component is effectively passed through to revenue through PPA tariff structure
3
Weighted average cost of debt (%)4
Weighted average outstanding life of debt (years)
4.8%4.5%
2017 2018
8.3
9.9
2017 2018
• July 2018 refinancing of corporate bond to reduce annualized corporate interest costs by $10m per annum
21

22
Appendix
22Sao Domingos II Hydro Power Plant (Brazil)

23
Financial HighlightsKey financial metrics
23
In $ millions 2018 2017 Var %
Revenue 1,253 1,023 23%
Gross profit 320 306 4%
Adjusted EBITDA 610 513 19%
Proportionate Adjusted EBITDA 536 434 23%
Income from Operations 262 269 (3%)
Net finance cost (237) (221) 7%
Income tax expense (17) (27) (36%)
Net profit / (loss) after income tax 10 14 (23%)
Basic earnings per share (pence) 0.02 0.03 (33%)
FFO 302 256 18%

24
610.1
302.3
(180.9)
(35.1)(24.6)
(19.5)(17.8)
(29.9)
Adjusted EBITDA Interest paid Income tax paid Maintenancecapex
Cash distributionminorities
JV and Associates Other Funds fromOperations
Significant Cash Conversion Achieved in 2018Consistently strong cash conversion
(1) Funds From Operations is defined as Cash Flow from Operating Activities excluding changes in working capital, less interest paid, less maintenance capital expenditure, less distribution to minorities. Funds from Operations is a non-IFRS measure.
(2) Other in 2018 includes cash gain on sale of minority interests
2018 ADJUSTED EBITDA TO FFO1
50% cash conversion
(2)
24

25
Leverage Ratio1 DSCR1
In $m or multiple In $m or multiple
Continued Strong Bond Credit Metrics6.1x DSCR & 3.8x Non-Guarantor Combined Leverage Ratio as of December 2018
202
301
237 232
291
203
32 33 41 41 43 34
6.3x
9.2x
5.7x 5.6x
6.8x
6.1x
(0.5x)
0.5x
1.5x
2.5x
3.5x
4.5x
5.5x
6.5x
7.5x
8.5x
9.5x
-
50
100
150
200
250
300
350
400
450
500
Jun-16 Dec-16 Jun-17 Dec-17 Jun-18 Dec-18
CFADS (LTM) Annualized Debt Service
DSCR Incurrence Level (2x min)
1,196 1,132
1,587 1,712
2,399 2,222
345 341 456 476
614 580
3.5x 3.3x 3.5x 3.6x 3.9x
3.8x
(0.5x)
0.5x
1.5x
2.5x
3.5x
4.5x
5.5x
-
500
1,000
1,500
2,000
2,500
3,000
Jun-16 Dec-16 Jun-17 Dec-17 Jun-18 Dec-18
NGPTI Prop. Adj. EBITDA (LTM)
Leverage Ratio Incurrence Level (5x max)
25
(1) DSCR and Leverage Ratio (Non-guarantor combined leverage ratio) as defined in Bond Indenture. Please see slide 31 for calculation of Bond Indenture Leverage Ratio, including Proportionate Adjusted EBITDA and NGPTI (Non-Guarantor Proportionate Total Indebtedness) .

26
Reconciliation of Bond Metrics to IFRS Financials
Bond metrics definitions use Proportionate Adjusted EBITDA (“PAE”) and Non-Guarantor Proportionate Total Indebtedness(“NGPTI”) to calculate leverage ratios. These definitions exclude Corporate Level Financings and Project Finance Subsidiaries(“PFS”) (projects not yet reached, or recently passed, COD). As of December 31, 2018, no project is treated as a PFS.
PAE (Proportionate Adjusted EBITDA)
• Includes our share in JVs (Sochagota & TermoemCali)
• Pro forma for acquisitions mainly relates to ouracquisition of the Spanish CSP portfolio
NGPTI (Non-Guarantor Proportionate Total Indebtedness)
• Excludes debt at parent company level (corporate bond)
• Increase in gross debt and NGPTI relating to ouracquisition of the Spanish CSP portfolio
Calculation of NGPTI ($m) Dec-17 Dec-18
Non-current Borrowings 2,673 3,287
Current Borrowings 218 273
Consolidated Gross Debt 2,890 3,560
Accrued Int & IFRS Adj. 32 53
Share in JVs 14 6
Project Finance Subsidiaries (PFS) – –
Peru Wind Letter of Credit – 9
DSRA (89) (185)
Corporate Bond (840) (860)
Pro Rata Calculation (294) (361)
NGPTI 1,712 2,222
Calculation of PAE ($m) Dec-17 Dec-18
Income From Operations 269 262
Depreciation & Amortisation 186 239
Share in JVs 22 21
Other 37 88
Adjusted EBITDA 513 610
Pro Forma Acquisitions 14 46
Project Finance Subsidiaries (PFS) – –
HoldCos & Other 33 20
Pro Rata Adjustment (84) (97)
PAE 476 580
26

27
Top Contributors to Adj. EBITDA
(1) EBITDA is calculated by asset excluding corporate costs and thermal and renewable holdcos(2) Includes Solutions Europe and Africa and Solutions Brazil(3) Includes Solar Italy, Solar Slovakia and Solar Romania
Top Contributors to Adj. EBITDA1 2016 2017 2018
Top contributors from Thermal fleet
Maritsa East III 117 125 120
Arrubal 62 61 63
ContourGlobal Solutions2 12 27 27
Cap des Biches 12 26 27
KivuWatt 22 24 26
Togo 21 25 25
Caribbean 21 27 24
Colombia 21 22 21
Others (0) 2 1
Top contributors from Renewable fleet
Spanish CSP – – 89
Brazil Wind 79 82 59
Brazil Hydro 9 28 41
Peru Wind 31 25 29
Vorotan 22 23 23
Austria Wind 23 25 20
Solar Europe, excl. CSP3 31 31 41
Total 485 553 638
27

28
Top Contributors to CFADS1
(1) CFADS (Cash Flows Available for (Corporate) Debt Service) as defined in Bond Indenture(2) Includes Solar Italy, Solar Slovakia and Solar Romania(3) Includes Solutions Europe and Africa and Solutions Brazil(4) $84m second instalment of acquisition payment not deducted from CFADS
Top Contributors to CFADS (Before Corporate and Other Costs)1 2016 2017 2018
Maritsa 118 30 65
Solar Europe excl. CSP2 22 55 38
Spanish CSP – – 35
Arrubal 19 28 18
Cap des Biches – 7 17
ContourGlobal Solutions3 28 41 15
Peru Wind 23 5 15
Brazil Hydros (1) 55 14
Vorotan 111 13 9
Togo 6 6 7
Caribbean 10 9 5
Austria Wind 7 8 4
KivuWatt – – 4
Colombia 4 8 4
Brazil Wind 2 5 (0)
Total before Corporate, Thermal and Renewable HoldCo costs
349 270 249
4
28

29
Segment Facility / Project Name LocationGross Cap.
(MW)Number of
Assets Fuel Type1ContourGlobal
Ownership COD Power Purchaser PPA Expiration
Maritsa Bulgaria 908 1 Coal 73% 1978 NEK 2024
Arrubal Spain 800 1 Natural Gas 100% 2005 Gas Natural Fenosa 2021
TermoemCali Colombia 240 1 Natural Gas / Diesel 37% 1999 Various N/A
Sochagota Colombia 165 1 Coal 49% 1999 Gensa 20192
Togo Togo 100 1 Natural Gas / HFO / Diesel 80% 2010 CEET 2035
Cap des Biches Senegal 86 1 Oil /Natural Gas 100% Q2 2016 / Q4 2016
Senelec 2036
Energies Antilles / Energies St Martin
French Caribbean 35 2 HFO / LFO 100% 2000; 2003 EDF 2020; 2023
Bonaire Dutch Antilles 28 1 HFO / Wind 100% 2010 WEB 2025
KivuWatt Rwanda 26 1 Natural Gas 100% Q4 2015 EWSA (ex-Electrogaz & REC) 2040 (expected)
Total Thermal 2,388 10
Mexican CHP assets(5) Mexico 518 2 Natural Gas cogeneration 100% 2014/19 Mexican industrial/commercial N/A
ContourGlobal Solutions Europe – Nigeria –Brazil
132 11 Natural Gas / Diesel / LFO 100%;100%; 80% 1995-2015 Investment grade global industrial companies
2018-2032
Total Cogen 650 13
Chapada Complex Brazil 438 3 Wind 51%, 51%, 100% 2015; Q1 2016 CCEE; distribution companies 2035
Vorotan Armenia 404 1 Hydro 100% 1970 AEN 2040
CSP Portfolio Spain 250 5 CSP 100% 2010 CNMC 2034-2037
Hydro Brazil Brazil 167 9 Hydro 79%3 1963; 1992; 2009-2012
Distribution companies 2027-2042
Asa Branca Brazil 160 1 Wind 100% 2013 Distribution companies 2033
Austria Wind Austria 150 10 Wind 94% 2003-2014 OeMAG 2016-2027
Inka Peru 114 2 Wind 100% 2014 Distribution companies 2034
Solar Italy4 Italy 65 43 Solar 51% 2007-2013 Gestore Servizi Energetici S.p.A 2027-2033
Solar Slovakia Slovakia 35 3 Solar 51% 2010-2011 Distribution companies 2025-2026
Solar Romania Romania 7 1 Solar 100% 2013 Distribution companies 2028
InterPorto5 Italy 12 5 Solar 51% 2010-2011 Gestore Servizi Energetici S.p.A 2030-2031
Biogas Italy Italy 2 2 Biogas 100% 2013 Gestore Servizi Energetici S.p.A 2028
Total Renewable 1,804 85
Total portfolio 4,842 108
ContourGlobal Portfolio
Thermal Renewables
(1) HFO refers to heavy fuel oil, and LFO to light fuel oil. (2) CES has already signed 4 contracts to replace existing PPA, extending expiration to 2024, with an additional 5 year extension expected(3) Capacity weighted(4) Italian solar assets in 19 clusters(5) Signed but not closed. After closing, InterPorto will be part of Solar Italy
29

30
IR InformationNext Event & Contact Point
Date Event Location
5th April 2018 Annual Results
PresentationLondon, UK
6 – 8th MayGoldman Sachs US Leveraged Finance
Conference
Los Angeles, USA
5 – 6th June
Deutsche Bank 23rd Annual European
Leveraged Finance Conference
London, UK
8th August H1 2019 Results CallDial-in details to be shared
Alice HeathcoteSVP, CFO RenewablesEmail: [email protected]
or
Corporate Websitewww.contourglobal.com
Investor Relations www.contourglobal.com/investors
IR ContactNext IR Events
30
Web Resources
