h technology: economic a transportation r j c 2017
TRANSCRIPT
THE PENNSYLVANIA STATE UNIVERSITY SCHREYER HONORS COLLEGE
DEPARTMENT OF INDUSTRIAL ENGINEERING
HYPERLOOP TECHNOLOGY: ECONOMIC ANALYSIS OF A TRANSPORTATION REVOLUTION
JACOB COVELL SPRING 2017
A thesis submitted in partial fulfillment
of the requirements for a baccalaureate degree in Industrial Engineering
with honors in Industrial Engineering
Reviewed and approved* by the following:
Brian Davis Clinical Associate Professor of Finane
Thesis Supervisor
Catherine Harmonosky Associate Professor of Industrial and Manufacturing Engineering
Honors Adviser
* Signatures are on file in the Schreyer Honors College.
i
ABSTRACT
This thesis analyzes several aspects of the Hyperloop technology, with a focus on
assessing the technological and economic feasibility of the proposed system. Although there are
numerous Hyperloop routes under current consideration, this study concentrates on valuating the
proposed San Francisco to Los Angeles route. From a technological standpoint, this study
concluded that there are many engineering concerns and external risk factors associated with the
design of the Hyperloop, which limit the viability of the system. Furthermore, the economic
feasibility study established a rough valuation for the proposed route through a DCF analysis. It
was determined that the project would be operationally profitable in each of the nine scenarios,
under both discount rate assumptions. After taking into consideration the initial capital
construction costs of the project, however, the study concluded that only six scenarios were net
present value positive under the lesser discount rate assumption.
ii
TABLE OF CONTENTS
LIST OF FIGURES .................................................................................................... iii
LIST OF TABLES ....................................................................................................... iv
ACKNOWLEDGEMENTS ......................................................................................... v
Chapter 1 Introduction ................................................................................................. 1
Chapter 2 Technological Feasibility ............................................................................ 3
Major Components of Hyperloop .................................................................................... 3 Current Development ....................................................................................................... 17 Strategic Concerns ........................................................................................................... 20
Chapter 3 Potential Markets......................................................................................... 31
Freight vs. Passengers ...................................................................................................... 31 Prospective Routes ........................................................................................................... 34
Chapter 4 Alternative Modes of Transportation .......................................................... 38
Benefits of the Hyperloop ................................................................................................ 39
Chapter 5 Potential Revenue Analysis ......................................................................... 41
Estimated Consumer Demand Forecast ........................................................................... 41 Estimated Ticket Pricing .................................................................................................. 43 Revenue Model ................................................................................................................ 45
Chapter 6 Estimated Cost Analysis.............................................................................. 47
Estimated Fixed Maintenance Cost Forecast ................................................................... 47 Estimated Variable Operating Cost Forecast ................................................................... 48 Operational Cost Model ................................................................................................... 49 Estimated Implementation Costs ...................................................................................... 50
Chapter 7 Hyperloop Valuation ................................................................................... 53
Sensitivity Analysis .......................................................................................................... 55
Chapter 8 Conclusion ................................................................................................... 58
Appendix A Baseline Travel Demand Forecast Data ................................................. 61
BIBLIOGRAPHY ........................................................................................................ 62

iii
LIST OF FIGURES
Figure 1. Conceptual design sketch of Hyperloop passenger capsule ..................................... 4
Figure 2. Diagram of Hyperloop passenger capsule ................................................................ 5
Figure 3. Aerodynamic visualization of capsule at transonic velocity .................................... 6
Figure 4. Schematic of air bearing skis .................................................................................... 7
Figure 5. Conceptual design sketch of passenger capsule with gullwing door design ............ 9
Figure 6. Hyperloop tube connecting San Francisco to Los Angeles ...................................... 10
Figure 7. Conceptual design sketch of Hyperloop pylons ....................................................... 11
Figure 8. Schematic of linear induction motor......................................................................... 13
Figure 9. Conceptual sketch of solar array attached to Hyperloop tube .................................. 14
Figure 10. Abstract design of Hyperloop station ..................................................................... 16
Figure 11. California seismic hazard map ............................................................................... 28
Figure 12. Proposed route from Jakarta to Yogyakarta, Indonesia .......................................... 34
Figure 13. Proposed route from Abu Dhabi to Dubai, United Arab Emirates ......................... 35
Figure 14. Proposed route from Prague to Brno, Czech Republic to Bratislava, Slovakia ...... 37

iv
LIST OF TABLES
Table 1. Thermal Expansion Coefficients at 20C .................................................................... 22
Table 2. Dimension and Weight Comparison .......................................................................... 33
Table 3. Cost Comparison ........................................................................................................ 33
Table 4. Hyperloop Comparison to Alternative Modes ........................................................... 38
Table 5. Annual Demand Forecasted to 2035, Travel ............................................................. 42
Table 6. Ticket Price Assumptions .......................................................................................... 45
Table 7. Hyperloop Revenue Model, Condensed .................................................................... 46
Table 8. Fixed Costs ................................................................................................................ 48
Table 9. Variable Costs ............................................................................................................ 49
Table 10. Operating Cost Estimates ......................................................................................... 50
Table 11. Implementation Cost Estimates, White Papers ........................................................ 51
Table 12. Implementation Cost Assumptions .......................................................................... 52
Table 13. Discount Rate Assumptions ..................................................................................... 53
Table 14. Perpetuity Growth Rate Assumptions ...................................................................... 54
Table 15. DCF Valuation Model, Condensed .......................................................................... 55
Table 16. Scenarios for Sensitivity Analysis ........................................................................... 55
Table 17. Sensitivity Analysis Results ..................................................................................... 56

v
ACKNOWLEDGEMENTS
I would like to thank Dr. Brian Davis for all of his guidance and encouragement
throughout this process in supporting a naïve Industrial Engineer attempt to break into the world
of finance. I really appreciate all of the time that he dedicated toward helping me complete my
thesis. I certainly could not have done it without him. I would also like to thank both of my
parents for their continual support throughout my education. I attribute most of my success to
the values that they instilled in me at a young age.
1
Chapter 1
Introduction
In August 2013, Elon Musk introduced his revolutionary transportation concept to the
public through the release of a preliminary design study. The “Hyperloop” concept, described in
the white papers, was designed to be the ultimate mode of transportation. The proposed
technology would combine magnetic levitation and an air-bearing suspension system, in order to
levitate a pod-like passenger or freight capsule in a closed-system tube. Commercial grade
vacuum pumps would be used to create a low-pressure environment within the Hyperloop tubes,
which would effectively reduce the force of drag—allowing numerous linear induction motors to
propel capsules through the tube at transonic speeds. The tubes would be placed on pylons,
which would suspend the track above the ground, incorporating a vertical and horizontal
dampening system to lessen the risk from earthquakes. In addition, the entire system would
feature a large solar array that would be fastened to the top of the tube and provide self-
sustainable power generation to support the energy requirements during operation.
Within the white papers, Elon Musk described the advantages of the proposed Hyperloop
design over existing forms of transportation and recommended the development of an initial
route between San Francisco to Los Angeles. The proposed route would be approximately 350
miles in length and run parallel to the California Interstate 5 highway, benefitting from the
existing infrastructure from a cost perspective. It was estimated that the total travel time between
the two cities would be approximately 35 minutes. The preliminary design study projected a
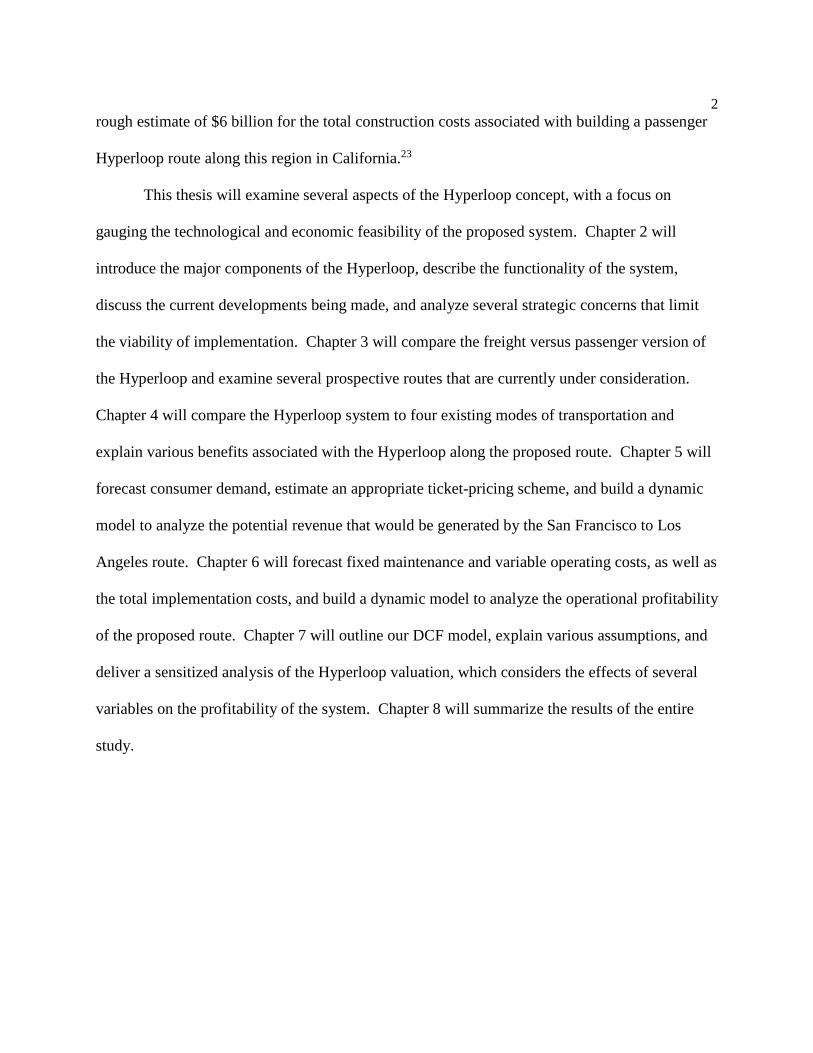
2 rough estimate of $6 billion for the total construction costs associated with building a passenger
Hyperloop route along this region in California.23
This thesis will examine several aspects of the Hyperloop concept, with a focus on
gauging the technological and economic feasibility of the proposed system. Chapter 2 will
introduce the major components of the Hyperloop, describe the functionality of the system,
discuss the current developments being made, and analyze several strategic concerns that limit
the viability of implementation. Chapter 3 will compare the freight versus passenger version of
the Hyperloop and examine several prospective routes that are currently under consideration.
Chapter 4 will compare the Hyperloop system to four existing modes of transportation and
explain various benefits associated with the Hyperloop along the proposed route. Chapter 5 will
forecast consumer demand, estimate an appropriate ticket-pricing scheme, and build a dynamic
model to analyze the potential revenue that would be generated by the San Francisco to Los
Angeles route. Chapter 6 will forecast fixed maintenance and variable operating costs, as well as
the total implementation costs, and build a dynamic model to analyze the operational profitability
of the proposed route. Chapter 7 will outline our DCF model, explain various assumptions, and
deliver a sensitized analysis of the Hyperloop valuation, which considers the effects of several
variables on the profitability of the system. Chapter 8 will summarize the results of the entire
study.
3
Chapter 2
Technological Feasibility
Major Components of Hyperloop
There are three major design components of the proposed Hyperloop Transportation
System. This section will explore each of these individual components, as well as the
subcomponents that are necessary for propulsion, drag reduction, and power supply.
Component 1: Capsule
The purpose of the Hyperloop capsule is to safely transport up to 28 passengers through a
tube within a low-pressure environment at speeds of up to 760 mph (Mach 0.91). One of the
biggest concerns associated with the design of the capsule is the aerodynamic flow of the system.
Since the entire system is closed, the displacement of air within the tubes must be considered, as
it could limit the movement of the capsule through the system. When travelling at transonic
speeds, the cross-sectional area and diameter of the capsule in comparison to that of the tube is of
critical importance. If the diameter of the capsule is too large with respect to the tube with which
it is travelling through, the space between the capsule and the interior walls of the tube will be
too small to allow the displaced air to flow behind the capsule as it is projected forward.
Essentially, this design would cause a “choke” to the flow of air in the tube. Thus, engineers
designing the Hyperloop must work to optimize this tube-to-pod area ratio toward the
“Kantrowitz Limit”, which defines the maximum velocity of a capsule through a tube based on

4 the respective cross-sectional areas of the capsule and tube. The proposed Hyperloop passenger
capsule will be designed to feature a maximum width of 4.43 ft (1.35 m) and maximum height of
6.11 ft (1.10 m).23 This will balance the need for passenger comfort with the cost of material
associated with the capsule’s design, while also optimizing the potential speed of the capsule
through the system.
Figure 1. Conceptual design sketch of Hyperloop passenger capsule23
Aside from the tube-to-pod area ratio, the aerodynamic design is also critical to reduce
the drag force produced at maximum velocities within the tube’s low-pressure vacuum
environment. The conceptual design sketch, shown above, demonstrates the streamlined design
of the front of the capsule, which is important in reducing the drag coefficient. Additionally, the
overall weight of the capsule’s structure is estimated to be roughly 6,800 lb (3,100 kg).23
5
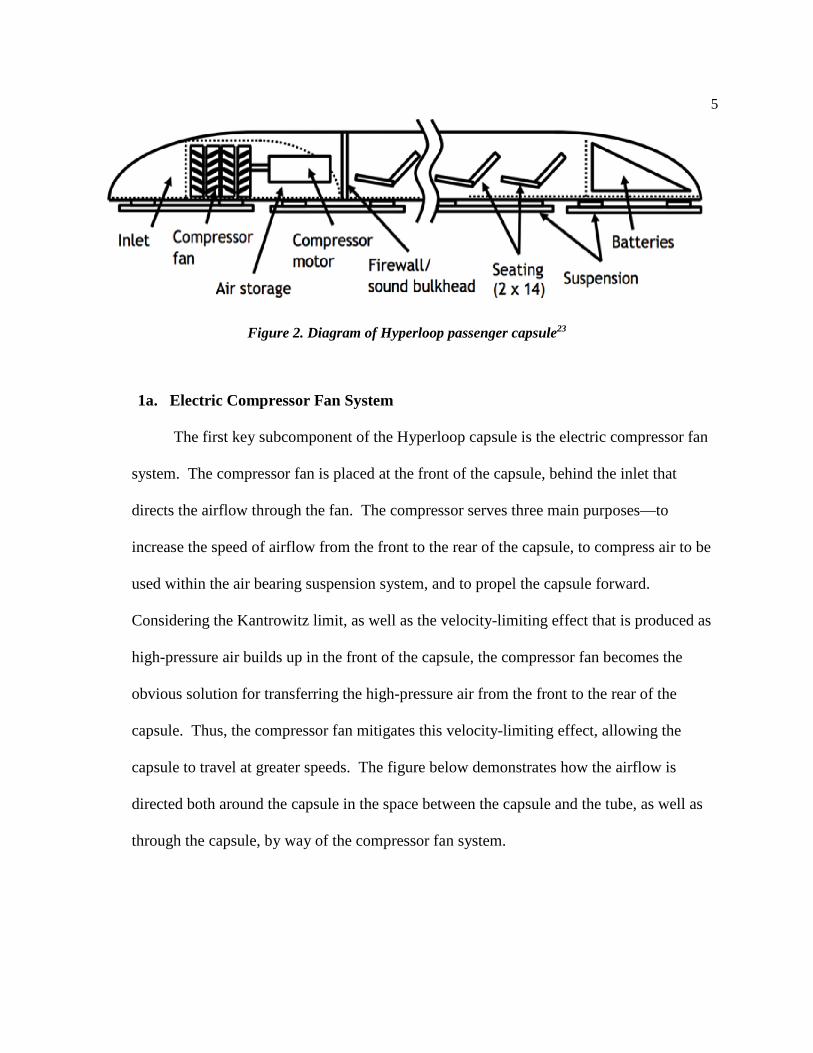
Figure 2. Diagram of Hyperloop passenger capsule23
1a. Electric Compressor Fan System
The first key subcomponent of the Hyperloop capsule is the electric compressor fan
system. The compressor fan is placed at the front of the capsule, behind the inlet that
directs the airflow through the fan. The compressor serves three main purposes—to
increase the speed of airflow from the front to the rear of the capsule, to compress air to be
used within the air bearing suspension system, and to propel the capsule forward.
Considering the Kantrowitz limit, as well as the velocity-limiting effect that is produced as
high-pressure air builds up in the front of the capsule, the compressor fan becomes the
obvious solution for transferring the high-pressure air from the front to the rear of the
capsule. Thus, the compressor fan mitigates this velocity-limiting effect, allowing the
capsule to travel at greater speeds. The figure below demonstrates how the airflow is
directed both around the capsule in the space between the capsule and the tube, as well as
through the capsule, by way of the compressor fan system.
6
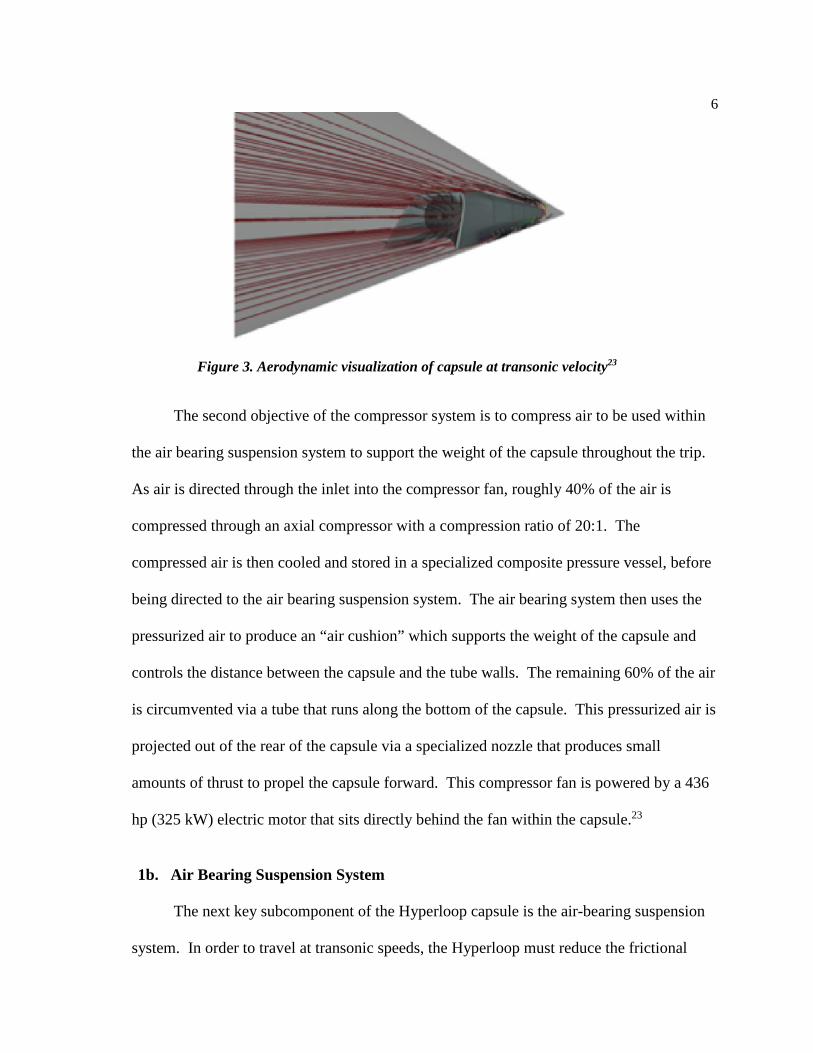
Figure 3. Aerodynamic visualization of capsule at transonic velocity23
The second objective of the compressor system is to compress air to be used within
the air bearing suspension system to support the weight of the capsule throughout the trip.
As air is directed through the inlet into the compressor fan, roughly 40% of the air is
compressed through an axial compressor with a compression ratio of 20:1. The
compressed air is then cooled and stored in a specialized composite pressure vessel, before
being directed to the air bearing suspension system. The air bearing system then uses the
pressurized air to produce an “air cushion” which supports the weight of the capsule and
controls the distance between the capsule and the tube walls. The remaining 60% of the air
is circumvented via a tube that runs along the bottom of the capsule. This pressurized air is
projected out of the rear of the capsule via a specialized nozzle that produces small
amounts of thrust to propel the capsule forward. This compressor fan is powered by a 436
hp (325 kW) electric motor that sits directly behind the fan within the capsule.23
1b. Air Bearing Suspension System
The next key subcomponent of the Hyperloop capsule is the air-bearing suspension
system. In order to travel at transonic speeds, the Hyperloop must reduce the frictional
7 force between the capsule and the tube walls. Traditional methods for reducing friction
include both the use of conventional wheels, as well as the use of magnetic levitation, such
as in the case of the Maglev train. At transonic speeds, however, the use of conventional
wheels would be infeasible and prone to damage. On the other hand, magnetic levitation
would be feasible at transonic speeds, but is much more expensive to implement. The only
practical solution is an air bearing suspension system.
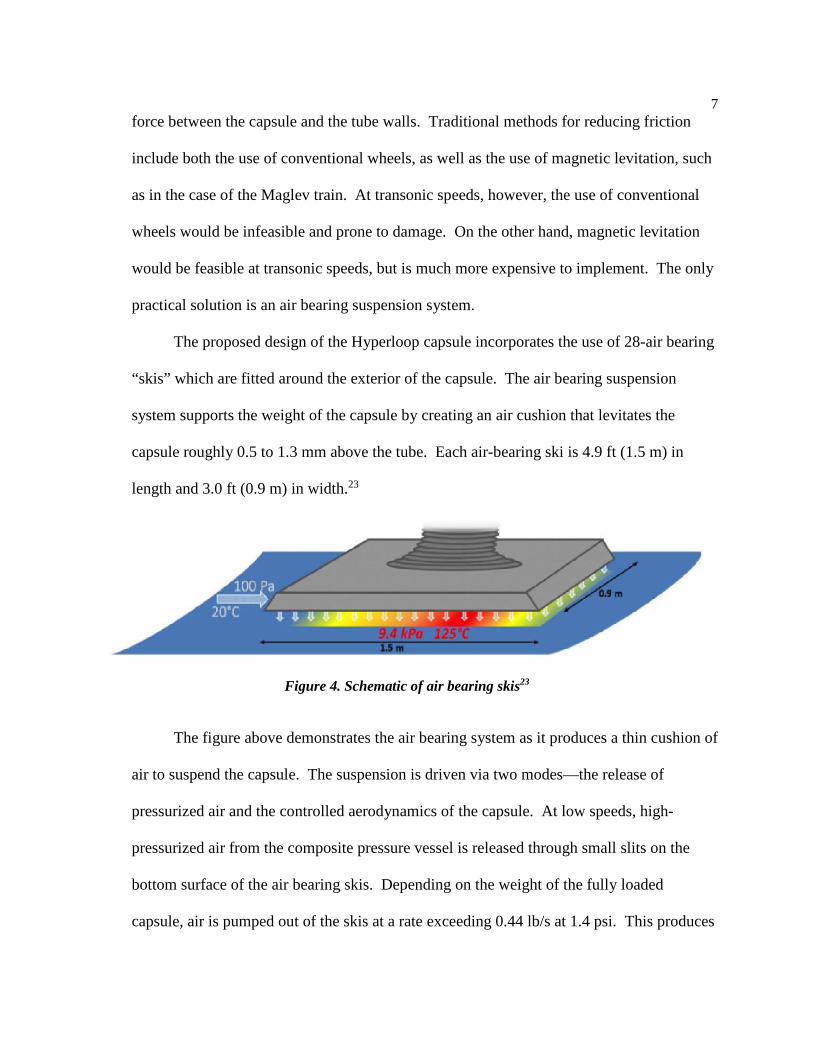
The proposed design of the Hyperloop capsule incorporates the use of 28-air bearing
“skis” which are fitted around the exterior of the capsule. The air bearing suspension
system supports the weight of the capsule by creating an air cushion that levitates the
capsule roughly 0.5 to 1.3 mm above the tube. Each air-bearing ski is 4.9 ft (1.5 m) in
length and 3.0 ft (0.9 m) in width.23
Figure 4. Schematic of air bearing skis23
The figure above demonstrates the air bearing system as it produces a thin cushion of
air to suspend the capsule. The suspension is driven via two modes—the release of
pressurized air and the controlled aerodynamics of the capsule. At low speeds, high-
pressurized air from the composite pressure vessel is released through small slits on the
bottom surface of the air bearing skis. Depending on the weight of the fully loaded
capsule, air is pumped out of the skis at a rate exceeding 0.44 lb/s at 1.4 psi. This produces
8 enough lift to suspend the capsule and reduce the frictional force. At higher speeds, the
aerodynamics of the capsule can also be controlled in conjunction with the release of
pressurized air to produce adequate suspension. Using this method, as the capsule
accelerates to higher speeds through the tube, the front tips of the air bearing skis are lifted
to form a small angle between the skis and the tube walls. This slight angle produces a
pressurized stream of air beneath the capsule that creates a lifting force. The weight of the
entire air bearing system is estimated to be roughly 6,200 lb.23
1c. Rotor
The third key subcomponent of the Hyperloop capsule is the rotor, which is also a
subcomponent of the propulsion system. The rotor is a 49-foot aluminum blade that is
fixed on the exterior and runs along the bottom of the capsule. The rotor works in
conjunction with the stator as part of the linear induction motor system to create a magnetic
field, which propels the capsule forward. The gap between the rotor and the stator is set at
about 0.8 inches on either side, and the electromagnetic field also serves to maintain a
precise centric positioning of the capsule within the tube.
1d. Battery
The fourth subcomponent of the Hyperloop capsule is the battery. In order to power
the electric compressor fan system, a 5,500 lb battery system is required.23 The battery
system is contained in the rear interior of the capsule, behind the passenger compartment.
1e. Passenger Compartment
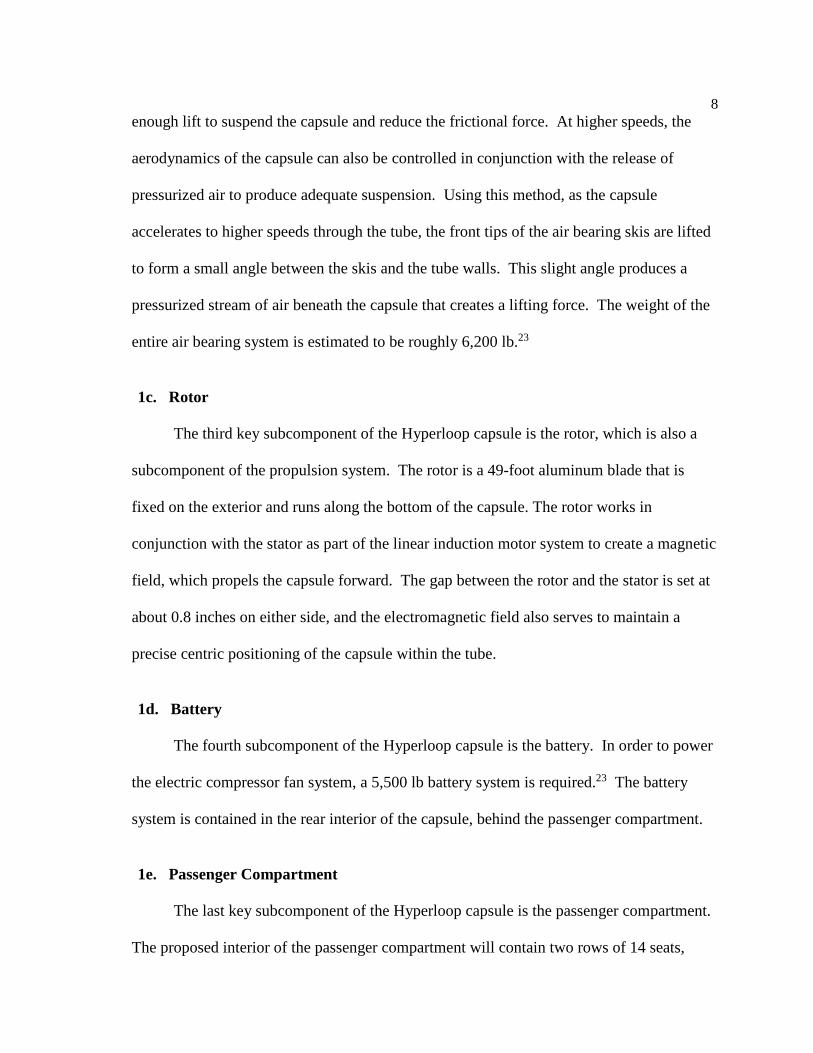
The last key subcomponent of the Hyperloop capsule is the passenger compartment.
The proposed interior of the passenger compartment will contain two rows of 14 seats,
9 creating a capacity of 28 passengers per capsule. Each of the seats will be designed with
safety and passenger comfort in mind. Additionally, each passenger seat will include a
personal entertainment system. The total estimated weight of the interior components is
roughly 5,500 lb.23
Figure 5. Conceptual design sketch of passenger capsule with gullwing door design23
The figure above shows the interior design of the passenger compartment, as well as
the design of the gullwing doors, which will allow passengers to enter and exit their
particular seat quickly at the station.
Component 2: Tube
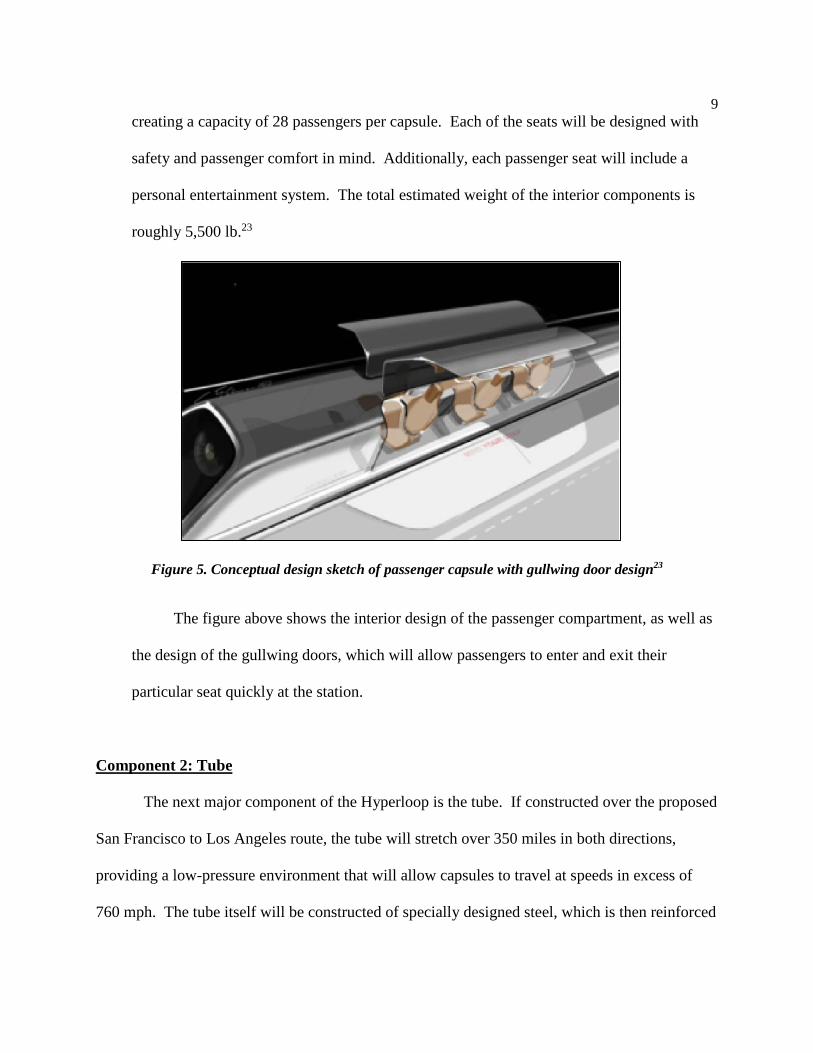
The next major component of the Hyperloop is the tube. If constructed over the proposed
San Francisco to Los Angeles route, the tube will stretch over 350 miles in both directions,
providing a low-pressure environment that will allow capsules to travel at speeds in excess of
760 mph. The tube itself will be constructed of specially designed steel, which is then reinforced
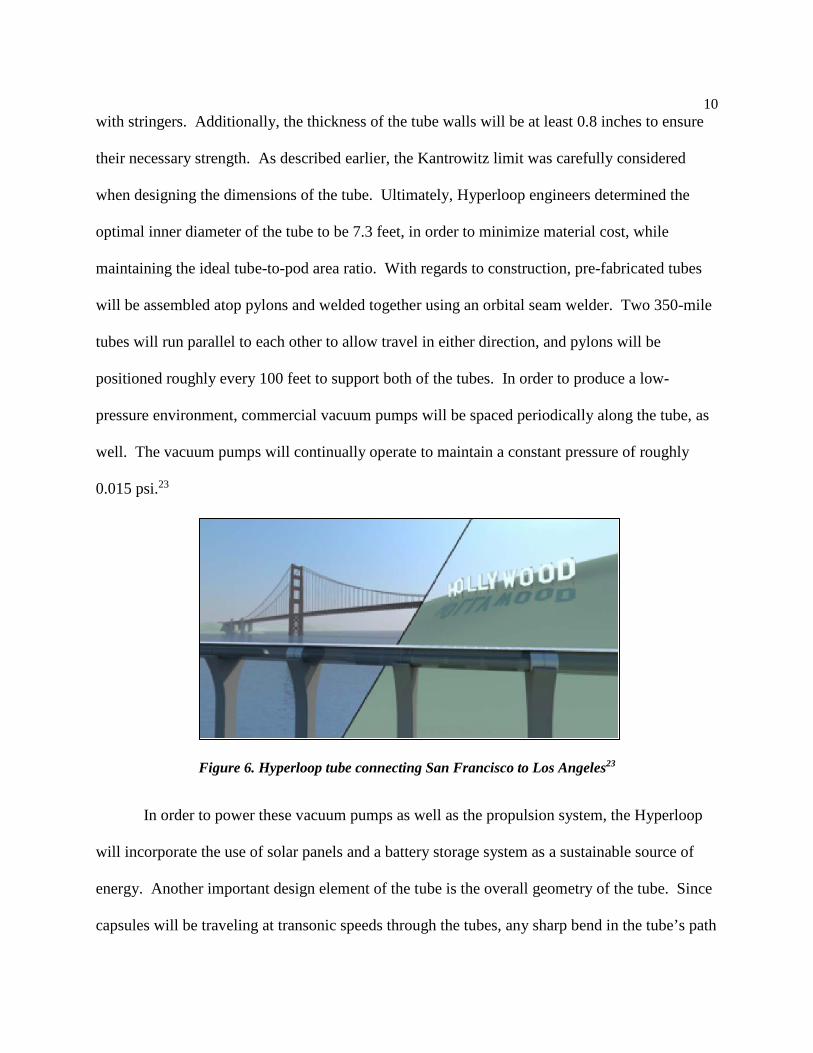
10 with stringers. Additionally, the thickness of the tube walls will be at least 0.8 inches to ensure
their necessary strength. As described earlier, the Kantrowitz limit was carefully considered
when designing the dimensions of the tube. Ultimately, Hyperloop engineers determined the
optimal inner diameter of the tube to be 7.3 feet, in order to minimize material cost, while
maintaining the ideal tube-to-pod area ratio. With regards to construction, pre-fabricated tubes
will be assembled atop pylons and welded together using an orbital seam welder. Two 350-mile
tubes will run parallel to each other to allow travel in either direction, and pylons will be
positioned roughly every 100 feet to support both of the tubes. In order to produce a low-
pressure environment, commercial vacuum pumps will be spaced periodically along the tube, as
well. The vacuum pumps will continually operate to maintain a constant pressure of roughly
0.015 psi.23
Figure 6. Hyperloop tube connecting San Francisco to Los Angeles23
In order to power these vacuum pumps as well as the propulsion system, the Hyperloop
will incorporate the use of solar panels and a battery storage system as a sustainable source of
energy. Another important design element of the tube is the overall geometry of the tube. Since
capsules will be traveling at transonic speeds through the tubes, any sharp bend in the tube’s path
11 would cause passengers to experience uncomfortable inertial acceleration effects. Thus, it is
crucial to choose a route for the tube that would limit any curvature in the design of the path.
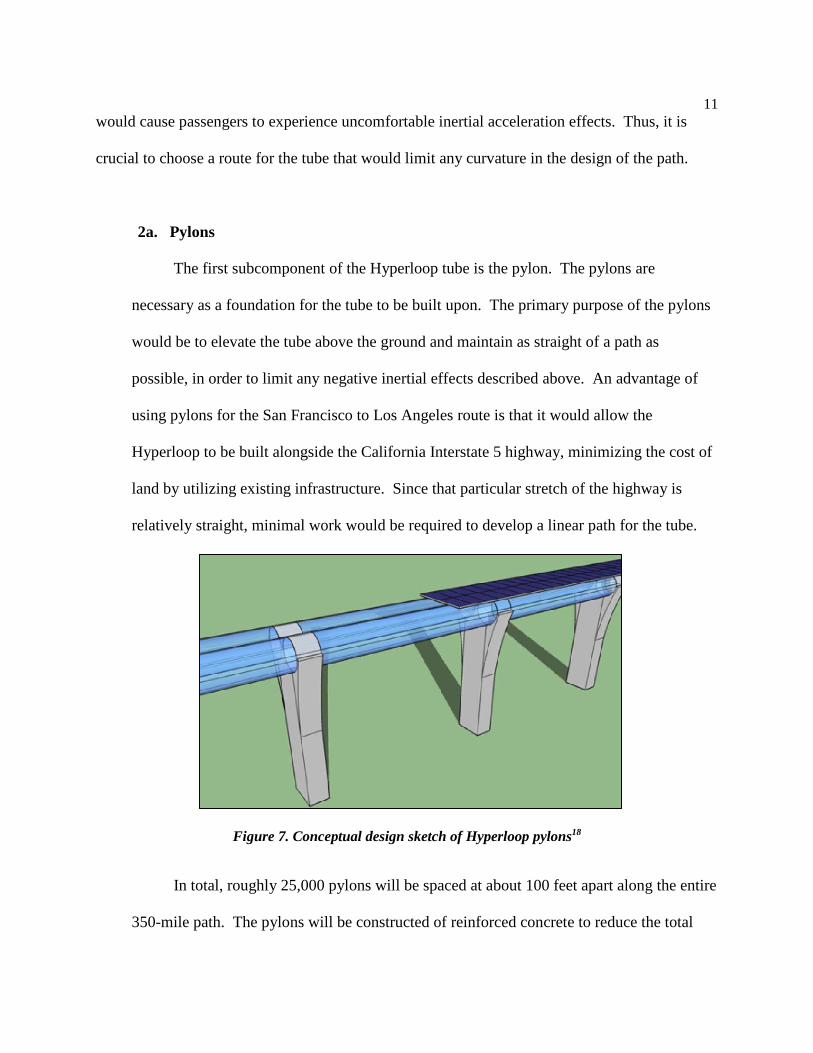
2a. Pylons
The first subcomponent of the Hyperloop tube is the pylon. The pylons are
necessary as a foundation for the tube to be built upon. The primary purpose of the pylons
would be to elevate the tube above the ground and maintain as straight of a path as
possible, in order to limit any negative inertial effects described above. An advantage of
using pylons for the San Francisco to Los Angeles route is that it would allow the
Hyperloop to be built alongside the California Interstate 5 highway, minimizing the cost of
land by utilizing existing infrastructure. Since that particular stretch of the highway is
relatively straight, minimal work would be required to develop a linear path for the tube.
Figure 7. Conceptual design sketch of Hyperloop pylons18
In total, roughly 25,000 pylons will be spaced at about 100 feet apart along the entire
350-mile path. The pylons will be constructed of reinforced concrete to reduce the total
12 cost. On average, the pylons will be about 20 feet tall, but will be designed to vary in
height in order to maintain a linear path for the tubes above the ground.23 Furthermore,
each pylon will integrate two adjustable lateral dampers and one vertical damper to reduce
the risk associated with any type of ground movement, such as an earthquake—which is
particularly prevalent in California.
2b. Propulsion System
The next key subcomponent of the Hyperloop tube is the propulsion system. In
order to propel the capsules through the tube at transonic velocities, a magnetic linear
induction motor is secured throughout several sections of the tube. External linear electric
motors are placed about 70 miles apart along the length of the tube and continually
accelerate the capsules through the tube. Engineers estimate that the combined length of
the external linear electric motor will only span roughly 1% of the entire tube, and
therefore, will not be too expensive of a subcomponent.23 The type of linear accelerator
used will depend on its particular position along the tube. Small linear accelerators will be
used along the first section of the tube to provide initial acceleration from 0 to 300 mph, as
well as during sections of the tube that traverse urban areas. Larger linear accelerators will
be used along later sections of the tube to accelerate the capsules from 300 to 760 mph.
Linear accelerators will also be used to decelerate the capsules before entering the station.

13
Figure 8. Schematic of linear induction motor23
The propulsion system is comprised of the linear induction motor, the inverters, the
stator, and the rotor—which is fixed to the exterior of the capsule. The diagram above
demonstrates how the stator surrounds the rotor on both sides and manipulates the magnetic
field to propel the capsule forward. The gap between the rotor and the stator is set at about
0.8 inches on either side, and the electromagnetic field also serves to maintain a precise
centric positioning of the capsule within the tube. The stator is composed of highly
ferromagnetic iron and is roughly 1.6 feet wide and 4 inches tall.23
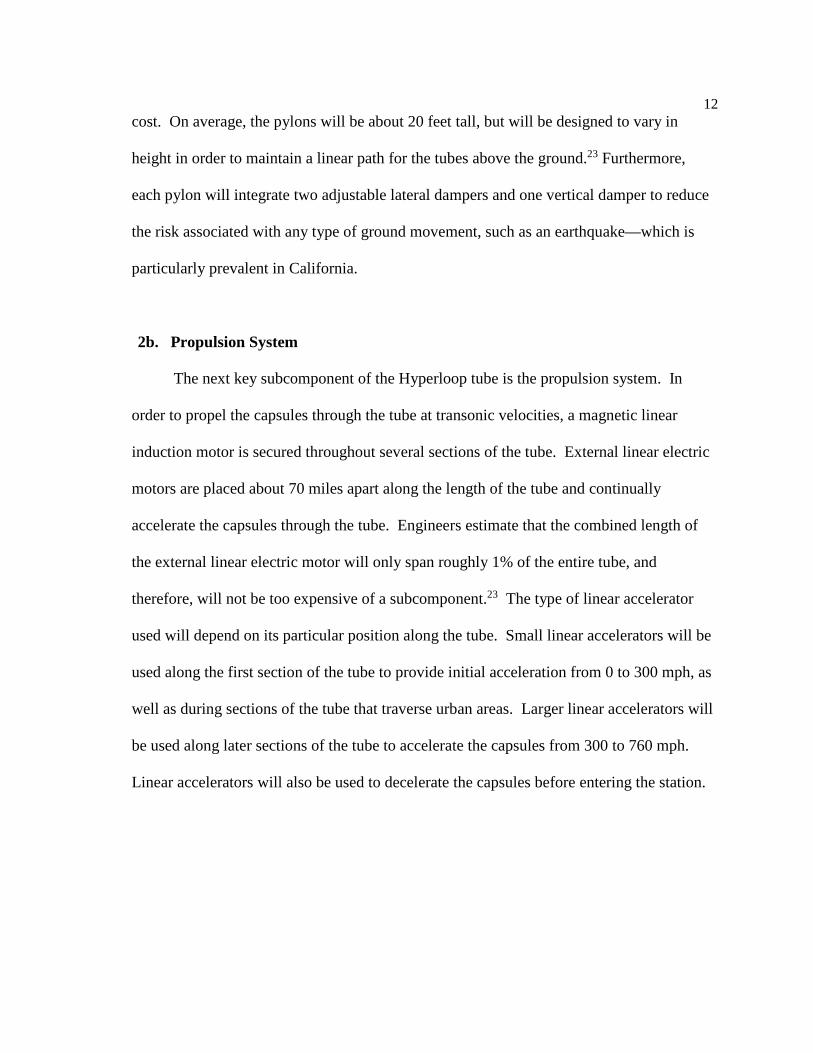
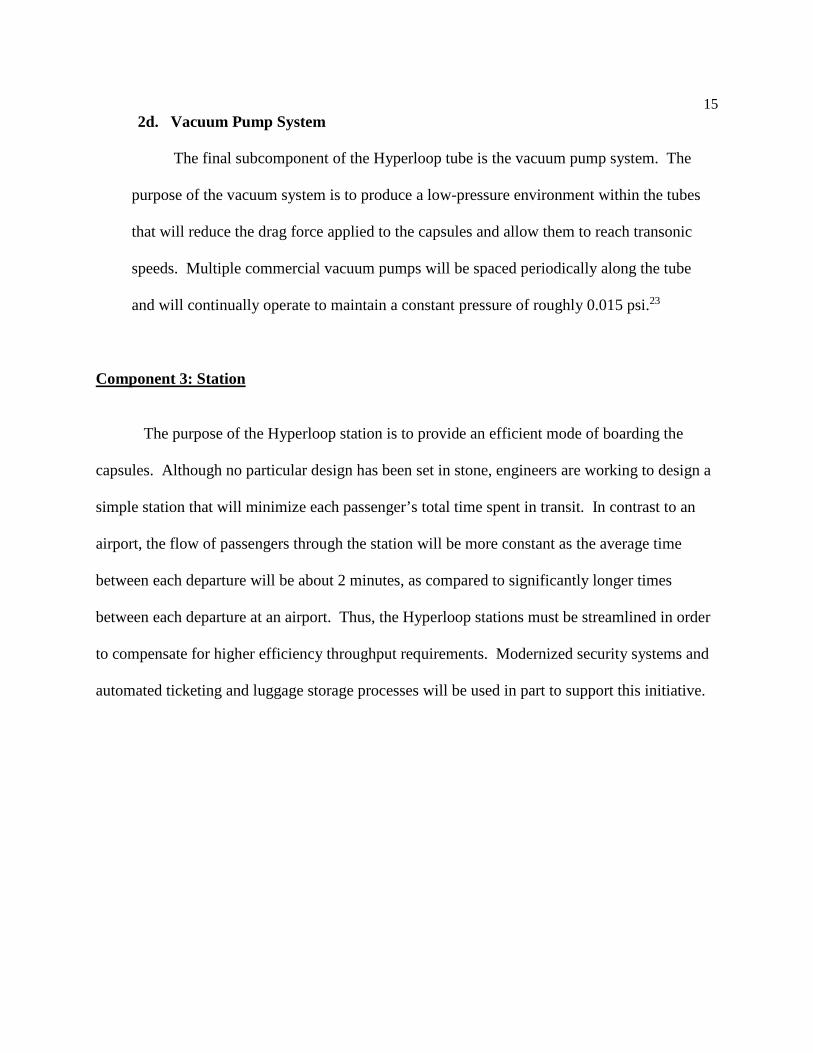
2c. Solar Panel System
The third subcomponent of the Hyperloop tube is the solar panel system. The
purpose of the solar panel system is to supply enough energy to provide self-sufficient
power to the entire Hyperloop system. The total average power requirement for the
Hyperloop is 28,000 horsepower.23 This includes the energy required for powering the
14 linear induction propulsion system, charging onboard batteries, and powering the
commercial vacuum pumps.
Figure 9. Conceptual sketch of solar array attached to Hyperloop tube23
As shown above, the solar panel array will be mounted to the top surface of the
parallel tubes. Assuming the solar array spans the entire 350-mile length with a width of 14
feet, the total area of the array would be over 25 million square feet. With current solar
panel technology producing energy at 0.015 hp/ft2, the solar array will be capable of
producing over 380,000 horsepower during peak solar periods. On an average basis over
the course of one year, it is estimated that the Hyperloop solar panel system would produce
76,000 horsepower.23 Thus, the solar energy generated by the solar array will be in excess of
the average 28,000-horsepower requirement of the entire Hyperloop system. The system
will incorporate the use of battery packs to store energy for use overnight and during periods
of cloudy weather. Furthermore, power can also be pulled from the grid as a last resort.
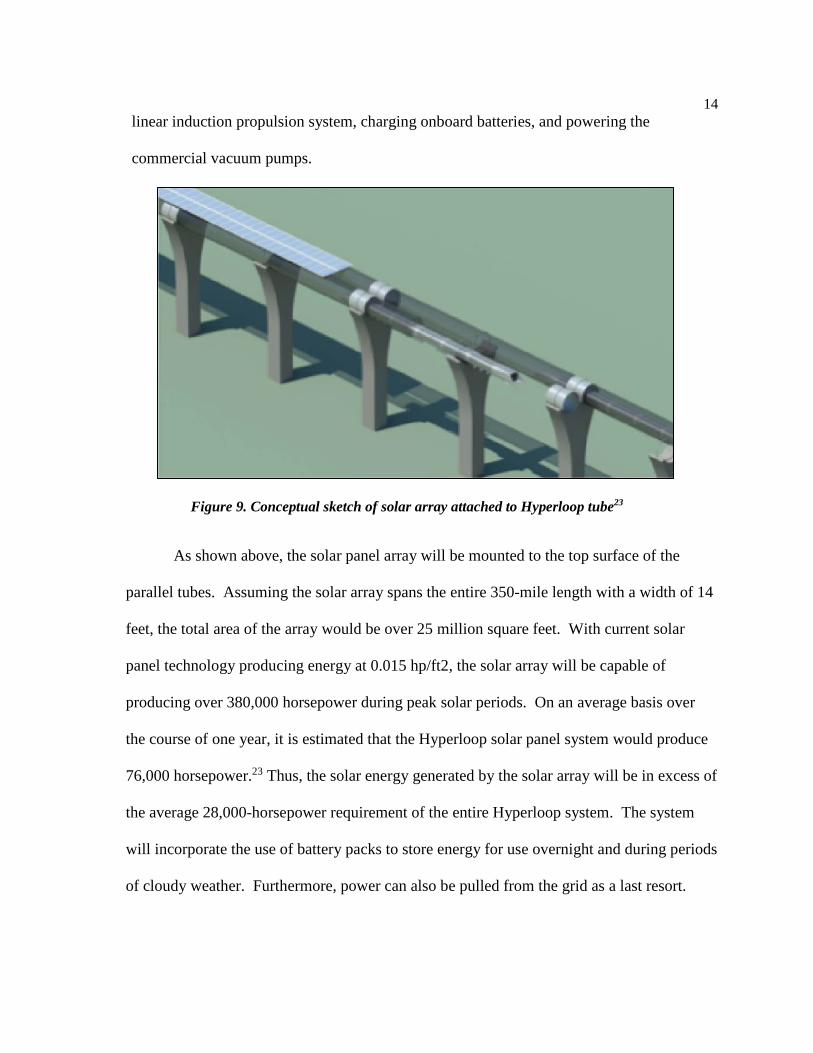
15 2d. Vacuum Pump System
The final subcomponent of the Hyperloop tube is the vacuum pump system. The
purpose of the vacuum system is to produce a low-pressure environment within the tubes
that will reduce the drag force applied to the capsules and allow them to reach transonic
speeds. Multiple commercial vacuum pumps will be spaced periodically along the tube
and will continually operate to maintain a constant pressure of roughly 0.015 psi.23
Component 3: Station
The purpose of the Hyperloop station is to provide an efficient mode of boarding the
capsules. Although no particular design has been set in stone, engineers are working to design a
simple station that will minimize each passenger’s total time spent in transit. In contrast to an
airport, the flow of passengers through the station will be more constant as the average time
between each departure will be about 2 minutes, as compared to significantly longer times
between each departure at an airport. Thus, the Hyperloop stations must be streamlined in order
to compensate for higher efficiency throughput requirements. Modernized security systems and
automated ticketing and luggage storage processes will be used in part to support this initiative.
16
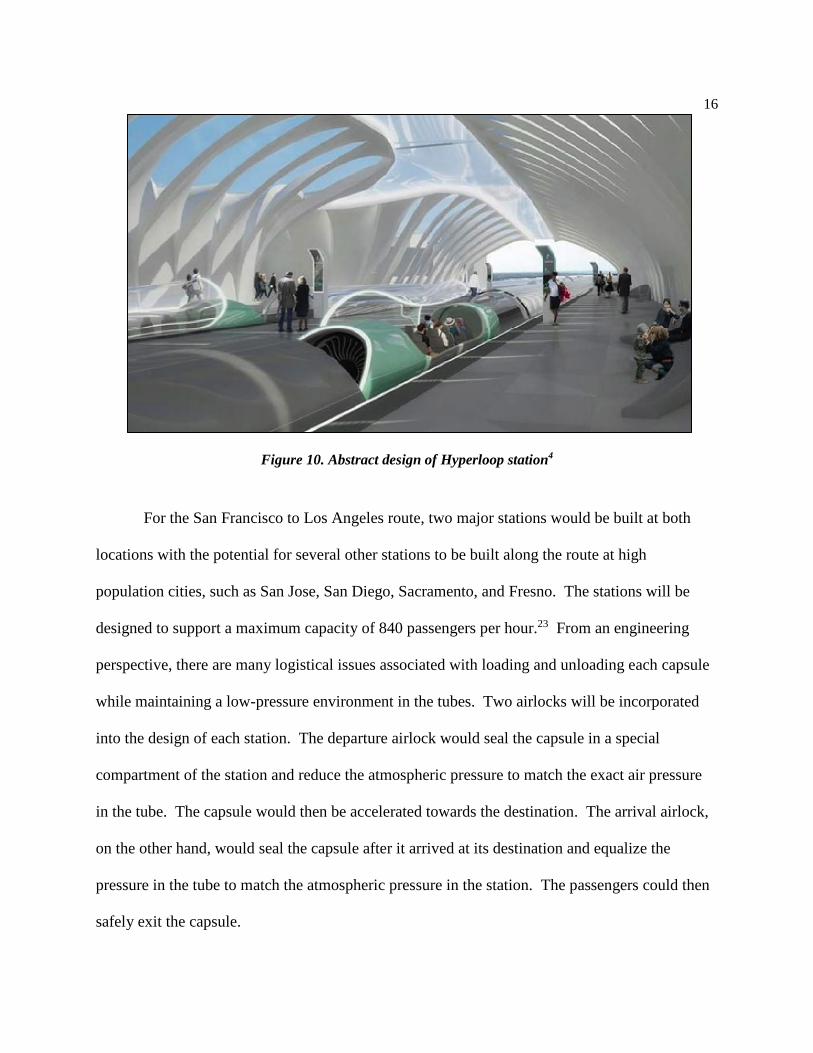
Figure 10. Abstract design of Hyperloop station4
For the San Francisco to Los Angeles route, two major stations would be built at both
locations with the potential for several other stations to be built along the route at high
population cities, such as San Jose, San Diego, Sacramento, and Fresno. The stations will be
designed to support a maximum capacity of 840 passengers per hour.23 From an engineering
perspective, there are many logistical issues associated with loading and unloading each capsule
while maintaining a low-pressure environment in the tubes. Two airlocks will be incorporated
into the design of each station. The departure airlock would seal the capsule in a special
compartment of the station and reduce the atmospheric pressure to match the exact air pressure
in the tube. The capsule would then be accelerated towards the destination. The arrival airlock,
on the other hand, would seal the capsule after it arrived at its destination and equalize the
pressure in the tube to match the atmospheric pressure in the station. The passengers could then
safely exit the capsule.
17 Current Development
There are currently two main players in the Hyperloop space—Hyperloop Transportation
Technologies (HTT) and Hyperloop One. This section will investigate each of these two
companies individually and assess the progress that has been made thus far.
Hyperloop Transportation Technologies (HTT)
Hyperloop Transportation Technologies (HTT) was founded in November 2013, by a
crowd collaboration platform known as JumpStartFund. The unique structure of the company
combines the efforts of over 600 team members, with a variety of expertise, and 40 corporate
partners from around the globe. The firm operates internationally, with offices in Los Angeles,
Barcelona, Abu Dhabi, and Bratislava. Early on, HTT announced that it would concentrate on
projects that would implement the technology in a variety of regions around the world, as
opposed to focusing solely on the San Francisco to Los Angeles route. Since inception, HTT has
raised more than $100 million in total investment—including roughly $32 million in cash from
investors.5 The rest of the investment is comprised of a mixture of labor, costs associated with
land rights, and services provided by partner firms.
In December of 2016, HTT announced an agreement with Abu Dhabi’s Department of
Municipal Affairs and Transport to begin a feasibility analysis for the design of a Hyperloop
system connecting Abu Dhabi to Al Ain. The study will focus on pinpointing strategic locations
for the Hyperloop stations, determining optimal routes, estimating implementation costs, and
ascertaining a rough schedule for development.

18 On January 14th of 2017, HTT announced a strategic agreement with the city of
Toulouse, France to convert a 3,000 square meter former military base into a new HTT Toulouse
Research and Development Facility. This marked a crucial collaboration for Hyperloop
Transportation Technologies, as HTT COO Andres De Leon explained, “Our close relationship
with the local government is exactly what is needed to implement Hyperloop systems in Europe.
While developing our technology, we will also work together to create the necessary regulatory
framework for the system”. 17 Furthermore, the location of the facility is ideal, as Toulouse—
colloquially termed “Aerospace Valley”—is recognized as the European center for research and
development in aeronautics.3 Thus, the location would also be strategic to HTT for sourcing top
engineers from the regional talent pool.
Days later, on January 18th, HTT announced an agreement with the city of Brno, Czech
Republic to begin a feasibility analysis for the design of a Hyperloop system connecting Brno to
Bratislava, Slovakia.17 This was a significant development for Hyperloop Transportation
Technologies, as it marked the first proposal for a system that would connect two international
cities. Naturally, the construction of this international route will be met with considerable
regulatory hurdles, but it certainly marks a step in the right direction for HTT.
In March of 2017, Hyperloop Transportation Technologies announced that they would
begin a similar feasibility analysis for the implementation of a Hyperloop system in Jakarta,
Indonesia.17 The proposed systems include routes connecting Jakarta to Yogyakarta, Jakarta to
Bandung, and Jakarta Soekarno-Hatta International Airport to the city center. The study will be
funded by a $2.5 million contract from private investors.
With regards to full-scale production, Hyperloop Transportation Technologies has not
seen much progress. In January of 2016, HTT announced that it had begun the process of filing
19 construction permits in Kings County, California.12 The initial plan was to begin construction of
the first passenger-ready Hyperloop system in Quay Valley, California in mid-2016.
Unfortunately, HTT has run into several regulatory setbacks since then which has delayed
construction. Sandy Roper, the principal planner at the Kings County Community Development
Agency, explained that, “[HTT] has not yet submitted an environmental review document for the
project, and the agency cannot act without it. HTT would also need to overcome several more
bureaucratic hurdles before it could be issued a building permit, such as a public comment period
and approvals by both the board of supervisors and planning commission.”12 Thus, Hyperloop
Transportation Technologies faces a tough regulatory environment going forward and will have
to overcome a variety of obstacles, which will likely continue to delay full-scale production.
Hyperloop One
Hyperloop One, formerly known as Hyperloop Technologies, was co-founded by Josh
Giegel and Shervin Pishevar in 2014.10 The company quickly gained traction as top talent was
poached from some of the most prestigious engineering firms and investments poured in from
various venture capital funds. By January of 2015, Hyperloop One moved its operations to its
“Innovation Campus” in downtown Los Angeles. Currently, Hyperloop One has 230 full-time
employees positioned at locations in Dubai, London, and both a “Test & Safety Site” and
“Metalworks” manufacturing facility in Nevada. Since inception, Hyperloop One has raised
more than $160 million in total investment.10-
On May 11, 2016, Hyperloop One conducted a successful propulsion open-air test at its
Apex Test site in North Las Vegas, Nevada.31 The test confirmed that the electromagnetic
propulsion system was capable of accelerating a sled from 0 to 116 mph in 1.1 seconds.31

20 Although the test track was only a fraction of the distance of the proposed design and completely
lacked any braking mechanism, the test signified a vital proof-of-concept and marked a major
milestone in the production of Hyperloop One’s full-scale linear electric motor.
In November of 2016, Hyperloop One began construction of the first full-scale
Hyperloop test track in North Las Vegas, Nevada.10 The “DevLoop”, short for Development
Hyperloop, will be approximately 500 meters long and feature all of the major components of the
Hyperloop. Hyperloop One expects the DevLoop to be completed by mid-2017, allowing
engineers to begin conducting various tests in order to optimize the levitation, propulsion, and
vacuum technologies.
Hyperloop One is interested in implementing their technology in regions across the
globe. The firm has conducted initial feasibility studies for routes in the United States, Russia,
India, Switzerland, Sweden, the Netherlands, and in the UAE. Hyperloop One has specified that
their overall goal is to be “moving cargo by 2020 and passengers by 2021”, although this timing
sounds relatively ambitious given the number of technological issues and regulatory obstacles
presented by the project.10
Strategic Concerns
As with any revolutionary technology, there are a number of things that must be taken
into consideration and carefully planned to ensure that the end product meets expectations. From
an engineering standpoint, there are many logistical concerns associated with the design of the
Hyperloop. This section will cover several of these engineering design concerns, external risk
factors, and legal issues that threaten the viability of the technology.
21
Design Concerns
1. Infeasibility of the vacuum system
There are several issues inherent with designing the largest vacuum system in the
world. Currently, the largest vacuum chamber is the Space Power Facility at NASA Glenn
Research Center's Plum Brook Station in Sandusky, Ohio. The vacuum chamber measures
100 feet in diameter and is 122 feet tall.2 By comparison, the total volume of the
Hyperloop vacuum would theoretically be over 60 times larger than the current largest
vacuum chamber in the world. Additionally, NASA’s vacuum chamber is only designed
for an internal pressure of 5 psi, versus the Hyperloop, in which the proposed design would
feature a constant internal pressure of roughly 0.015 psi.16 The sheer degree of precision
required for designing the world’s largest vacuum represents, perhaps, the most relevant
design concern of the Hyperloop. After all, any small crack in the 350-mile tube, leak in
any of the seals, or malfunctioning airlock would trigger the entire system to be flooded
with pressurized air, causing catastrophic failure.
Another issue associated with creating a low-pressure environment would be the
massive amount of atmospheric pressure applied to the exterior of the Hyperloop tubes. In
fact, atmospheric pressure would exert over one ton of force per square foot onto the
exterior of the tubes.26 This static force, combined with the frictional force of a 15-ton
capsule travelling through the tube at transonic speeds would inevitably threaten the
structural integrity of the steel tube walls—which are proposed to be less than an inch
thick.
22
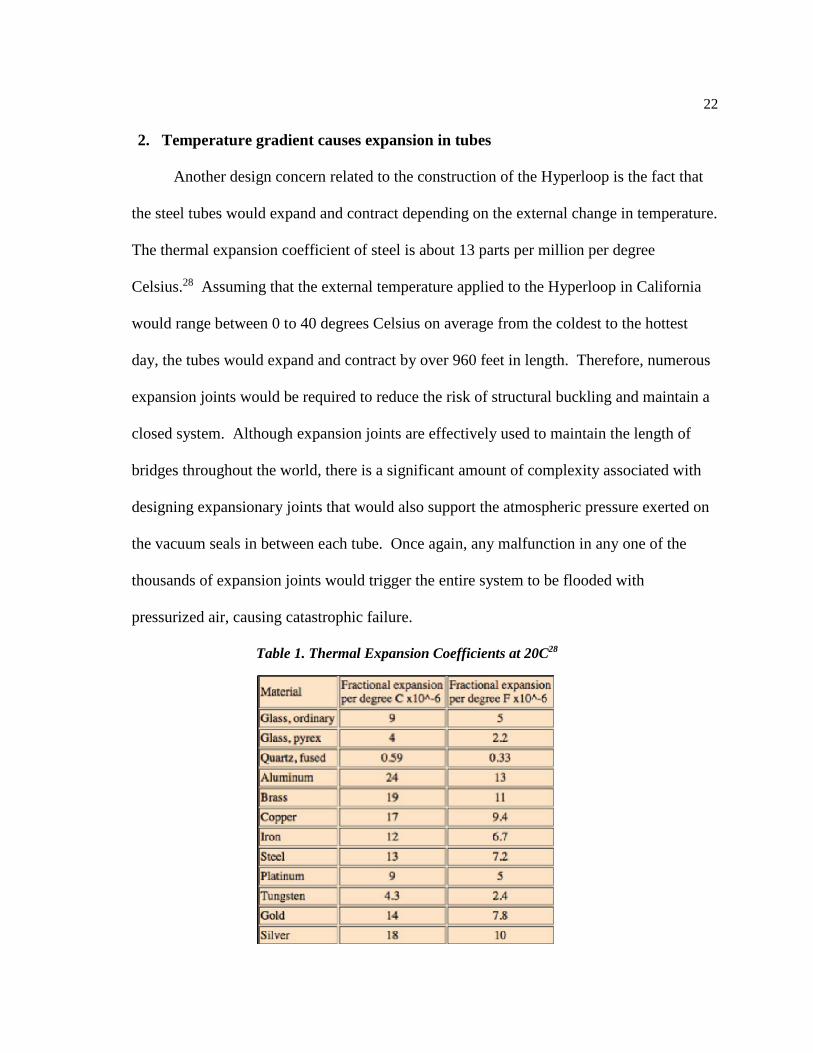
2. Temperature gradient causes expansion in tubes
Another design concern related to the construction of the Hyperloop is the fact that
the steel tubes would expand and contract depending on the external change in temperature.
The thermal expansion coefficient of steel is about 13 parts per million per degree
Celsius.28 Assuming that the external temperature applied to the Hyperloop in California
would range between 0 to 40 degrees Celsius on average from the coldest to the hottest
day, the tubes would expand and contract by over 960 feet in length. Therefore, numerous
expansion joints would be required to reduce the risk of structural buckling and maintain a
closed system. Although expansion joints are effectively used to maintain the length of
bridges throughout the world, there is a significant amount of complexity associated with
designing expansionary joints that would also support the atmospheric pressure exerted on
the vacuum seals in between each tube. Once again, any malfunction in any one of the
thousands of expansion joints would trigger the entire system to be flooded with
pressurized air, causing catastrophic failure.
Table 1. Thermal Expansion Coefficients at 20C28
23 3. Kantrowitz limit
As described previously, the Kantrowitz limit is another component of the
Hyperloop design that must be taken into consideration. One of the biggest concerns
associated with the design of the capsule is the aerodynamic flow of the system. Since the
entire system is closed, the displacement of air within the tubes must be considered, as it
could limit the movement of the capsule through the system. When travelling at transonic
speeds, the cross-sectional area and diameter of the capsule in comparison to that of the
tube is of critical importance. If the diameter of the capsule is too large with respect to the
tube with which it is travelling through, the space between the capsule and the interior
walls of the tube will be too small to allow the displaced air to flow behind the capsule as it
is projected forward. Essentially, this design would cause a “choke” to the flow of air in
the tube. Thus, engineers designing the Hyperloop must work to optimize this tube-to-pod
area ratio toward the “Kantrowitz Limit”. The Kantrowitz limit defines the maximum
velocity of a capsule through a tube based on the respective cross-sectional areas of the
capsule and tube.
4. Any failure would cause catastrophic destruction
Perhaps the biggest drawback of the Hyperloop design is that any failure would
cause catastrophic destruction. In the worst-case scenario, if one of the capsules became
dislodged from the suspension system and ruptured a section of the Hyperloop tube, the
pressurized air from outside would flood the tube causing a cascading effect that would
destroy the entire system. As the pressure differential between the external and internal
pressure of the tube would be roughly one atmosphere, air would rush into the tube at

24 approximately the speed of sound. Assuming that each capsule is separated by about 25
miles of track as it travels through the tube, the column of air would have a mass of roughly
100 tons. Thus, this shockwave would have devastating effects and likely kill every
passenger travelling through the Hyperloop. This issue serves as one of the largest safety
concerns surrounding the technology. In comparison to air travel, this is also one of the
significant disadvantages of the Hyperloop, as even in the worst-case scenario related to air
travel—one plane crash does not cause the destruction of multiple planes.
5. Logistics of loading and unloading at stations
From a design perspective, there are many logistical issues associated with loading
and unloading each capsule, while maintaining a low-pressure environment in the tubes.
The arrival and departure airlocks are critical components of the design of each station. If
either airlock malfunctions, the entire Hyperloop system would be flooded with pressurized
air, causing catastrophic failure.
6. Capsule depressurization
Another design concern that must be addressed is the risk of capsule
depressurization. In the event of a minor leak in pressurization during travel, the
Hyperloop would rely on a system that is similarly used on airlines. The installation of
oxygen masks within each capsule would ensure that passengers could survive the rest of
the journey through the tube, before safely reaching their destination. On the other hand,
severe capsule depressurization poses a much larger risk and would likely kill every
passenger onboard.
25 7. Peak hour congestion
The next logistical issue surrounding the Hyperloop involves the inherently variable
passenger demand of the system. Although the proposed design of the entire Hyperloop
system would support an 840 passenger per hour capacity, the design mistakenly assumes
that there would be a constant distribution of passenger demand over time. In reality,
passenger demand for the Hyperloop would likely spike during peak hours, such as rush
hour. The increased demand during these peak hours would cause congestion, as a
bottleneck would be formed at each station during periods in which demand surpassed the
throughput capacity of the system.
8. Harmful inertial acceleration effects caused by curvature of tube
Another important design consideration of the Hyperloop is the geometry of the path
with which the tube follows over its 350-mile route. Since capsules would be traveling
through the tubes at transonic speeds, any sharp bend in the tube’s path would cause
passengers to experience uncomfortable inertial acceleration effects. Thus, it is crucial to
choose a route for the tube that would limit any curvature in the design of the path, such
that, the maximum acceleration of the capsule is less than 0.5 G’s. As described earlier,
pylons will be utilized to position the tube over varying surface gradients. Engineers will
also have to rely on the construction of tunnels in certain regions where mountains limit the
possibility for a straight path. As another technique to combat harmful inertial acceleration
effects, capsules will be decelerated in specific regions where the path of the tube curves
past a certain degree, such as to avoid a major metropolitan area.
26 9. Issues with suspension system
The next important design consideration of the Hyperloop is the suspension system.
In order to travel at transonic speeds, engineers must design the system to reduce the
frictional force between the capsule and the tube walls. Traditional methods for reducing
friction include the use of conventional wheels and magnetic levitation. At such high
velocities, however, the use of conventional wheels would be infeasible and prone to
damage. On the other hand, magnetic levitation would be viable at transonic speeds, but
comes at a much higher cost to construct. The only practical solution is an air bearing
suspension system. This is easier said than done, however, as there are further design
implications associated with the use of an air bearing suspension system. Although a rigid
air bearing suspension system is necessary for providing safety by ensuring that the capsule
does not come into contact with the tube walls, it would also provide less shock absorption
and could cause an uncomfortable ride for passengers. Thus, it is important for engineers
to incorporate the use of additional suspension systems in conjunction with the air bearing
system to provide the most ideal ride for passengers.
External Risk Factors
1. Vulnerability to terrorism
Perhaps the greatest existential threat to the Hyperloop system would be terrorism.
As described previously, any breach in the vacuum tubes would cause a catastrophic failure
that would likely kill every passenger onboard. Since the proposed design of the Hyperloop
would be built alongside the California Interstate 5 highway, it would be especially
27 vulnerable to terrorist attack. A shot from a modern rifle anywhere along the 350-mile
Hyperloop could theoretically pierce the thin steel exterior of the tube and destroy the
entire system. The issue surrounding the design is that it is virtually impossible to defend
against any attack such as this. As long as the Hyperloop is exposed, it is susceptible to
this type of risk.
2. Power outages
Another external risk factor associated with the design of the Hyperloop is the issue
presented by a potential power outage. Although this would be unlikely, if a power outage
were to occur mid-operation, the linear accelerators used to safely decelerate each capsule
would be ineffective. This would serve as a huge risk, as the capsules would not be able to
come to a complete stop before reaching the destination. Thus, engineers were forced to
design a fail-safe system to eliminate this risk. The proposed design of the Hyperloop
features a battery storage system equipped to each linear accelerator. In the event of a
power outage, these backup energy storage systems kick in and provide each linear
accelerator with the sufficient power required for safe capsule deceleration. In addition,
each capsule is also equipped with a fail-safe mechanical breaking system that could be
automatically triggered in the event of an emergency.
3. Earthquakes
Another key external risk factor surrounding the Hyperloop is the potential for an
earthquake. In fact, the state of California averaged over 250 annual earthquakes—
considering only those above 3 on the Richter scale—between the periods of 2010 to

28 2015.9 Therefore, earthquakes are relatively common and pose a significant threat to the
Hyperloop, as a large enough earthquake could damage the pylons that serve as the
foundation for the tubes. Thus, engineers are forced to incorporate a dampening
mechanism into the design. The proposed strategy will integrate two adjustable lateral
dampers and one vertical damper into each pylon in order to reduce the risk associated with
any type of ground movement, such as during an earthquake. This plan would likely be
effective for dampening the vibration experienced during mild-magnitude earthquakes, but
would not eliminate all of the risk associated with larger, more destructive earthquakes—
which are particularly prevalent in California.
Figure 11. California seismic hazard map6
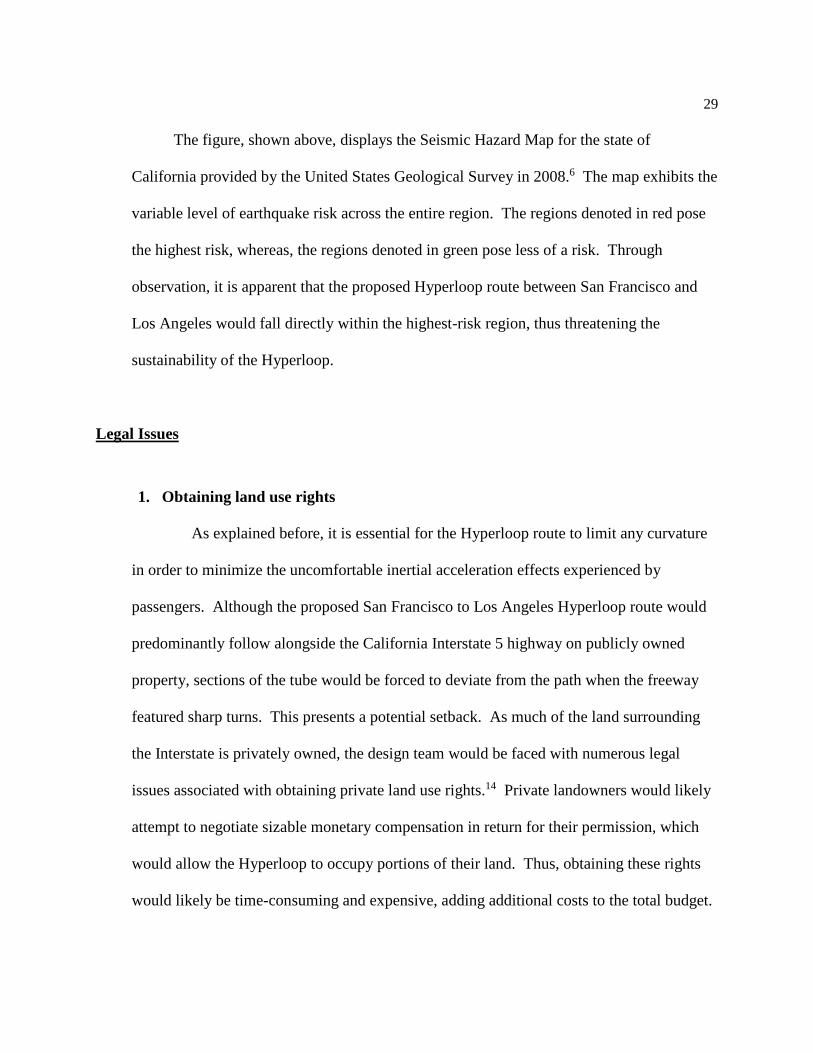
29 The figure, shown above, displays the Seismic Hazard Map for the state of
California provided by the United States Geological Survey in 2008.6 The map exhibits the
variable level of earthquake risk across the entire region. The regions denoted in red pose
the highest risk, whereas, the regions denoted in green pose less of a risk. Through
observation, it is apparent that the proposed Hyperloop route between San Francisco and
Los Angeles would fall directly within the highest-risk region, thus threatening the
sustainability of the Hyperloop.
Legal Issues
1. Obtaining land use rights
As explained before, it is essential for the Hyperloop route to limit any curvature
in order to minimize the uncomfortable inertial acceleration effects experienced by
passengers. Although the proposed San Francisco to Los Angeles Hyperloop route would
predominantly follow alongside the California Interstate 5 highway on publicly owned
property, sections of the tube would be forced to deviate from the path when the freeway
featured sharp turns. This presents a potential setback. As much of the land surrounding
the Interstate is privately owned, the design team would be faced with numerous legal
issues associated with obtaining private land use rights.14 Private landowners would likely
attempt to negotiate sizable monetary compensation in return for their permission, which
would allow the Hyperloop to occupy portions of their land. Thus, obtaining these rights
would likely be time-consuming and expensive, adding additional costs to the total budget.
30 2. Environmental pushback
Just as there would be pushback from private landowners, there would also likely be
pushback from environmental activists. Conservational opponents could argue that the
construction of the Hyperloop would disrupt the natural environment and damage
ecological systems in the surrounding regions. Overtime, this could surmount to additional
lobbyist fees and increased regulation that would hinder the construction of the Hyperloop.
31
Chapter 3
Potential Markets
There are two potential markets that exist for the Hyperloop system—human passengers
and freight. Although the remainder of this paper concentrates solely on the passenger market,
this chapter will compare both potential markets, highlighting the advantages and disadvantages
associated with each. This section will also provide an overview of several alternative
Hyperloop routes that are currently being considered.
Freight vs. Passengers
As discussed in Chapter 2, Hyperloop One plans to be “moving cargo by 2020 and
passengers by 2021.” The rationality behind this decision—to focus on freight before human
passengers—stems from the plethora of safety concerns surrounding the technology. The idea is
that once Hyperloop cargo routes have been implemented successfully, the technology will
become more familiar to consumers, causing their negative perceptions to shift. Therefore, the
freight routes will essentially serve as a proof-of-concept by validating to consumers that the
technology is safe and can be trusted.
Aside from confirming the proof-of-concept, there are several advantages to
implementing Hyperloop freight routes over traditional passenger routes. Since freight routes
would not be transporting humans, the risk of human fatalities caused by a catastrophic event,
32 such as a terrorist attack, would be dramatically reduced. Additionally, the air pressure and
amount of oxygen in the capsule would also be less of a concern, since cargo would not demand
as stringent of atmospheric requirements as humans do. Therefore, any capsule depressurization
during transit would not have as severe of consequences as in the case of a passenger route. One
of the main concerns with the passenger version of the Hyperloop is the negative inertial effect
likely to cause discomfort to passengers traveling along slight curves at transonic speeds. An
advantage of the freight version is that cargo would not be affected by discomfort and could be
securely stowed so as to eliminate any damage that would be caused by these inertial forces.
Since cargo routes would not be as limited by strict curvature requirements, engineers could
instead focus on designing routes that would be more cost effective than passenger routes.
Another benefit of Hyperloop freight routes is that they could be operated around the clock,
whereas, passenger routes would likely experience a more sporadic distribution of utilization
during peak hours versus off-hours. Assuming that pricing was relatively consistent between
both versions of the Hyperloop, this potential for higher utilization would translate to the freight
routes generating more revenue.
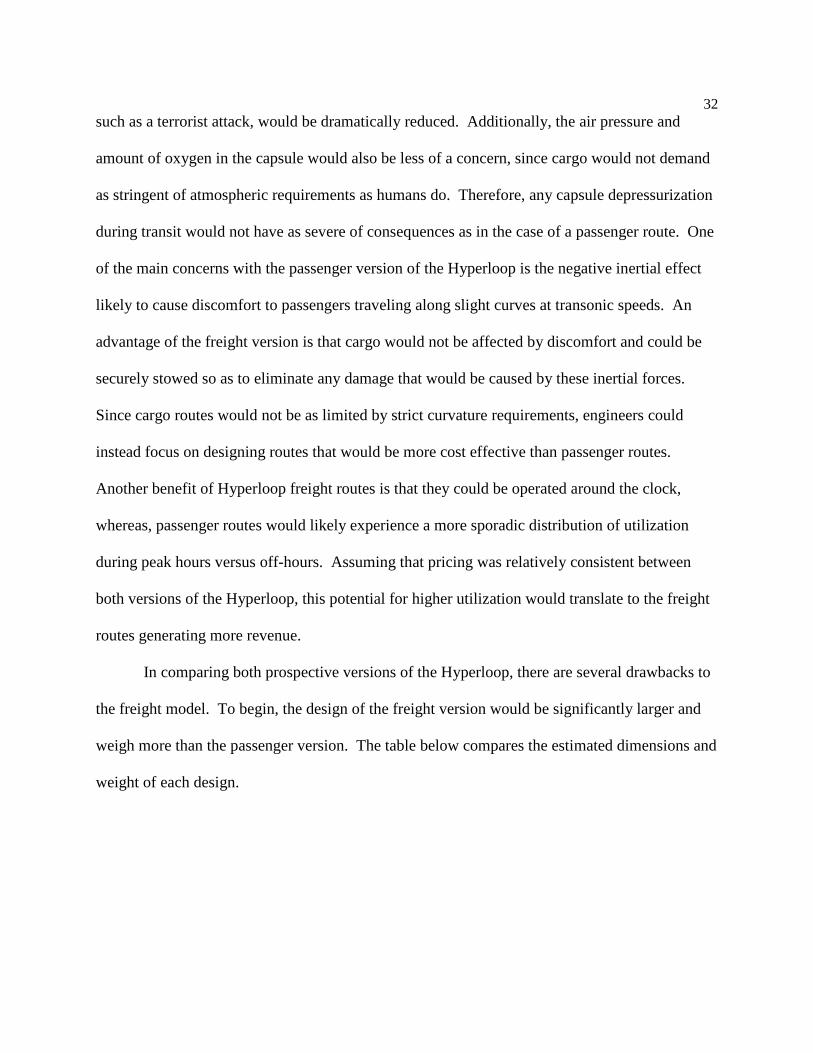
In comparing both prospective versions of the Hyperloop, there are several drawbacks to
the freight model. To begin, the design of the freight version would be significantly larger and
weigh more than the passenger version. The table below compares the estimated dimensions and
weight of each design.
33 Table 2. Dimension and Weight Comparison23
As shown above, the design of the freight capsule would be roughly 73% heavier than the
passenger capsule when fully loaded. This additional weight would mean that more energy
would be required to propel the freight capsule through the system. Thus, the freight version
would be less energy-efficient than the passenger version. This extra weight would also put
more strain on the system and likely require more pylons to support the heavier freight capsules
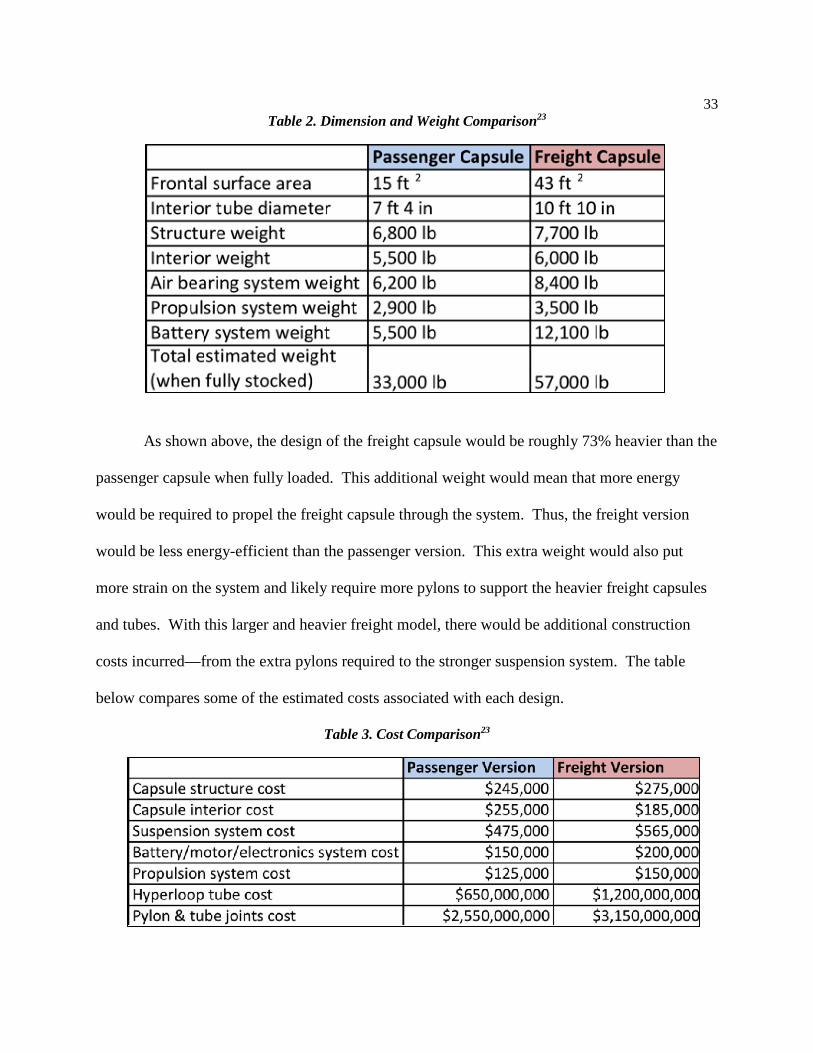
and tubes. With this larger and heavier freight model, there would be additional construction
costs incurred—from the extra pylons required to the stronger suspension system. The table
below compares some of the estimated costs associated with each design.
Table 3. Cost Comparison23
34 Aside from the increased upfront and operational costs associated with the freight model,
another important thing to consider is the recent trend in the freight transportation industry.
Since 2012, the average capacity utilization throughout the airfreight industry has decreased to
43.5%, as a result of larger commercial passenger fleets absorbing much of the cargo shipment
demand.29 In turn, this has led to a decrease in the cost of airfreight transportation. This is
important to note, as the Hyperloop freight model would directly compete with the airfreight
industry. If these prices continue to fall, it would be tough for the Hyperloop freight system to
offer competitive services while operating profitably.
Prospective Routes
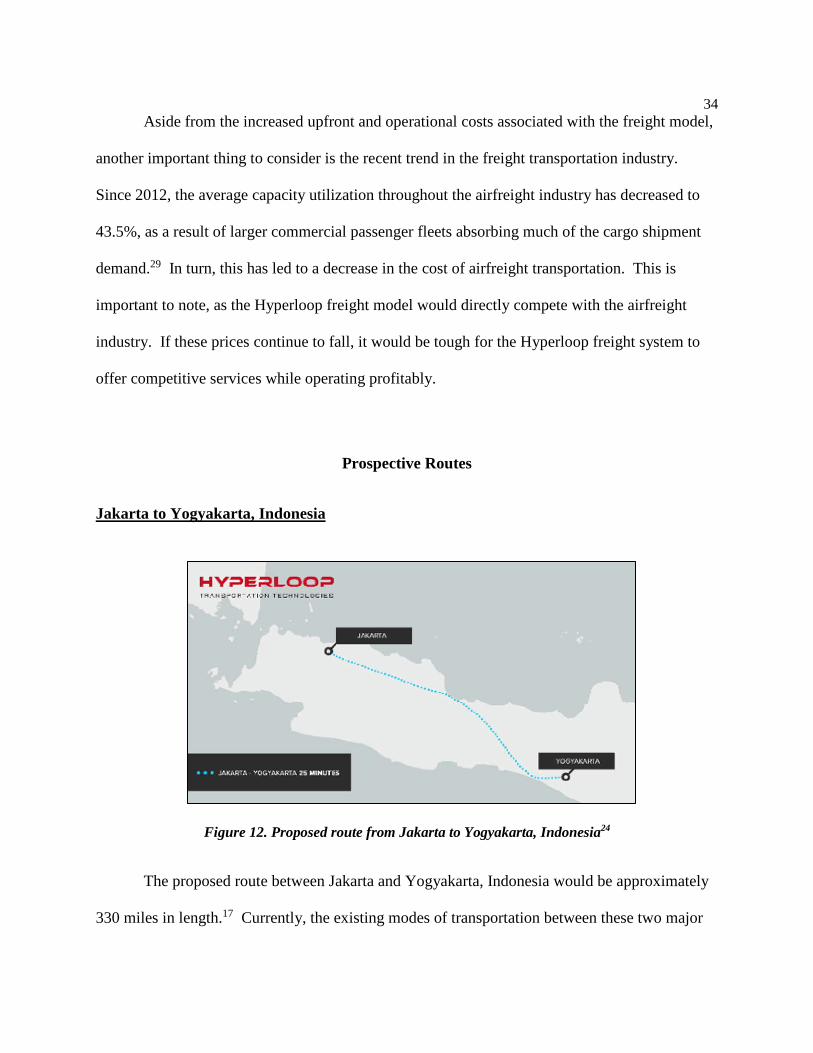
Jakarta to Yogyakarta, Indonesia
Figure 12. Proposed route from Jakarta to Yogyakarta, Indonesia24
The proposed route between Jakarta and Yogyakarta, Indonesia would be approximately
330 miles in length.17 Currently, the existing modes of transportation between these two major

35 cities are by plane, train, and automobile. On average, the flight time between Jakarta and
Yogyakarta is about 70 minutes, express trains take from 7.5 – 9.5 hours, and travel by car takes
about 11.5 hours.11 In comparison, the Hyperloop route from Jakarta to Yogyakarta would take
approximately 25 minutes—roughly 35% of the total travel time required for the next fastest
mode of transportation.15 Hyperloop Transportation Technologies is also exploring potential
routes to Bandung and another from Jakarta Soekarno-Hatta International Airport to
the Jakarta city center, which would have a travel time of roughly 9 and 5 minutes respectively.
The passenger market in this region is massive. Indonesia is the fourth most populated country
in the world, with a population of over 260 million people. Jakarta alone has over 10 million
residents and is particularly known for its severe traffic congestion that makes the daily commute
unbearable for citizens.17 In addition, air pollution derived from automobile emissions has
become a real issue in this region of Indonesia. Thus, the Hyperloop would be an ideal solution
for alleviating traffic congestion and air pollution problems currently faced in Jakarta.
Abu Dhabi to Dubai, United Arab Emirates
Figure 13. Proposed route from Abu Dhabi to Dubai, United Arab Emirates27
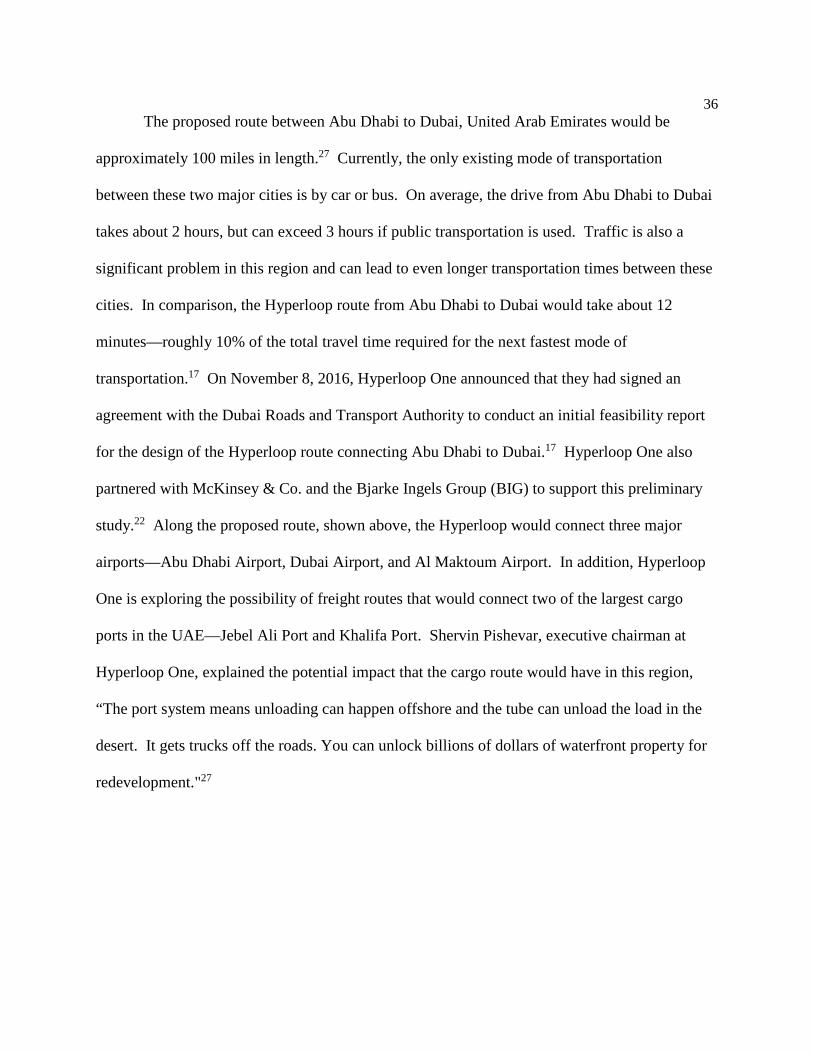
36 The proposed route between Abu Dhabi to Dubai, United Arab Emirates would be
approximately 100 miles in length.27 Currently, the only existing mode of transportation
between these two major cities is by car or bus. On average, the drive from Abu Dhabi to Dubai
takes about 2 hours, but can exceed 3 hours if public transportation is used. Traffic is also a
significant problem in this region and can lead to even longer transportation times between these
cities. In comparison, the Hyperloop route from Abu Dhabi to Dubai would take about 12
minutes—roughly 10% of the total travel time required for the next fastest mode of
transportation.17 On November 8, 2016, Hyperloop One announced that they had signed an
agreement with the Dubai Roads and Transport Authority to conduct an initial feasibility report
for the design of the Hyperloop route connecting Abu Dhabi to Dubai.17 Hyperloop One also
partnered with McKinsey & Co. and the Bjarke Ingels Group (BIG) to support this preliminary
study.22 Along the proposed route, shown above, the Hyperloop would connect three major
airports—Abu Dhabi Airport, Dubai Airport, and Al Maktoum Airport. In addition, Hyperloop
One is exploring the possibility of freight routes that would connect two of the largest cargo
ports in the UAE—Jebel Ali Port and Khalifa Port. Shervin Pishevar, executive chairman at
Hyperloop One, explained the potential impact that the cargo route would have in this region,
“The port system means unloading can happen offshore and the tube can unload the load in the
desert. It gets trucks off the roads. You can unlock billions of dollars of waterfront property for
redevelopment."27
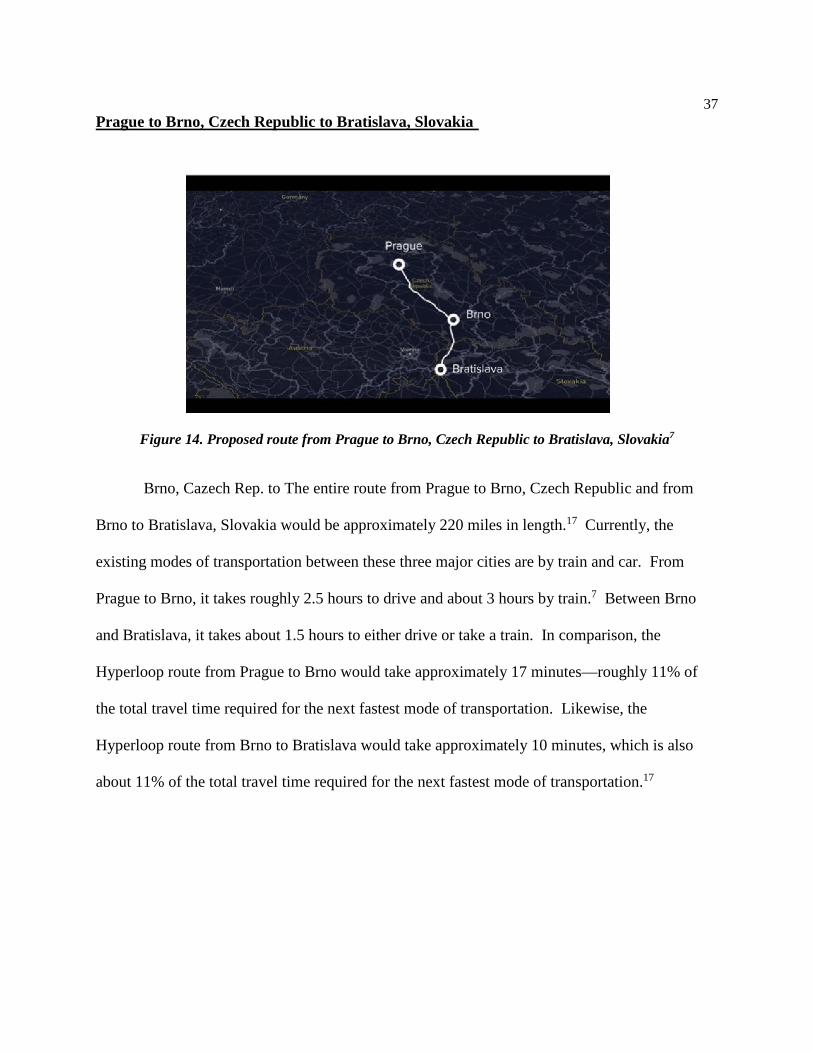
37 Prague to Brno, Czech Republic to Bratislava, Slovakia
Figure 14. Proposed route from Prague to Brno, Czech Republic to Bratislava, Slovakia7
Brno, Cazech Rep. to The entire route from Prague to Brno, Czech Republic and from
Brno to Bratislava, Slovakia would be approximately 220 miles in length.17 Currently, the
existing modes of transportation between these three major cities are by train and car. From
Prague to Brno, it takes roughly 2.5 hours to drive and about 3 hours by train.7 Between Brno
and Bratislava, it takes about 1.5 hours to either drive or take a train. In comparison, the
Hyperloop route from Prague to Brno would take approximately 17 minutes—roughly 11% of
the total travel time required for the next fastest mode of transportation. Likewise, the
Hyperloop route from Brno to Bratislava would take approximately 10 minutes, which is also
about 11% of the total travel time required for the next fastest mode of transportation.17

38 Chapter 4
Alternative Modes of Transportation
When analyzing the feasibility of implementing Hyperloop technology, it is important to
consider the alternative forms of transportation that currently exist. This section will focus on
comparing how various modes of modern transportation, including automobiles, commercial
jets, Maglev trains, and the proposed California High Speed Rail, would stack up along the
proposed San Francisco to Los Angeles route. In order to standardize the evaluation, each form
of transportation will be assessed by the same criteria. The table below demonstrates the
comparison between the Hyperloop and four alternative modes of transportation.
Table 4. Hyperloop Comparison to Alternative Modes2
39 Benefits of the Hyperloop
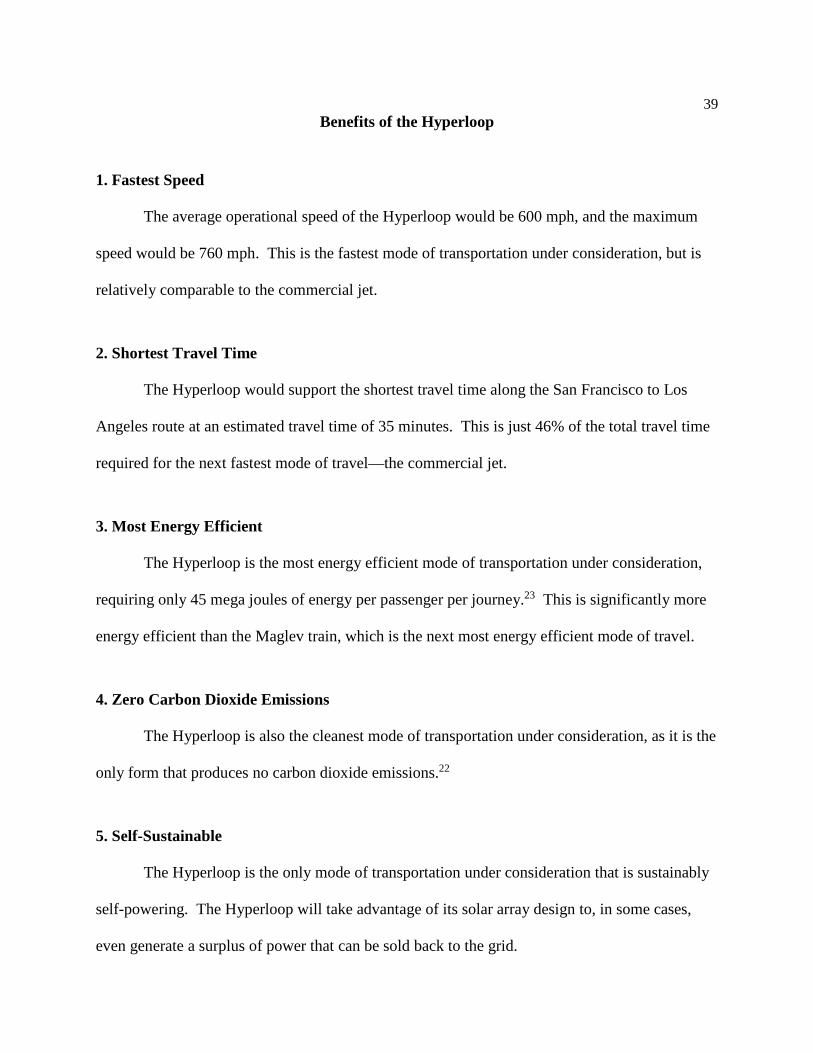
1. Fastest Speed The average operational speed of the Hyperloop would be 600 mph, and the maximum
speed would be 760 mph. This is the fastest mode of transportation under consideration, but is
relatively comparable to the commercial jet.
2. Shortest Travel Time The Hyperloop would support the shortest travel time along the San Francisco to Los
Angeles route at an estimated travel time of 35 minutes. This is just 46% of the total travel time
required for the next fastest mode of travel—the commercial jet.
3. Most Energy Efficient
The Hyperloop is the most energy efficient mode of transportation under consideration,
requiring only 45 mega joules of energy per passenger per journey.23 This is significantly more
energy efficient than the Maglev train, which is the next most energy efficient mode of travel.
4. Zero Carbon Dioxide Emissions
The Hyperloop is also the cleanest mode of transportation under consideration, as it is the
only form that produces no carbon dioxide emissions.22
5. Self-Sustainable
The Hyperloop is the only mode of transportation under consideration that is sustainably
self-powering. The Hyperloop will take advantage of its solar array design to, in some cases,
even generate a surplus of power that can be sold back to the grid.
40 6. Immunity to Weather
The Hyperloop is a closed system, and is, thus, immune to the effects of weather. This is
one of the major advantages that the Hyperloop has over commercial airline travel.
7. Resistance to Earthquakes The Hyperloop is the only mode of rail transportation that is resistant to earthquakes. It
takes advantage of the pylon and dampening system design to support this feature, which is
especially important along the earthquake-prone San Francisco to Los Angeles route.
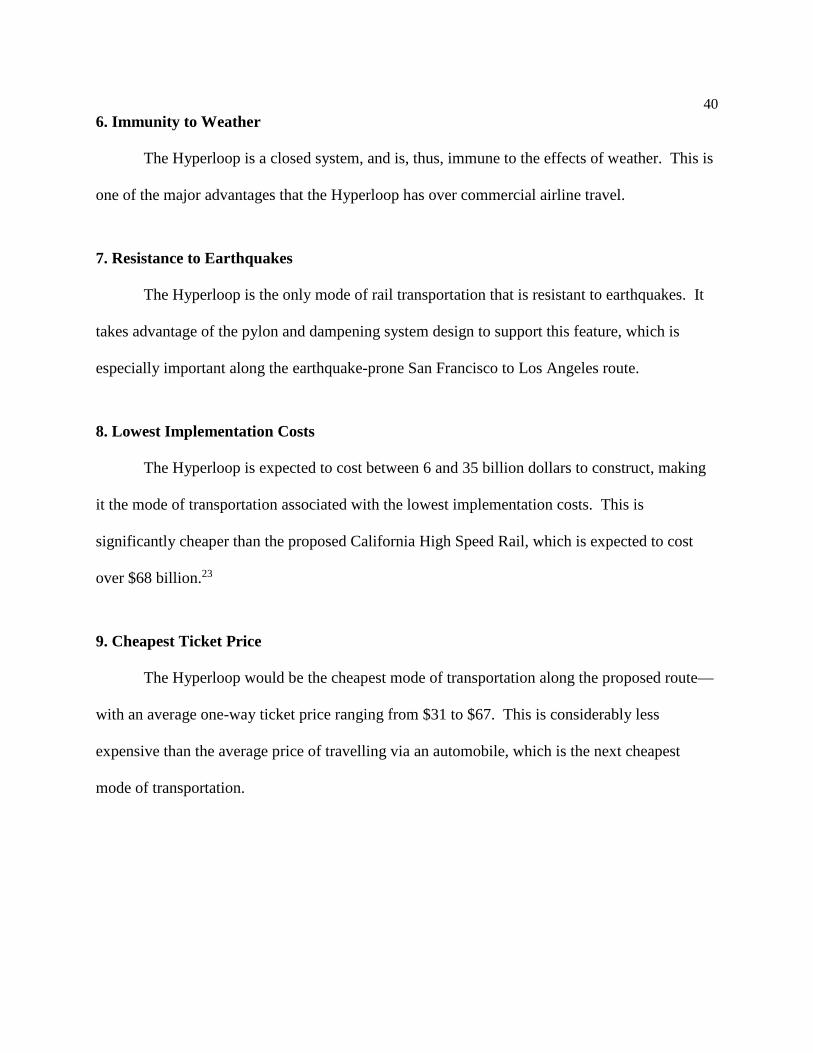
8. Lowest Implementation Costs
The Hyperloop is expected to cost between 6 and 35 billion dollars to construct, making
it the mode of transportation associated with the lowest implementation costs. This is
significantly cheaper than the proposed California High Speed Rail, which is expected to cost
over $68 billion.23
9. Cheapest Ticket Price The Hyperloop would be the cheapest mode of transportation along the proposed route—
with an average one-way ticket price ranging from $31 to $67. This is considerably less
expensive than the average price of travelling via an automobile, which is the next cheapest
mode of transportation.

41
Chapter 5
Potential Revenue Analysis
The first step in our valuation of the Hyperloop concept was to analyze the potential
revenue of the proposed San Francisco to Los Angeles route. In order to forecast the expected
revenue of the Hyperloop over the next two decades, we had to estimate the annual consumer
demand of the system, determine appropriate growth rates, and create a ticket-pricing model to
evaluate the potential revenue that would be produced at various price levels. This section will
describe each of these steps in depth and explain several of the assumptions that were built into
the Hyperloop revenue model.
Estimated Consumer Demand Forecast
In order to estimate the potential revenue that the San Francisco to Los Angeles
Hyperloop route would generate, it was necessary to gauge the expected consumer demand of
the system. The first step was to determine the total volume of passenger travel between San
Francisco and Los Angeles in 2016, which was set as the base year for our model. Currently, the
only two modes of transportation between the city-pair are by airplane or car travel, and thus,
these were the only two markets considered in our analysis. From the Domestic Airline
Consumer Airfare Report posted on the US Department of Transportation website, we found the
42 total amount of airline passengers that traveled between the San Francisco and Los Angeles city-
pair market to be roughly 7.44 million passengers in 2016.8
In the five years prior to 2016, between 2011-2015, the average annual growth rate was
2.11% for the passenger demand between these two cities. For simplification of our model, we
applied a standard 2% growth rate to forecast the annual consumer airline demand from 2016 out
to year 2035. These demand forecasts are listed in the Appendix section. The next step was to
estimate the amount of passengers that travel by car between the two cities each year. This step
was not as simple as the last, as there was a lack of available information that would indicate an
exact number. We determined that the best technique for this approximation was to follow a
similar methodology used in a 2013 University of Chicago report13, which derived the quantity
of car travelers from airline passenger data. From examination of the Domestic Travel Market
Report produced by the U.S. Travel Association, we calculated the ratio of domestic travel
between airlines and car travel to be 28% and 72% respectively.21 Assuming that this rough
breakdown would remain constant throughout our forecast horizon, we applied this ratio to the
consumer airline demand forecasts (calculated in the previous step) to back into the forecast for
car travel demand between the two cities. With airline demand and car travel demand
successfully forecasted, we simply added both components to determine the forecasted values for
the total volume of passenger travel between San Francisco and Los Angeles.
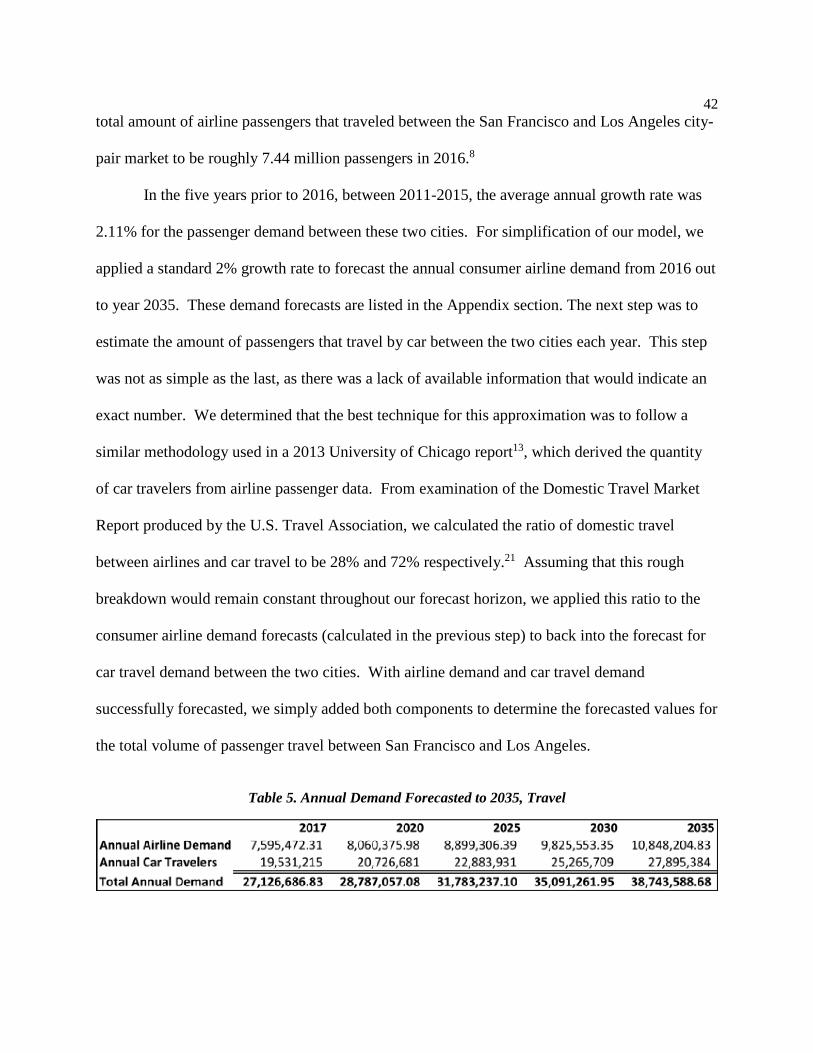
Table 5. Annual Demand Forecasted to 2035, Travel
43 The table above shows the forecasted annual demand between San Francisco to Los
Angeles between 2017 and 2035. It is important to note that this annual demand is probably
underestimated, as the Hyperloop would likely draw large crowds due to its revolutionary nature
and ability to open up opportunities for efficient travel that were not previously available. From
this annual demand forecast, we were able to compare these values to the capacity of the
proposed Hyperloop system to derive ridership estimates for the San Francisco to Los Angeles
route over the next two decades. In order to make this comparison, we first had to calculate the
annual capacity of the proposed system:
28 (passengers per capsule) x 720 (departures/day) x 365 (days) x 2 (tubes)
= 14.72 million annual passengers
For this calculation, we assumed that each 28-person capsule departed every 2 minutes on
average, totaling 720 departures per day. Since the forecasted annual demand exceeded the
annual capacity of the system, we concluded that the system would theoretically be at constant
capacity. For our valuation, however, we applied a utilization multiple to account for realistic
scenarios in which each capsule was not filled to capacity, as is common within the consumer
airline industry.
Estimated Ticket Pricing
The next step in estimating the potential revenue was to create a ticket-pricing model. To
begin, we calculated the current weighted average cost of travel between San Francisco to Los
Angeles in 2016, based on the average cost of airline and car travel. From the Domestic Airline
44 Consumer Airfare Report, we found the average airline ticket price between San Francisco and
Los Angeles to be $149.57 in 2016.21 In order to find the average cost of car travel between the
two cities, we referred to average gas prices listed by AAA. In 2016, the average price of gas in
California was about $3.00/gallon, or $0.10/mile assuming the average 30-mpg car.1 Thus, the
average cost of car travel along the 350-mile route between San Francisco and Los Angeles was
roughly $35.00 (350 miles x $0.10/mile). After estimating the average cost of airline and car
travel, we calculated the weighted average cost of travel between San Francisco to Los Angeles:
(0.28 x $149.57) + (0.72 x $35.00)
= $67.08
To simplify our model, we used $67.00 as the weighted average cost of travel for one of
the ticket price options. Since the revenue analysis would be drastically influenced by the
estimated ticket price of the Hyperloop system, we wanted to the model under various ticket
price assumptions. Several feasibility studies conducted by third party firms recommended a
ticket price in the mid-20 to mid-30 dollar range, in order for the Hyperloop to operate
profitably. Furthermore, in the initial Hyperloop white papers, the suggested ticket price for the
San Francisco to Los Angeles route was $20 plus operational costs.23 The next section will
explain the estimated operational costs of the system in depth, but for the purpose of ticket
pricing, this suggested price would come out to roughly $31, in order to cover the operating costs
associated with each passenger. We used this $31 proposed ticket price as the least expensive
scenario to analyze. In order to create a base ticket price, we took the mid-point of the weighted
average cost of transportation ($67) and the proposed ticket price ($31), which was $49. The
table below exhibits the three ticket price assumptions that we applied to our revenue model.
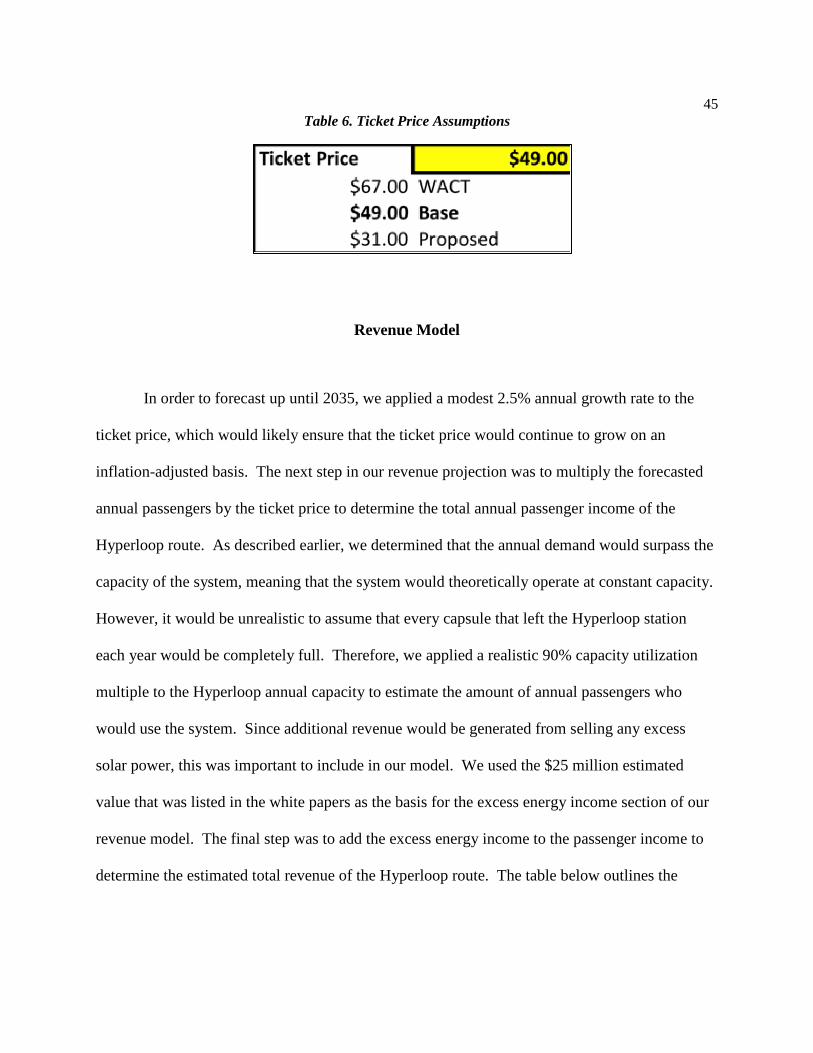
45 Table 6. Ticket Price Assumptions
Revenue Model
In order to forecast up until 2035, we applied a modest 2.5% annual growth rate to the
ticket price, which would likely ensure that the ticket price would continue to grow on an
inflation-adjusted basis. The next step in our revenue projection was to multiply the forecasted
annual passengers by the ticket price to determine the total annual passenger income of the
Hyperloop route. As described earlier, we determined that the annual demand would surpass the
capacity of the system, meaning that the system would theoretically operate at constant capacity.
However, it would be unrealistic to assume that every capsule that left the Hyperloop station
each year would be completely full. Therefore, we applied a realistic 90% capacity utilization
multiple to the Hyperloop annual capacity to estimate the amount of annual passengers who
would use the system. Since additional revenue would be generated from selling any excess
solar power, this was important to include in our model. We used the $25 million estimated
value that was listed in the white papers as the basis for the excess energy income section of our
revenue model. The final step was to add the excess energy income to the passenger income to
determine the estimated total revenue of the Hyperloop route. The table below outlines the
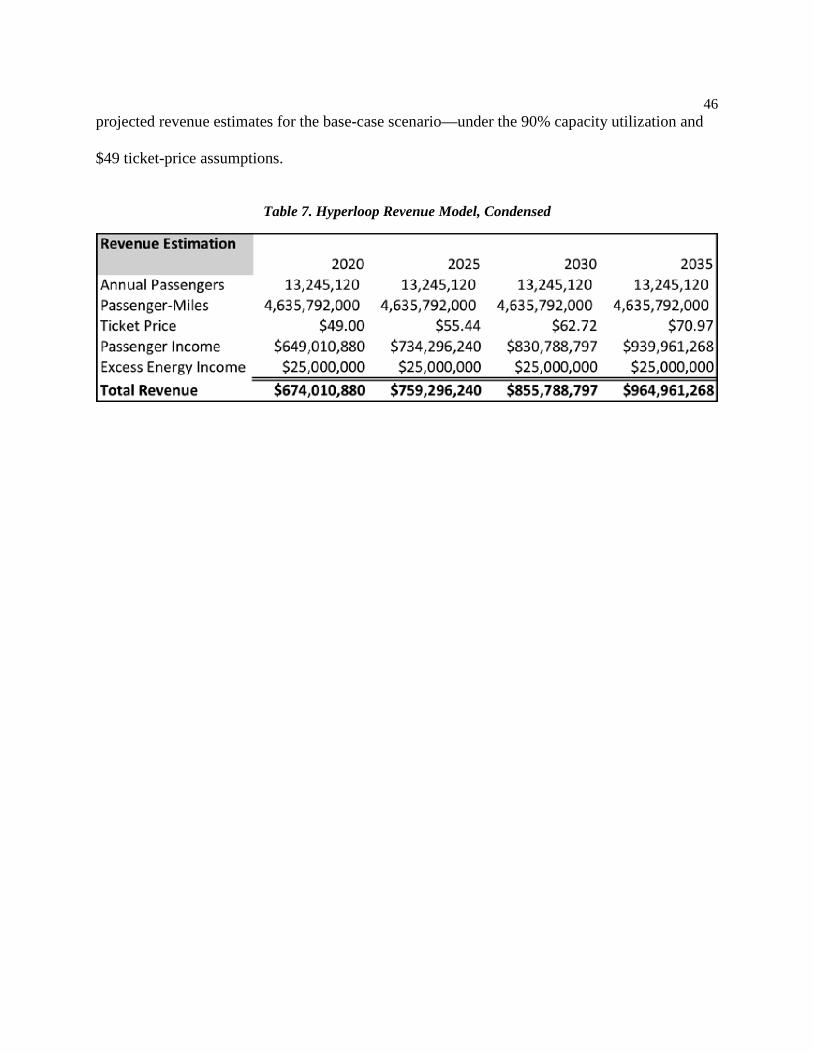
46 projected revenue estimates for the base-case scenario—under the 90% capacity utilization and
$49 ticket-price assumptions.
Table 7. Hyperloop Revenue Model, Condensed
47
Chapter 6
Estimated Cost Analysis
The next step in our valuation of the Hyperloop concept was to analyze the potential
costs associated with the proposed San Francisco to Los Angeles route. For our valuation, we
focused on determining if the Hyperloop system would be operationally profitable first, by
initially disregarding the cost of implementation. Once we estimated the operational
profitability, we could start to consider how the implementation costs could be covered by the
future flow of operational income. In order to forecast the expected operational costs of the
system over the next two decades, we divided the costs into two categories—variable operating
costs and fixed maintenance costs. Once both of these costs were estimated, we created a model
to evaluate the operating profit produced at various cost levels. This section will describe each
of these steps in depth, explain several of the assumptions that were built into the operational
cost model, and provide a high-level outline for the estimated total implementation costs of the
Hyperloop system.
Estimated Fixed Maintenance Cost Forecast
In order to estimate the operational costs that would be incurred by the San Francisco to
Los Angeles Hyperloop route, it was necessary to first forecast the fixed maintenance cost. We
defined the fixed costs of the Hyperloop as any cost that was associated with the maintenance of

48 the system, including the cost of labor, energy, or materials required for upkeep. The fixed
maintenance cost was expressed in terms of dollars per mile. Since the Hyperloop system has
not been implemented yet, it was difficult to gauge this value. As a foundation for this analysis
we looked at a 2016 feasibility analysis conducted by KPMG, which estimated the annual fixed
cost of maintenance for the proposed Helsinki to Stockholm Hyperloop route to be $137,761 per
mile.25 With not much else to base this cost estimate off of, we set $140,000 as the base-case
scenario for our operational cost model. In order to create a dynamic model that could evaluate
the operational profitability at various cost levels, we considered two other fixed cost structures.
The table below exhibits the three fixed cost assumptions that we applied to our operational cost
model.
Table 8. Fixed Costs
Estimated Variable Operating Cost Forecast
The next step was to estimate the variable operating costs of the proposed route. We
defined the variable operating costs as any cost that was associated with the operation of the
system, including labor, energy, selling, general, and administrative costs. The variable
operating cost was expressed in terms of dollars per passenger-mile. As explained in the
previous subsection, since the Hyperloop system has not been implemented yet, it was difficult
to gauge this value. Again, we referred to the 2016 KPMG study as the basis for this estimate.
According to KPMG, the variable operating costs for the Helsinki-Stockholm route would be
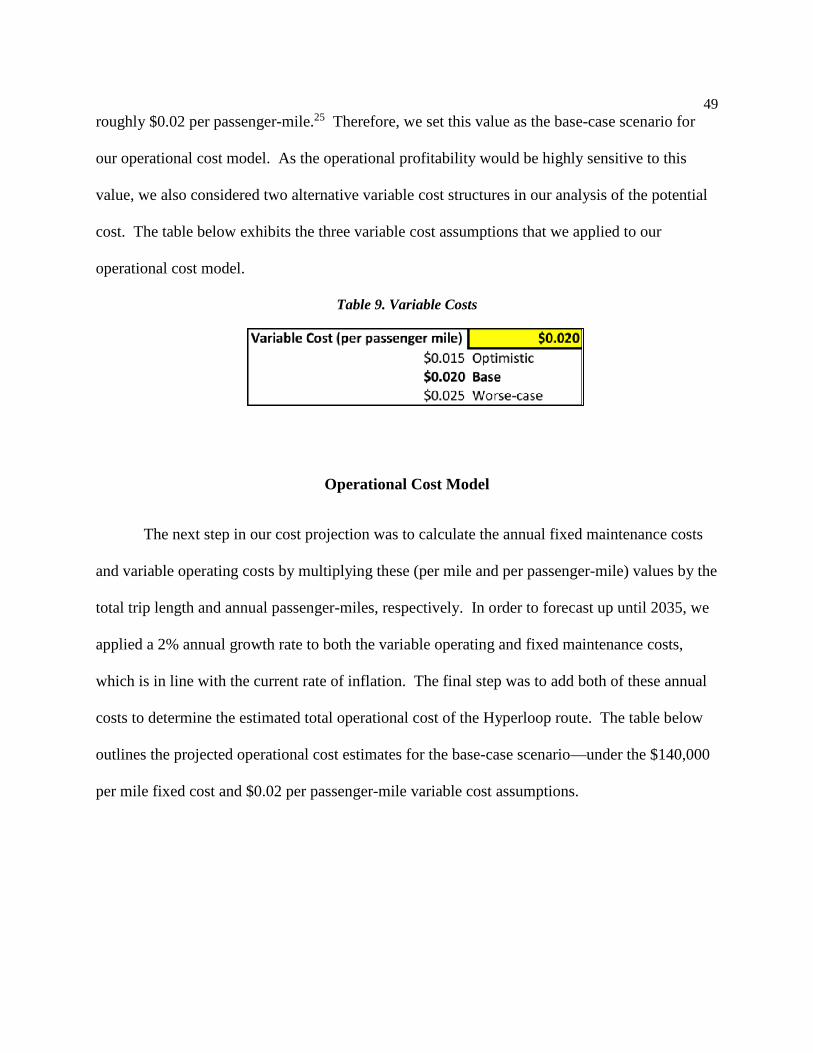
49 roughly $0.02 per passenger-mile.25 Therefore, we set this value as the base-case scenario for
our operational cost model. As the operational profitability would be highly sensitive to this
value, we also considered two alternative variable cost structures in our analysis of the potential
cost. The table below exhibits the three variable cost assumptions that we applied to our
operational cost model.
Table 9. Variable Costs
Operational Cost Model
The next step in our cost projection was to calculate the annual fixed maintenance costs
and variable operating costs by multiplying these (per mile and per passenger-mile) values by the
total trip length and annual passenger-miles, respectively. In order to forecast up until 2035, we
applied a 2% annual growth rate to both the variable operating and fixed maintenance costs,
which is in line with the current rate of inflation. The final step was to add both of these annual
costs to determine the estimated total operational cost of the Hyperloop route. The table below
outlines the projected operational cost estimates for the base-case scenario—under the $140,000
per mile fixed cost and $0.02 per passenger-mile variable cost assumptions.
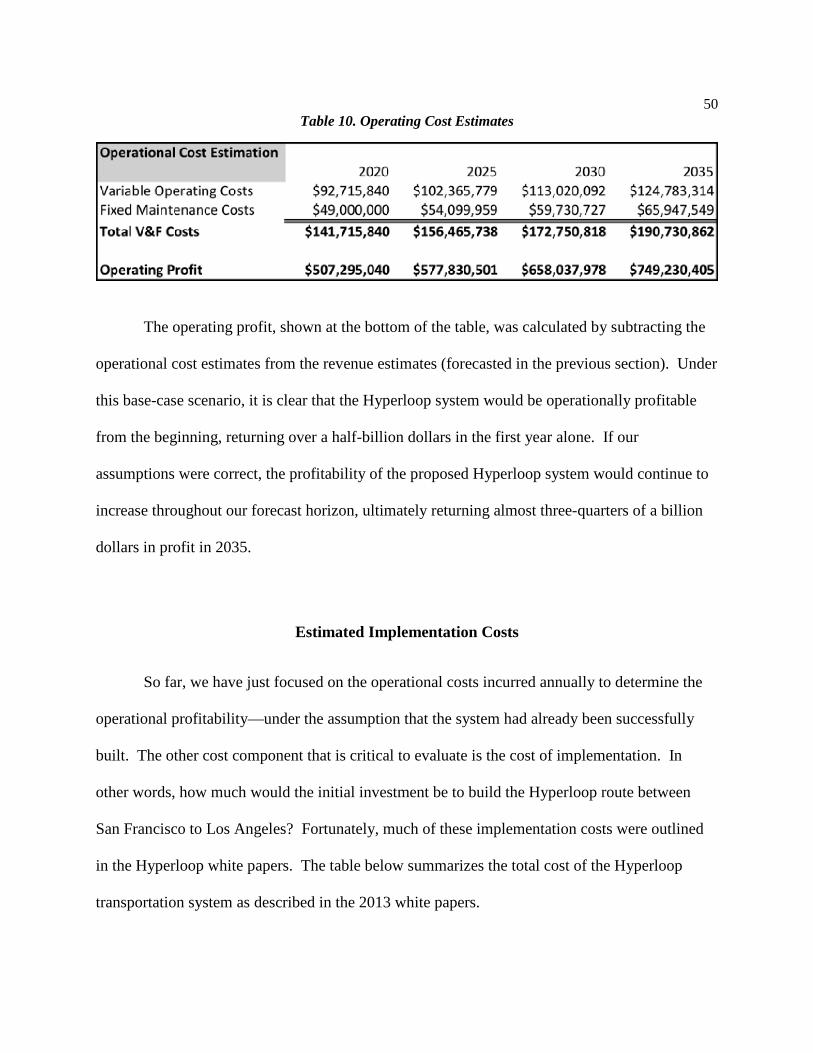
50 Table 10. Operating Cost Estimates
The operating profit, shown at the bottom of the table, was calculated by subtracting the
operational cost estimates from the revenue estimates (forecasted in the previous section). Under
this base-case scenario, it is clear that the Hyperloop system would be operationally profitable
from the beginning, returning over a half-billion dollars in the first year alone. If our
assumptions were correct, the profitability of the proposed Hyperloop system would continue to
increase throughout our forecast horizon, ultimately returning almost three-quarters of a billion
dollars in profit in 2035.
Estimated Implementation Costs
So far, we have just focused on the operational costs incurred annually to determine the
operational profitability—under the assumption that the system had already been successfully
built. The other cost component that is critical to evaluate is the cost of implementation. In
other words, how much would the initial investment be to build the Hyperloop route between
San Francisco to Los Angeles? Fortunately, much of these implementation costs were outlined
in the Hyperloop white papers. The table below summarizes the total cost of the Hyperloop
transportation system as described in the 2013 white papers.
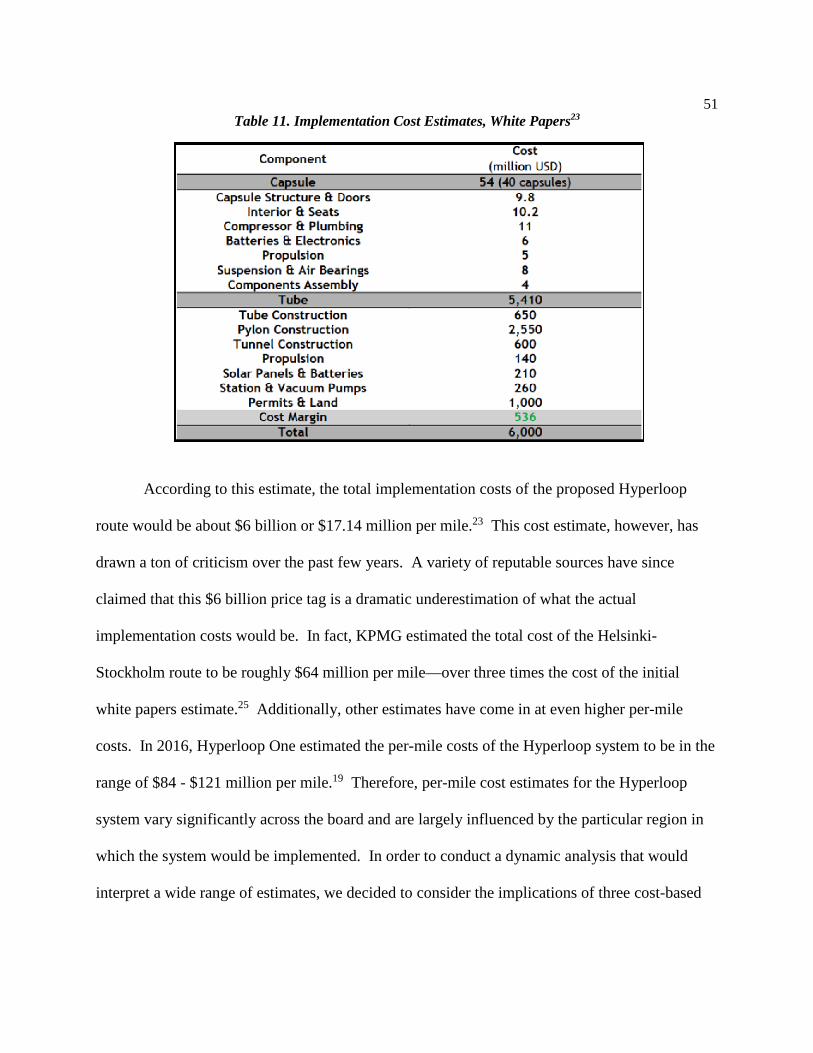
51 Table 11. Implementation Cost Estimates, White Papers23
According to this estimate, the total implementation costs of the proposed Hyperloop
route would be about $6 billion or $17.14 million per mile.23 This cost estimate, however, has
drawn a ton of criticism over the past few years. A variety of reputable sources have since
claimed that this $6 billion price tag is a dramatic underestimation of what the actual
implementation costs would be. In fact, KPMG estimated the total cost of the Helsinki-
Stockholm route to be roughly $64 million per mile—over three times the cost of the initial
white papers estimate.25 Additionally, other estimates have come in at even higher per-mile
costs. In 2016, Hyperloop One estimated the per-mile costs of the Hyperloop system to be in the
range of $84 - $121 million per mile.19 Therefore, per-mile cost estimates for the Hyperloop
system vary significantly across the board and are largely influenced by the particular region in
which the system would be implemented. In order to conduct a dynamic analysis that would
interpret a wide range of estimates, we decided to consider the implications of three cost-based
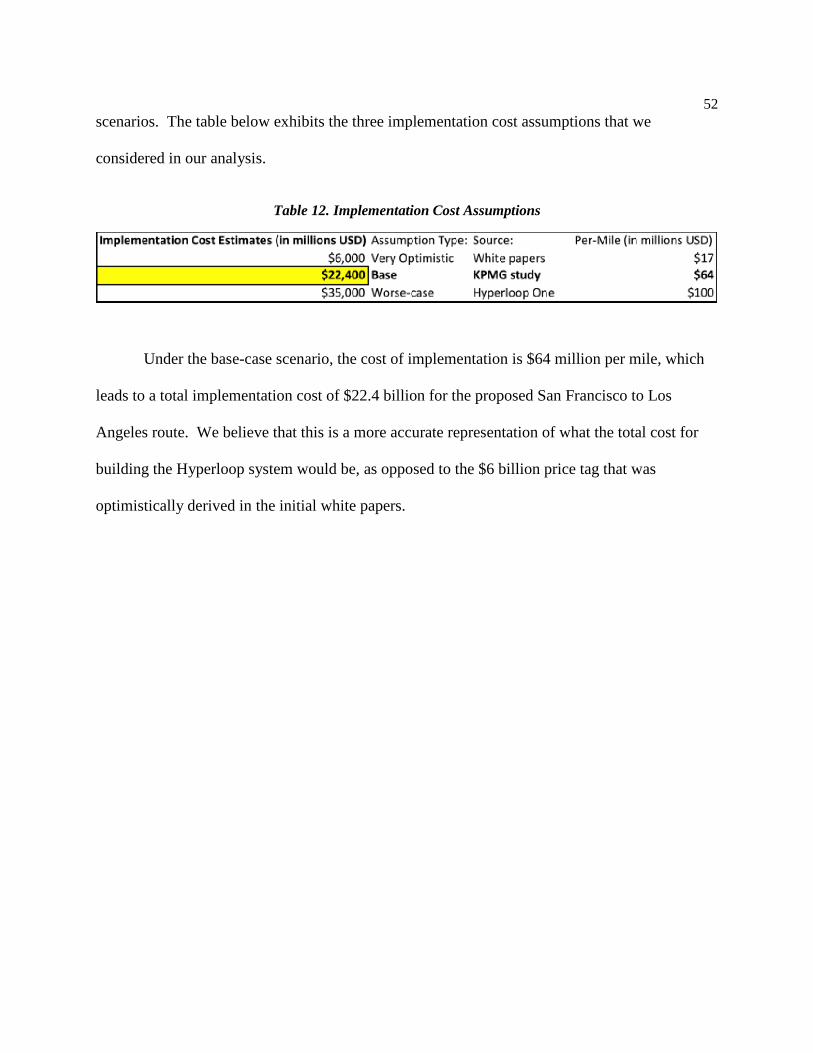
52 scenarios. The table below exhibits the three implementation cost assumptions that we
considered in our analysis.
Table 12. Implementation Cost Assumptions
Under the base-case scenario, the cost of implementation is $64 million per mile, which
leads to a total implementation cost of $22.4 billion for the proposed San Francisco to Los
Angeles route. We believe that this is a more accurate representation of what the total cost for
building the Hyperloop system would be, as opposed to the $6 billion price tag that was
optimistically derived in the initial white papers.
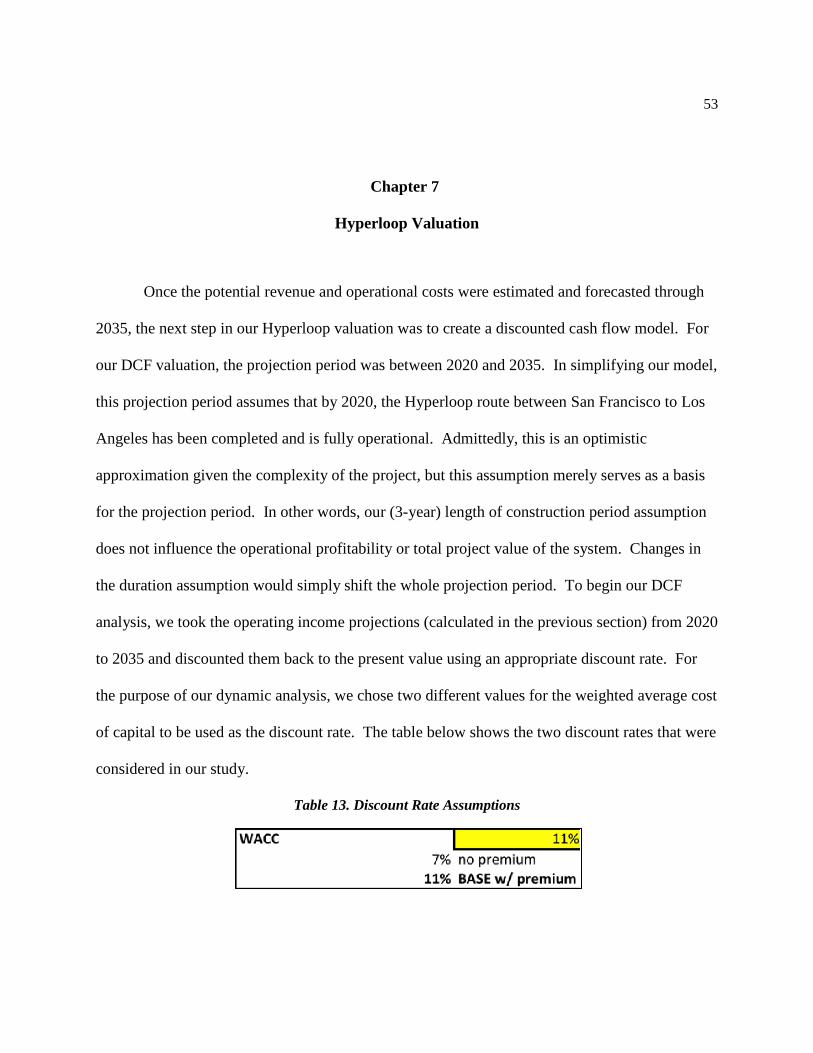
53
Chapter 7
Hyperloop Valuation
Once the potential revenue and operational costs were estimated and forecasted through
2035, the next step in our Hyperloop valuation was to create a discounted cash flow model. For
our DCF valuation, the projection period was between 2020 and 2035. In simplifying our model,
this projection period assumes that by 2020, the Hyperloop route between San Francisco to Los
Angeles has been completed and is fully operational. Admittedly, this is an optimistic
approximation given the complexity of the project, but this assumption merely serves as a basis
for the projection period. In other words, our (3-year) length of construction period assumption
does not influence the operational profitability or total project value of the system. Changes in
the duration assumption would simply shift the whole projection period. To begin our DCF
analysis, we took the operating income projections (calculated in the previous section) from 2020
to 2035 and discounted them back to the present value using an appropriate discount rate. For
the purpose of our dynamic analysis, we chose two different values for the weighted average cost
of capital to be used as the discount rate. The table below shows the two discount rates that were
considered in our study.
Table 13. Discount Rate Assumptions
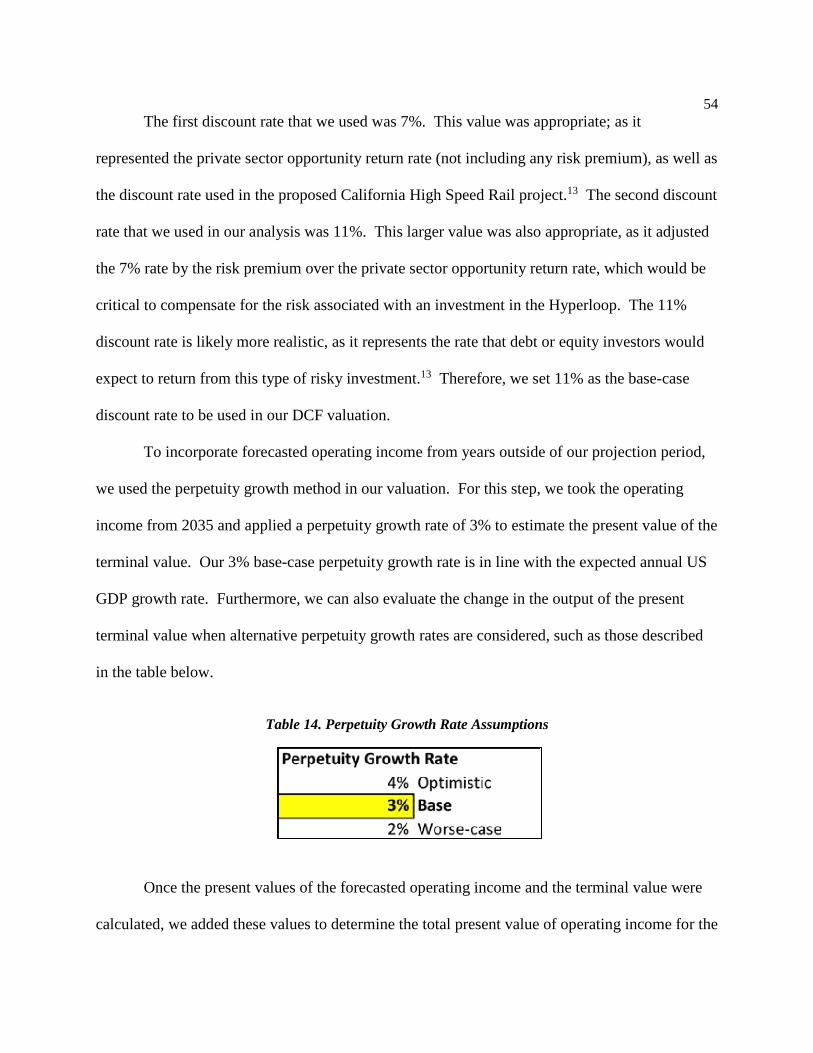
54 The first discount rate that we used was 7%. This value was appropriate; as it
represented the private sector opportunity return rate (not including any risk premium), as well as
the discount rate used in the proposed California High Speed Rail project.13 The second discount
rate that we used in our analysis was 11%. This larger value was also appropriate, as it adjusted
the 7% rate by the risk premium over the private sector opportunity return rate, which would be
critical to compensate for the risk associated with an investment in the Hyperloop. The 11%
discount rate is likely more realistic, as it represents the rate that debt or equity investors would
expect to return from this type of risky investment.13 Therefore, we set 11% as the base-case
discount rate to be used in our DCF valuation.
To incorporate forecasted operating income from years outside of our projection period,
we used the perpetuity growth method in our valuation. For this step, we took the operating
income from 2035 and applied a perpetuity growth rate of 3% to estimate the present value of the
terminal value. Our 3% base-case perpetuity growth rate is in line with the expected annual US
GDP growth rate. Furthermore, we can also evaluate the change in the output of the present
terminal value when alternative perpetuity growth rates are considered, such as those described
in the table below.
Table 14. Perpetuity Growth Rate Assumptions
Once the present values of the forecasted operating income and the terminal value were
calculated, we added these values to determine the total present value of operating income for the
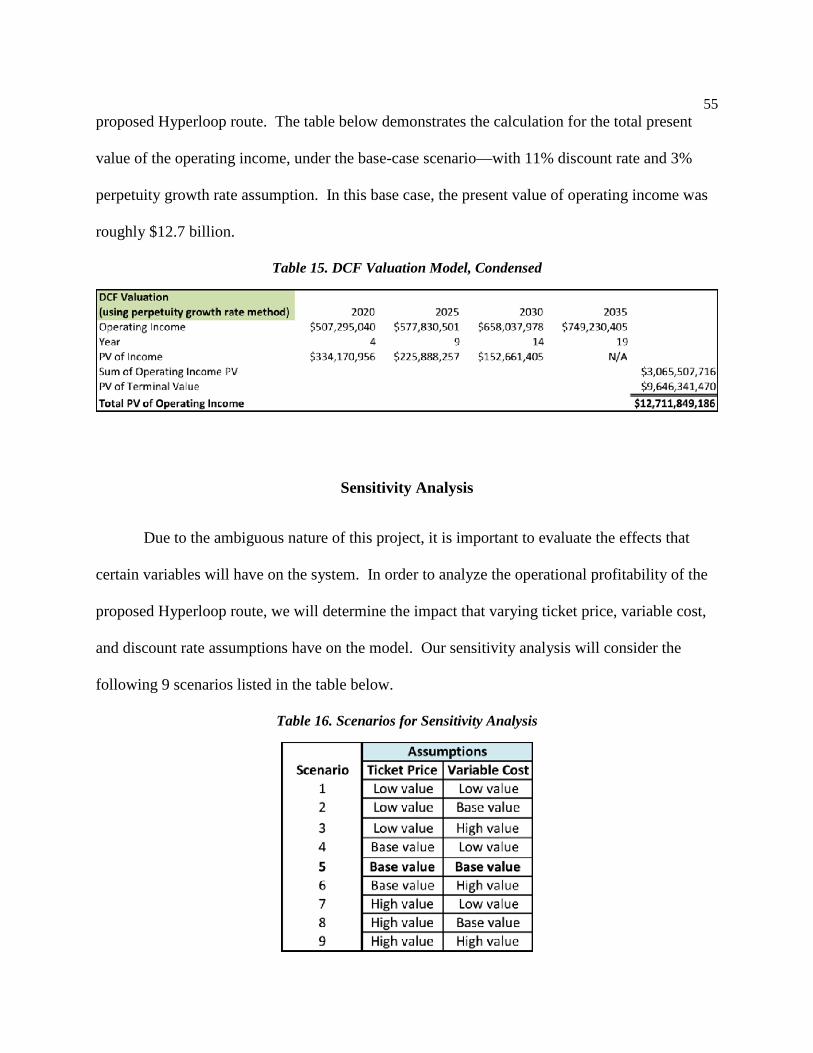
55 proposed Hyperloop route. The table below demonstrates the calculation for the total present
value of the operating income, under the base-case scenario—with 11% discount rate and 3%
perpetuity growth rate assumption. In this base case, the present value of operating income was
roughly $12.7 billion.
Table 15. DCF Valuation Model, Condensed
Sensitivity Analysis
Due to the ambiguous nature of this project, it is important to evaluate the effects that
certain variables will have on the system. In order to analyze the operational profitability of the
proposed Hyperloop route, we will determine the impact that varying ticket price, variable cost,
and discount rate assumptions have on the model. Our sensitivity analysis will consider the
following 9 scenarios listed in the table below.
Table 16. Scenarios for Sensitivity Analysis

56 For example, in scenario 1, the ticket price is $31.00 and the variable operating cost is
$0.015 per passenger-mile. The table below shows the results of our DCF analysis under each of
the 9 scenarios and compares the results from both discount rate assumptions.
Table 17. Sensitivity Analysis Results
Our base-case, scenario 5 (which assumes a $49 ticket price and $0.02 variable operating
cost per passenger-mile), generates a positive present value of future operating income under
both 7% and 11% discount rate assumptions. In the case of the more realistic 11% discount rate
assumption, the total present value of the proposed project equates to roughly $12.7 billion. This
means that approximately 36 – 57% of the initial implementation cost of construction could be
financed by the future operating income of the project, depending on the exact implementation
cost assumption.
Furthermore, this table allows us to visualize which scenarios would be net present value
positive after taking into consideration the initial capital construction costs. Each scenario is
either colored red to denote that the overall project would be net present value negative, or green
to denote that the overall project would be net present value positive. Under the 7% discount
rate, scenarios 4, 5, 6, 7, 8, and 9, are net present value positive, assuming initial construction
costs are $22.4 billion. This means that a private investor would likely want to invest the initial
57 capital, in order to get a positive return on their investment. On the other hand, under the 11%
discount rate, there is no scenario in which the overall project would ever become net present
value positive. Therefore, we can conclude, under this discount rate, that a private investor is
unlikely to take on the entire funding for this proposed Hyperloop route. In these net present
value negative scenarios, government funding would be required to support the initial
implementation costs.
58
Chapter 8
Conclusion
This report analyzed several aspects of the Hyperloop technology concept, with a focus
on assessing the technological and economic feasibility of the proposed system. In comparison
to existing modes of transportation, our study concluded that the Hyperloop system would offer
numerous advantages—providing the shortest travel time, lowest implementation cost, greatest
energy efficiency, least carbon emission, and cheapest ticket price—along the San Francisco to
Los Angeles route. In addition, the Hyperloop system would be completely self-sustainable,
immune to weather, and resistant to earthquakes. Therefore, we determined that the Hyperloop
system would be the most optimal form of passenger transportation in this region of California.
This conclusion, however, is entirely contingent upon the successful implementation of this
technology—under the assumption that the proposed technology functions properly and achieves
the standards outlined in the 2013 white papers. It is important to note that this is a rather
hopeful assumption, given the novelty and complexity associated with this type of infrastructure
project.
From a technological standpoint, our study concluded that there are many engineering
concerns and external risk factors associated with the design of the Hyperloop system. Many
scientists argue that creating such a large-scale vacuum system would be theoretically impossible
given the current technology that exists today. Other critics claim that any slight temperature
gradient would be problematic, as it would cause the Hyperloop tubes to expand or contract. In
addition, another major concern is the vulnerability to terrorism. Since the proposed design of

59 the Hyperloop would be built alongside the California Interstate 5 highway, it would be entirely
exposed, making it virtually impossible to defend against any form of attack. Each of these
design concerns, as well as those outlined in Chapter 2, continue to threaten the viability of the
Hyperloop technology. Nevertheless, as technology advances and new materials are developed,
engineers will likely develop solutions to several of these issues.
Our economic feasibility study established a rough valuation for the proposed San
Francisco to Los Angeles Hyperloop route through a potential revenue and operational cost
analysis. The ultimate goal was to determine whether the project would be net present value
positive, given the significant capital construction costs that would be required as an initial
investment. Our potential revenue analysis concluded that the total annual demand of the system
would exceed the annual capacity of the Hyperloop. Through our ticket pricing model, we also
determined that the one-way ticket price along the route would likely fall within the $31 - $67
dollar range. Chapter 6 outlined our process for estimating the expected operational costs of the
system, as well as the total implementation costs. Finally, we performed a discounted cash flow
analysis to derive a rough valuation from the future flow of operating income throughout the
2020 - 2035 projection period, and beyond, utilizing the perpetuity growth method. Since there
were a ton of assumptions built into this DCF model, we performed a sensitivity analysis to
consider 9 possible scenarios. We concluded that the project would be operationally profitable
in each scenario, under both discount rate assumptions. After taking into consideration the initial
capital construction costs, however, only 6 scenarios were net present value positive, under the
lesser 7% discount rate assumption. Therefore, these 6 scenarios represented the only favorable
conditions in which a private investor would be likely to provide the entire funding for the initial
construction cost investment. Under the rest of the scenarios, the conditions would be

60 unfavorable for private investment alone and require government funding to support the initial
implementation costs.
The purpose of this study was to create a base model for analyzing the Hyperloop
technology. Although this thesis focused exclusively on the San Francisco to Los Angeles
Hyperloop route, the same methodology could be applied to other potential markets to derive a
rough valuation. Between Hyperloop Transportation Technologies and Hyperloop One, there are
over 40 Hyperloop routes worldwide, which are currently under consideration.14 With support
growing from around the globe and international funding continuing to pile in, it has become
increasingly probable that the Hyperloop concept will eventually be implemented. Still, many
logistical issues remain—only time will tell.
61
Appendix A
Baseline Travel Demand Forecast Data

62
BIBLIOGRAPHY
[1] "AAA Gas Prices." AAA Gas Prices. N.p., n.d. Web. 10 Apr. 2017. <http://gasprices.aaa.com/?state=CA>. [2] Administrator, NASA. "World's Largest Vacuum Chamber." NASA. NASA, 20 Mar. 2015. Web. 10 Apr. 2017.
<https://www.nasa.gov/multimedia/imagegallery/image_feature_1281.html>. [3] "Aerospace Valley." Aerospace Valley. N.p., n.d. Web. 10 Apr. 2017. <http://www.aerospace-valley.com/en>. [4] An artist’s impression of what a Hyperloop station would look like. Digital image. Courier Mail. N.p., n.d.
Web. 12 Feb. 2017. <http://www.couriermail.com.au/news/queensland/hyperloop-technology-could-revolutionise-transport-in-australia/news-story/>.
[5] Buhr, Sarah. "Hyperloop Transportation Technologies Claims More than $100 Million in Total investment."
TechCrunch. TechCrunch, 01 Dec. 2016. Web. 10 Apr. 2017. <https://techcrunch.com/2016/12/01/hyperloop-transportation-technologies-claims-more-than-100-million-in-total-investment/>.
[6] Digital image. Erolkalkan. N.p., n.d. Web. 10 Apr. 2017.
<http://erolkalkan.com/Research/California/img12.png>. [7] Digital image. N.p., n.d. Web. 10 Apr. 2017. <http://www.metro-
magazine.com/news/photos/719616/hyperloop-transportation-tech-to-explore-czech-republic-links/53596>. [8] "Domestic Airline Consumer Airfare Report (PDF)." Department of Transportation. United States Department
of Transportation, 11 June 2015. Web. 10 Apr. 2017. <https://www.transportation.gov/office-policy/aviation-policy/domestic-airline-consumer-airfare-report-pdf>.
[9] "Earthquake Statistics." U.S. Geological Survey. N.p., n.d. Web. 10 Apr. 2017.
<https://earthquake.usgs.gov/earthquakes/browse/stats.php>. [10] "Fact Sheet And FAQs." Hyperloop One. N.p., n.d. Web. 10 Apr. 2017. <https://hyperloop-one.com/fact-
sheet-and-faqs>. [11] "Google Flights." Google Flights. N.p., n.d. Web. 10 Apr. 2017.
<https://www.google.com/flights/#search;f=CGK,HLP;t=JOG;d=2017-04-11;tt=o;q=Jakarta+to+Yogyakarta>. [12] Hawkins, Andrew J. "Hyperloop Track Construction in California Is Delayed." The Verge. The Verge, 06
Sept. 2016. Web. 10 Apr. 2017. <http://www.theverge.com/2016/9/6/12814238/hyperloop-transportation-quay-valley-permit-construction-delay>.
[13] "High Speed Rail Line in the United States: A Feasibility Study." High Speed Rail Line in the United States: A
Feasibility Study (n.d.): n. pag. Web. 10 Apr. 2017. <http://franke.uchicago.edu/energy2013/group2/group2.pdf>.
[14] "The History of Interstate Highways in California." California Department of Transportation. N.p., n.d. Web.
10 Apr. 2017. <http://www.dot.ca.gov/interstate/CAinterstates.htm>. [15] "How to Get to Yogyakarta." Travelfish. N.p., n.d. Web. 10 Apr. 2017.
<https://www.travelfish.org/transport/indonesia/java/yogyakarta_special_region/yogyakarta/all>. [16] The Hyperloop: Busted! N.p., n.d. Web. 2 Apr. 2017.
<https://www.youtube.com/watch?v=RNFesa01llk&list=PLaErCfQhIeiRh2xc6cQOnM74FbzKz5JgS>.
63 [17] "Hyperloop Transportation Technologies | HTT." Hyperloop Transportation Technologies | HTT. N.p., 08
Mar. 2017. Web. 10 Apr. 2017. <http://hyperloop.global/brno-czech-republic/>. [18] Hyperloop Tube. Digital image. N.p., n.d. Web. 13 Feb. 2017. <https://coloradohyperloop.com/hyperloop-
tech/>. [19] Konrad, Alex. "Leaked Hyperloop One Docs Reveal The Startup Thirsty For Cash As Costs Will Stretch Into
Billions." Forbes. Forbes Magazine, 18 Nov. 2016. Web. 10 Apr. 2017. <https://www.forbes.com/sites/alexkonrad/2016/10/25/hyperloop-one-seeks-new-cash-amid-high-costs/#14af20ee125c>.
[20] Korosec, Kirsten. "What Hyperloop Will Cost-and save People in Sweden and Finland." Fortune.com.
Fortune, 06 July 2016. Web. 10 Apr. 2017. <http://fortune.com/2016/07/06/hyperloop-helsinki-stockholm/>. [21] [email protected]. "Domestic Travel Market Report 2015." U.S. Travel Association. N.p., 26 Aug. 2016.
Web. 10 Apr. 2017. <https://www.ustravel.org/research/domestic-travel-market-report-2015>. [22] Muoio, Danielle. "Here's How Hyperloop One's Massive, High-speed Transport System Will Work." Business
Insider. Business Insider, 20 Feb. 2017. Web. 10 Apr. 2017. <http://www.businessinsider.com/hyperloop-one-plan-photos-2017-2/#here-we-begin-the-breakdown-of-hyperloop-ones-concept-for-the-system-first-passengers-will-use-an-app-to-see-their-transportation-options-that-day-2>.
[23] Musk, Elon. "Hyperloop Alpha." SpaceX.com. SpaceX, n.d. Web. 2 Feb. 2017.
<http://www.spacex.com/sites/spacex/files/hyperloop_alpha.pdf>. [24] "News - Hyperloop Transportation Technologies | HTT | HyperloopTT." Hyperloop Transportation
Technologies | HTT. N.p., n.d. Web. 10 Apr. 2017. <http://hyperloop.global/news/>. [25] "Pre-feasibility Study Stockholm – Helsinki Using HyperloopOne Technology." (n.d.): n. pag. Kpmg.com.
KPMG. Web. 10 Apr. 2017. <https://home.kpmg.com/content/dam/kpmg/pdf/2016/07/fs-links-pre-feasibility-study-summary.pdf>.
[26] "Scientist Lays Out 5 Huge Problems With Elon Musk’s Hyperloop [VIDEO]." The Daily Caller. N.p., n.d.
Web. 10 Apr. 2017. <http://dailycaller.com/2016/07/26/scientist-lays-out-5-huge-problems-with-elon-musks-hyperloop-video/>.
[27] Staff, Time Out Dubai. "Hyperloop One Route from Dubai to Abu Dhabi Revealed." Time Out Dubai. N.p., 26
Oct. 2016. Web. 10 Apr. 2017. <http://www.timeoutdubai.com/aroundtown/news/74159-hyperloop-one-route-from-dubai-to-abu-dhabi-revealed>.
[28] Thermal Expansion Coefficient. Digital image. Hyper Physics. N.p., n.d. Web. 10 Apr. 2017.
<http://hyperphysics.phy-astr.gsu.edu/hbase/Tables/thexp.html>. [29] "Too Little Freight, Too Much Space." The Economist. The Economist Newspaper, 19 Mar. 2016. Web. 10
Apr. 2017. <http://www.economist.com/news/business/21695013-overcapacity-hits-another-part-transport-industry-too-little-freight-too-much-space>.
[30] Walker, Alissa. "Here's What the First Full-Scale Test of the Hyperloop Will Look Like." Gizmodo.
Gizmodo.com, 10 May 2016. Web. 10 Apr. 2017. <http://gizmodo.com/heres-what-tomorrows-first-full-scale-test-of-the-hyper-1775857086>.
[31] Woolf, Nicky. "Hyperloop One Tests High-speed Transport Propulsion System." The Guardian. Guardian
News and Media, 12 May 2016. Web. 10 Apr. 2017. <https://www.theguardian.com/technology/2016/may/11/hyperloop-supersonic-train-test-propulsion-system>.
ACADEMIC VITA