gurufocus user manual: stock ideas from gurus and … picks, i.e., list just the new guru buys....
TRANSCRIPT

1
GuruFocus User Manual: Stock Ideas
from Gurus and Insiders
2
Contents:
1. Introduction to Gurus
a. What is a guru?
b. Guru Data Coverage
2. Sample Guru Page: Warren Buffett
a. Page Layout
b. The tabs
c. The “Current Portfolio” tab
3. Latest Guru Picks and Real-time Picks
a. Latest Guru Picks
b. Real-time Picks
4. Creating Personalized Guru Lists
5. The Aggregated Portfolio
a. Setting up the portfolio
b. Interpreting the output
c. Filters
6. Miscellaneous Guru Features
a. Guru Portfolio Overview
b. Top 10 Holdings view and the Scoreboard
c. Sector Picks
d. International Picks
e. Consensus Picks
f. Guru Bargains
g. Industry and Geographic trends
h. ETFs, Options and European Shorting
7. Insiders
a. Introduction
b. CEO and CFO buys and sells
c. Cluster buys, double buys and triple buys
d. Canadian and Dutch insider buys
e. Insider trends
8. FAQs
a. Questions about membership benefits
b. Questions about gurus and guru features
c. Questions about insiders

3
1. Introduction to Gurus
As the company name suggests, GuruFocus focuses on the investment actions of gurus, portfolio
managers that have strong long-term performance and net assets of over $1 billion. Our main
purpose is to track the portfolios of gurus and how their buys and sells create market insights.
This user manual details the most important features that GuruFocus provides on gurus and
insiders. The former group ranges from fund managers around the globe to Warren Buffett, one of
the most famous investors in the world. The latter group consists of “C-level” company managers,
the board of directors and other top company administrators.
What is a guru?
Merriam Webster defines a “guru” as someone with strong “intellectual guide” in a certain field. In
the investment world, gurus usually have the following characteristics:
Strong long-term performance
Over $1 billion in net assets
Low portfolio turnover
Portfolio managers that meet the above three criteria qualify for the “Guru Hall of Fame.” The list
includes Buffett and other famous investors like Carl Icahn, David Tepper and George Soros. Such
gurus offer strong market insights and stock ideas.
Guru Data Coverage
GuruFocus tracks the portfolios and stock picks of over 4000 institutional investors. However, the
number of gurus you can access depends on your membership. We will discuss this further in the
FAQ section.

4
2. Sample Guru Page: Warren Buffett
Before we can explore the cool features on gurus, we must first discuss the basics. Figure 1 displays a
sample guru page on Warren Buffett, one of the top investment gurus in the world.
Figure 1
On the left, the header contains key information about the guru: name, last update, number of stocks,
total value, number of new stocks, quarter-over-quarter turnover and the countries the guru primarily
invests in. The header also includes a visual “Flash Chart” that illustrates the guru’s top buys, top sells
and top holdings for the latest quarter. The Flash Chart contains market cap on the x-axis and price
change from average on the y-axis. For more information on the Flash Chart, please refer to the
following tutorial article.
Guru page tabs
The gray ribbon between the header and the “body” of the page contains five tabs: latest, stock picks,
current portfolio, profile/performance and sector weighting. (Buffett’s page has a sixth tab named
related guru trades.)
Latest: This tab lists the recent articles on the guru.
Stock picks: This tab lists the guru’s recent stock trades. By default, the stock trades are listed
newest to oldest by margin impact to portfolio DESC.
o As shown in Figure 1 above, you can view the Peter Lynch charts for Buffett’s stock
trades by clicking the “Charts” radio button where you see the word “View.”
o Click on the “XLS Download” button to download Buffett’s trades to Excel.
Current Portfolio: We will save this tab for last as this tab requires further discussion.
Profile/Performance: This tab discusses the guru’s profile, investing philosophy, historical asset
allocations, total holding history, book value performance and top ranked articles on the guru.

5
Sector Weighting: In this tab, you can view the historical allocation of the guru’s holdings by
sector. Click on a sector name to view the portfolio allocations for the industries in that sector.
You can then click on the desired industry to see the guru’s holdings within that industry. Note
that the active tab changes to “Current Portfolio” upon clicking the industry.
Guru’s current portfolio
By default, the Current Portfolio displays the guru’s holdings based on the latest quarter. The page
contains two sections: portfolio statistics and current holdings. The latter lists all company stocks that
are in the guru’s portfolio as of the latest quarterly 13F filing with the Securities and Exchange
Commission.
Figure 2 shows a sample Portfolio Statistics page. On the left, the page lists the portfolio date, number
of stocks, total portfolio value and number of new buys. The table on the right displays the portfolio’s
sector weightings and the sector impact due to stock trades in the latest quarter.
Figure 2
As discussed above, the “Current Portfolio” tab contains over 10 additional tabs, each providing
information about the guru’s stock picks.
Top Holdings: Click this tab to view the guru’s top 10 holdings for each of the past quarters. For
more information, please refer to the section on “Top 10 Holdings of Gurus.”
Valuations: For each of the guru’s holdings, this tab lists data on various price valuations: net
current asset value, Peter Lynch value, Graham number, tangible book, DCF earnings, median
price-sales, Yacktman forward rate of return and the Greenblatt earnings yield.
Undervalued: Click this tab to view the undervalued predictable companies in the guru’s
portfolio.
Low pe: Click this tab to view the companies with the lowest price-earnings ratios in the guru’s
portfolio.
Top Yield: Click this tab to view the companies with the highest dividend yields in the guru’s
portfolio.
Top Growth: Click this tab to view the companies with the highest 10-year EBITDA growth rate in
the guru’s portfolio.
High Quality: Click this tab to view the companies with the highest GuruFocus Business
Predictability Rank in the guru’s portfolio.

6
52w Lows: Click this tab to view the companies near 52-week lows in the guru’s portfolio.
Insider Buys: Click this tab to view insider buys for the past three months among stocks in the
guru’s portfolio. You can use this tab to look for double buys.
ETF: Click this tab to view exchange-traded funds in the guru’s portfolio.
Preferred: Click this tab to view preferred stock holdings in the guru’s portfolio.
International: Click this tab to view international stock holdings in the guru’s portfolio.
High Conviction: This tab lists the companies that the guru keeps buying over the past quarters.
The guru is likely bullish on these companies in the short term and possibly long term.

7
3. Latest Guru Picks and Real-time Picks
Let us start with two simple guru features: latest guru picks and real-time picks. These features,
including all features on gurus, are conveniently located under the “Gurus” tab as indicated in Figure
3.
Figure 3
The topmost item links you to the latest guru picks while the second item links you to real-time
picks. Figure 4.1 shows a screen shot for the latest guru picks page while Figure 4.2 shows a screen
shot for the real-time picks page.
Figure 4.1: Latest Guru Stock Picks
Figure 4.2: Real-time Stock Picks
8
We generally update the latest guru stock picks every quarter, when the investors file their 13F
report to the Securities and Exchange Commission. However, if a guru makes a trade in a company
that he owns over 5% of shares outstanding, the guru must report that transaction to the SEC in a
Schedule 13D filing within 10 business days. As these trades are updated within two weeks from the
transaction date, such picks are “real-time” picks.
Latest Guru Stock Picks
By default, the Latest Stock Picks page organizes the stock picks by gurus, as indicated by “Guru
View” in the gray ribbon below “Latest Guru Stock Picks.” You can view the stock picks as one
detailed list by clicking “Stock Picks View.”
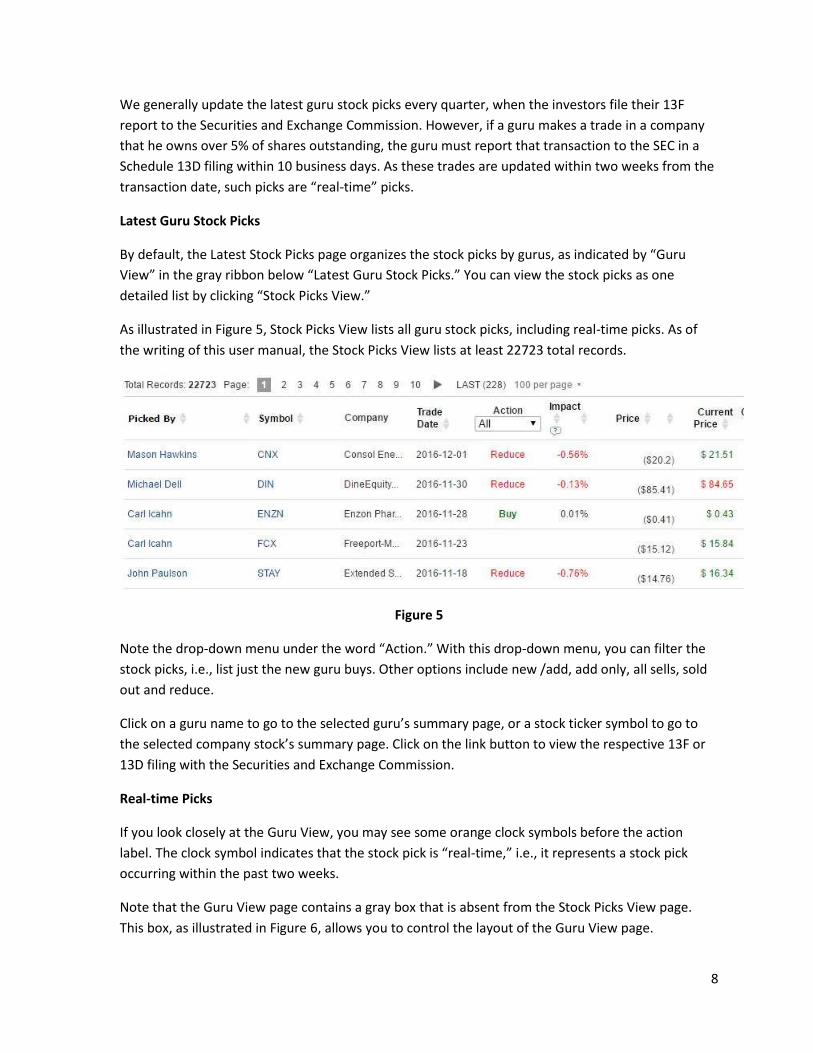
As illustrated in Figure 5, Stock Picks View lists all guru stock picks, including real-time picks. As of
the writing of this user manual, the Stock Picks View lists at least 22723 total records.
Figure 5
Note the drop-down menu under the word “Action.” With this drop-down menu, you can filter the
stock picks, i.e., list just the new guru buys. Other options include new /add, add only, all sells, sold
out and reduce.
Click on a guru name to go to the selected guru’s summary page, or a stock ticker symbol to go to
the selected company stock’s summary page. Click on the link button to view the respective 13F or
13D filing with the Securities and Exchange Commission.
Real-time Picks
If you look closely at the Guru View, you may see some orange clock symbols before the action
label. The clock symbol indicates that the stock pick is “real-time,” i.e., it represents a stock pick
occurring within the past two weeks.
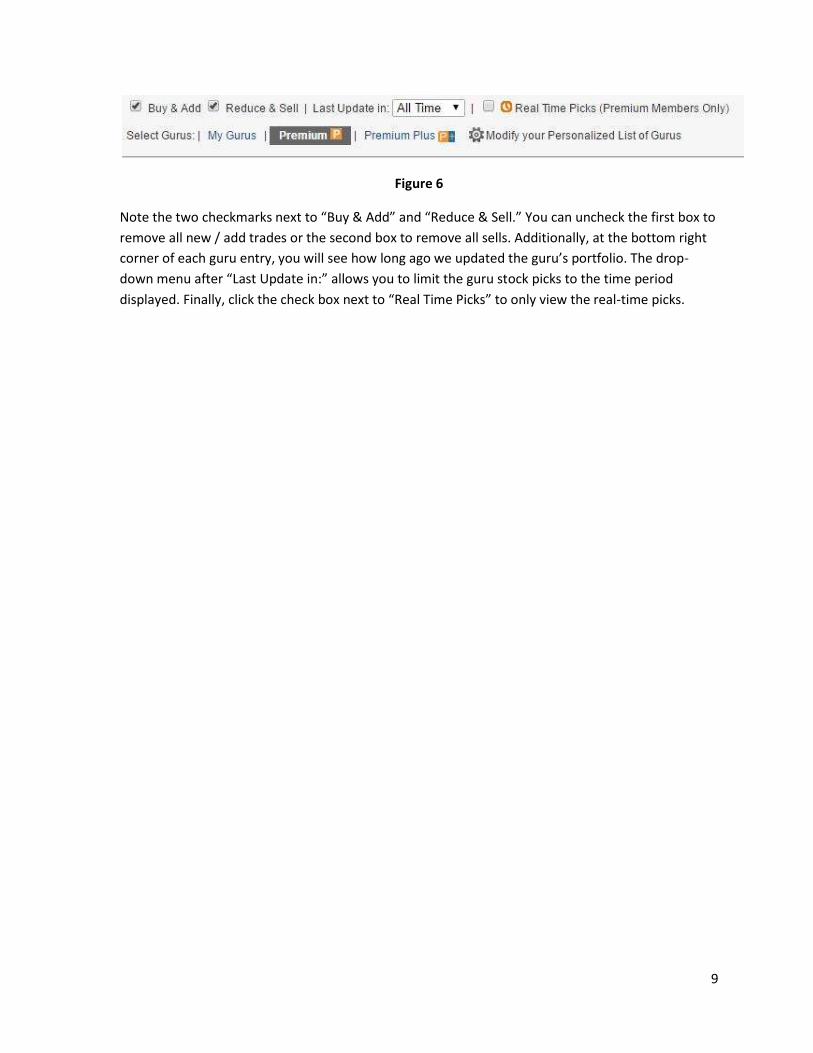
Note that the Guru View page contains a gray box that is absent from the Stock Picks View page.
This box, as illustrated in Figure 6, allows you to control the layout of the Guru View page.
9
Figure 6
Note the two checkmarks next to “Buy & Add” and “Reduce & Sell.” You can uncheck the first box to
remove all new / add trades or the second box to remove all sells. Additionally, at the bottom right
corner of each guru entry, you will see how long ago we updated the guru’s portfolio. The drop-
down menu after “Last Update in:” allows you to limit the guru stock picks to the time period
displayed. Finally, click the check box next to “Real Time Picks” to only view the real-time picks.

10
4. Creating personalized guru lists
Almost all of the guru features allow you to control which gurus should be displayed on the page.
Note the “Select Gurus” row, the bottom row from Figure 4, which contains the following items: my
gurus, premium gurus and premium plus gurus. The rightmost item contains a “gear” symbol and
the phrase, “Modify your Personalized List of Gurus.” When you click the rightmost item, you get
the pop-up screen as shown in Figure 7.
Figure 7
The “Personalize My Guru List” pop-up screen allows you to track the gurus you wish to follow. If
you want to follow a specific guru, you can type the guru’s name in the “Guru Name” search box, as
shown in Figure 8.

11
Figure 8
You can also search for gurus by country, last update, number of stocks, total value and turnover
ratio. To implement the former two filters, simply choose the desired item from the two drop-down
menus. The three “range bars” allow you to limit the gurus based on the latter three filters.
To add a guru to your “selected list,” click on the orange “>>” button. Click on the blue “<<” button
to remove the guru from the list. You can also add gurus by double-clicking the guru from the “Add
from this side” column, or remove gurus by double-clicking the guru from the “Selected gurus”
column.
The “List of Gurus (Personalize)” page
The “List of Gurus (Personalize)” page allows you to view the gurus in each of your groups. By
default, you will see the gurus listed in “My Gurus (Default Group).” Figure 9 shows a sample screen
shot of the List of Gurus page.

12
Figure 9
Note the gray ribbon at the top of Figure 9. You can change the group of gurus by clicking one of the
tabs:
Premium Gurus: Click this tab to view all the gurus available to Premium members.
Premium Plus Investors: Click this tab to view all 4000+ institutional investors who file 13F’s,
13D’s and 13G’s to the SEC. Note that only Premium Plus members can access this tab.
My Gurus (Default Group): Click this tab to view your default group of gurus. You can add or
remove gurus by clicking the “Add / Remove Gurus” link.
If you created any groups, you can access them by clicking on the tab with the desired
group’s name. These tabs are listed between the Default Group tab and the “+ New Group”
tab.
To create a new group, click on the “+ New Group” tab, type in the new group’s name in the
white box, and click the “Create” button.
o Once you create a new group, the new group is selected and the pop-up screen
from Figure 7 appears. Please add at least one guru to the new group before clicking
the blue “Finish” button. (The pop-up screen will reappear if you have no gurus in
the group.)
o You can change the group name by clicking “Change group name,” or you can delete
the group by clicking “Delete group.” The former allows you to type in the new
name, save the new name or cancel and revert to the existing name. The latter pops
up a dialog box asking you to confirm the delete. You will return to the default
group when you delete a customized group.
13
5. The Aggregated Portfolio
Once you select your “favorite” gurus with the “List of Gurus (Personalize)” feature, you can generate
the gurus’ aggregated portfolio. With the “Aggregated Portfolio,” you can analyze which company stocks
have the highest guru ownership and number of net guru buys (total guru buys minus total guru sells) in
the previous quarter.
Setting up the Aggregated Portfolio
By default, the “Aggregated Portfolio” page lists the aggregate portfolio of your default list of gurus.
Note the phrase, “N Gurus Selected. Their Aggregated Portfolio (Top 50):” below the blue “Show
Aggregated Portfolio” button. N represents the number of gurus in the “Selected Gurus” column. You
can change this number by adding and removing gurus from the “selected” list, as discussed in the
“personalized list of gurus” section below Figure 8.
Click on the “Select my gurus” drop-down menu to view your groups of gurus. You can choose which
guru list to display in the “selected gurus” column by clicking the desired group name. Clicking the gear
symbol takes you back to the “List of Gurus (Personalize)” page discussed in section 3 of this user
manual.
Interpreting the Aggregated Portfolio output
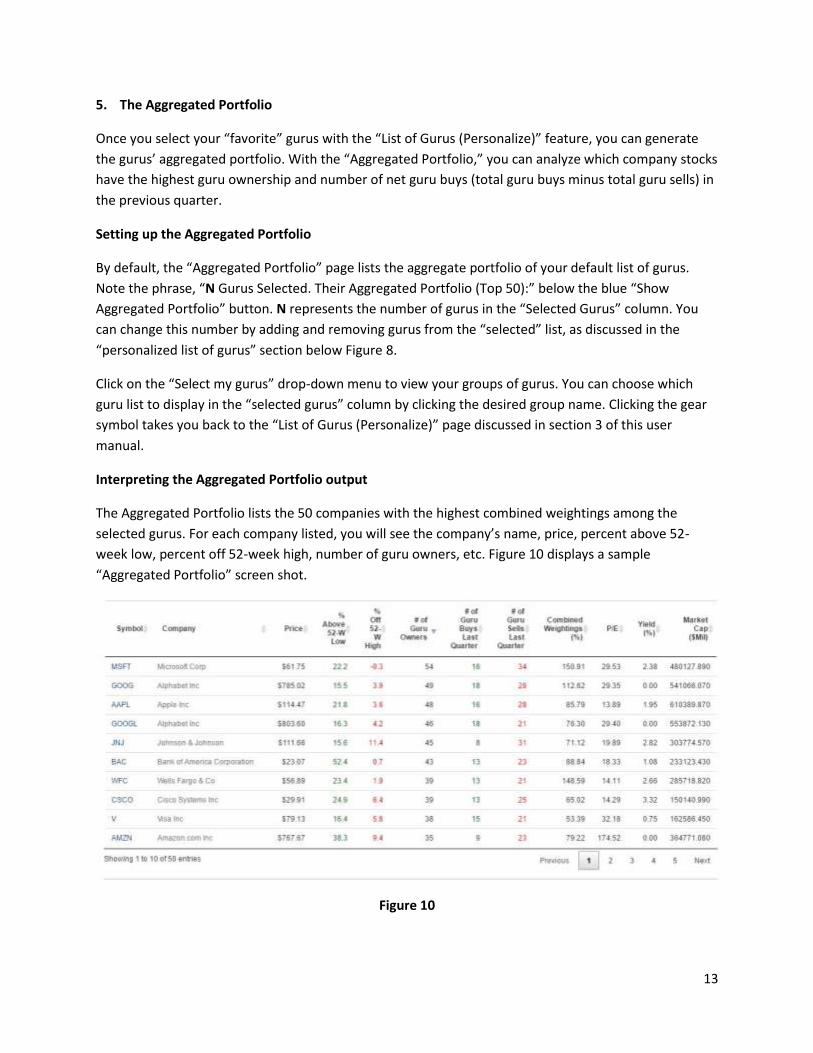
The Aggregated Portfolio lists the 50 companies with the highest combined weightings among the
selected gurus. For each company listed, you will see the company’s name, price, percent above 52-
week low, percent off 52-week high, number of guru owners, etc. Figure 10 displays a sample
“Aggregated Portfolio” screen shot.
Figure 10

14
You can sort the companies using the gray “up / down” arrows next to each of the column headings.
When you click on one of these arrows, the Aggregated Portfolio ranks the companies based on the
selected column, in ascending order. Click the same column to view the stocks based on that column in
descending order.
Applying filters to the Aggregated Portfolio
Note the Search bar on the upper-right corner of the Aggregated Portfolio. As you type in the Search
bar, the records only show the companies containing the letters typed in the search box. The Search bar
is helpful if you want to search for a particular company stock from the Aggregated Portfolio.
Below the “N Gurus Selected” phrase, you should see three drop-down menus titled All Countries, All
Market Cap and All Sectors. These filters allow you to control the 50 stocks listed in the Aggregated
Portfolio. For example, you can see the Aggregated Portfolio of the top 50 technology stocks, as
illustrated in Figure 11.
Figure 11
Finally, you can click on the buttons on the upper-left corner to either export the Aggregated Portfolio to
a CSV or Excel file, or print the Aggregated Portfolio. The following tutorial article provides a deeper
statistical analysis of the combined portfolio of all Premium gurus.

15
6. Miscellaneous Guru Features
The Gurus tab lists several other features we have on guru data, ranging from the Scoreboard and Top
10 Holdings to Sector Picks and International Picks. This section of the user manual will discuss each of
these features separately.
Guru Portfolio Overview
This page lists the portfolios of all the gurus that we cover on our website. The page lists the guru name,
portfolio name, fund type, 13D / 13G date, 13F / portfolio date, # of new stocks, total number of stocks,
10-year average return, quarter-to-quarter portfolio turnover and fund value. Figure 12 shows a screen
shot for the Guru Portfolio Overview page.
Figure 12
The Score Board of Gurus
By default, this page ranks the gurus based on their performances since the gurus’ latest 13F filing. The
page lists the top 10 gurus, but you can view the gurus 10 at a time by clicking on the page numbers.
Figure 13 shows a sample screen shot of the Scoreboard.

16
Figure 13
You can sort the gurus based on their performance for the following time periods:
Since latest 13F filing (default)
Six months since latest 13F filing
Twelve months since latest 13f Filing
One-year return
Five-year return
10-year return
Since fund inception
You can also sort the Scoreboard based on the period tracked, the fund tracked or the quarter over
quarter portfolio turnover.
Like the Aggregated Portfolio, you can download the Scoreboard to a CSV or Excel file, or print the
Scoreboard.
Top 10 Holdings of Gurus
As its name suggests, the Top 10 Holdings page lists the top 10 holdings of each of the gurus. By default,
the page lists the top 10 holdings of 25 gurus, but you can change the number of entries from 25 to 10,
50 or 100. However, you can easily find a specific guru’s top 10 holdings by typing the guru’s name in the
Search bar. Figure 14 shows a sample “Top 10 Holdings” screen shot.
Figure 14
At the bottom of the Top 10 Holdings page, you will see the top picked stocks and a link to the
Scoreboard of gurus. The following tutorial article provides a deeper understanding of the top 10
holdings feature.

17
Sector Picks
This page allows you to look for guru trades within your “circle of competence,” which is loosely defined
as your favorite sector. As directed by Figure 15, click on the name of the desired sector to view all the
guru trades for that sector within the past six months. You can then narrow the guru trades further
using the drop down menus to filter by country, market cap or industry within the sector selected, as
illustrated in Figure 16.
Figure 15
Figure 16
If you do not have a particular sector in mind, you can find the guru trades within a market cap range by
clicking the appropriate market cap category (small cap, mid cap, large cap, etc.), as shown in Figure 17.
Figure 17
18
The following tutorial article analyses the average Altman Z-score of each of the sectors.
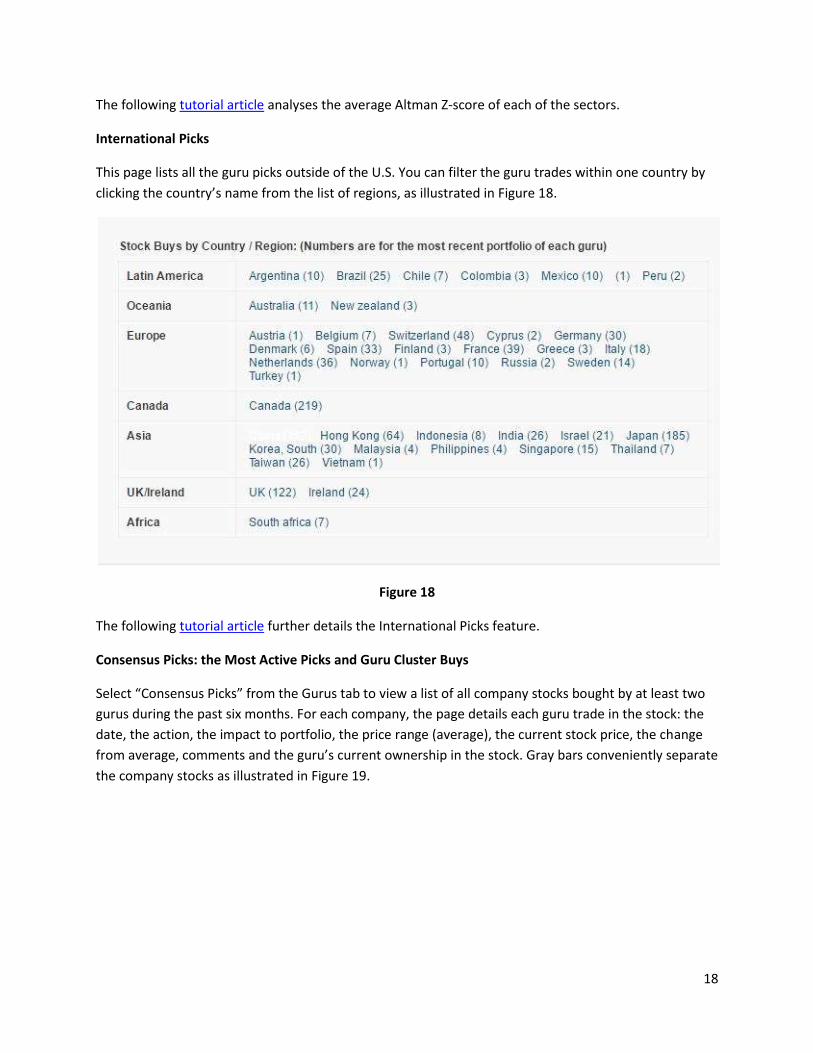
International Picks
This page lists all the guru picks outside of the U.S. You can filter the guru trades within one country by
clicking the country’s name from the list of regions, as illustrated in Figure 18.
Figure 18
The following tutorial article further details the International Picks feature.
Consensus Picks: the Most Active Picks and Guru Cluster Buys
Select “Consensus Picks” from the Gurus tab to view a list of all company stocks bought by at least two
gurus during the past six months. For each company, the page details each guru trade in the stock: the
date, the action, the impact to portfolio, the price range (average), the current stock price, the change
from average, comments and the guru’s current ownership in the stock. Gray bars conveniently separate
the company stocks as illustrated in Figure 19.

19
Figure 19
Clicking on the white space within an entry row displays the guru’s holding history in the stock. See
Figure 20 for an example.
Figure 20: The result of clicking the white space within the first entry of Figure 19
However, clicking on the ticker or the guru name will take you the company’s summary page or the
guru’s summary page, respectively.
20
Note the two drop-down menus at the top of the page. Use the first drop-down menu to list the
companies with at least two guru buys within a specific time period: three months, six months or 12
months. The second drop-down menu lists the companies with at least two guru sells within the
selected time period.
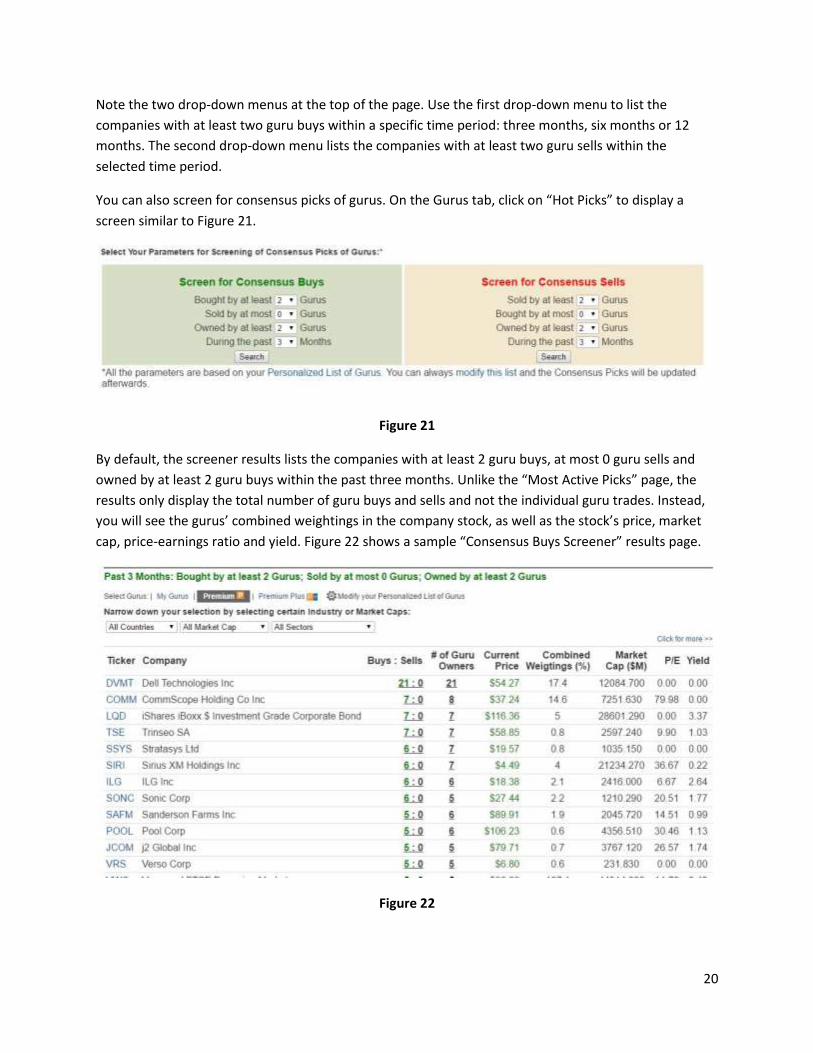
You can also screen for consensus picks of gurus. On the Gurus tab, click on “Hot Picks” to display a
screen similar to Figure 21.
Figure 21
By default, the screener results lists the companies with at least 2 guru buys, at most 0 guru sells and
owned by at least 2 guru buys within the past three months. Unlike the “Most Active Picks” page, the
results only display the total number of guru buys and sells and not the individual guru trades. Instead,
you will see the gurus’ combined weightings in the company stock, as well as the stock’s price, market
cap, price-earnings ratio and yield. Figure 22 shows a sample “Consensus Buys Screener” results page.
Figure 22

21
Note the three drop-down menus listed underneath the phrase, “Narrow down your selection by
selecting certain industry or market caps.” Like the phrase suggests, you can filter the screener results
by country, market cap or industry / sector. You can also limit the results to companies with at least a
number of buys, with at most b number of sells, or owned by at least c gurus, during the past t months.
Use the drop down menus within the green box to screen for consensus buys, or within the red box to
screen for consensus sells. Table 1 summarizes the parameters and the available inputs.
Parameter Screen for Consensus Buys Screen for Consensus Sells
a Bought by at least (1-10) gurus Sold by at least (1-10) gurus
b Sold by at most (1-10) gurus Bought by at most (1-10) gurus
c Owned by at least (1-10) gurus
t During the past (3, 6, 9 or 12) months
Table 1. Remark: (1-10) represents any whole number from 1 to 10.
Guru Bargains
This page lists all the company stocks bought by gurus that have a price change from average of less
than -10%. Such companies present good opportunities for investors since gurus are buying these
companies and investors can purchase shares in these companies at a cheaper price. By default, the
page sorts the companies by date, but you can easily sort the stocks by price range, current price or
price change from average by clicking the respective up / down arrows. Figure 23 shows a sample screen
shot of the “Guru Bargains” page.
Figure 23
Industry Trends and Geographic Trends
For each industry, we track the number of net buys, total buys and total sells, and summarize them on
the Industry Trends page. By default, the page ranks the industries with the highest number of net sells
at the top and the highest number of net buys at the bottom. Click on the column headings to sort the

22
industries in ABC order, or by decreasing number of total buys or total sells. Figure 22 shows a sample
screen shot of the Industry Trends page.
Figure 24
Click on the numbers to view a list of all gurus that made trades in the selected industry. For example,
clicking on the “-33” in the upper-left corner of Figure 24 leads to the screen shot in Figure 25.
Figure 25
As illustrated in Figure 25, the page lists each guru trade in the retail – apparel and specialty industry.
Each entry contains the guru name, the company and ticker, the action, the current price and price
range, trade impact to portfolio and latest-quarter shares. Click on the light-gray “<- Go back to Industry
trend” button to return to the Industry trend page.
You can also see the guru investment trends by countries. By default, the Geographic Trend page lists
the 10 countries with the highest total guru buys and a map of the world. Countries with darker blue
shades have the highest number of guru buys as illustrated in the map key in the lower-left corner.
Figure 26 shows a screen shot of the Geographic Trend page.

23
Figure 26
The table on the right (in Figure 26) lists the 10 countries with the highest number of guru buys. You can
also sort this table by number of net buys or by number of net sells. The Search bar at the upper-right
corner allows you to search guru trade data for a particular country.
To list all the guru trades within a country, click on that country on the map. You will then see a table
below the map listing the first 10 guru trades for that country, ranked by ticker symbol ASC. Figure 27
shows a sample screen shot of U.S. guru trades.
Figure 27
You can search for a particular company using the Search bar located in the upper-right corner of Figure
27. To change the number of entries per page, use the drop-down menu on the upper-left corner.
Exchange-traded funds, options and European shorting

24
The final three features on gurus list guru trades in ETFs and stock options, as well as short positions in
European companies.
Exchange-traded funds in gurus’ portfolios
Figure 28 shows a sample “ETFs in Gurus Portfolio” page, which reports the number of gurus who own
shares or made trades in each of the exchange-traded funds listed.
Figure 28
At the top of top of the ETF page, you should see a light-blue box similar to the one shown in Figure 29.
This box allows you to filter the ETFs based on category. The selected ETF category is bolded in black, as
shown in Figure 29.
Figure 29
Options in gurus’ portfolios
This page lists the put and call options that gurus hold in company stocks. As illustrated in Figure 30, the
page lists the ticker, the guru name, the option type, the portfolio date and the number of shares for
each option entry.

25
Figure 30
Hedge fund short positions in Europe
The “European Shorting” page lists the hedge funds that have net short positions in European stocks. As
shown in Figure 31, the page lists the guru’s net short position, transaction date, change in holdings,
trade price, current price and other basic company aspects for each company listed. While the page
shows 25 entries by default, you can change this number using the drop-down menu in the upper-left
corner. You can also search for a particular company using the Search bar in the upper-right corner.
Additionally, you can filter the list of companies by country, market cap or sector using the three drop-
down menus above the “Show n entries” drop-down menu.

26
Figure 31
Finally, we are done discussing about gurus! The next section of this user manual will discuss features
we have on insiders.

27
7. Introduction to Insiders
As Peter Lynch once claimed, insiders buy their company’s shares for one single reason: the company’s
stock price is expected to rise.
We define “insider” as a CEO, a chief financial officer, any “C-level” employee / director or any guru with
more than 10% ownership in a company stock. Insiders, unlike regular owners or even “5% owners,”
must report their transactions to the SEC within two business days, as mentioned in the Sarbanes-Oxley
Act of 2002.
As discussed in research articles, insiders usually engage in contrarian investing: selling more when
institutions have net buys while buying more when institutions have net sells. This user manual will
discuss insider trades through various perspectives, ranging from CEO buys to triple buys.
The Insider summary page
This page summarizes all insider trades occurring since 2008. However, you can filter the list of insider
trades by company, market cap, sector, number of shares, stocks within x% of (52-week, 3-year or 5-
year) low or real-time insider type (buy or sell). Figure 32 shows the list of filters.
Figure 32
28
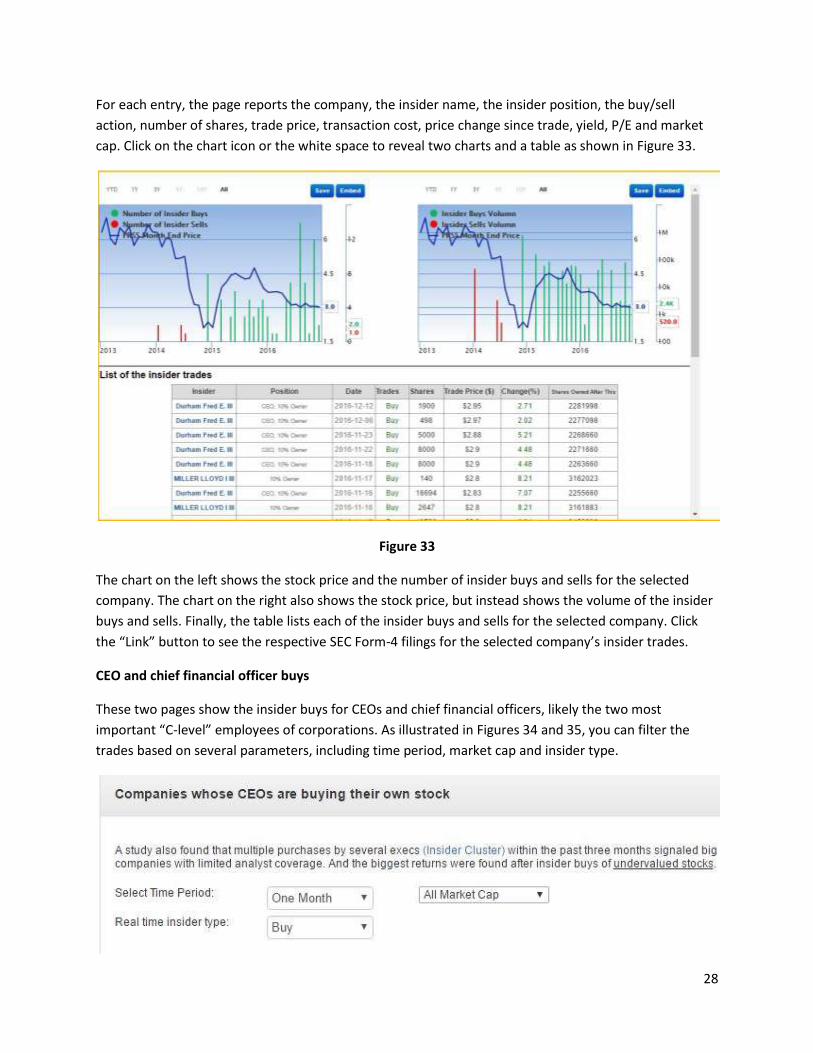
For each entry, the page reports the company, the insider name, the insider position, the buy/sell
action, number of shares, trade price, transaction cost, price change since trade, yield, P/E and market
cap. Click on the chart icon or the white space to reveal two charts and a table as shown in Figure 33.
Figure 33
The chart on the left shows the stock price and the number of insider buys and sells for the selected
company. The chart on the right also shows the stock price, but instead shows the volume of the insider
buys and sells. Finally, the table lists each of the insider buys and sells for the selected company. Click
the “Link” button to see the respective SEC Form-4 filings for the selected company’s insider trades.
CEO and chief financial officer buys
These two pages show the insider buys for CEOs and chief financial officers, likely the two most
important “C-level” employees of corporations. As illustrated in Figures 34 and 35, you can filter the
trades based on several parameters, including time period, market cap and insider type.

29
Figure 34
Figure 35
Insider cluster buys, double buys and triple buys
As discussed in a research article, a Citibank study observed that companies with multiple executives
buying their company stock signaled the potential for high short-term and long-term gains. Based on the
research, the best companies to invest in are usually the undervalued companies with high guru and
insider buys.
Double buys are stocks that gurus and insiders are buying. If a company also buys back its shares, the
company becomes a triple buy, like the fictional company mentioned in the movie “Money Monster.”
The following tutorial article further discusses double buys and triple buys.
The Insider Cluster Buys page offers a “Triple Buy Screener” allowing you to search for companies where
three parties are buying the company’s stock. As displayed in Figure 36, you can screen for triple buys by
selecting the desired values from the three drop-down menus.
Figure 36
Canadian and Dutch insider trades
These pages list all insider trades occurring in Canada and the Netherlands. The layout of these pages is
similar to that of the “Insider Summary” page, which lists all insider trades occurring in the U.S.
Insider trends
This page summarizes the historical trend of insider buys and sells within the U.S. We track the buy / sell
ratio of insiders, CEOs and CFOs for the Standard & Poor’s 500 index and for each of the market sectors.
These buy / sell ratio trends can highlight peaks and troughs of the U.S. stock market.

30
8. Gurus and Insider Stock Ideas: FAQs
We have received several questions about gurus and insiders over the past year, and we can finally
detail these questions in this user manual. The first question relates to which members have access to
each of the features we have on gurus. We summarize these membership benefits in Table 2.
Feature Premium
Plus Premium Basic
# of Gurus' portfolios available 4000+ 154 68
Latest guru picks / Real-time picks All guru
picks All premium guru picks
Quarterly picks only
The Scoreboard of gurus ✓ ✓ ✓
Consensus picks: most active picks ✓ ✓ ✓
Guru bargains ✓ ✓ ✓
Industry trends: aggregate trend of gurus ✓ ✓ ✓
Geographic trends ✓ ✓ ✓
Options holdings among gurus ✓ ✓ ✓
Top 10 holdings of gurus ✓ ✓
Sector picks ✓ ✓
International picks ✓ ✓
The aggregated portfolio of gurus ✓ ✓
Consensus picks: screen for hot buys and sells
✓ ✓
Industry trends: the list of guru buys / sells per industry
✓ ✓
Exchange-traded funds (ETFs) in gurus' portfolios
✓ ✓
European shorting: hedge-fund short positions in Europe
✓* ✓*
Insider trade summary ✓ ✓ ✓
Canadian and Dutch insider trades ✓* ✓*
CEO buys and sells ✓ ✓
Chief financial officer buys and sells ✓ ✓
Insider cluster buys ✓ ✓
Guru and insider double buys ✓ ✓
Triple buys ✓ ✓
Data exports to Excel ✓ ✓
Insider trends ✓ ✓
Table 2: Membership Levels. * requires subscription to the corresponding region

31
The two major observations about Table 2 include the # of gurus’ portfolios available and the latest guru
picks / real-time picks. Although we track portfolio data for over 4000 institutional investors who file
13F’s, only Premium Plus members have access to portfolio data on all institutional investors. Premium
members have access to portfolio data on the 68 gurus in the “Hall of Fame,” as well as data for about
90 others making their way to the prestigious list of gurus.
All registered GuruFocus users have access to our “Starter Package,” which includes portfolio data of the
68 gurus in the “Guru Hall of Fame,” as well as the features with a black check mark in Table 2. All other
features, including Sector Picks, Top 10 holdings and the Aggregated Portfolio require Premium
membership.
The “Starter Package” only includes the guru trades from quarterly portfolio updates. Other picks,
including real-time picks and insider trades require Premium membership.
One more note regarding the “Current Portfolio” tab: The “Starter Package” only gives access to the
“Portfolio” tab, which summarizes the guru’s latest holdings. You need a Premium membership to
access all other tabs under “Current Portfolio.”
You may sign up for a free seven-day trial of GuruFocus Premium membership using the following link:
https://www.gurufocus.com/membership/upgrade.php?ref=holding
FAQs regarding gurus and features on gurus
Where do you get your portfolio data from gurus?
o Although we normally get guru portfolio information from their 13F and Schedule 13D
filings with the SEC, some gurus, like Arnold Van Den Berg, email their portfolios directly
to us.
Can I view the past portfolios of gurus?
o Unless you are Premium member, you can only view the current portfolio, i.e., the
portfolio from the latest 13F filing.
o To view the past portfolio of a specific portfolio, first click on “Gurus Portfolio” from the
Gurus tab and select the desired guru (e.g. Warren Buffett) from the list. Make sure that
the “Current Portfolio” tab is selected, as illustrated in Figure 37.
o o Figure 37
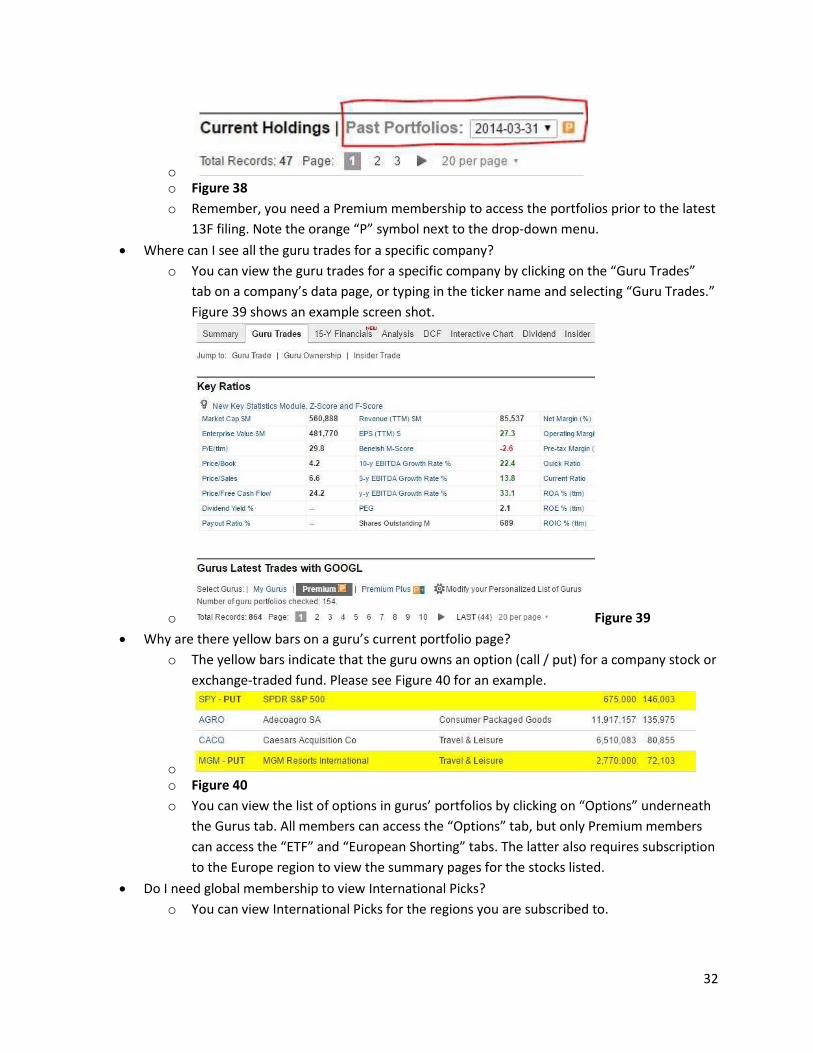
o You can view the 13F portfolio as of a specific date by selecting the desired date from
the drop-down menu next to “Past Portfolios.” See Figure 38.
32
o o Figure 38
o Remember, you need a Premium membership to access the portfolios prior to the latest
13F filing. Note the orange “P” symbol next to the drop-down menu.
Where can I see all the guru trades for a specific company?
o You can view the guru trades for a specific company by clicking on the “Guru Trades”
tab on a company’s data page, or typing in the ticker name and selecting “Guru Trades.”
Figure 39 shows an example screen shot.
o Figure 39
Why are there yellow bars on a guru’s current portfolio page?
o The yellow bars indicate that the guru owns an option (call / put) for a company stock or
exchange-traded fund. Please see Figure 40 for an example.
o o Figure 40
o You can view the list of options in gurus’ portfolios by clicking on “Options” underneath
the Gurus tab. All members can access the “Options” tab, but only Premium members
can access the “ETF” and “European Shorting” tabs. The latter also requires subscription
to the Europe region to view the summary pages for the stocks listed.
Do I need global membership to view International Picks?
o You can view International Picks for the regions you are subscribed to.

33
o To view a company’s financial summary pages, you need to subscribe to that company’s
region.
What is the difference between the two “Consensus Picks” features?
o If you click on “Consensus Picks,” you will see a list of most active picks during the
selected period. This feature is available to all members. Please see Page 19 for more
information on “most active picks.”
o Premium members can screen for consensus picks by clicking “Hot Picks.” Page 20
further discusses this feature.
On the “Current Portfolio” page, you show the sector weightings for the guru’s portfolio. Why
do you not show the portfolio weight for cash?
o As gurus do not report their cash weights in their 13F, we do not show portfolio weights
for cash.
Why is Peter Lynch not on the list of gurus?
o Although Peter Lynch would make a great investing guru, he has retired from his Fidelity
Magellan Fund as of the writing of this user manual.
o However, we have several value screens implementing Peter Lynch’s investing strategy,
including the Peter Lynch Growth screen.
Can I suggest gurus to the website?
o You can suggest gurus by clicking “Suggest a Guru” from the list of gurus page. We
always welcome your guru suggestions!
FAQs on insiders
Do you have insider trades for global companies?
o We have separate insider trade pages for Canadian and Dutch companies.
o To view the financial summary pages for these companies, you need to subscribe to the
Canada and Europe regions, respectively.