gurgaon-manesar urban complex - institute of indian...
TRANSCRIPT

Gurgaon-Manesar Urban Complex
Sheetal Sharma and Anjan Sen, Delhi
Abstract Central National Capital Region/Central NCR is one of the four policy zones of National Capital Region (NCR) as per its Regional Plan 2021. Central NCR is an ‘inter-state functional region’ pivoted upon the National Capital Territory of Delhi (NCT of Delhi), and is successor to the Delhi Metropolitan Area (DMA). It comprises six urban complexes or zones, four in Haryana (Sonipat-Kundli, Bahadurgarh, Gurgaon-Manesar, and Faridabad-Ballabhgarh) and two in Uttar Pradesh (NOIDA and Ghaziabad-Loni). The study presents the levels of development in terms of urban influence on settlements, and functional hierarchy of settlements, in the Gurgaon-Manesar urban complex of Central NCR. The present study is a micro-level study, where all 120 settlements (both urban and rural) comprising Gurgaon-Manesar urban complex of Central NCR, form part of the study. The study is based upon secondary data sources, available from Census of India; at settlement level (both town and village) for the decennial years 1981, 1991 and 2001. The paper determines the level of urban influence and functional hierarchy in each settlement, at these three points of time, and analyses the changes occurring among them. The study reveals the occurrence of intra-regional differentials in demographic characteristics and infrastructural facilities. The study also emphasis on issues of development in rural settlements and growth centers, in the emerging urban complex within Central NCR. The work evaluates the role of Haryana Urban Development Authority in the current planning processes of development and formulates suitable indicators for development.
IntroductionAs urban population is increasingly getting concentrated in the millennium cities (according to National Capital Region Planning Board). NCT of Delhi has been experiencing phenomenal growth of population during the 1951 to 2001 at a rate of 50 per cent and it has been receiving population through migrants from five major States: Uttar Pradesh, Bihar, Haryana, Rajasthan and Punjab. NCR Planning Board delineated the National Capital Region/NCR to prepare long-term plans. It has formulated
two plans, Regional Plan 2001 in January 1989, which proposed development of six Central NCR Towns: Ghaziabad-Loni and NOIDA in Uttar Pradesh; and Faridabad, Gurgaon, Bahadurgarh and Sonipat-Kundli in Haryana. In the continuation of first plan, second Regional Plan 2021 was formulated in 2005 comprising four development zones: NCT of Delhi; Central National Capital Region; Urban Corridors; and Rest of NCR. Central NCR comprises six contiguous urban complexes: Sonipat-Kundli in Sonipat, Bahadurgarh in Jhajjar, Gurgaon-Manesar
Trans.Inst.Indian GeographersISSN 0970-9851
134 | Transactions | Vol. 37, No. 1, 2015
in Gurgaon, Faridabad-Ballabhgarh in Faridabad district in Haryana; and NOIDA in Gautam Buddha Nagar, and Ghaziabad-Loni in Ghaziabad district in Uttar Pradesh. The Plan aims at promoting growth and balanced development with population re-distribution, population size, urban land use patterns, economic activities and infrastructural facilities, etc. Both the Plans were formulated to achieve the harmonious growth and development by decentralization of the economic activities and dispersal of services. In the plan 2001 Gurgaon-Manesar urban complex was known as a Delhi Metropolitan Area/DMA town which was demarcated by NCR Planning Board while Central NCR concept has been emerged from the Plan 2021. It has a great connectivity by National Highway-8, Delhi to Jaipur which passes through Gurgaon-Manesar. The present study deals with the existence of intra-regional differences in level of infrastructural facilities, role of Haryana Urban Development Authority/ HUDA in the current planning processes and formulates suitable indicators for development.
Objectives1. To evaluate role of HUDA in the current
planning processes of development; and 2. To formulate suitable indicators to
measure urban influence and functional hierarchy;
The Study AreaThe principal focus of the work is to identify the development pattern in Gurgaon-Manesar urban complex. It comprises 120 settlements, of which 5 are urban and 115 are rural units. Gurgaon is a corruption of Guru
Gram that is village of spiritual leader. The traditional account is that Yudhishtira, the eldest of the Pandavas, gave this village to his guru Dronacharya, in whose memory a tank still exists on the west side of the road to the railway station. Gurgaon district is one of the southern districts of Haryana State and named after its headquarters town Gurgaon. The city is at a distance of 32 kilometers from NCT of Delhi on Delhi-Jaipur highway (National Highway-8) and Delhi-Bikaner railway. It lies between 28053’ north of latitude and 75035’ east longitude. It is known as automobile industries, modern commercial malls, towers of cyber parks, and software development and situated NH-8 only at a distance of 4 kilometers from the Indira-Gandhi International Air Port is well linked with all capitals of the world through airways. The name of the town emerged in 1972 when world fame Maruti industry was set up in Gurgaon with the collaboration of Suzuki Company of Japan. It has over a period acquired the image of an industrial town and assumed significance in view of its location within NCR and close proximity of NCT of Delhi. Over the last twenty years, the city has attained cosmopolitan outlook with the development of posh residential colonies, multiplexes, shopping malls and entry of large number of multinational companies involved in IT and BPO’s industries. Industrial activity here is well planned and other surrounding residential sectors being developed by HUDA as well as by the private colonizers have remained pollution free. The district has sub-tropical continental monsoon climate. The rainfall is comparatively satisfactory in relation to western parts of Haryana where it is mainly concentrated during monsoon. Hot summer, cool winter and unreliable rainfall are the

Transactions | Vol. 37, No. 1, 2015 | 135
peculiarity of the district, which is close to Rajasthan State. Gurgaon is a rolling plain dominated by the extensions of Aravallis. These rocks are one of the oldest mountain systems of the world. The district has light soils particularly the relatively sandy loam,
medium soils particularly light loams (Seoti) and loam (Bhangar and Nardak), coarse loam (Dahar and Choeknote) and rocky surfaces. Underground water level is relatively high in the district. Water level under their rocky surface is quite deep.
Map 1: Location of Study Area: Gurgaon-Manesar Urban Complex

136 | Transactions | Vol. 37, No. 1, 2015
Data Sources and Research MethodologyFew methodological steps are followed during the work: Delineation of the Study Area: to delineate the area, 2001 census village boundaries are considered for the base map. To collect and evaluate the ground realities some relevant information, informal discussions with the Sarpanch and villagers were also organized in groups to understand their perception of development. Identification of Indicators and Variables: total 20 indicators are framed and computation of data has been made at four categories: land under non-agricultural uses; population and its characteristics;
infrastructural facilities and amenities; urban influence on settlements and functional hierarchy of settlements. Data Sources: it is a spatio-temporal study and relevant data for all 120 settlements has been collected through district census handbooks of Guraon for the period of 1981 to 2001 (for some indicators 1971 to 2001). Information associated with the levels of development in the complex is collected from the NCR Planning Board report 2005 and Town and Country Planning Board repot 2007. Analysis of Data: collected data has been tabulated and processed under four categories: land under non-agricultural
Figure 1: Indicators: To fulfill the objectives total twenty indicators are selected.
Source: Computed by the authors.

Transactions | Vol. 37, No. 1, 2015 | 137
uses; demographic profile; infrastructural facilities; urban influence on settlements and functional hierarchy of settlements. In order to formulate a composite index Location Quotient / LQ technique is used and average values are represented. Urban Influence on settlements: CI = ∑LQ/ N (where, ∑LQ is sum of all Location Quotient; and N is total number of indicators). Functional Hierarchy of settlements: CI = ∑WF/N (where, ∑ WF is sum of Weighted Functions; and N is total number of indicators). Representation and interpretation of Data: AutoCAD and Arc View GIS software are used to prepare maps (choropleth technique). Results have been represented with the help of simple statistical methods (mean, percentage) and results have been interpreted.
Land use Pattern in Gurgaon-Manesar 1. Role of HUDA: The urban pull and rural
push factors have significantly changed the socio-economic values of landowners. Displacing primary activities, the land uses are shifting from agricultural to non-agricultural activities. The urban settlements at the centre acting as a core are attracting secondary and tertiary activities from surrounding peripheral settlements resulting in changes in economic activities. The principal government stakeholders are playing important role in this development process such as, Town and Country Planning Departments, Industrial Development Corporations, and Housing Boards of Haryana and housing sectors. The NCR Planning Board, Town and Country Planning Organization, and District planning authorities have identified 17 major land use types. For the present work the land uses have been further re-grouped into 8 major categories (Table 1).
Table 1: Proposed Land Uses in Gurgaon-Manesar Urban Complex, 2011
S. No. Existing Land Uses Area in hectare1 Residential 6,2432 Commercial 2203 Industrial 1,3494 Public/Semi-Public 3025 Park, Open Space, Recreation including Green Belt 3636 Transport & Communication 6657 Public Utilities --8 Other 739
Total 9,881
Source: NCR Regional Plan 2021.

138 | Transactions | Vol. 37, No. 1, 2015
Data reveals that Residential land use shows a mixed character of both planned and unplanned growth in the urban complex. The residential areas of inner zones have the oldest settled parts. Some distinct cultural barriers like railway tracks in the some parts of the urban zones have restricted the growth of urban complex and the area is thus fully built-up. With the extension of municipal limits, a number of villages have also been incorporated in the urban sectors. The built-up area bears an imprint of the typical rural character of unplanned growth with high population density, and these villages are known as urban villages with unplanned residential land uses while, residential colonies lies under planned land uses, built by development authorities. The existing area lies along NH-8 with a total area of 9,881 hectare. Out of total 63.18 per cent is reserved for residential. More emphasize is given to the private developers, though, over 45 private players are involved, three companies, DLF, Ansals and Unitech are dominating. Under Commercial land use 2.22 per cent of the total area is reserved, which serves as an important service centre. The city centre is naturally full of commercial activities which decrease towards the periphery. Business activities narrow down from thickly populated and continuous built-up area in the city centre to isolated patches towards the margins. A city centre in Sector 29 covering 480 acres of land has been planned.
In Industrial land Use Phase-I, industries developed and pushed in and around the NCT of Delhi. Under this the complex has
acquired 13.65 per cent land of the total area. The area along the railway line is proposed for light industrial units, while the rest is reserved for large and medium industries. Land under Transportation and Communication Network in terms of its management in megacities has become a big challenge owing to rapid rise in urban population. The problem is emerging due to the poor planning and management in urban sectors. Here, 10.08 per cent of the area is reserved for transportation purpose. Other Land Uses includes the rest uses of land uses in the complex. Land under public utility was 30.78 hectares, which was completely developed in the earlier plan; and in the 2021 Plan, the area has been increased to 115 hectares. Due to the provision of 100 meters wide green belt on both sides of proposed bye-pass, the overall density has been worked out to 77 persons per hectare. Total 5 settlements have been identified by the development authorities named Gurgaon City V, Gurgaon Rural C.T. VI, Dundahera C.T. IV, Sukhrali C.T. VII, and Jharsa O.G. are come under these land uses in Gurgaon-Manesar urban complex.
2. Land Use Pattern under Different Categories: Land use pattern has been collected under four different categories: un-irrigated land, irrigated land, culturable waste land, and area not available for cultivation (Census classification). There are no forests or permanent pastures in the zone. There is a strong correlation between land use pattern and development process during 1981 to 2001, which is clearly visualized in the changes in land use pattern.

Transactions | Vol. 37, No. 1, 2015 | 139
The complex comprises 120 settlements spread over an area of 58,002 hectare or 24.92 per cent of the total area. Data is grouped into three major categories namely agricultural land, culturable waste land and land not-available for cultivation during 1981-2001 (Table 2). Data reveals that out of 58,002 hectare, 78 per cent was under agricultural land, followed by 15 per cent land not-available for cultivation, and 7 per cent under culturable waste land. In continuation of 1981, in 1991, 69 per cent was agricultural land, followed by 27 per cent land not-available for cultivation and 5 per cent under culturable waste land. In 2001, out of total 62.58 per cent agricultural land, followed by 33.64 per cent land not-available for cultivation and 3.78 per cent culturable waste land. Thus, agricultural land is declining every year.
3. Land under Non-Agricultural Uses: This highlights a very critical issue in a primarily agrarian economy that is gifted by fertile agricultural setting. The poor cultivators are becoming landless and unemployed due to a shift in land-use from agricultural to non-agricultural. Rural population pushes to the urban settlements for searching better job opportunities, for
example higher educated persons come in search of better services while others in search of business, etc. Due to high rents for accommodation, they prefer to live outside the city, yet would like to be very close to the town. Thus, in the periphery, people are shifting from agricultural to non agricultural occupations and land-uses. NH-8 is the central nerve of business and commerce in the complex. Here non-agricultural land uses represent the level of urban development and urbanizing characteristics.
Land under Non-Agricultural Uses = NA/ A (The result figures are expressed in percentage)
Where; NA = Area ‘not available for cultivation’ in the settlement; A = Total area of the settlement.Data reveals that land not-available for cultivation in the complex is increasing, out of 58,002 hectare; 8,815 hectare or 16 per cent of land was not-available for cultivation is in 1981, which increased to 15,535 hectare or 27 per cent in 1991 and 20,422 hectare or 35 per cent in 2001. It is visualized that proportion of land not-available for cultivation is increasing in the complex.
Table 2: Land Use Pattern in Gurgaon-Manesar Urban Complex, 1981-2001
Sl. No. Gurgaon-Manesar ZoneLand Use in hectare (%)
1981 1991 2001
1 Not-Available for Cultivation 8,815 (15.20) 15,535 (26.78) 20,422 (35.21)2 Culturable Waste Land 3,928 (6.77) 2,608 (4.50) 1,434 (2.47)3 Agricultural Land 45,259 (78.03) 39,859 (68.72) 36,145 (62.32)
Total 58,002 (100) 58,002 (100) 58,002 (100)
Source: Computed, District Census hand books, 1981-2001.

140 | Transactions | Vol. 37, No. 1, 2015
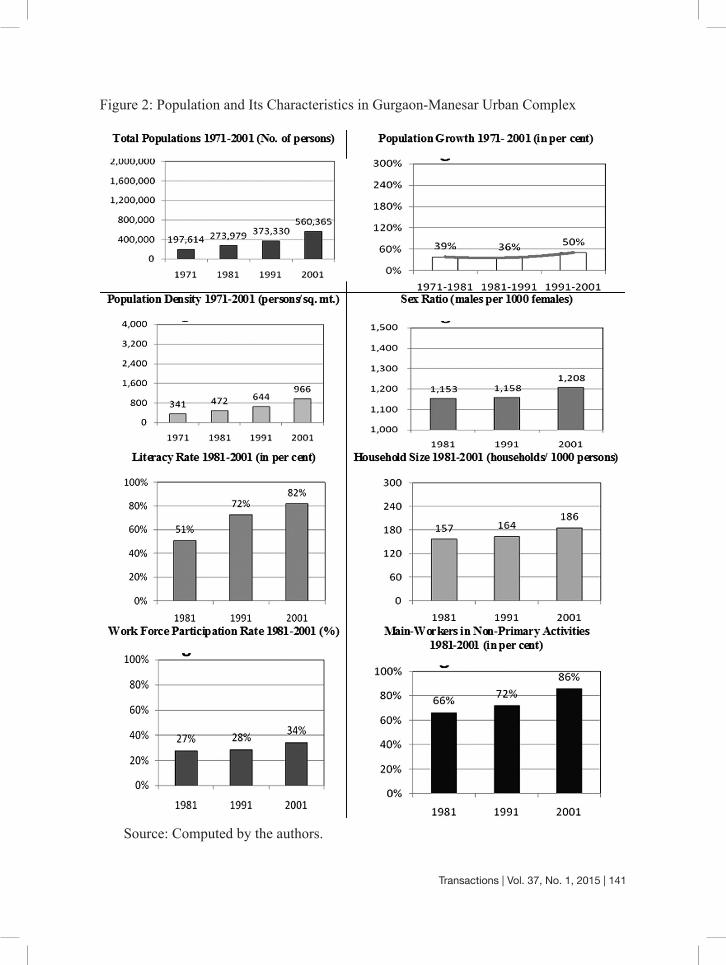
Population and its CharacteristicsThe present section deals with population characteristics in the complex. Population size means total population of the settlements. The nature of economic activities is directly influence the total population with its population hierarchy through the available resources and economic interchange. Apart from 5 urban units 115 rural settlements are predominantly agricultural whereas most of the population prefers to live in and around the urban sectors. In 1971 high population size was associated with the large area and low with the small area of the settlement and the trend was continuing in 1981. It was increased in 2001 with 4,670 persons per unit. Population growth is calculated by total population of the previous year subtracted by total population of the present year and represented by per cent. Here, the IT sector is at the next step in this hierarchy with the decreased population growth from 39 per cent in 1971-81 to 36 per cent in 1981-91 and again increased by 50 per cent in 1991-2001. Population density is calculated by total population divided by the total area of the settlement and represented by persons per square kilometer. In 2001 high density was associated with corridor and in the periphery of city because of well connectivity with NCT of Delhi and job opportunities in the sector. Sex-ratio is generally calculated by the number of females per thousand males but for the present work it is calculated
by number of males per thousand females because of the high rate of male migration from rural settlement to urban settlement for better employment and education purpose. It is revealed from the data analysis that the complex had recorded 1,153 in 1981 it is increased by 1,158 in 2001 and reached at 1,208 in 2001. Literacy rate is calculated by total literates (excluded 0-6 age group) of the settlement divided by total population of the same settlement and represented by per cent. Literacy rate has been increased in all the settlements. Data depicts that 82 per cent literacy rate in 2001 whereas 51 per cent in 1981 and 72 per cent in 1991. Household size is calculated by total population divided by total households of the settlement represented by households per 1000 persons. Here, with 186 households per thousand persons are at the next step and figure was 157 in 1981 and 164 in 1991. Work force participation rate is calculated by total workers of the settlement (sum of total main workers and total marginal workers) divided by total population of same settlement and it is represented by per cent. In 1981 the proportion was 27 per cent it was increased by 28 per cent in 1991 and increased 34 per cent in 2001. Main workers in non-primary activities is calculated by total main workers in secondary and tertiary in the settlement divided by total main workers and represented by per cent. It was 66 per cent in 1981; 72 per cent in 1991 and increased by 86 per cent in 2001.
Transactions | Vol. 37, No. 1, 2015 | 141
Source: Computed by the authors.
Figure 2: Population and Its Characteristics in Gurgaon-Manesar Urban Complex

142 | Transactions | Vol. 37, No. 1, 2015
Urban Influence on SettlementsData reveals that number of settlements under high influence has been increased by 6 (1981) to 8 (1991). The number of settlements with high composite index (average LQ above 1.0) was 23 in 2001. Data depicts that total number of settlements under the high influence are increasing with the rising level of development is as follows: High developed settlements: total 6 settlements in 1981 have been increased to 23 settlements in 2001. It could be stated that all the settlements under this section have highly developed socio-economic profile and urban land use pattern. Medium developed settlements: total 52 settlements in 1981 are counted and total number has been decreased with 51 in 2001. It could be stated that these settlements are considered as under developed with great potential to develop with urban land use pattern. Thus, the special attention should be paid to the settlements would bring them up to a proper development level. Low developed settlements: This group includes those settlements have very less development level in all aspects and 60 settlements are found under this in 1981. Total number has been decreased with 44 settlements in 2001. Thus, it could be stated that they have poor socio-economic profile with rural land use pattern. Thus, the special attention should be paid to develop all the settlements in this group would bring them up to a proper development level.
Infrastructural Facilities And Amenities: The availability of infrastructural facilities and amenities to some extent reflects the socio-economic level and potential of the settlement. They increase productivity and efficiency, and provide comfort and welfare, thereby reducing physical and mental stress. It is essential that various development plans support the need and importance of these facilities. Variations in the development of infrastructural facilities are the root of overall imbalance in the economy, resulting in inter-state metropolitan regional disparities. In order to strengthen the economically depressed settlements, the government supports infrastructure which indirectly attracts industries to develop in the particular region. During the early 1970’s, many settlements in the complex have been provided some basic amenities leading to the development of place and prosperity in terms of infrastructural facilities. The level of transformation occurring process in the region is visualized through the changing demographic profile and land use pattern in the region. To fulfill the objective of the work total nine infrastructural facilities are selected and given the weights such as 1, 2, 3, 4 and 5 according to the availability with the status of amenities in each settlement during 1981 to 2001. Weighted index have been calculated to all nine functions for each settlement. Higher the hierarchy shows the high level of development and lower the hierarchy represents the low level of development.

Transactions | Vol. 37, No. 1, 2015 | 143
Table: Weights to Infrastructural Facilities and Amenities
Facilities Category Weights
I. Education
1.Primary School2.Secondary School3.High School4.Higher Secondary School and Pre university College5.UG College; Industrial & Training School (ITI)
12345
II. Medical
1. Primary health sub centre, Village health guide2. Primary health centre, Subsidized private Practitioner3. Maternity and Child Welfare Centre, Maternity Home, Child
Welfare Centre, Health Centre, Registered Private Practitioner4. Dispensary, Family Planning Centre, T.B. Clinic, Nursing Home5. Hospital
123
45
III. Drinking Water Supply
1.River water, Fountain, Canal, Lake2.Spring and Tank Water3.Well4.Tube Well, Hand Pump5.Tap Water
12345
IV. Power Supply
1. Electricity for Domestic Purposes2. Electricity for Agricultural Purposes3. Electricity for Commercial Purposes4. Electricity for Industrial Purposes5. Electricity for All Purposes
12345
V. Communication
1.Letter Box2.Post Office3.Telegraph Office4. Post Office and Telegraph Office5.Telephone
12345
VI. Transport (Access)
1. Non-Motorable Road2. Motorable Un-metalled (Kachha) Road3. Motorable Metalled (Pucca) Road4.Railway Line5.Both (Road and Railway Line)
12345
VII. Transport Mode
1.Cycle2.Rikshaw3.Bus4.Rail5.Both (Bus and Rail)
12345
VIII. Financial
1. Other credit society2. Agricultural credit Society3. Non-Agricultural credit Society4. Cooperative commercial Bank5. Commercial bank
12345

144 | Transactions | Vol. 37, No. 1, 2015
Educational is of upmost importance for the proper growth and development of the individuals. It does not only shape the life pattern and living but also helps in shaping thinking, attitude and view of people. Education makes people capable to face challenges. Data reveals that there is a progressive change in the education facilities and numbers of education institutions are rapidly increasing. At present all 120 settlements have basic primary education institutes. Medical facilities are the most important to measure the state of social well-being and it has been given weights according to the availability of medical centre within the settlement. Total number of medical centers represents awareness of people about their health and government concern about health. Data reveals that Daultabad, Kukrola and Harsaru, three settlements have hospitals. Drinking water supply is the basic need for human surviving and it has been given the weights according to the availability of water sources and its purity level. The availability of ground water is available at the average depth of 10-15 meters and quality of water is good. The majority of settlements (87 per cent which is 103 settlements) have proper sufficient water supply and 15 settlements had supply by hand pump in 2001. Power supply means number of electrified settlements and power supply is grouped on the basis of available sources. Data reveals that majority of
settlements have sufficient power supply and 96 per cent power supply in the complex whereas three settlements namely Sakatpur, Darbaripur and Hassanpur had supply only for agricultural purposes in the zone. In 1981, out of total settlements 80 had power supply for all purposes increased by 92 settlements in 1991. Communication facilities mean connectivity of the settlements to other and grouped under five major categories. Data reveals that majority of settlements have high status of communication facilities. There is a progressive change in the communication facilities and numbers of telephone connections are rapidly increasing. Facilities with 65 per cent in 2001 have increased from 25 per cent in 1991. Transport accessibility and transport mode both the variables are correlated. Transport accessibility means path of travelling while transport mode means source of travel. This emerging urban complex is well located in terms of transportation with national highways and sub highways running. In 1981 out of total 35 settlements had transport accessibility of motorable metalled (Pucca) road and has been increased by 57 settlements in 1991. In 2001 out of total 115 settlements have good status of facilities. A financial facility means the availability of financial units and its approach to all the people. Data reveals that 85 per cent settlements have location of commercial bank and credit societies in 2001. In 1981
IX. Recreational
1. Newspaper and Magazine2. Video hall3. Cinema4. Sports Club5. Stadium and Auditorium
12345
Source: Computed, District Census handbooks.
Transactions | Vol. 37, No. 1, 2015 | 145
and 1991 only Gurgaon city have had the location of commercial bank. In 2001 due to new emerged IT sector a sudden increase in 102 settlements recorded in the zone which represents that all the settlements have had the location of some financial facilities. A Recreational facility means availability of entertainment units. The complex recorded the high level of recreational facilities which is 100 per cent with the location of stadium/ auditorium, distribution of newspaper and magazines in the settlements. Data reveals that in 1981 only Gurgaon city had the location of stadium which is increased by two settlements Gurgaon city and Dhankot in 1991. But a sudden increase in all 115 inhabited settlements in 2001.
Functional Hierarchy of SettlementsAll the settlements are divided into highly developed, developed and less developed. Indicators were standardized by assigning weights as per hierarchical criteria according to the significance of a function. The weighted figures are than summed and averaged to obtain a composite index. The Composite Index represents functional hierarchy of settlements. Composite Index (CI) = ∑WF/N; Where, ∑ WF is sum of Weighted Functions; and N is Total Number of Indicators. High developed settlements: In this group only Gurgaon city have had the good amenities in 1981. Total number has been increased with 4 settlements named Gurgaon city, Gurgaon rural, Dundahera, and Jharsa in 2001 are counted. It could be stated that all the settlements under this section have highly developed functional profile and high proportion of land under infrastructural facilities. Medium developed settlements: In this group total 13 settlements named Badshahpur, Bhondsi, Manesar,
Shikohpur, Kasan, Wazirabad, Jharsa, Sukhrali, Gurgaon rural, Dhankot, Basai, Garhi Harsaru and Daultabad in 1981 are counted. Total number has been increased with large number of 114 settlements in 2001 are counted. It could be stated that number of settlements under this group has been increased which represents accessibility of basic facilities at present. Low developed settlements: This group includes those settlements have very less development level in terms of functions are to be found and under this total 104 settlements are grouped in 1981. In 2001 all inhabited settlements have good facilities. Thus, it is examined that weighted value is the best way to understand the level of functional hierarchy of settlements.
ConclusionThe location of the study area is very significant, as it lies adjacent to the NCT of Delhi and all 120 settlements are unique with their own characteristics in the complex. Planning for rural development is an integral part of regional economic development and as a service centre Gurgaon city provides services to all 119 rural settlements. The establishment of Maruti industry and emergence of IT sector it started to develop and growth is centered along the NCT of Delhi boarder now it is extended along the NH-8. This is in the demand as people like to migrate to this place due to easy connectivity by NH-8. The complex is also famous for the religious place of Mata Shitla and Maa Kali. Settlements along the corridors Manesar, Bar Gujjar, Naurangpur, Sakatpur, Khandsa, Mohammadpur Jharsa and Narsinghpur had high population growth. The complex is developed as an IT sector in Gurgaon city, Gurgaon
146 | Transactions | Vol. 37, No. 1, 2015
(Rural) O.G., Jharsa O.G., Silokhara O.G., Sukhrali C.T., Cartarpur Alias Daultpur, Inayatpur, Manesar, Naharpur Kasaro, Khoh, Bar Gujjar Giaratpur and Molhera. It could be stated that there is a progressive change in all the four decades and number of settlements are increasing with high population size. Thus, the study shows polarized development in the context of urban influence and functional hierarchy in the study area and the rural development over the years has been developed since 1981 to 2001.
ReferencesCensus, 2001. District Census Handbook,
Gurgaon district, Haryana. New Delhi: Government of India.
--------------. 1991. District Census Handbook, Gurgaon district, Haryana. New Delhi: Government of India.
--------------. 1981. District Census Handbook, Gurgaon district, Haryana. New Delhi: Government of India.
--------------. 1971. District Census Handbook, Gurgaon district, Haryana. New Delhi: Government of India.
Kumar, Barun. 2008. Urban Economic Base of National Capital Region of India. Delhi: Globe Publishing House.
Regional Plan 2001. 1989. National Capital Region, National Capital Region Planning Board, Ministry of Urban Development, Government of India.
Regional Plan 2021. 2005. National Capital Region, National Capital Region Planning Board, Ministry of Urban Development, Government of India.
Town and Country Planning Organization. 2007. Evaluation Study of DMA Towns in National Capital Region (NCR). Ministry of Urban Development: Government of India.
Dr. Sheetal Sharma Assistant Professor Department of Geography,
Aditi Mahavidyalaya, University of Delhi, Delhi – 110036, India.
Dr. Anjan SenAssistant Professor, Department of Geography,
Delhi School of Economics, University of Delhi,
Delhi – 110007, India.