gulf monitoring network...gulf of mexico alliance nutrient monitoring design workshop sept. 10-12,...
TRANSCRIPT

Gulf of Mexico Alliance
Water Quality Team
Gulf Monitoring Network
Monitoring Design - Nutrients
January 2013
By Kate Muldoon, Steve Wolfe, and Raymond E. Leary
Important Note: This living report describes the initial phase
of the Gulf Monitoring Network, and is expected to be
modified in the coming months as additional GOMA
monitoring goals are addressed during the design-
development process
To obtain the full workshop report on the Gulf Monitoring Network,
please visit the GOMA website,
Gulf Monitoring Network: Nutrient Monitoring Design Workshop,
September 10-12, 2012
Gulf of Mexico Alliance Nutrient Monitoring Design Workshop Sept. 10-12, 2012 Sarasota, FL
ii
Acknowledgements
Workshop Steering Committee:
Alice Dossett, Mississippi Dept. of Environmental Quality
Natalie Guedon-Segrest, Mississippi Dept. of Environmental Quality
Jennifer Haslbauer, Alabama Dept. of Environmental Management
Dr. Ann Jochens, Gulf of Mexico Coastal Ocean Observing System, Regional Assoc.
Fred Leslie, Alabama Dept. of Environmental Management
Dr. Troy Pierce, U.S. Environmental Protection Agency, Gulf of Mexico Program
Office
Lynn Sisk, Alabama Dept. of Environmental Management
Gail Sloane, Florida Dept. of Environmental Protection
Dr. Amber Whittle, Florida Fish and Wildlife Research Institute
Steve Wolfe, Florida Institute of Oceanography
Laura Yarbro, Florida Fish and Wildlife Research Institute
Breakout Facilitation
Dr. Barb Kirkpatrick, Mote Marine Laboratory
Dr. Amber Whittle, Florida Fish and Wildlife Research Institute
Steve Wolfe, Florida Institute of Oceanography, Gulf of Mexico Alliance
Workshop Support:
Dr. Barb Kirkpatrick, Mote Marine Laboratory
Rusty Holmes, Mote Marine Laboratory
Paula Clark, Mote Marine Laboratory
Henry Luciano, Mote Marine Laboratory
Joe Nickelson, Mote Marine Laboratory
Vicki Weise, Mote Marine Laboratory
Meeting Notes:
Carol Parsons Richards, Louisiana Coastal Protection and Restoration Agency
Special thanks to Mote Marine Laboratory for use of their excellent meeting facilities
and support staff, and contributions from scientific staff, during the meeting in which
this design was created.
Gulf of Mexico Alliance Nutrient Monitoring Design Workshop Sept. 10-12, 2012 Sarasota, FL
iii
Table of Contents
Acknowledgements ....................................................................................................................................... ii
List of Design Workshop Participants .......................................................................................................... iv
Executive Summary ....................................................................................................................................... 1
Introduction .................................................................................................................................................. 3
Priority Nutrient-Monitoring Questions ....................................................................................................... 5
Summary and Results.................................................................................................................................... 7
Scale .......................................................................................................................................................... 7
Creation of Draft Design Templates for Estuary and Coastal-Segment Monitoring ................................. 8
A. Creation of Template for Estuary Monitoring .............................................................................. 8
B. Creation of Template for Coastal-Segment Monitoring ............................................................. 10
Creation of Draft Designs for Shelf and Deep-Gulf Areas ....................................................................... 12
C. Design of System for Shelf Monitoring ....................................................................................... 12
D. Design of System for Deep Gulf Monitoring ............................................................................... 14
Next Steps ................................................................................................................................................... 16
Implementation Challenges ........................................................................................................................ 16
Appendix 1A. GOMA GMN, Estuary Template ........................................................................................... A1
Appendix 1B. Estuary Analytes and Measurements ................................................................................... A2
Appendix 2A. GOMA GMN, Coastal Segment Template ............................................................................. A4
Appendix 2B. Coastal Segment Analytes and Measurements .................................................................... A5
Appendix 3A. GOMA GMN, Shelf Transects ............................................................................................... A7
Appendix 3B. Shelf Analytes and Measurements ....................................................................................... A8
Appendix 4A. GOMA GMN, Deep Gulf Stations ....................................................................................... A12
Appendix 4B. Deep Gulf Analytes and Measurements ............................................................................. A13

Gulf of Mexico Alliance Nutrient Monitoring Design Workshop Sept. 10-12, 2012 Sarasota, FL
iv
List of Design Workshop Participants
STATE AGENCIES ALABAMA Jennifer Haslbauer, Environmental Engineer, Water Quality Branch, Alabama Dept. of Environmental
Management [email protected]
Fred Leslie, Chief, Montgomery Branch, Alabama Dept. of Environmental Management [email protected]
FLORIDA Charles Kovach, Chief Scientist, Southwest District Office, Florida Dept. of Environmental Protection
Ray Leary, Assistant Coordinator, GOMA & Florida Dept. of Environmental Protection [email protected]
Kate Muldoon, Environmental Manager, GOMA & Florida Dept. of Environmental Protection [email protected]
Dr. Amber Whittle, Habitat Research Administrator, Florida Fish and Wildlife Research Institute [email protected]
Steve Wolfe, Coordinator, Gulf of Mexico Alliance, Florida Institute of Oceanography [email protected]
Laura Yarbro, Research Staff, Florida Fish and Wildlife Research Institute [email protected]
LOUISIANA Carol Parsons-Richards, Coastal Resources Scientist Supervisor, Louisiana Coastal Protection and
Restoration Agency [email protected]
MISSISSIPPI Alice Dossett, Chief, Surface Water Monitoring Section, Mississippi Dept. of Environmental Quality
TEXAS Robin Cypher, Aquatic Scientist, Surface Water Quality Monitoring, Texas Commission on Environmental
Quality [email protected]
FEDERAL AGENCIES
U.S. EPA Dr. Ed Decker, Nutrient Regional Coordinator, Region IV, Atlanta, GA [email protected]
Dr. Jan Kurtz, Research Biologist, Gulf Breeze Environmental Research Laboratory, Gulf Breeze, FL [email protected]
Tim Wool, Senior Water Quality Modeler, Region IV, Atlanta, GA [email protected]
- Continued -
Gulf of Mexico Alliance Nutrient Monitoring Design Workshop Sept. 10-12, 2012 Sarasota, FL
v
List of Design Workshop Participants (concluded)
NOAA David Kidwell, Program Manager: Hypoxia Programs, Center for Sponsored Coastal Ocean Research,
Silver Spring, MD [email protected]
Dr. Chris Sinigalliano, Director, Environmental Microbiology Program, Atlantic Oceanographic & Meteorological Laboratory, Miami, FL [email protected]
USGS Dr. Alyssa Dausman, Coordinator, Gulf Coast Science Coordination Office [email protected]
Richard Rebich, Chief, Investigations Section, Mississippi Water Science Center [email protected]
Dr. Greg Steyer, Branch Chief, National Wetlands Research Center [email protected]
U.N. Gulf of Mexico Large Marine Ecosystems Project- Mexico Dr. Virginia Y. Garcia Rios, Co-Coordinator, Monitoring Pilot Project [email protected]
UNIVERSITIES
Larry Lloyd, Research Specialist, Texas A&M Univ. – Corpus Christi [email protected]
Dr. Kyeong Park, Associate Professor, Department of Marine Sciences, Univ. of South Alabama [email protected]
Dr. Ernst Peebles, Associate Professor, College of Marine Science, Univ. of South Florida [email protected]
Evan Turner, Researcher, Texas A&M Univ. – Corpus Christi [email protected]
Non-Governmental Organizations (NGOs) Dr. Kellie Dixon, Senior Scientist, Mote Marine Laboratory [email protected]
Dr. Ernest Estevez, Senior Scientist, Emeritus, Mote Marine Laboratory [email protected]
Dr. Barbara Kirkpatrick, Senior Scientist, Program Manager-Environmental Health, Mote Marine Lab [email protected]
Gulf of Mexico Alliance Nutrient Monitoring Design Workshop Sept. 10-12, 2012 Sarasota, FL
1
Executive Summary
The Water Quality Team (WQ Team) of the Gulf of Mexico Alliance (GOMA) consists of state,
federal, non-governmental-organization (NGO), and private members. The WQ Team, which is
one of six GOMA teams, works to implement the water-quality portions of the GOMA
Governors’ Action Plan II.
The WQ Team is composed of four workgroups, with one focused on monitoring; the remaining
workgroups are focused on Mercury, Pathogens, and Harmful Algal Blooms (HABs). The
Monitoring Workgroup’s Action Plan includes creation of a framework to support Gulf-wide
monitoring. As part of this effort, the Workgroup has collaborated with the agencies and
entities that make up GOMA as well as the Gulf Coast Ecosystem Restoration Task Force
(GCERTF), the Hypoxia Task Force, and the Gulf of Mexico Coastal Ocean Observing System
(GCOOS) to create an organizing structure for the Gulf Monitoring Network (GMN).
On September 10-12, 2012, the GOMA WQ Team, in concert with the GOMA Nutrients Team
and the GCERTF, held the Gulf Nutrient-Monitoring Design meeting at Mote Marine
Laboratory and Aquarium in Sarasota, FL. The purpose was to develop a draft monitoring
network design to address priority questions developed by the Nutrients Team. Participants
included State representatives from the WQ Team and Nutrients Team, monitoring design
experts, GOMA federal partners, and water quality modelers. Participants developed
monitoring system designs for both Gulf-wide and regional scales, and provided insight and
templates to guide the design of the two smaller-scale monitoring systems addressing coastal
segment and estuarine areas. For each scale, participants were provided with an overview of the
existing knowledge about nutrients in the Gulf, factors to consider in designing the monitoring
by scale, and GOMA nutrient monitoring priority questions, after which they separated into
breakout sessions to address the issues.
The resulting monitoring strategy includes meshed monitoring designs for each scale of the
Gulf: the estuaries, the coastal areas (coastline out to the 10 m contour), the shelf (10 m to the
edge of the Continental Shelf), and the deep Gulf. The draft monitoring designs complement
and feed into each other to provide a basic overall understanding of Gulf drivers, such as
circulation patterns and vertical and horizontal processes. More specifically, the designs also
focus on how nutrient flux, transport, fate, and sources and sinks respond to these drivers and
processes. The larger-scale shelf and deep-Gulf designs are proposed to use a combination of
remote sensing, fixed stations, and flow-through meters on ships to obtain a clearer
understanding of the larger ecosystems. The smaller monitoring scales, estuaries and coastal
segments, are designed as templates to both support design of the estuary monitoring system
that integrates with the Gulf Monitoring Network or—if sufficient information is unavailable—
provide a starting point for intensive studies. Such studies can assist local decision-making to
inform permanent station placement, sampling frequency, and required analytes and
measurements needed to integrate with the Gulf-wide network.
Gulf of Mexico Alliance Nutrient Monitoring Design Workshop Sept. 10-12, 2012 Sarasota, FL
2
The design is a monitoring strategy using satellite imagery as a backdrop to develop models of
water circulation and nutrient transport and fate, with fixed pilings/buoys collecting continuous
data at key locations to add information about depth-related factors, to ground-truth the
satellite data, and to validate the models. The strategy incorporates additional information
collected during trips to maintain the pilings/buoys, with collections at both fixed intermediate
stations and via flow-through measurements between buoys. In shallower parts of the Gulf,
this basic data collection scheme is augmented by probabilistic sampling to improve the ability
to detect change over time.
The overall conclusion is that monitoring of the open Gulf and continental shelf areas are
required to properly understand and predict nutrient loads and effects in coastal and estuarine
waters. Most importantly, participants emphasized that coastal and estuarine models need to
properly account for nutrient inputs transported from Gulf upwelling events and coastal
watersheds, as well as those from uplands and rivers draining to the area of interest.

Gulf of Mexico Alliance Nutrient Monitoring Design Workshop Sept. 10-12, 2012 Sarasota, FL
3
Introduction
The Water Quality (WQ) Team of the Gulf of Mexico Alliance (GOMA) consists of state, federal,
non-government-organization (NGO), and private members. The WQ Team, one of six GOMA
teams, works to implement the water quality portions of the GOMA Governors’ Action Plan II.
The Team is composed of four workgroups, one of which is focused on monitoring. The
Monitoring Workgroup’s Action Plan includes creation of a framework to support Gulf-wide
monitoring. As part of this effort, the Workgroup has collaborated with the agencies and
entities that make up the Alliance as well as the Gulf Coast Ecosystem Restoration Task Force
and the Hypoxia Task Force to create an organizing structure for the Gulf Monitoring Network
(GMN).
Working toward implementing a GMN has been designed as a step-wise process:
1) Identify a structure to organize the development and implementation;
2) Identify the most important GOMA water quality monitoring issues for the Gulf;
3) For each of those issues, identify and rank the highest priority questions (that monitoring
can address);
4) Design the minimum monitoring system necessary to address the priority questions;
5) Perform a ‚gap analysis‛ comparing the necessary monitoring to that already in
existence;
6) Prepare an implementation plan, including funding, for putting a monitoring network in
place in the Gulf to address GOMA priorities;
7) Implement.
The design process has been expedited in preparation for the potential funding support for
some portions of the GMN from RESTORE Act penalties stemming from the BP Deepwater
Horizon oil blowout in 2010.
System design for the GMN is intended to provide answers to specific monitoring questions
(‚priority monitoring questions‛). The organizing structure relates monitoring system design to
the physical scale of the monitoring required to address the monitoring question. The WQ
Team has identified four scales around which to organize the GMN, three of which are of direct
interest to the WQ Team. The fourth (local scale) was defined for continuity with river and
stream monitoring, but is not directly addressed by the GMN. The three scales of interest to the
WQ Team are:
Estuary or Similar-Size Coastal Segment scale – answering the monitoring question
requires monitoring of a single estuary or a similarly-sized segment along the coast. This
scale tends to be based on coastal drainages. Examples: What are the trends in nutrient
concentrations in an estuary (or in each of many estuaries)? How are chlorophyll
concentrations related to specific nutrient regimes?

Gulf of Mexico Alliance Nutrient Monitoring Design Workshop Sept. 10-12, 2012 Sarasota, FL
4
Regional scale – answering the monitoring question requires monitoring of a specific
region of the Gulf. The WQ Team has defined a ‚region‛ as anything smaller than the
Gulf-wide scale but larger than the Estuary or Similar-Size Coastal Segment scale.
Examples: What is the timing and size of hypoxic and anoxic waters in the Gulf Hypoxic
Zone off the Mississippi River? What is the distribution of primary red-tide-supporting
nutrients on the West Florida Shelf?
Gulf-wide scale – answering the monitoring question requires monitoring of the entire
Gulf of Mexico. Examples: What is the seasonal distribution and density of red tide
blooms in the Gulf of Mexico, and what is the trend over time? What is the monthly
distribution of nitrogen and phosphorus nutrients across the Gulf and what is their trend
over time?
The GOMA water quality monitoring priorities identified during the 2011 Monitoring Forum
are:
1. Nutrients
2. The GOMA human health priorities (of equal rank): Harmful algal blooms (HABs),
pathogens, and mercury in seafood.
A decision was made by the WQ Team to first develop monitoring designs for nutrients at all
scales (contained in this report), then to modify that design to accommodate the GOMA human
health priorities.
The GOMA Nutrients Team participated by identifying the highest priority nutrient monitoring
questions for the three scales of interest. These questions are listed separately in the report. The
monitoring design efforts of this workshop were focused on designing the minimum
monitoring system needed to properly address those questions, and this report describes the
results of that effort, including maps and monitoring matrices.
During the workshop, it became clear that the design of the GMN, including station location,
parameters monitored, or frequency required a modified framework. Questions were originally
framed addressing ‚Gulf-wide‛ or ‚Regional‛ scale monitoring; however, monitoring over the
continental shelf requires a different design than that for deep water. As a result, the physical
system design for answering the priority monitoring questions evolved into a meshed system of
monitoring system designs for estuary, coastal (out to the 10 m contour), shelf (10 m to the edge
of the Continental Shelf), and deep Gulf (beyond the shelf edge) systems. Together, these
provide the integrated monitoring system necessary to collect the data required to answer the
priority questions. These are discussed in more detail in the body of this report.

Gulf of Mexico Alliance Nutrient Monitoring Design Workshop Sept. 10-12, 2012 Sarasota, FL
5
Priority Nutrient-Monitoring Questions Product of GOMA Nutrient Team
With added input from HABs Workgroup (in blue)
Estuary or Coastal Segment scale
High priority
1) What is the spatial and temporal variation in nutrient (carbon, nitrogen, phosphorus,
silicate) concentrations in the estuary or coastal segment?
For HABs physiology, it is essential to collect data on the nutrient species (i.e., NO2, NO3,
NH4, PO4, SIO2, urea, etc.).
Will micro-nutrients (vitamins, minerals, CDOM, etc.) be included?
Need to include measurements of nutrient flux and extend from freshwater through brackish
regions.
2) What is the long term trend in nutrient loading to the estuary or coastal segment?
3) Which biological/chemical/physical indicators are most susceptible to nutrient
enrichment in the estuary or coastal segment?
4) What is the long term trend in nutrient export from the estuary or coastal segment?
Retention is an important factor for HABs.
Medium priority
1) Are nutrients contributing to harmful algal blooms (HABs) within the estuary or coastal
segment?
Since nutrients are linked to phytoplankton dynamics, it may be more important to look at
anthropogenic loading or watershed loading.
2) What is the temporal variation in nutrient loading to the estuary or coastal segment?
HABs respond to nutrient fluxes rapidly, and therefore require near-real time sampling
frequencies.
3) What is the long term trend in biological or chemical responses to nutrients in the estuary
or coastal segment?
Low priority
1) Is groundwater a significant source of nutrients to the estuary or coastal segment?
2) Which nutrient(s) is limiting the biological/chemical/physical response within the estuary
or coastal segment?

Gulf of Mexico Alliance Nutrient Monitoring Design Workshop Sept. 10-12, 2012 Sarasota, FL
6
Gulf-wide scale (In order of priority)
1) Which biological/chemical/physical indicators are most susceptible to nutrient enrichment
in the Gulf of Mexico?
2) What is the spatial and temporal variation and trends in nutrient concentrations within
the Gulf of Mexico?
3) How do circulation patterns in the Gulf of Mexico affect nutrient concentrations?
Regional scale (In order of priority)
1) What is the spatial and temporal variation and trends of nutrient loadings and
concentrations within the region?
2) Which biological/chemical/physical indicators are most susceptible to nutrient
enrichment within the region?
3) What is the long term trend in biological/chemical/physical responses to nutrients in the
region?
4) What is the relationship between nutrient loadings and the development of hypoxic
zones within the region?
5) What are the trends in the size, frequency, and duration of hypoxic water within the
region?
6) Are nutrients contributing to harmful algal blooms (HABs) within the region?
Need to develop monitoring system that includes measurements of nutrient fluxes
(upwelling, runoff, groundwater, recycled nutrients) to determine role of nutrient sources in
promoting bloom formation, sustenance, and expansion.
Gulf of Mexico Alliance Nutrient Monitoring Design Workshop Sept. 10-12, 2012 Sarasota, FL
7
Summary and Results
The essential design concept at all scales is for the monitoring system to provide data needed to
determine the health of the resource with respect to nutrients. The key objectives of the design
are: 1) to estimate nutrient fluxes between different key parts of the Gulf system, and 2) to
support understanding of the nutrient processes occurring between flux points to clarify the
relationship between nutrient fluxes and endpoints of concern. A simplified example would be
to measure the nutrient flow into an estuary from a river (a flux point), the movement of
nutrients both out of and into the estuary through its mouth (another flux point), and develop
an understanding of the processing of nutrients between those flux points; e.g., monitoring can
be used to identify the nutrient fluxes responsible for changing conditions, such as the
replacement of nutrient uptake by seagrass beds with that of phytoplankton becoming the
primary nutrient consumer.
This report presents the nutrient-monitoring design for the Gulf Monitoring Network. This
design is intended to be modified to accommodate the remaining GOMA human-health
monitoring priorities; coastal pathogens, harmful algal blooms, and mercury in seafood.
Scale
Workshop participants decided that the scales of the physical system design should be
somewhat different than the scales used to organize the priority monitoring questions. Physical
features have a major effect on monitoring system requirements. As a result, the design laid out
in this report has evolved into a cohesive, interlocking monitoring design that better supports
the development of an integrated set of models able to predict the water quality between
sampling locations.
Participants realized that water-quality status and trend monitoring sufficient for good
management decisions is cost-prohibitive at this scale; therefore, models must be employed to
capture between-station conditions to address management needs.
The physical design consists of four meshed components: estuaries, coastal segments, shelf, and
deep-Gulf monitoring systems. The GMN monitoring area for estuaries was defined as starting
at the lowest point in the tributaries to the estuary where river flux can be measured. Coastal
segments comprise the waters lying along the coast out to the 10m contour line. Coastal
segment lengths are generally driven by coastal drainages and bathymetry and locations of
segment boundaries will be decided locally. The shelf consists of those areas from 10m to the
edge of the Continental Shelf. The deep Gulf includes the Continental Slope and the abyssal
areas. These four components reflect the fact that the factors controlling circulation are
significantly different in each. As a result, the hydrodynamic and water quality models for each
must be different and the monitoring systems that feed data to the models have different
designs.
Gulf of Mexico Alliance Nutrient Monitoring Design Workshop Sept. 10-12, 2012 Sarasota, FL
8
Within this approach, participants also designed the network to incorporate any monitoring
planned for implementation by the Gulf of Mexico Hypoxia Task Force in the northern Gulf
("Gulf of Mexico Hypoxia Monitoring Implementation Plan", found at
http://www.ncddc.noaa.gov/activities/healthy-oceans/gulf-hypoxia-stakeholders/).
Creation of Draft Design Templates for Estuary and Coastal-Segment Monitoring
The rationale for developing templates for both estuarine and coastal segments around the Gulf
is that the incredible variability of these systems will require locally-driven development of a
design for each. Hence, meeting participants developed templates to ensure these designs
would capture a core of basic nutrient fluxes within the system, especially inputs and outputs,
to provide cross-Gulf comparability. The templates will assist local monitoring entities with the
minimum sampling locations necessary to be consistent with the coastal monitoring aspect of
the GMN.
A. Template for Estuary Monitoring
For the purposes of the Gulf Monitoring Network, estuaries were defined as starting at the
lowest point in the tributaries to the estuary where river flux can be measured. Location of the
seaward boundaries is a local decision, but they must align with the inshore boundary of coastal
waters so that there are not gaps in model coverage.
The rationale for the estuary template is to understand the nutrient fluxes into and out of the
estuary, whether from tributaries, runoff, or tidal exchange with coastal waters, and to tie them
into the adjoining coastal model to relate them to nearshore processes. The design of additional
estuarine sampling is locale-specific, is envisioned as a local process for collecting data, and
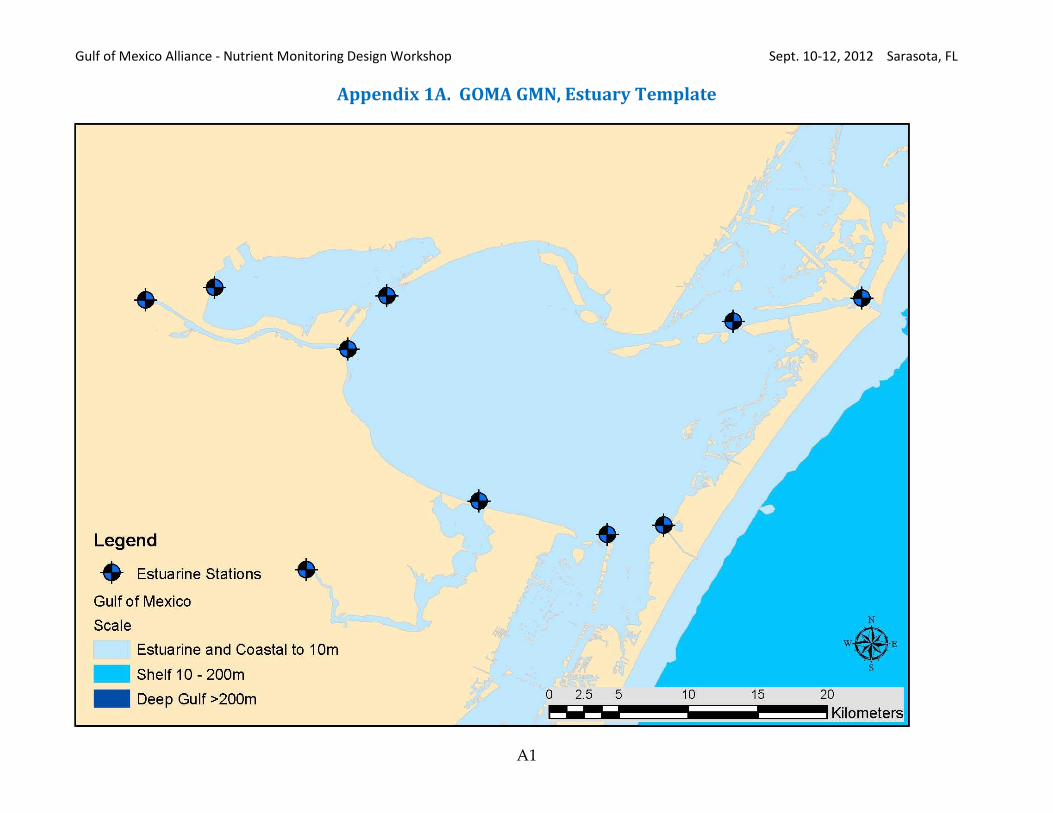
serves to guide nutrient-criteria development to protect aquatic resources (Figure 1 and Appendix
1A). To inform the local process, the meeting participants proposed an estuary monitoring
template initially designed to detect a 10% change over a two year period based on the response
of sensitive, rapidly-responding indicators tied to primary production. In the absence of pre-
existing information, early intensive monitoring may be needed to determine the siting of
monitoring stations, with the emphasis on relating to the coastal-segment monitoring stations.
The proposed template also focuses on quantifying flux, both into the estuary from tributaries
and runoff as well as into and out of the estuary mouth as a result of tidal exchange. Employed
models must include tidal fluctuations. The template requires a minimum number of fixed-site
buoys or piling-mounted instruments to be deployed within the estuary to collect data daily,
weekly, or monthly. In most cases, these will include deployments at the mouths of primary
tributaries, at locations where significant changes in estuary dynamics take place, such as the
flow ‚choke points‛. The buoys or pilings will be located to support the development of
estuarine water quality models, including those for determining critical nutrient loads.
The template proposes both buoys/pilings and boat-based monitoring at the surface (0.3m) and
the bottom, thereby providing a greater resolution of water column processes, including
Gulf of Mexico Alliance Nutrient Monitoring Design Workshop Sept. 10-12, 2012 Sarasota, FL
9
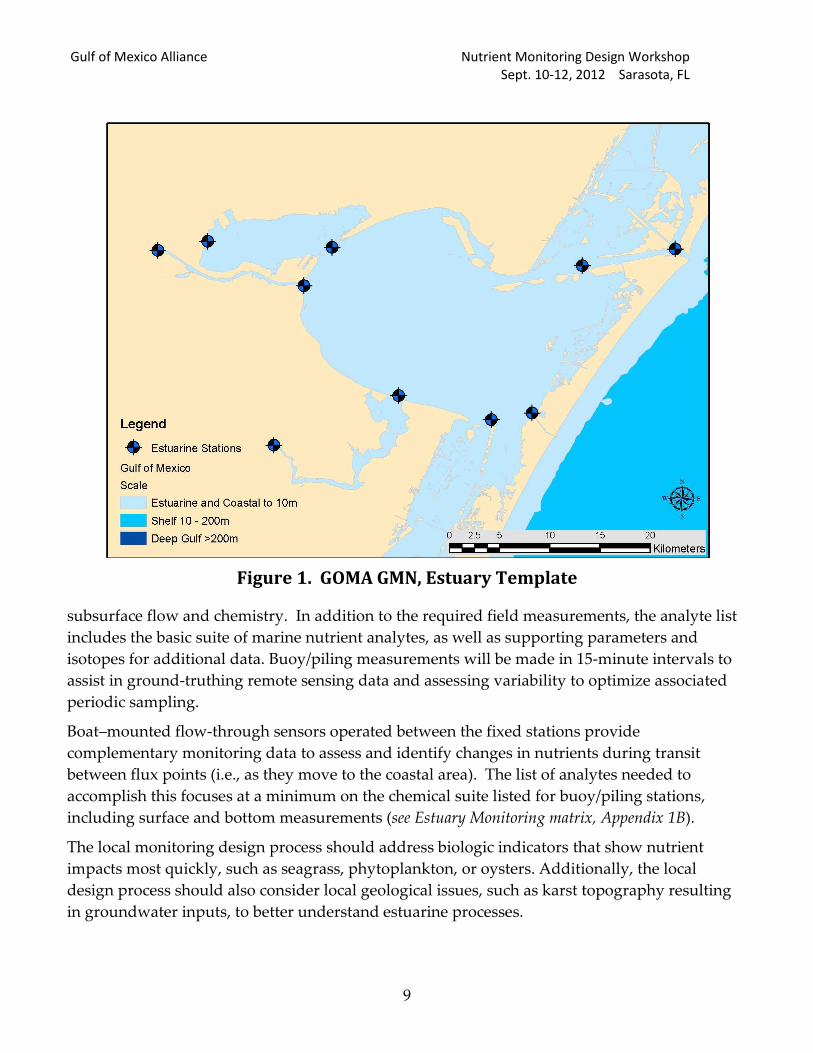
Figure 1. GOMA GMN, Estuary Template
subsurface flow and chemistry. In addition to the required field measurements, the analyte list
includes the basic suite of marine nutrient analytes, as well as supporting parameters and
isotopes for additional data. Buoy/piling measurements will be made in 15-minute intervals to
assist in ground-truthing remote sensing data and assessing variability to optimize associated
periodic sampling.
Boat–mounted flow-through sensors operated between the fixed stations provide
complementary monitoring data to assess and identify changes in nutrients during transit
between flux points (i.e., as they move to the coastal area). The list of analytes needed to
accomplish this focuses at a minimum on the chemical suite listed for buoy/piling stations,
including surface and bottom measurements (see Estuary Monitoring matrix, Appendix 1B).
The local monitoring design process should address biologic indicators that show nutrient
impacts most quickly, such as seagrass, phytoplankton, or oysters. Additionally, the local
design process should also consider local geological issues, such as karst topography resulting
in groundwater inputs, to better understand estuarine processes.
Gulf of Mexico Alliance Nutrient Monitoring Design Workshop Sept. 10-12, 2012 Sarasota, FL
10
Complete meteorological parameters (e.g., wind speed and direction, humidity, barometric
pressure, temperature), plus atmospheric deposition of nitrogen, iron and mercury, would be
included to complement the coastal monitoring of nutrient fluxes and mercury sources. The
design includes sediment monitoring of nutrients and markers for the overlying phtyo- and
zooplankton communities during the first two years and every five years thereafter to
understand sediment oxygen demand, nutrient flux, and nutrient-based changes in community
composition and abundance.
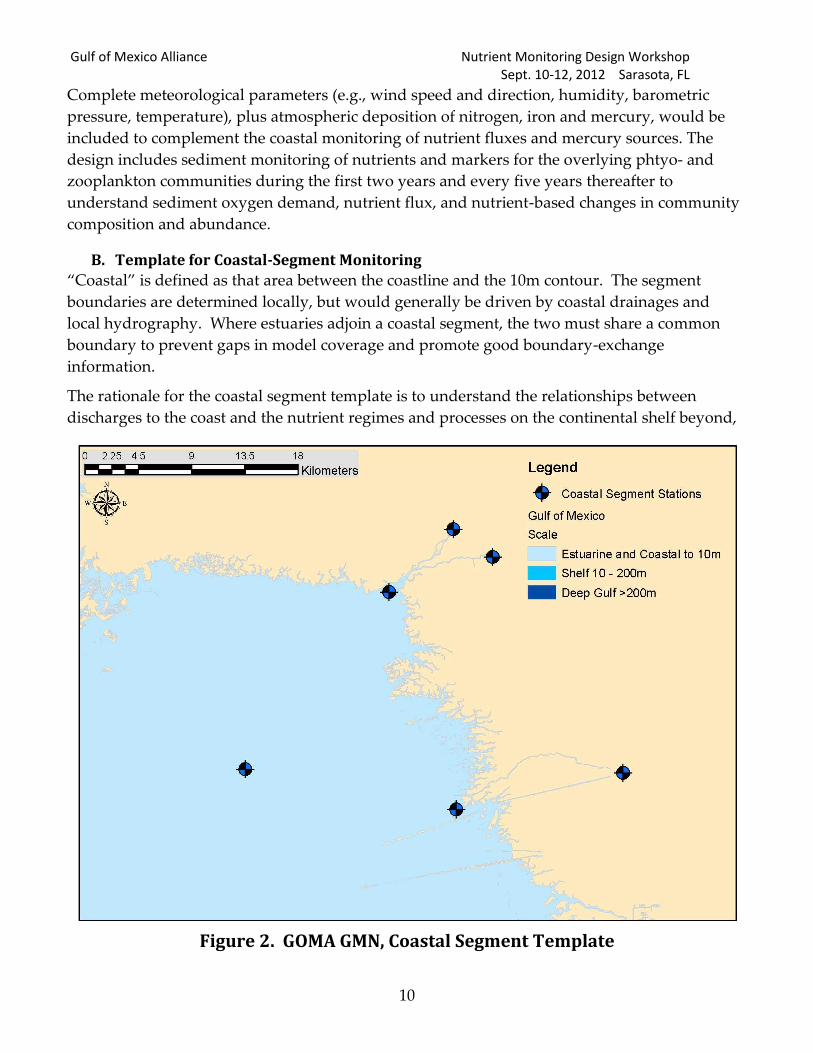
B. Template for Coastal-Segment Monitoring
‚Coastal‛ is defined as that area between the coastline and the 10m contour. The segment
boundaries are determined locally, but would generally be driven by coastal drainages and
local hydrography. Where estuaries adjoin a coastal segment, the two must share a common
boundary to prevent gaps in model coverage and promote good boundary-exchange
information.
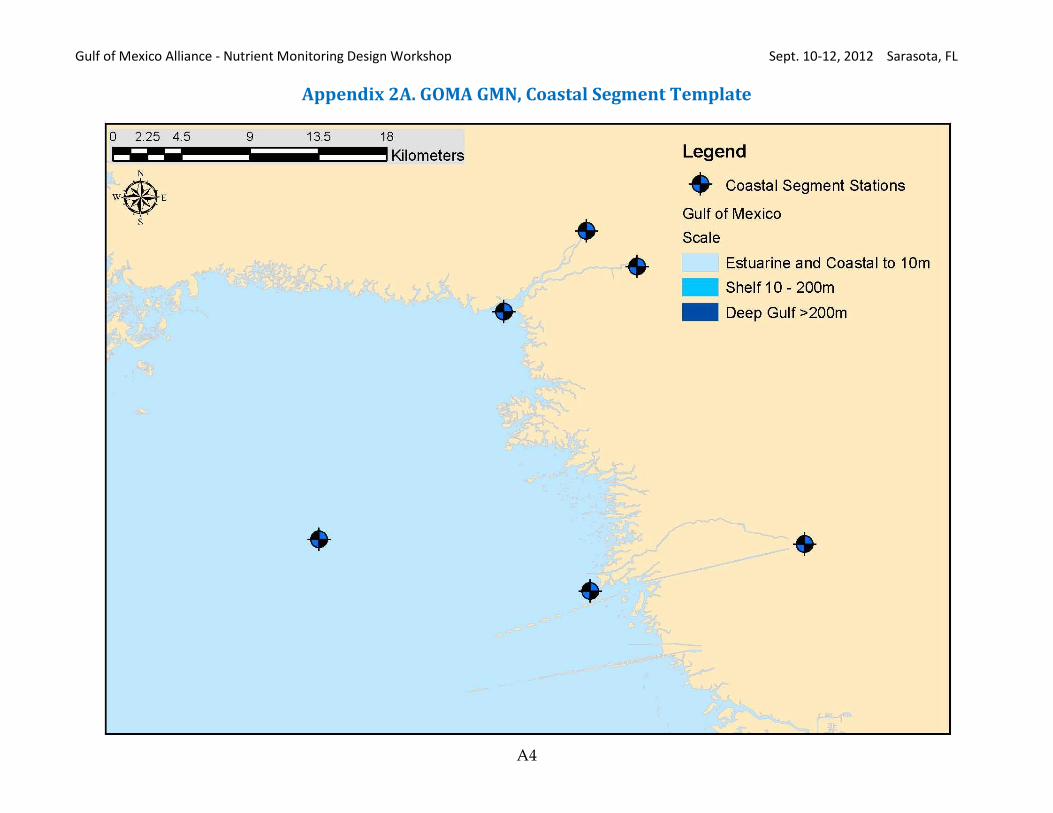
The rationale for the coastal segment template is to understand the relationships between
discharges to the coast and the nutrient regimes and processes on the continental shelf beyond,
Figure 2. GOMA GMN, Coastal Segment Template
Gulf of Mexico Alliance Nutrient Monitoring Design Workshop Sept. 10-12, 2012 Sarasota, FL
11
including those of estuarine discharges and flows to and from nearshore and offshore processes.
The design of coastal monitoring (Figure 2 and Appendix 2A) is envisioned as a local process to
create a system for collecting data to guide nutrient criteria development to protect aquatic
resources and other local needs. To inform the local process, the meeting participants proposed
a coastal segment monitoring template initially designed to detect a 10% change over a two-year
period in the response of sensitive, rapidly-responding indicators tied to primary production. In
the absence of pre-existing information, early intensive monitoring may be needed to determine
the siting of long-term monitoring stations, with the emphasis on tying into the continental shelf
monitoring stations. The proposed template focuses on quantifying flux in a tidal environment,
with the assumption that the accompanying models include tidal fluctuations. The template
requires a minimum number of fixed-site buoys to be deployed within the coastal segment area
to adequately characterize the state of coastal waters; these would collect data daily, weekly, or
monthly. In many cases, the most shoreward shelf buoy (i.e., at the 10m contour) will also serve
as the seaward station for the coastal scale design. A 10m contour line more than three (3) miles
from shore, which characterizes the Yucatan, parts of the west Florida shelf, and parts of
Louisiana, may require additional buoys located between the 10m line and the coastline to
properly capture nutrient transport processes. These intermediate buoys will be repeated
alongshore at a frequency determined in the local design process to support the development of
coastal models, including the determination of critical nutrient loads (see Coastal Segment Stations
map, Appendix 2A). The template proposes both buoys and ship monitoring at surface (0.3 m)
and the bottom, thereby providing a greater resolution of water column processes, including
subsurface flow and chemistry. In addition to the required field measurements, the analyte list
includes the basic suite of marine nutrient analytes, as well as supporting parameters and
isotopes for understanding nutrient processes. Complementary deterministic and probabilistic
monitoring by boats traveling along transects between the fixed stations using flow-through
sampling and measurements is needed to assess and identify changes in the way in which
nutrients are processed during transit between the flux points (i.e., as they move to the shelf or
from offshore upwelling or longshore-transport sources into the estuary). The list of analytes
needed to accomplish this focuses at a minimum on the chemical suite listed in the table for
buoy/piling stations, including surface and bottom measurements (see Coastal Segment matrix,
Appendix 2B).
In coastal segments where the bottom is in the photic zone, the local monitoring design process
should address biological indicators, such as seagrass, phytoplankton, oysters, or other primary
producers/consumers that will rapidly show nutrient changes. Additionally, the local design
process should also consider local geological issues, such as karst topography resulting in
groundwater inputs, to better understand coastal segment processes.
Complete meteorological parameters (e.g., wind speed and direction, humidity, barometric
pressure, temperature), plus atmospheric deposition of nitrogen, iron and mercury, would be
included at those locations where such information is not available to complement the coastal

Gulf of Mexico Alliance Nutrient Monitoring Design Workshop Sept. 10-12, 2012 Sarasota, FL
12
monitoring of nutrient fluxes and mercury sources. The design includes sediment monitoring of
nutrients and phyto- and zooplankton communities during the first two years and every five
years after to understand sediment oxygen demand, nutrient flux, and nutrient-based changes
in community composition and abundance.
Creation of Draft Designs for Shelf and Deep-Gulf Areas
C. System for Shelf Monitoring
The Shelf is defined as that area from the 10 m contour out to the edge of the Continental Shelf.
The rationale for the proposed station locations (Figure 3 and Appendix 3A), monitoring
frequency, and parameters selected for the Shelf scale was to provide information on boundary
conditions to coastal and deep Gulf models, understand nutrient status and trends as well as
fluxes delivered to and from the shelf, and identify and better understand circulation patterns
(and how circulation patterns affect nutrient fate and transport). As proposed, the Shelf
monitoring design would include a series of transects consisting of four (4) fixed station buoys
from nearshore (near significant nutrient inputs) to the shelf edge at the 10m, 50m, 100m, and
Figure 3. GOMA GMN, Shelf Transects
Gulf of Mexico Alliance Nutrient Monitoring Design Workshop Sept. 10-12, 2012 Sarasota, FL
13
200m isobaths. Lateral buoys would be sited along the 100m isobaths half way between each
transect to measure hydrodynamics as well as nutrient concentrations (these lateral stations are
not displayed on the Shelf Stations map, Figure 3 and Appendix 3A). The rationale for this
siting is to support design of nutrient water quality models, facilitate statistical comparisons
between and among stations, monitor nutrient inputs from estuarine areas to the shelf, and
understand nutrient transport across the shelf. Note that shelf buoy locations will be reviewed
and modified as appropriate by a panel of physical oceanographers so they best achieve the
nutrient monitoring goals laid out in this report.
The Shelf component of the GMN is designed to include complementary deterministic (trend)
sampling at and between the fixed stations (buoys and ship sites), and probabilistic stations
sampled by ship. A power analysis based on information from monitoring the Gulf Hypoxic
Zone would be used to conservatively identify the station density needed for probabilistic
monitoring on the shelf. This is based upon the workshop participants’ understanding that the
Gulf Hypoxic Zone is one of the most variable of the shelf environments. Additional or
subsequent data collection may allow regional shelf station densities to be reduced.
The rationale for using a variety of monitoring strategies, such as buoys, ships, remote sensing,
etc. is to provide both interpolation of data between fixed stations and ‚ground-truthing‛ of
both models and remotely-sensed data. Stationary buoys would monitor continuously or at
periodic intervals, with flow-through ship-based monitoring occurring along transects between
buoys on a monthly basis during buoy maintenance. The design proposes both buoys and ships
monitoring at surface (0.3m), mid-depth, and 3 m from the bottom, thereby providing a greater
resolution of water column processes, including subsurface flow and chemistry.
In addition to the required field measurements, the analyte list includes the basic suite of
marine nutrient analytes, as well as supporting parameters and isotopes needed for
understanding nutrient processes. The same list of analytes, except for isotopes, is proposed
for the probabilistic sampling, with the frequency determined by the amount of change that
must be detected and based on the above-mentioned power analysis (see Shelf Monitoring matrix,
Appendix 3B).
Complete meteorological parameters (e.g., wind speed and direction, humidity, barometric
pressure, temperature), plus atmospheric deposition of nitrogen, iron and mercury, would be
included to complement regional monitoring of nutrient fluxes and mercury sources. The
design includes sediment monitoring once every five years to understand sediment oxygen
demand, nutrient flux, and nutrient-based changes in community composition and abundance-
based analyses of phyto- and zooplankton communities to improve existing models and to
inform inferences on regional processes.

Gulf of Mexico Alliance Nutrient Monitoring Design Workshop Sept. 10-12, 2012 Sarasota, FL
14
The rationale to define discrete monitoring regions in the Gulf will be determined as part of the
design process. Each discrete region must be meaningful, and selected to answer priority
questions raised by the Nutrients Team or Pathogens, HABs, or Mercury workgroups. One
proposed strategy is to perform a power analysis on the Gulf Hypoxia Monitoring data to
determine sampling design: that is, the density and frequency of monitoring required to detect a
particular change, e.g. 25%, in nutrient concentrations over a 5-year period.
Note: The paucity of stations west of the Yucatan in Mexico reflects gaps in knowledge of that
area among meeting participants. It is the intent to encourage location of similar stations in that
area following the same rationales.
Selected transects depicted on the map in Appendix 2A include an additional inshore station if
the 10m contour is greater than 3 mi. from shore; the purpose of this additional station is to
support modeling where the coastal segment is exceptionally wide.
The paired transects west of the Yucatan reflect a lack of certainty concerning the final selection
of significant features in that area. The transect(s) selection will be finalized later in the process
by Mexico.
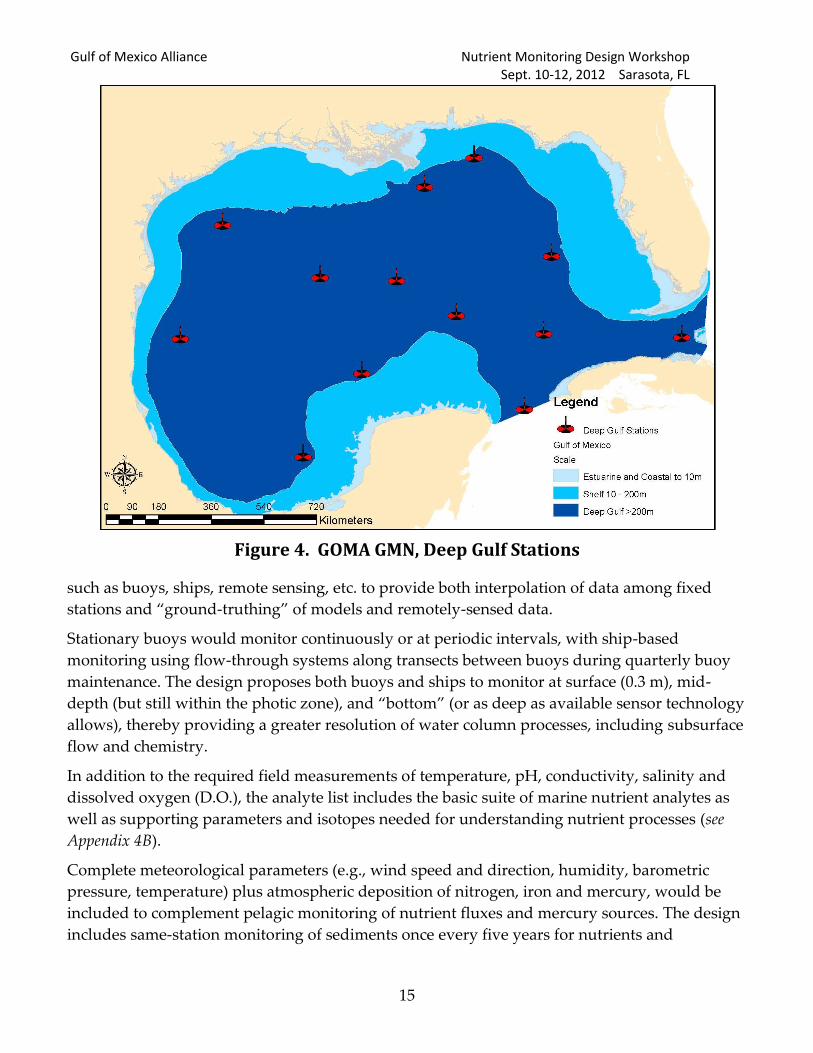
D. System for Deep Gulf Monitoring
The rationales for selection of proposed station locations, monitoring frequency, and parameters
selected for the deep-water design were to a) relate nutrient changes to ecosystem shifts (and
changes in ecosystem services), b) provide data on boundary conditions for shelf models, c)
understand nutrient fluxes between deep water and the shelf, and d) identify and better
understand circulation patterns. Of critical interest is the need to characterize inflows and
outflows/cross sections (between Yucatan and Cuba and between Florida and Cuba) to
understand patterns and magnitude of nutrients flowing into and out of the Gulf, as well as the
inflow that bypasses the Gulf entirely (Figure 4 and larger version in Appendix 4A). Single stations
shown at the Gulf entrance and exit represent what is expected to be a more complex set of
stations needed to accomplish these goals. The proposed placement of the more centrally-
located stations informs the effort to understand basic fate and transport mechanisms within the
major Gulf Loop Current and its large eddies. Specifically, one centrally-located station is
intended to monitor the western boundary of the normal Loop Current; another is located more
towards the actual ‘center’ of the Gulf to support a better water quality model. Proposed
stations are situated to capture key upwelling zones along the deep-water shelf interfaces in the
Gulf, and to understand transport mechanisms by which nutrients move horizontally and
vertically. Note that shelf buoy locations will be reviewed and modified as appropriate by a
panel of physical oceanographers so they best achieve the nutrient monitoring goals laid out in
this report. As proposed, the deep-water part of the Gulf monitoring network would employ a
deterministic (fixed station network) network, ship-based sampling during buoy-maintenance
trips, and remote sensing. The workgroup proposed using a variety of monitoring strategies,
Gulf of Mexico Alliance Nutrient Monitoring Design Workshop Sept. 10-12, 2012 Sarasota, FL
15
Figure 4. GOMA GMN, Deep Gulf Stations
such as buoys, ships, remote sensing, etc. to provide both interpolation of data among fixed
stations and ‚ground-truthing‛ of models and remotely-sensed data.
Stationary buoys would monitor continuously or at periodic intervals, with ship-based
monitoring using flow-through systems along transects between buoys during quarterly buoy
maintenance. The design proposes both buoys and ships to monitor at surface (0.3 m), mid-
depth (but still within the photic zone), and ‚bottom‛ (or as deep as available sensor technology
allows), thereby providing a greater resolution of water column processes, including subsurface
flow and chemistry.
In addition to the required field measurements of temperature, pH, conductivity, salinity and
dissolved oxygen (D.O.), the analyte list includes the basic suite of marine nutrient analytes as
well as supporting parameters and isotopes needed for understanding nutrient processes (see
Appendix 4B).
Complete meteorological parameters (e.g., wind speed and direction, humidity, barometric
pressure, temperature) plus atmospheric deposition of nitrogen, iron and mercury, would be
included to complement pelagic monitoring of nutrient fluxes and mercury sources. The design
includes same-station monitoring of sediments once every five years for nutrients and
Gulf of Mexico Alliance Nutrient Monitoring Design Workshop Sept. 10-12, 2012 Sarasota, FL
16
information on the overlying phyto- and zooplankton communities to establish background
sediment oxygen demand, nutrient flux, and nutrient-based changes in community composition
and abundance.
Note: The approximate station locations in the deep Gulf and on the continental shelf will be
reviewed by a panel of physical oceanographers to optimize their locations. In addition, the
paucity of stations on the maps west of the Yucatan in Mexico is due to gaps in knowledge of
that area among meeting participants. It is the intent to encourage location of similar stations in
that area following the same rationales.
Next Steps
The next steps in the process of developing a Gulf-wide monitoring network include:
Sponsoring a second joint workshop to incorporate and dovetail monitoring for
human health concerns, such as beach pathogens, harmful algal blooms, and
mercury in seafood, into the Gulf monitoring network.
Developing and submitting a white paper on the status and recommendations for
Gulf monitoring to the Gulf Restoration Council, the Centers for Excellence and other
funding pathways.
Holding a third joint workshop to refine the Gulf-wide Monitoring Network by
collaborating with additional Gulf partners to develop an implementation plan for
the network.
Facilitating the Gulf States’ development of estuarine and coastal segment
monitoring plans.
Implementation Challenges
Implementation challenges include:
Selecting the most cost–effective equipment and sensors, analytical methods, and field
logistics;
Collaborating with States, federal partners, NGOs, businesses, GCOOS, coastal
managers, Mexico, and other stakeholders to review, modify, and leverage the Gulf-wide
Monitoring Network design; and
Obtaining long-term funding to support the Gulf-wide monitoring network, potentially
through three of the five funding pathways detailed in the 2012 RESTORE Act.
Gulf of Mexico Alliance - Nutrient Monitoring Design Workshop Sept. 10-12, 2012 Sarasota, FL
A1
Appendix 1A. GOMA GMN, Estuary Template

Gulf of Mexico Alliance - Nutrient Monitoring Design Workshop Sept. 10-12, 2012 Sarasota, FL
A2
Appendix 1B. Estuary Analytes and Measurements
Monitoring
by:
Mon. type Frequency of Mon. Depth Analyte group Analyte group
goal
Analyte Notes
Remote
sens ing
Determinis tic Satel l i te schedule - da i ly,
weekly, monthly
Surface to
fi rs t optica l
depth
Phys Phys ica l s tate of
the ocean at
synoptic sca le.
Sea surface temperature (SST) Same as "Coastal"
Bio-optica l Ocean biomass ,
primary
productivi ty, and
optica l water
qual i ty at
synoptic sca le
Chlorophyl l , surface
photosynthetica l ly ava i lable
radiation (PAR), l ight
attenuation, water clari ty, water
turbidi ty
Same as "Coastal"
Buoy/pi l ing-
mounted, at
head of tide
in estuary
tributaries
Determinis tic 15-minute time steps for
phys ica l properties and for
typica l chemistry for load
ca lculations (where
sensors avai lable).
Monthly max, da i ly or
weekly i f poss ible when
grab samples required.
Water
column
Phys-chem Establ ish input
fluxes to estuary
Water temperature, pH,
a lka l ini ty, conductivi ty, dissolved
oxygen, flow.
Bedload nutrients needed
to feed model , but not a
required monitoring
parameter
Water clari ty &
characteris tics
Establ ish input
conditions to
estuary
Water clari ty (TSS and/or
Turbidi ty), Color (CDOM),
chlorophyl l
Nitrogen
nutrients
Nutrient fate and
process ing
Ammonia (NH3-N), TN, NO2, NO3,
urea
Phosphorus
nutrients
Nutrient fate and
process ing
Ortho P, Total P
Trace nutrients Nutrient fate and
process ing
Si l ica , Dissolved
Carbon Biologica l
process ing of
nutrients
TOC, DOC
Meteorology Water ci rculation
drivers
Wind speed, di rection,
atmospheric pressure, ra infa l l
Add met sensors i f nearest
avai lable instruments too
far away.
- Continued -
Gulf Monitoring Network, analytes & measurements for Estuaries portion of monitoring network

Gulf of Mexico Alliance - Nutrient Monitoring Design Workshop Sept. 10-12, 2012 Sarasota, FL
A3
Appendix 1B. Estuary Analytes and Measurements (concluded)
Monitoring
by:
Mon. type Frequency of Mon. Depth Analyte group Analyte group
goal
Analyte Notes
Buoy/pi l ing-
mounted, at
discharge
from estuary
to Gul f
Determinis tic 15-minute time steps for
phys ica l properties and for
typica l chemistry for load
ca lculations (where
sensors avai lable).
Monthly max, da i ly or
weekly i f poss ible when
grab samples required.
Tida l conditions : spring
and neap tide conditions
(wet and dry seasons), ful l
moon, ideal ly would have
total tida l cycle.
Surface and
bottom
Phys-chem Interpolate data
between buoys ,
especia l ly at
depth
Water temperature, pH,
a lka l ini ty, conductivi ty, dissolved
oxygen, ADCP
Water clari ty &
characteris tics
Biologica l
process ing of
nutrients
Water clari ty (TSS and/or
Turbidi ty), Color (CDOM),
chlorophyl l
Nitrogen
nutrients
Nutrient fate and
process ing
Ammonia (NH3-N), TN, NO2, NO3,
urea
Phosphorus
nutrients
Nutrient fate and
process ing
Ortho P, Total P
Trace nutrients Phytoplankton
community
Si l ica , Dissolved
Carbon Biologica l
process ing of
nutrients
TOC, DOC, DIC
Meteorology Water ci rculation
drivers
Wind speed, di rection,
atmospheric pressure, ra infa l l
Add met sensors i f nearest
avai lable instruments too
far away.
NA Atmospheric
depos ition
Nutrient source
quanti fication
Atmospheric depos ition: TN,
Iron, Mercury?
Gulf Monitoring Network, analytes & measurements for Estuaries portion of monitoring network (concluded)
Gulf of Mexico Alliance - Nutrient Monitoring Design Workshop Sept. 10-12, 2012 Sarasota, FL
A4
Appendix 2A. GOMA GMN, Coastal Segment Template
Gulf of Mexico Alliance - Nutrient Monitoring Design Workshop Sept. 10-12, 2012 Sarasota, FL
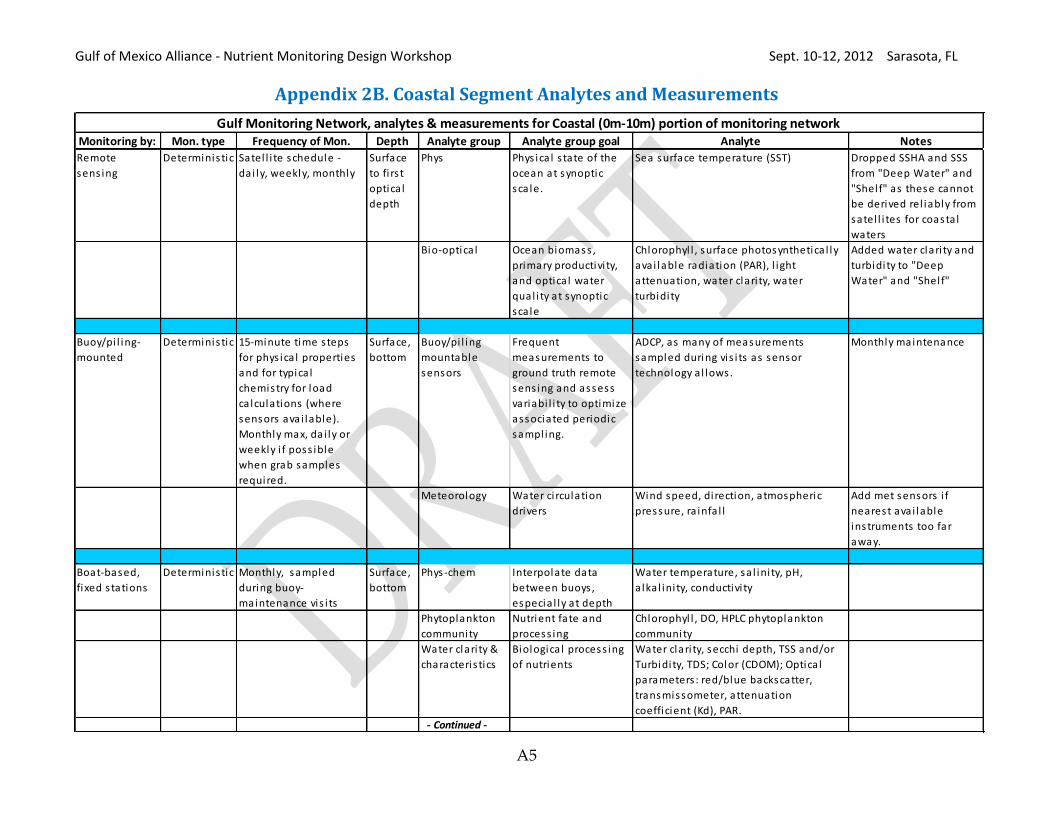
A5
Appendix 2B. Coastal Segment Analytes and Measurements
Monitoring by: Mon. type Frequency of Mon. Depth Analyte group Analyte group goal Analyte Notes
Remote
sens ing
Determinis tic Satel l i te schedule -
da i ly, weekly, monthly
Surface
to fi rs t
optica l
depth
Phys Phys ica l s tate of the
ocean at synoptic
sca le.
Sea surface temperature (SST) Dropped SSHA and SSS
from "Deep Water" and
"Shel f" as these cannot
be derived rel iably from
satel l i tes for coasta l
waters
Bio-optica l Ocean biomass ,
primary productivi ty,
and optica l water
qual i ty at synoptic
sca le
Chlorophyl l , surface photosynthetica l ly
ava i lable radiation (PAR), l ight
attenuation, water clari ty, water
turbidi ty
Added water clari ty and
turbidi ty to "Deep
Water" and "Shel f"
Buoy/pi l ing-
mounted
Determinis tic 15-minute time steps
for phys ica l properties
and for typica l
chemistry for load
ca lculations (where
sensors avai lable).
Monthly max, da i ly or
weekly i f poss ible
when grab samples
required.
Surface,
bottom
Buoy/pi l ing
mountable
sensors
Frequent
measurements to
ground truth remote
sens ing and assess
variabi l i ty to optimize
associated periodic
sampl ing.
ADCP, as many of measurements
sampled during vis i ts as sensor
technology a l lows.
Monthly maintenance
Meteorology Water ci rculation
drivers
Wind speed, di rection, atmospheric
pressure, ra infa l l
Add met sensors i f
nearest avai lable
instruments too far
away.
Boat-based,
fixed s tations
Determinis tic Monthly, sampled
during buoy-
maintenance vis i ts
Surface,
bottom
Phys-chem Interpolate data
between buoys ,
especia l ly at depth
Water temperature, sa l ini ty, pH,
a lka l ini ty, conductivi ty
Phytoplankton
community
Nutrient fate and
process ing
Chlorophyl l , DO, HPLC phytoplankton
community
Water clari ty &
characteris tics
Biologica l process ing
of nutrients
Water clari ty, secchi depth, TSS and/or
Turbidi ty, TDS; Color (CDOM); Optica l
parameters : red/blue backscatter,
transmissometer, attenuation
coefficient (Kd), PAR. - Continued -
Gulf Monitoring Network, analytes & measurements for Coastal (0m-10m) portion of monitoring network
Gulf of Mexico Alliance - Nutrient Monitoring Design Workshop Sept. 10-12, 2012 Sarasota, FL
A6
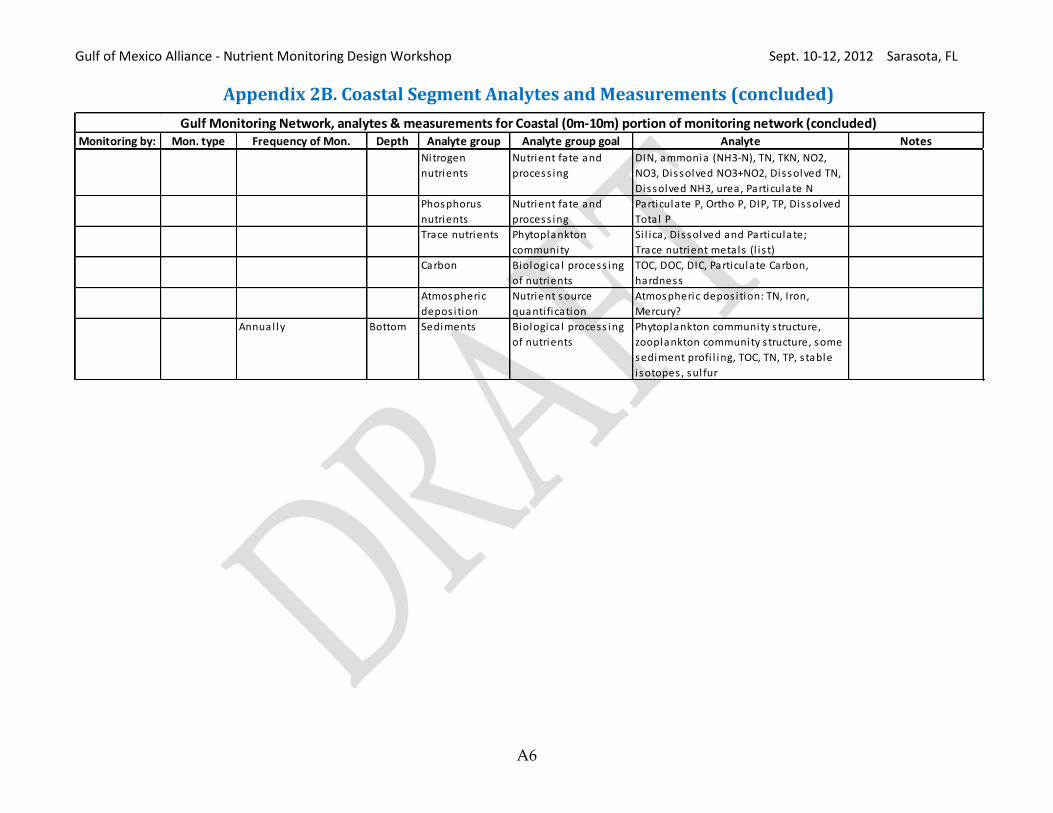
Appendix 2B. Coastal Segment Analytes and Measurements (concluded)
Monitoring by: Mon. type Frequency of Mon. Depth Analyte group Analyte group goal Analyte Notes
Ni trogen
nutrients
Nutrient fate and
process ing
DIN, ammonia (NH3-N), TN, TKN, NO2,
NO3, Dissolved NO3+NO2, Dissolved TN,
Dissolved NH3, urea, Particulate N
Phosphorus
nutrients
Nutrient fate and
process ing
Particulate P, Ortho P, DIP, TP, Dissolved
Total P
Trace nutrients Phytoplankton
community
Si l ica , Dissolved and Particulate;
Trace nutrient metals (l i s t)
Carbon Biologica l process ing
of nutrients
TOC, DOC, DIC, Particulate Carbon,
hardness
Atmospheric
depos ition
Nutrient source
quanti fication
Atmospheric depos ition: TN, Iron,
Mercury?
Annual ly Bottom Sediments Biologica l process ing
of nutrients
Phytoplankton community s tructure,
zooplankton community s tructure, some
sediment profi l ing, TOC, TN, TP, s table
i sotopes , sul fur
Gulf Monitoring Network, analytes & measurements for Coastal (0m-10m) portion of monitoring network (concluded)

Gulf of Mexico Alliance - Nutrient Monitoring Design Workshop Sept. 10-12, 2012 Sarasota, FL
A7
Appendix 3A. GOMA GMN, Shelf Transects

Gulf of Mexico Alliance - Nutrient Monitoring Design Workshop Sept. 10-12, 2012 Sarasota, FL
A8
Appendix 3B. Shelf Analytes and Measurements
Monitoring by: Mon. type Frequency of Mon. Depth Analyte group Analyte group goal Analyte Notes
Remote
sens ing
Determinis tic Satel l i te schedule -
da i ly, weekly,
monthly
Surface to fi rs t
optica l depth
Phys-chem Phys ica l and
chemical s tates of
the ocean at
synoptic sca le.
Sea surface temperature (SST),
sea surface height anomaly
(SSHa), sea surface sa l ini ty
(SSS)
Same as "Deep Water"
Bio-optica l Ocean biomass and
primary productivi ty
at synoptic sca le
Chlorophyl l , surface
photosynthetica l ly ava i lable
radiation (PAR), l ight
attenuation
Same as "Deep Water"
Buoy-mounted Determinis tic Continuous or
periodic sens ing
(depending on
avai lable
technology).
Sensor packages at
surface, 2-3 meters
from bottom, and at
ha l f water depth.
BSOP of poss ible.
Buoy
mountable
sensors
Frequent
measurements to
ground truth remote
sens ing and assess
variabi l i ty to
optimize associated
periodic sampl ing.
ADCP, as many of
measurements sampled
during vis i ts as sensor
technology a l lows.
Foul ing not expected to
a l low quarterly
maintenance.
Meteorology Ocean ci rculation
drivers
Wind speed, di rection,
atmospheric pressure, ra infa l l
Add met sensors i f
nearest avai lable
instruments too far away.
Ship-based,
fixed s tations
a long transects
(at buoys and
hal f way
between)
Determinis tic Monthly, sampled
during buoy-
maintenance vis i ts
Surface, 3 meters
from bottom,
intermediate
Phys-chem Interpolate data
between buoys ,
especia l ly at depth
Water temperature, sa l ini ty,
pH, a lka l ini ty, conductivi ty
Buoys l ikely to need
greater than quarterly
maintenance closer to
shore. Can sample
transects monthly even i f
maintenance can be
quarterly.
Phytoplankton
community
Nutrient fate and
process ing
Chlorophyl l , DO, HPLC
phytoplankton community
Water clari ty &
characteris tics
Biologica l
process ing of
nutrients
Water clari ty, secchi depth,
TSS and/or Turbidi ty, TDS;
Color (CDOM); Optica l
parameters : red/blue
backscatter, transmissometer,
attenuation coefficient (Kd),
PAR. - Continued -
Gulf Monitoring Network, analytes & measurements for Continental Shelf (10m-200m) portion of monitoring network

Gulf of Mexico Alliance - Nutrient Monitoring Design Workshop Sept. 10-12, 2012 Sarasota, FL
A9
Appendix 3B. Shelf Analytes and Measurements (continued)
Monitoring by: Mon. type Frequency of Mon. Depth Analyte group Analyte group goal Analyte Notes
Nitrogen
nutrients
Nutrient fate and
process ing
DIN, ammonia (NH3-N), TN,
TKN, NO2, NO3, Dissolved
NO3+NO2, Dissolved TN,
Dissolved NH3, urea,
Particulate N
Phosphorus
nutrients
Nutrient fate and
process ing
Particulate P, Ortho P, DIP, TP,
Dissolved Total P
Trace nutrients Phytoplankton
community
Si l ica , Dissolved and
Particulate;
Trace nutrient metals (l i s t)
Carbon Biologica l
process ing of
nutrients
TOC, DOC, DIC, Particulate
Carbon, hardness
Atmospheric
depos ition
Nutrient source
quanti fication
Atmospheric depos ition: TN,
Iron, Mercury?
Perhaps every 5 yrs?
Depends on
variabi l i ty. Use
ini tia l results and
NRDA study results to
help determine
frequency after
ini tia l sampl ing.
Bottom Sediments Biologica l
process ing of
nutrients
Sediment cores with
biomarkers of phytoplankton
community s tructure, some
sediment profi l ing, TOC, TN,
TP, s table i sotopes , sul fur.
Sediment oxygen demand,
Sediment nutrient flux (?)
After ini tia l sampl ing and
cons idering results from
ongoing NRDA studies ,
parameter l i s t and
frequency for core
sampl ing wi l l be decided.
Sediment record very
va luable and info can be
col lected no other way.
Sediments are priori ty for
s table i sotope analys is .
Is SNF a s tandard
measurement, or some
suite of measurements?
TBD Isotopes Nutrient fate and
process ing
Isotopes : frequency and
dis tribution TBD
- Continued -
Gulf Monitoring Network, analytes & measurements for Continental Shelf (10m-200m) portion of monitoring network (continued)
Gulf of Mexico Alliance - Nutrient Monitoring Design Workshop Sept. 10-12, 2012 Sarasota, FL
A10
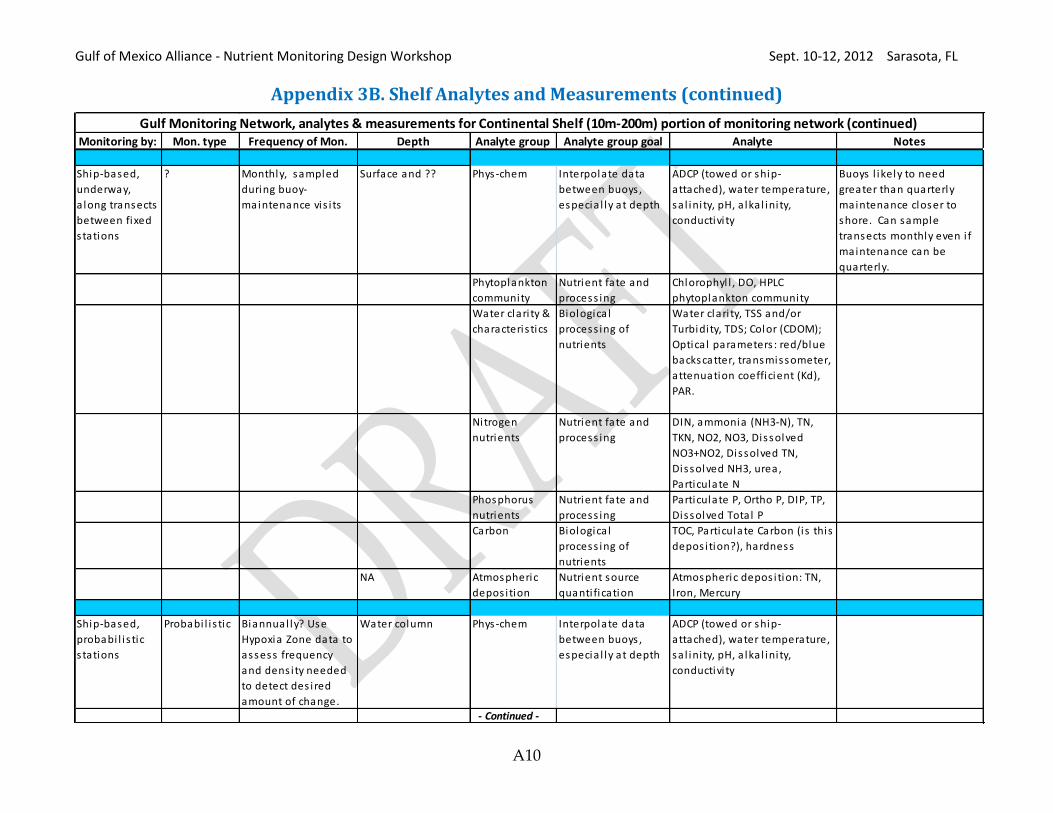
Appendix 3B. Shelf Analytes and Measurements (continued)
Monitoring by: Mon. type Frequency of Mon. Depth Analyte group Analyte group goal Analyte Notes
Ship-based,
underway,
a long transects
between fixed
s tations
? Monthly, sampled
during buoy-
maintenance vis i ts
Surface and ?? Phys-chem Interpolate data
between buoys ,
especia l ly at depth
ADCP (towed or ship-
attached), water temperature,
sa l ini ty, pH, a lka l ini ty,
conductivi ty
Buoys l ikely to need
greater than quarterly
maintenance closer to
shore. Can sample
transects monthly even i f
maintenance can be
quarterly.
Phytoplankton
community
Nutrient fate and
process ing
Chlorophyl l , DO, HPLC
phytoplankton community
Water clari ty &
characteris tics
Biologica l
process ing of
nutrients
Water clari ty, TSS and/or
Turbidi ty, TDS; Color (CDOM);
Optica l parameters : red/blue
backscatter, transmissometer,
attenuation coefficient (Kd),
PAR.
Nitrogen
nutrients
Nutrient fate and
process ing
DIN, ammonia (NH3-N), TN,
TKN, NO2, NO3, Dissolved
NO3+NO2, Dissolved TN,
Dissolved NH3, urea,
Particulate N
Phosphorus
nutrients
Nutrient fate and
process ing
Particulate P, Ortho P, DIP, TP,
Dissolved Total P
Carbon Biologica l
process ing of
nutrients
TOC, Particulate Carbon (is this
depos ition?), hardness
NA Atmospheric
depos ition
Nutrient source
quanti fication
Atmospheric depos ition: TN,
Iron, Mercury
Ship-based,
probabi l i s tic
s tations
Probabi l i s tic Biannual ly? Use
Hypoxia Zone data to
assess frequency
and dens i ty needed
to detect des ired
amount of change.
Water column Phys-chem Interpolate data
between buoys ,
especia l ly at depth
ADCP (towed or ship-
attached), water temperature,
sa l ini ty, pH, a lka l ini ty,
conductivi ty
- Continued -
Gulf Monitoring Network, analytes & measurements for Continental Shelf (10m-200m) portion of monitoring network (continued)
Gulf of Mexico Alliance - Nutrient Monitoring Design Workshop Sept. 10-12, 2012 Sarasota, FL
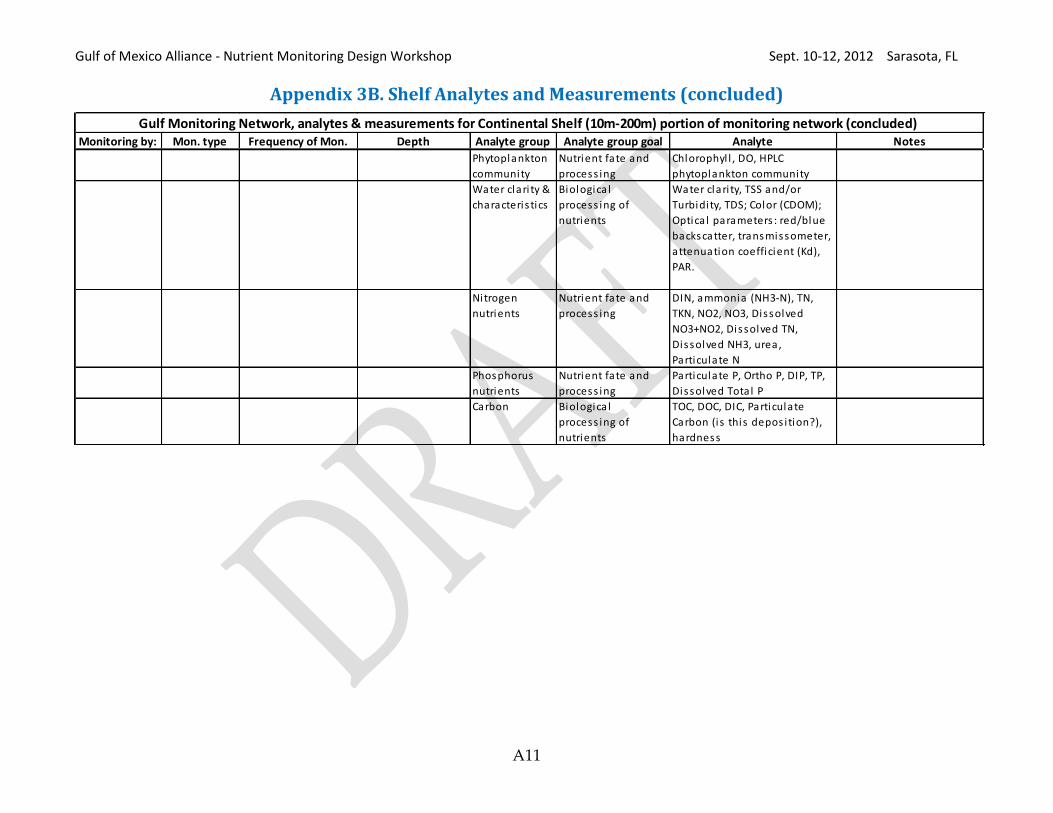
A11
Appendix 3B. Shelf Analytes and Measurements (concluded)
Monitoring by: Mon. type Frequency of Mon. Depth Analyte group Analyte group goal Analyte Notes
Phytoplankton
community
Nutrient fate and
process ing
Chlorophyl l , DO, HPLC
phytoplankton community
Water clari ty &
characteris tics
Biologica l
process ing of
nutrients
Water clari ty, TSS and/or
Turbidi ty, TDS; Color (CDOM);
Optica l parameters : red/blue
backscatter, transmissometer,
attenuation coefficient (Kd),
PAR.
Nitrogen
nutrients
Nutrient fate and
process ing
DIN, ammonia (NH3-N), TN,
TKN, NO2, NO3, Dissolved
NO3+NO2, Dissolved TN,
Dissolved NH3, urea,
Particulate N
Phosphorus
nutrients
Nutrient fate and
process ing
Particulate P, Ortho P, DIP, TP,
Dissolved Total P
Carbon Biologica l
process ing of
nutrients
TOC, DOC, DIC, Particulate
Carbon (is this depos ition?),
hardness
Gulf Monitoring Network, analytes & measurements for Continental Shelf (10m-200m) portion of monitoring network (concluded)

Gulf of Mexico Alliance - Nutrient Monitoring Design Workshop Sept. 10-12, 2012 Sarasota, FL
A12
Appendix 4A. GOMA GMN, Deep Gulf Stations

Gulf of Mexico Alliance - Nutrient Monitoring Design Workshop Sept. 10-12, 2012 Sarasota, FL
A13
Appendix 4B. Deep Gulf Analytes and Measurements
Monitoring by: Mon. type Frequency of Mon. Depth Analyte group Analyte group goal Analyte Notes
remote sens ing Determinis tic Satel l i te schedule -
da i ly, weekly,
monthly
Surface to fi rs t
optica l depth
Phys-chem Phys ica l and
chemical s tates of
the ocean at
synoptic sca le.
Sea surface temperature (SST),
sea surface height anomaly
(SSHa), sea surface sa l ini ty
(SSS)
Same as "Shel f"
Bio-optica l Ocean biomass and
primary productivi ty
at synoptic sca le
Chlorophyl l , surface
photosynthetica l ly ava i lable
radiation (PAR), l ight
attenuation
Same as "Shel f"
Buoy-mounted Determinis tic Continuous or
periodic sens ing
(depending on
avai lable
technology).
Sensor packages at
surface. deep, and
intermediate.
"Deep" is to l imit of
technology. Middle
to be chosen by phy
ocn at s table
dens i ty cl ine. BSOP
i f poss ible.
Buoy
mountable
sensors
Frequent
measurements to
ground truth remote
sens ing and assess
variabi l i ty to
optimize associated
periodic sampl ing.
ADCP, as many of
measurements sampled
during vis i ts as sensor
technology a l lows.
Meteorology Ocean ci rculation
drivers
Wind speed, di rection,
atmospheric pressure, ra infa l l
Add met sensors i f
nearest avai lable
instruments too far
away.
Ship-based,
fixed s tations
a long transects
(at buoys and
hal f way
between)
Determinis tic Quarterly, sampled
during buoy-
maintenance vis i ts
(more frequent at
Gul f entrance/exit
s tations)
Surface, mid-depth
(focused on photic
zone), bottom.
Profi le i f technology
a l lows.
Phys-chem Interpolate data
between buoys ,
especia l ly at depth
Water temperature, sa l ini ty,
pH, a lka l ini ty, conductivi ty
Phytoplankton
community
Nutrient fate and
process ing
Chlorophyl l , DO, HPLC
phytoplankton community
- Continued -
Gulf Monitoring Network, analytes & measurements for Deep Water (>200m) portion of monitoring network

Gulf of Mexico Alliance - Nutrient Monitoring Design Workshop Sept. 10-12, 2012 Sarasota, FL
A14
Appendix 4B. Deep Gulf Analytes and Measurements (continued)
Monitoring by: Mon. type Frequency of Mon. Depth Analyte group Analyte group goal Analyte Notes
Water clari ty &
characteris tics
Biologica l
process ing of
nutrients
Water clari ty, secchi depth, TSS
and/or Turbidi ty, TDS; Color
(CDOM); Optica l parameters :
red/blue backscatter,
transmissometer, attenuation
coefficient (Kd), PAR.
Nitrogen
nutrients
Nutrient fate and
process ing
DIN, ammonia (NH3-N), TN,
TKN, NO2, NO3, Dissolved
NO3+NO2, Dissolved TN,
Dissolved NH3, urea,
Particulate N
Phosphorus
nutrients
Nutrient fate and
process ing
Particulate P, Ortho P, DIP, TP,
Dissolved Total P
Trace nutrients Phytoplankton
community
Si l ica , Dissolved and
Particulate;
Trace nutrient metals
Carbon Biologica l
process ing of
nutrients
TOC, DOC, DIC, Particulate
Carbon, hardness
Atmospheric
depos ition
Nutrient source
quanti fication
Atmospheric depos ition: TN,
Iron, Mercury
Depends on
variabi l i ty perhaps
every 10 years ). Use
ini tia l results and
NRDA study results
to help determine
frequency after
ini tia l sampl ing.
Bottom Sediments Long-term trend in
nutrient loading
Cores with biomarkers for
phytoplankton community
s tructure, some sediment
profi l ing, TOC, TN, TP, s table
i sotopes of N, sul fur.
After ini tia l sampl ing
and cons idering results
from ongoing NRDA
studies , parameter l i s t
and frequency for core
sampl ing wi l l be
decided. Sediment
record very va luable and
info can be col lected no
other way.
TBD Isotopes Nutrient fate and
process ing
Isotopes : frequency and
dis tribution TBD
- Continued -
Gulf Monitoring Network, analytes & measurements for Deep Water (>200m) portion of monitoring network (continued)

Gulf of Mexico Alliance - Nutrient Monitoring Design Workshop Sept. 10-12, 2012 Sarasota, FL
A15
Appendix 4B. Deep Gulf Analytes and Measurements (concluded)
Monitoring by: Mon. type Frequency of Mon. Depth Analyte group Analyte group goal Analyte Notes
Ship-based,
underway
between fixed-
station
transects
Determinis tic Quarterly, sampled
during buoy-
maintenance vis i ts
? Phys-chem Interpolate data
between buoys ,
especia l ly at depth
ADCP (towed or ship-attached),
water temperature, sa l ini ty,
pH, a lka l ini ty, conductivi ty
Phytoplankton
community
Nutrient fate and
process ing
Chlorophyl l , DO, HPLC
phytoplankton community
Water clari ty &
characteris tics
Biologica l
process ing of
nutrients
Water clari ty, TSS and/or
Turbidi ty, TDS; Color (CDOM);
Optica l parameters : red/blue
backscatter, transmissometer,
attenuation coefficient (Kd),
PAR.
Nitrogen
nutrients
Nutrient fate and
process ing
DIN, ammonia (NH3-N), TN,
TKN, NO2, NO3, Dissolved
NO3+NO2, Dissolved TN,
Dissolved NH3, urea,
Particulate N
Phosphorus
nutrients
Nutrient fate and
process ing
Particulate P, Ortho P, DIP, TP,
Dissolved Total P
Carbon Biologica l
process ing of
nutrients
TOC, Particulate Carbon,
hardness
Atmospheric
depos ition
Nutrient source
quanti fication
Atmospheric depos ition: TN,
Iron, Mercury
Gulf Monitoring Network, analytes & measurements for Deep Water (>200m) portion of monitoring network (concluded)