guidelines on cost estimation of research …...the methodology has been discussed and tested with...
TRANSCRIPT

GUIDELINES ON COST ESTIMATION OF RESEARCH INFRASTRUCTURES


StR-ESFRI Study
GUIDELINES ON COST ESTIMATION OF RESEARCH INFRASTRUCTURES

StR-ESFRI Study
GUIDELINES ON COST ESTIMATION OF RESEARCH INFRASTRUCTURES
This publication was developed for StR-ESFRI – Support to Reinforce the European Strategy Forum on Research Infrastructures – by CSIL – the Centre of Industrial Studies.
The StR-ESFRI and StR-ESFRI2 Projects have received funding from the European Union’s Horizon 2020 Research & Innovation programme under grant agreements n° 654213 and n° 823711.

FOREWORDThe ESFRI Roadmap contains indicative figures on the on the set-up and operating costs of the Research Infrastructures, based on estimates provided by the ESFRI Projects and Landmarks. The previous methodology for collecting estimated cost data presented two significant challenges with results: cost categories were not uniformly represented by the RIs, and quoted values fluctuated inconsistently over time.
A discussion developed in the ESFRI Executive Board and in the ESFRI Forum on the need to elaborate a cost analysis for RIs that would be referenced to standard economic methods – e.g. adopting the discount cash-flow analysis for the full lifecycle of the RI, but with RI-specific figures that could be appropriate for the different kind of RIs and their funding schemes. The objective of the cost analysis is to give full transparent evidence of the required investment for the set-up and running resources for operation of the RIs, using state of the art financial units that are easily interpreted and communicated to the political and funding authorities. Adoption and use of the cost analysis will strengthen the reliability of the cost information reported in the ESFRI Roadmap updates, and will provide solid reference values for the monitoring activities of ESFRI on the Projects and on the periodic update of the Landmarks status of the operational RIs.
StR-ESFRI opened a public competition of professional consultants to commission a cost analysis study on RIs and the proposition of a user-guide for applying it to the specific case of ESFRI RIs. The contract was awarded to CSIL – the Centre of Industrial Studies – an independent research and consulting company, specialised in applied economic research, evaluation of public investment projects, infrastructure project appraisal, that already worked in the past on cost-benefit analysis of some Research Infrastructures like CERN and CNAO.
The results of this research are summarized in a CSIL document that was presented during the 68th ESFRI Forum Meeting on 27th-28th March 2019 in Liblice (CZ) and well received by the Forum. ESFRI will take note of the results of the CSIL report in developing its Roadmap methodology and guide for the next updates.
Here we present an extended version of the Guidelines on Cost Estimation of Research Infrastructures as a StR-ESFRI Study downloadable from the esfri.eu website. It is offered for reference to all RI managers and financial officers informing on an advanced cost analysis methodology.


Tableofcontents
1. Introduction.........................................................................................................................1
2. Themethodinanutshell......................................................................................................3
3. Generalprinciples................................................................................................................53.1 Identificationoftheunitofanalysis.........................................................................................53.2 Settingthetimehorizon...........................................................................................................83.3 Discountedcashflowmethod................................................................................................113.4 Currencyandprices................................................................................................................133.5 Incrementalapproachandcounterfactual..............................................................................14
4. Totalinvestmentcostsandresidualvalue..........................................................................154.1 Definition...............................................................................................................................154.2 Mainitems.............................................................................................................................15
4.2.1 Designandpreparation............................................................................................................................154.2.2 Constructionandstart-upcosts...............................................................................................................164.2.3 Replacementcosts...................................................................................................................................174.2.4 Majorupgrades........................................................................................................................................174.2.5 Decommissioningandend-of-lifecosts...................................................................................................17
4.3 Residualvalue........................................................................................................................174.4 Presentvalueoftotalinvestmentcosts..................................................................................18
5. Operatingcosts..................................................................................................................195.1 Definition...............................................................................................................................195.2 Mainitems.............................................................................................................................195.3 Presentvalueofoperatingcosts............................................................................................20
6. Annex:Casestudies...........................................................................................................216.1 Asingle-sitedRIinoperation.................................................................................................216.2 AdistributedRIinoperation..................................................................................................246.3 Anupgradeofanexistingsingle-sitedfacility.........................................................................276.4 AdistributedRIinoperation..................................................................................................30

Listoffiguresandtables
Figure1DistributedRI........................................................................................................................6
Figure2Aggregationandapportionment..........................................................................................7
Figure3CoststructuresofRIs............................................................................................................9
Figure4Actualizationanddiscounting............................................................................................13
Figure5Upgradescenariovs.BAUscenario....................................................................................27
Table1Investmentandoperatingcostsofasingle-sitedRI-EURmillion,nominalnotdiscounted..........................................................................................................................................................22
Table2InvestmentandoperatingcostsofadistributedRI-EURthousand,nominalnotdiscounted..........................................................................................................................................................25
Table3Investmentandoperatingcostofasingle-sitedRIwithamajorupgrade-EURthousand,nominalnotdiscounted...................................................................................................................28
Table4Investmentandoperatingcosts-DistributedRIwithwave-likecoststructure-EURmillion,nominalnotdiscounted...................................................................................................................31
Abbreviationlist
BAU Businessasusual
EOSC EuropeanOpenScienceCloud
ESFRI EuropeanStrategyForumonResearchInfrastructures
FAIR Findable,accessible,interoperableandre-usable(data)
IPRs IntellectualPropertyRights
NPV NetPresentValue
RI ResearchInfrastructure
VAT ValueAddedTax

1
1. IntroductionThese guidelines are developed in the framework of the StR-ESFRI project (Support to
ReinforcetheEuropeanStrategyForumforResearchInfrastructures),toprovideaconceptualandmethodologicaltoolforcostestimationofResearchInfrastructures(RIs)included(orwillingtobe)intheESFRIRoadmap.ThereportprovidesaunifiedframeworktogatherdataconcerningcostsalonglifecycleofRIsinaharmonizedway.Itillustratesgeneralprinciplesandsuggeststechnicalsolutions when data seem not immediately available or difficult to estimate. It also takes intoaccount the specificities of different typologies of RIs, which are active in different researchdomainsandadoptdifferentaccountingsystems.
ThemainaudienceoftheseguidelinesisRIseniormanagerswhoareresponsibleforfinancialplanningandlong-termsustainabilityoftheRI;however,sometechnicalexpertisemaybeneededtoimplementthemethodology(e.g.headoffinance).
Thecommoncostaccountingmethodologypresentedintheseguidelinesisbasedonthebestinternationalpracticeinthefieldofinfrastructureprojectappraisal,allowingcomparabilityacrossdifferenttypesofRIs,countriesandscientificfieldsanditisinspiredbysolidprinciplesleadingtounivocallyinterpretableresults.
The main purpose of this document is to support ESFRI and the ESFRI-related ResearchInfrastructures(‘projects’and‘landmarks’) inprovidingevidence-basedfinancialperspectivesfortheirlifecyclephasesandmaintainingregularlyupdatedinformationfortheForum.
Adopting a common framework is essential not only for gathering data and supportingfundingdecisions,butalsotoallowupdateandverificationoftheinformation.ItcanalsobeusedbyRImanagersformorefarreachingexercisessuchasassessingthesocio-economicimpactoftheRIs1 (particularly with the use of cost-benefit analysis) or ensuring long-term financialsustainabilityand,ultimately,facilitatingthedialoguewithfundingagencies.
Ithastobenotedhoweverthat,inofferingapan-Europeanmethodologytoevaluatecostsofdesign, preparation, implementation and decommissioning of RIs across different legalframeworks,andregulatoryandaccountingstandards,theseguidelinesdonotaimatsubstitutingthe standard accounting rules in place in the different countries and under the different legalstatuses.
Themethodologyhasbeendiscussedand testedwith fourexistingRIsand their commentsandreactionsarereflectedinthefinalversionoftheguidelines.
Theguideisstructuredasfollows:thefirstchapterdescribesinanutshellthestepsandeasy-to-use rules to be followed for cost estimation; the following chapters instead provide amorecomprehensivedescriptionandexplanationsofthebasicprinciplesandthedifferentcostitemstobeconsidered.TheAnnex includesasetofexemplarytablesshowingthepossiblestructureandlevelofdisaggregationofdataandfinancialinformation.TheguideiscomplementedbyanExcelfileprovidingatemplateforthecostdatacollectionandcomputationofpresentvalues.
1Themethodologypresentedhereisinlinewiththe‘GuidetoCostBenefitAnalysisofInvestmentProjects’(lastrelease2014)adoptedbytheEuropeanCommission,DGRegionalandUrbanPolicies,formajorinfrastructureprojects,includingRIs.ThisisareferencealsoadoptedbytheEuropeanInvestmentBankandacceptedbytheEuropeanCourtofAuditorsandbyotherinternationaldevelopmentbanks.

2

3
2. ThemethodinanutshellCostsofResearchInfrastructures(RIs) includeamountsthathavetobepaid(cashoutflows)
or resources that have to be employed (in-kind contribution) for the design, preparation,construction or set up, operation, maintenance, upgrade and decommissioning of a RI. Thestandardrulestobefollowedforcostestimation,whicharepresentedinmoredetailsinthenextchapters,arethefollowing:
1. Define the unit of analysis. A careful delimitation of the unit of analysis may requireapportionment and aggregations of cost items, for examplewhen the infrastructureworkswithacomplexoffacilitiesmanagedbydifferentlegalentitiesorwhentheyaredistributed.RIsdonotalwayscoincidewiththecostsofthehostingorganisation(s).
2. Adoptalongtimehorizon.ThetimespanforcostestimationmustreflecttheentirelifecycleoftheRI.Costsmustbereportedforeachyearofthetimehorizon.
3. Fix the start date. The time horizon starts the yearwhen the first resources are deployed(cash or in-kind) for the design and preparation phase of the RI. Re-use of components ofexistingfacilitiesare‘sunk’costsandshouldnotbeincluded.
4. Fixthebaseyear.Thebaseyearisthepoint-in-timewhenthecostestimationismadeanditdoesnotnecessarily coincidewith the startdate.Pastand future costs shouldbe intendedwithrespecttothebaseyear.
5. Costs should be expressed in real terms.Pricesmust be constant at the base year: futurecostsmust be forecasted according to realistic assumptions and should be net of inflationwhilepastcosts,usuallyreported in financialstatements,mustbeconverted intobaseyearvaluebyapplyingtheinflationindex.
6. Only cash outflows are reported. The cost accounting must follow a cash flow method.Depreciation,reservesandotheraccountingitemsthatareusuallyreportedinbalancesheetsmustnotbeincluded.Sourcesoffinancingcanbeusedtoidentifycostitemsbutshallnotbemixedoraddedtothem.
7. In-kind contribution must be included by calculating their corresponding market price oractualproductioncosts.
8. CostsmustbeexpressedinEuro.TheofficialexchangerateofthebaseyearmustbeusedtoconvertforeigncurrenciesinEuro.
9. Costs must distinguish between investment costs and operating costs. Investment costsinclude: design and preparation; construction and start-up; replacement costs; majorupgrades; decommissioning. Operating costs include: rent of building or equipment;personnel; ordinary maintenance and repair; utilities and consumables; management andadministration,etc.
10. Totalcostsmustbecalculatedatpresentvalue.Futurecostsmustbediscountedwhilepastcostsmustbecapitalised(inadditiontoinflated,asexplainedatpoint5)withanappropriatediscountfactor.

4
Thestepsareillustratedinthefollowingdiagram,whilemorecomprehensiveexplanationsanddiscussionsoftherulestobefollowedareprovidedinthefollowingsections.

5
3. GeneralprinciplesBeforeillustratingthespecificrulesforcostaccounting,thischapterillustratessomegeneral
principles that shouldguide thecostingexercise.Theyaremeant toclarify theoverall rationaleandapproachofthecostestimates.
3.1 Identificationoftheunitofanalysis
Projectidentificationconsistsofthedefinitionoftheunitofanalysisandofitsprecisebordersingeographical, legal, functionaland timing terms. It is the first step fora soundcostestimate.Such exercise is not always as straightforward as it may appear at a first glance. The unit ofanalysis must indeed include all cost components that are necessary to achieve the scientificmissionoftheRI;thismeansthatitcanincludeacomplexofdifferentfacilitieslocatedindifferentplacesandmanagedbydifferentorganisations.
RIsareoftenmanagedthroughinternationalcollaborationsinvolvingmanylegalentities.Anindividual scientificprojectcanrequireacomplexof facilitiesandexperiments.Forexample,anaccelerator without a detector cannot deliver any experimental data and the same if only thedetector isconsidered.Suchfacilitiescanberunbydifferent legalbodieswithseparate juridical(and accounting) arrangements. In this case, the definition of the unit of analysis requires thecarefulaggregationandapportionmentofseveralitemswhichmaybeunderdifferentcontractualarrangements.Thisentailsgatheringdatafromthefinancialstatementsofalltheentitiesinvolvedsothatsomeharmonisationmaybeneededbeforeaggregatingcostitems.
FordistributedRIs,consistingofanetworkofhub(s)(e.g.coordinatingsecretariat)andnodeslocatedindifferentlocations/countriesandindifferent(oftenalreadyexisting)infrastructures,therelevant cost items include those incurredby thehub togetherwith those incurredbynationalnodes,aslongasallthosecomponentsand/orprojectsarenecessarytomaketheRIachievingitsmission. The costs of the RI are the sum of the costs of each component, disregarding itsgeographical location. As nodes and/or hubsmay be located within existing facilities that alsoperform research activities unrelated to the distributed RI, only cost items attributable to thedistributedone,includingsharesoftimemachineorpersonnelcosts,mustbeincludedinthecostestimation.
The cost estimationmust include all thematerial and immaterial components which are functionallyconnected to the attainment of the RIs mission. The elements so identified should consist of a self-sufficientunitofanalysis.

6
DETERMININGTHETOTALCOSTSOFDISTRIBUTEDRIs
AdistributedRI is «anetworkofdistributed resources»2 and consistsof aCentralHub (i.e. coordinationsecretariat) and interlinked National Nodes, which can be further coordinating local nodes. A firstimportant distinction is betweendistributedRIs (which, according to the ESFRI roadmap, need – amongother requirements – to be identified by a unique name, legal status3, and governance structure) and acoordinatedresearchnetwork,whichisinsteadthecollaborationoffullyindependentresearchperformingorganizations.
Figure1DistributedRI
Whereas theproblemsof apportionmentandaggregationarise forbothdistributedRIs and coordinatedresearchnetworks, the specificityof the former is that resources (in full or inpart) are coordinatedandmanagedbytheCentralHub.Thisaddsalayerofcomplexity,whichrequiresdistinguishing:
-Thecostsofcentralhubforresearchactivitiesand/orserviceprovision(ifany);-Thecostsofcentralhubforcoordination;-Thecostofnationalnodesforthecoordinationoflocalentities;-Thecostsofnational/localnodesforresearchactivitiesand/orserviceprovision.
Thelackofmandatoryrequirementsforthenodestosharefinancialdatawiththehubrequireswillingness,resourcesandstrongcoordinationtoperformareliablecostingexercise.Insomecases,whenthenumberof sub-entities is too high and the exercise to gather all the data would be too time-consuming,approximation should bemade atmore aggregate level, basedon the available sources.Whenonly thecostsofthecentralhubareavailable,thisshouldbemadeclear.
2Source:https://ec.europa.eu/research/infrastructures/index.cfm?pg=about3Itisworthnotingthattherequirementofthelegalstatusisnotuniversallyrequired,seeforexampleOECD(2014),InternationalDistributedResearchInfrastructure:IssuesandOptions,availableherehttps://ec.europa.eu/research/infrastructures/index.cfm?pg=about

7
AnindividualRIcanmanageaportfolioofdifferentfacilitiesandresearchprojects,eachofthemwithitsownobjective(s).Ifthecostestimationrelatestoasingleexperimentalfacilitybeingpartofalargercomplex,thecoststhataresharedwithotherexperimentsarenotentirelywithinthe scope of the cost estimation and therefore should be carefully apportioned to theinfrastructureunderexamination.Inotherwords,ifdifferentfacilitiesarehostedinthesamesite,withsomefunctionalinterrelations–e.g.,energycosts,administrativecosts,datacentres–coststhatarecommontoallthefacilitiesmustbeapportionedtothedifferententitiesaccordingtotherateoftheiractualuseandfollowingtransparentcriteria.
SomeRIstakeadvantageoffacilities,land,orequipmentownedbyexistinginfrastructures.For the purpose of the costing exercise it is important to distinguish whether the new facilityconstitutesanadditional, self-standingunitorwhether it is insteadanupgradeoranadditionalcomponentstillpartofthesamefacility.Moreprecisely,consideringthecomponentsownedbyanexistingfacility:
APPORTIONMENTANDAGGREGATION
Apportionment and aggregation usually go hand in hand. In RIs involving several legal entities andcollaborations, for instance, actual costs from the different legal entities’ accounts must first beapportionedandthenaggregatedinauniqueaccount.ThisisacommonsituationfordistributedRIs,butitalsoappliestosingle-sitedRIswhereitmayhappenthatamajorinstitutionincludesdifferentfacilitiesandexperimentswithseverallegalentitiesaspartoftherelatedinternationalcollaborations.Hence,indefiningtheunitofanalysis,itisimportant:
- for the institution hosting the facility/experiment, to distinguish the costs pertaining to the facilitywhich has to be costed from those pertaining to the more general functioning (e.g., institutionalactivities,outreach,etc.)ofthehostingRI(apportionment).
- fortheinternationalcollaborations,todistinguishthecostsrelevanttotheactivitiesoff-sitefromthecoststhatinsteadpertaintothegeneralfunctioningofthelegalentity(apportionment).
- to aggregate only the costs of the facility/experiments pertaining both to the hosting RI and theinternationalcollaborationsdulyapportioned.
Figure2Aggregationandapportionment
Differentiatingbetween“blue”and“brown”costsistheactofapportionment
Thesumof“brown”costsistheactofaggregation

8
- if they are simply a re-use of a spare component of a previous facility that could not havealternativeuse,theircostshouldbeconsideredas“sunk”4andshouldnotbeincludedinthecostcomputationofthenewRI.
- If they are a re-use of a spare component but some investments are required for minorimprovements of the inherited facilities/equipment, such additional costs should beconsideredaspartofthecost-estimationofthenewRI.
- Ifthefacility, landorequipmentisprovidedasin-kindcontribution,thentheircostispartofthe cost-estimation of the RI and their appropriate value shall be computed (see below onthis).
3.2 Settingthetimehorizon
The financial resources needed to set-up and run a RImay span a long period of time. Inaddition,thetypicalspendingprofileandcostdistribution,fordifferentcategoriesoftheRI,oftenshowspikesovertime(seefigurebelow).
4Asunkcostisacostthathasalreadybeenincurredandthuscannotberetrieved.Forthisreasontheyareirrelevantforfuturedecision-making.
Costestimatesmustberelatedtotheentirelifecycleoftheinfrastructure,whichmeansconsideringthecostsspanningtheentireperiodoftimeduringwhichthefacilityremainsuseful.Totalcostsincludebothinvestmentandoperatingcosts.

9
Figure3CoststructuresofRIs
A standard spending pattern shows a relatively large investment peak during design,preparationandconstruction,aramp-upphaseafterlaunchanduntilthefullcapacityisreached,thenaquasi-flat spendingperiodduringoperation; spendingpeaksagain ifmajorupgradesareplannedandduringdecommissioning5.Therearehoweverexceptions to this cost-structure. Forexample, RIs involved in taskswhich are performed cyclically (e.g., surveys) display awave-likecoststructure,wherepreparationandimplementationcostsareincurredateverycycle.Anotherexample isprovidedbythoseRIs, typicallydistributedfacilitiesand/orRIswhichrelyonexisting
5Theimpactofmajorupgradesonthelevelofoperatingcostsmaybedifferent:incaseofsignificantupscaling(e.g.increase in the scale or complexity of performed activities), operating costs may increase while in case oftechnologicalimprovementsleadingtoefficiencygainstheymayremainequalorevendecreaseaftertheupgrade.

10
infrastructures, whose set-up phase includes only minor investment costs as compared to theoperationalcosts.
ThecostsofaRIshouldbeconsideredthroughitsentirelifecycle.Itisthusimportanttotakeintoconsiderationareasonably longtimehorizon(theECGuide,2014suggests15-25yearsbutforsomeRIsa longertimehorizoncanalsobe justified).This is irrespectiveofthepoint intimewhenthecost-analysis isconducted(beitexante, in itinere,orexpost).Forthepurposeofthecosting exercise a long-term perspective, looking at the entire lifecycle of a RI, will allow todescribe and assess all the expected/generated costs, including those spreading far into thefuture. This will enable not to miss costs that may be important even if less immediatelyobservable (e.g. replacement costs) and to plan in advance the means to secure long-termfinancialsustainability.RIsmayproduceeffects(andfinancialconsequences)overlongperiodsoftime even beyond its life cycles – e.g., in presence of nuclear wastes requiring expensivedecommissioning costs for their disposal and long-lasting liability, or air/soil/water pollutionbringingremediationcosts.
Inorder to fixanappropriate timehorizontwoelementsarenecessary:a) identificationofthe‘startdate’andb)estimationoftheoverallrealisticdurationoftheRI.Aspertheformer,itshouldcoincidewiththeyearinwhichthefirstoutflowrelatedtotheRImaterializesorthefirstin-kind contribution is received. This is not always straightforward to identify because theconceptualphaseofaRIcanbelongandmayincludeaninitialperiodwhenthescientificmissionis still open to different options defined in a very broadway. As a general rule, the start dateshould be fixed when the first financial or in-kind allocation is made for activities of thepreparatoryphaseofthealreadywell-definedRI.Thereshouldbeevidenceofadetailed,technicalidentificationof the scope andnatureof research activities for considering the timehorizon tohavestarted.Tothisend,thediscussionwiththescientificstaffcanbekeytoidentifytheproperstartingpoint.
Once the start date is set, the entire life-cycle of the infrastructuremust be defined. Thisincludes the design, preparation, set-up and a sufficiently long operational phase, includingupgrades, if any, and final decommissioning. The technical and scientific staff can advise abouthowlongistheperiodinwhichthefacilityremainsreasonablyuseful.Insomecases,sincenotalldesign or feasibility studies lead to the implementation of a RI, some of these costs may beconsideredassunkcosts(moredetailsonthisin3.5).
Thebaseyearisthepoint-in-timewhenthecostestimationisperformed,i.e.theyearoftheESFRI Roadmap application. Depending on whether it is ex-ante (before or approximatelycoincidingwiththestartyear), initinere(justafterthesetupandlaunch),mid-term(aftersomeyearsofoperations)orex-post(aftermostoftheoperationshavealreadybeenperformed),costscanbeforecasts/projections,actual/observeddataoramixofthem.Theyshallbeaccountedforeachyearofthetimehorizon,accordingtothediscountedcashflowapproach,asdescribedinthenextsection.

11
3.3 Discountedcashflowmethod
Therecommendedcostaccountingruleisthecashflowmethod,whichrequiresconsideringonly actual cash inflows and outflows reported in themoment inwhich theymaterialise. Thissystem differs from the standard company accounting conventions and requires someadjustmentsifbalancesheetsandfinancialstatementsareusedassourcesofdata.Inparticular,accounting items that do not correspond to actual flows, such as for example depreciation orreserves,aredisregarded.Asageneral rule,allpricesshouldbeconsiderednetofValueAddedTax,unlessitisnotrecoverableandthusrepresentsanactualcashoutflow.Differencesmayarisefromonecountrytotheother.Forcostestimations,outflowsrepresenttheonlyrelevantsourceofdata(seeboxbelow).
SOURCESOFFINANCING
RI facilitiesare largelydependentonawide rangeofpublic financingsources.While sourcesoffinancing (such as grants, loans, or member fees) provide essential insights for assessing thefinancialsustainabilityofinvestment(whichrequiresthematchingbetweenfinancialin-flowsandoutflowsyear-by-year), itshouldbekept inmindthattheyare inflowsandhenceshouldnotbetakenintoconsiderationforthecostestimation.Theyarehoweveraproxyofthecostscoveredtroughcashcontributions.
Many RIs may rely on some forms of in-kind support. This can be related to the use ofdonated scientific equipment or the exploitation of time machine or personnel costs (this isparticularly true forpan-EuropeanRIs,which relyheavilyon in-kindcontributions fromnationalmembers). They can also refer to technical components or equipment supplied by one of thepartners(e.g.oneMemberStateasashareofitscontribution)andmadeavailablein-kindtotheRI.Sucharrangementscorrespondtotheuseofrealresourcesnotappearinginthebudgetarycostas a cash flow of the RI (but can appear in the budget of the donating/participating partnerinstitution).Theyarehoweverrelevantindicationofcostsand,asageneralrule,shouldbetakenintoaccountattheircurrentmarketprice,ifavailable.Whendealingwithinnovativeproductsforwhichnomarketpriceisavailable,itmaybepossibletodeterminelikelypricesbylookingattheprice of competing, perhaps less innovative, products, or to calculate the marginal cost ofproductionasaproxyformarketprice.
APPORTIONMENTOFIN-KINDCONTRIBUTIONS
In-kind contributions may happen in many forms and for a variety of items. It is worthdistinguishing the case of variable in-kind costs (e.g., contribution of personnel, access toequipmentof services) from fixed in-kindcosts (e.g.,hosting,building,overheadcosts). For thelatter case, where the “burden” of the in-kind contribution can be considered uniformlydistributed,itispossibletocalculateafixedrateofapportionmentasashareofthevariablecostsoftheRI.
Caremustbepaidwhenaggregatingcostsoccurringindifferentyears.Costsoccurringinoneyearcannotsimplybeaddedtocostsoccurringinanotheryear,withtheexceptionperhapsaverydistantyearinthelifespanoftheRI.Thisisbecause1€todayhasmorevaluethan1€tomorrow,foravarietyofreasons including inflation,riskaversionandopportunitycostofcapital.Forthis
Toallowconsistencyandcomparability incostestimates,aharmonizedsystemofaccountsandpricesshallbeadoptedfortheentiretimehorizon.

12
reason,totalcostsmustbeexpressedinpresentvalue6.Past/futurecostsmustbetranslatedintopresent values by means of an appropriate capitalisation/discount rate: each future cash flowshouldbediscountedbyanappropriatefinancialdiscountfactorandeachpastcashflowshouldbecapitalised7.Inprinciplethetwodiscount/capitalisationratesmaydifferastheyrepresenttwodifferent opportunity costs (prospective and retrospective). The adopted rates must be in realterms(seenextsectiononthepricesystem).
6Presentvalue(PV)isthecurrentvalueofafuturesumofmoneyorstreamofcashflowsgivenaspecifieddiscountfactor.7ThesuggestedvaluebytheEuropeanCommissionformajorinfrastructuralprojectsco-fundedwithEuropeanStructuralandInvestmentFundsis4%inrealterms,seeArticle19(Discountingofcashflows)ofCommissionDelegatedRegulation(EU)No480/2014).Theadoptionofadifferentdiscountrateshouldbejustified.
CAPITALISATIONANDDISCOUNTING
Inordertotranslatefuturecostsintopresentvaluestheyshouldbediscountedbyanappropriaterate (actualization). The opposite applies to past costs which are capitalized. To this and, anappropriatediscountfactorwouldbe:
a" =1
(1 + '))
where*isthetime;'isthediscountrate;a"isthediscountfactor.
Theactualizationoffuturecostscanbedonebymultiplyingthetotalcostsinagivenyearbytheidentifieddiscountfactor:
PV =FV)1 + i "
WherePVisthepresentvalue(atthebaseyear)ofthefutureestimatedamountFV).Thehigheris thediscount rate', the lower thepresentvalueof the futureamount.ThePVofa streamofcashflowsisthuscalculatedasthesumofallthepresentvalues:
PV =FV)1 + i "
0
)12
Thecapitalisationofpastcostsisdoneintheoppositeway,consideringthefollowingcoefficient:
a" = 1 + i "
whichdeterminesthefollowingformulafordeterminingthepresentvaluePVofpastcostsPC:
PV = PC) 1 + i "
IfweconsiderthecaseofaRIinfrastructureoverashorttimehorizonof5years(2016-2020)withthe total spending per year being € 100, the point-in-time of the analysis being 2018 (i.e. theprojectisinthemiddleofitslifecycleandtheanalysisisinitinere),thenthecapitalisationofpastcostsanddiscountingoffutureonesisdepictedinthetablebelow.
13
3.4 CurrencyandpricesToallowcomparabilityalongsidedifferenttimehorizonsandcountriesitisessentialtoadopt
auniquepricesystem.Allcostsshallbeexpressedinauniquecurrency.FortheESFRIframeworkEuroistherelevantcurrency.CostsexpressedindifferentcurrenciesshallbetranslatedintoEurothroughtheofficialexchangerateofthebaseyear.ThisisparticularlyrelevantforRIswhichhavecollaborations or procurement activities with different countries or even facilities located incountrieswhichadoptdifferentcurrencies.
Pricesmustbeconstant(or‘real’,i.e.pricesfixedatabase-year).Theuseofcurrentprices(or‘nominal’, i.e. prices adjusted projecting inflation in the future at a constant rate) must beavoided.Theuseofpricesfixedatthebaseyearmustbeconsistentthroughoutthewholetimehorizon.Forecastedcostsmustincludeonlyrealpricevariations,i.e.netofinflationvariations8ifproperanalysisandsupportingevidenceofpricechangesisavailable.Pastcurrentcostsmustbetranslated intobaseyearvaluesbymeansofan inflation index. Inorder toaggregatehistoricalcurrentvalueswithpresentonestheymustbebothinflatedandthencapitalised.
8Whenthepricesofsomeitemsareexpectedtochangesignificantly,aboveorbelowtheaverageinflationrate,thisdifferentialshouldbetakenintoaccountinthecorrespondingcashflowforecasts.
Yearofdisbursement Amount(€) Discounting/actualization Presentvalue(€;in2018)2016 100 PV = 100 1 + 0.04 7 108.162017 100 PV = 100 1 + 0.04 8 104.002018 100 PV = 100 1 + 0.04 2 100.002019 100 PV =
1001 + 0.04 8
96.15
2020 100 PV =100
1 + 0.04 792.46
Total 500 500.77
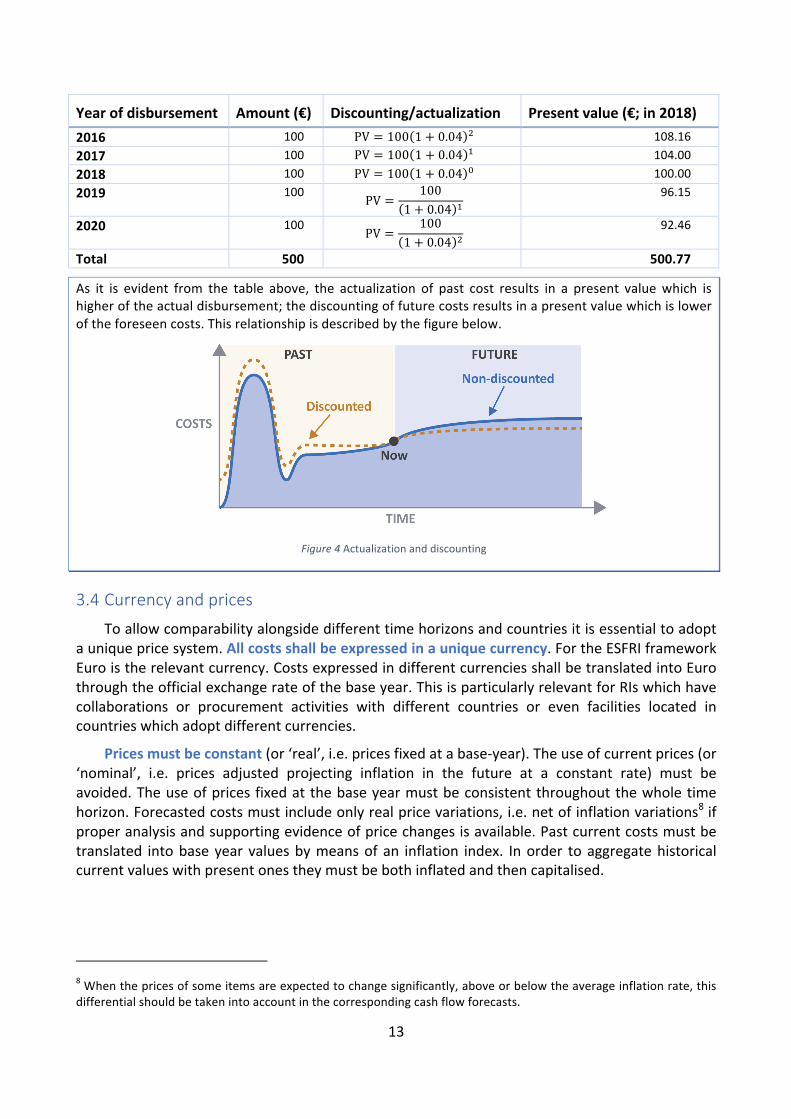
As it is evident from the table above, the actualization of past cost results in a present valuewhich ishigheroftheactualdisbursement;thediscountingoffuturecostsresultsinapresentvaluewhichisloweroftheforeseencosts.Thisrelationshipisdescribedbythefigurebelow.
Figure4Actualizationanddiscounting

14
3.5 Incrementalapproachandcounterfactual
Costsestimationneedtoconsideranappropriatecounterfactual,i.e.whatwouldhavebeenthe costs in the absence of the project. The computation of the incremental costs is thusperformedbysubtractingthecostsofthecounterfactualscenariofromthecostsoftheRI.
In the case of a newly established RI, i.e. with no pre-existing scientific service orinfrastructure, the without-the-project scenario is onewith no operations and the incrementalscenarioisrelativelyeasytocalculatesinceitcoincideswiththecostsoftheRIitself.However,incaseofinvestmentsaimedatimprovingorexpandinganalreadyexistingRI,thecounterfactualisrepresented by the costs of maintaining the service or infrastructure at a level that it is stilloperable(BusinessAsUsual–BAU)orevensmalladaptationinvestmentsthatwereprogrammedto take place anyway (do-minimum). Incremental costs are then the difference between thescenariowithandthatwithouttheproject.This impliesthatcostsavingstranslates intopositivecashflows.
As mentioned, not all the feasibility, design and preparation studies lead to theimplementation of the potential RI considered. Hence, in some cases the BAU scenario shallincludealsothedesignandpreparationphaseoftheabortedRI,atleastpartially,as"sunkcosts".
ThechoicebetweenBAUordo-minimumascounterfactualshouldbemadeonacasebycasebasis. In case of uncertainties, the BAU scenario shall be adopted as a rule of thumb. If do-minimum is usedas counterfactual, this scenario shouldbeboth feasible and credible, andnotcauseundueandunrealisticadditionalbenefitsorcosts.Forsomedistributedinfrastructurestheestablishment of the RI may include only the setting up of the network. In this case the BAUscenariowouldcoincidewiththeproject(s)continuingtooperateinanuncoordinatedway.
INFLATION
ThetablebelowshowstheinflationratesandfactorsforcostsconsideringthetimeseriesofinflationratefortheUnitedKingdom(Source:IMF):
The inflation factor is calculatedbydividingby100 the inflation rate; for the calculationof the inflationadjustmentfactor,oneshouldsetat1theinflationadjustmentofthepoint-in-timeyearandcalculatetheadjustmentfactorbackwardaccordingtotheformula
IAF";8 = IAF" 1 + IF";8
whereIAFistheInflationAdjustmentFactorandIFistheInflationfactor.
Thisinflationfactorconcursthentotheestimationofthepresentvalue.Forexample,ifacostof€100isincurred in 1995, the computation of the present value of this cost will require adjusting this value forinflationbymultiplyingitbyafactorof1.58(seetableabove).
Costsmustalwaysbeaccounted foraccording toan incrementalapproach,which requires toconsiderthecostsoccurringfortheset-upandimplementationoftheRInetofthosethatwouldoccurinanycaseinabsenceoftheRI(the‘withouttheRI’,orcounterfactual,scenario).

15
4. Totalinvestmentcostsandresidualvalue
4.1 Definition
Total investment costs include initial investment costs (thoseoccurringat thebeginningofthe lifecycle for the design, set-up and start of the infrastructure) and replacement costs(occurringduringthereferenceperiodtoreplaceshort-lifemachineryand/orequipment).Insomecasestheycanalsoincludecostsformajorupgrading(asubstantialchangeoftechnicalapproachwhich cannotbe considered routinemaintenance) anddecommissioning costs (when therearedangerousmaterialsorwastetobedisposedofaftertheshutdownofthefacility).
Informationoninvestmentcostsareusuallycontainedinthefeasibilitystudy(iftheanalysisisperformed fromanex-ante perspective) or in the financial statement (ex-post) and thedata toconsiderarethecashorin-kinddeploymentencounteredinthesingleaccountingperiods(years)inordertomakeavailablethevarioustypesofassetsortheequivalentmarketvaluefor in-kindcontributionsnotreportedasfinancialflows.
A residual value of the fixed investments must be included within the investment costsaccount for the end-year. The residual value reflects the capacity of the remaining servicepotentialoffixedassetswhoseeconomiclifeisnotyetcompletelyexhausted.
4.2 Mainitems
Even if the cost types are project-specific, the data can be usually aggregated into somemacro-items,whichwillbeanalysedinthefollowingsections:
• Designandpreparation(aspartofinitialinvestmentcosts,includingtestingandstart-up)• Constructionandstart-up,including:
o Physical(e.g.,landacquisition,installations,constructions)andnon-physical(e.g.,IPRs,cloud,other informationtechnologies)assets,usually themajorcomponentof initialinvestmentcosts;
o Personnel;o Start-upcosts(e.g.training,licences,etc.);
• Replacementcosts;• Majorupgrades;• Decommissioningandend-of-lifecosts.
4.2.1 Designandpreparation
Design and preparation costs are all the in-kind and cash expenditures needed for theconceptualdesignandfeasibilitystudyofthe infrastructure.Theyalso includethecostsforthepreparatoryphaseofaRI,includingpossibleinterim-phaseafterthepreparatoryproject.
The main items included in this cost category are scientific, technical and managerialpersonnelcosts;networkingactivities;joint-researchactivitiesandtrans-nationalcooperation.In-
Investment costs are related to the acquisition of durable tangible and intangible assets. They areincurred inviewofeffects thatmaterialize ina financialyear(s)different fromthat inwhichtheytookplace.

16
kindcontributions in thisphasecanbemainly in the formof in-kindscontributionofpersonnelcosts.
Since not all design and preparation studies lead to the implementation of the project, insomecasesthesecanbeconsideredassunkcosts–atleastpartially.Moreover,inthecaseofnewfacilities developed in the same location of previous infrastructures and experiments,which tosomeextenttakeadvantageoftheexistingassets,itisimportantnottoincludethecostsincurredbefore the start of thedesignperiod, such as costs for feasibility studies undertakenwhen themissionof theRIhadnotbeenclearlydefinedyet,orconstructioncostsalreadysustainedforaprevious project. These, as mentioned, are often sunk costs and must be excluded from theinvestmentcosts.
4.2.2 Constructionandstart-upcosts
Constructions costs relate to the set up and launch from a physical, institutional, legal,organisationalandmanagerialpointofviewoftheinfrastructure.Themainitemsarepresentedinthefollowingsections.
4.2.2.1 Physicalandnon-physicalassets
Assets can be physical or non-physical. The former usually include all assets such as landacquisition,buildings,civilworks,machineriesandequipment.Physicalassetsusuallyrepresentasignificant share of investment costs of non-virtual major infrastructures. Non-physical assetsinclude virtual assets (such as IT platforms, clouds, virtual information technologies and databanks)andotherintangibles(suchasintellectualproperty,patentsandlicences).
Assetscanbeprovidedalsointheformofin-kindcontributions,whentheydonotcorrespondto any cash outflow corresponded directly by the RI. In-kind contributions may refer to bothphysical assets (such as a magnet, machinery, etc.) and non-physical assets (such as virtualcomponents).Inthecaseofmulti-sitedordistributedRIs,whichhavemorethanonephysicalsite,itiskeytoproperlyaggregatethecostitems.Inparticular,thecostsrelatedtothenationalhubsornodesmustbecalculatedasperquotaofparticipationinthedistributedRI.
4.2.2.2 Personnel
Cost of the personnel involved in all the construction and set-up phase not related to theroutine operations of the RI – should be included in the investment costs. They can includescientific,technical,administrativeandmanagerialpersonnelcosts.
Personnel may be provided also as in-kind contributions: they should be included in theanalysis at theequivalent labour cost coveredby thepartner institution and including salaries,fringebenefits,andsocialsecuritycontributionsofpersonnelengaged.InthecaseofdistributedRIs,whenthepersonnelmaybeinvolvedindifferentactivitiesalsonotrelatedtothedistributedRI, it is important to include only the share of his/her work-time actually dedicated to theconsideredRIasdocumented in timesheetsor similar internal records.Thesamemayapply forthe administrative personnel in the hosting organisation which do not fully coincide with thefacilityunderassessmentbuthostsaportfolioofdifferentfacilities.Inthiscase,thetimeshouldthusbedulyapportioneddistinguishingtheamountthatshouldbechargedtotheRI.

17
4.2.2.3 Consumables,utilitiesandothercosts
Theyincludeallthecostsincurredduringtheinitialphasetoset-upthefacilitywhicharenotincludedinthepreviouscategories.Theycanincludetheuseofenergy,waterorwastedisposal,travelandothercostfornetworkingandjoinresearchactivitiesandsoon.
4.2.2.4 Start-upcosts
They include all costs related to the launch of operations, including training costs andacquisitionoflicencesandpatents.
4.2.3 Replacementcosts
Replacement costs correspond to the capital expenditure required to replace those assetswhoseeconomiclifetimeisshorterthanthereferenceperiod.Theeconomiclifetimeisdifferentfor various investment assets (buildings, machinery and equipment, etc.). In order to keep afacility in operation, each assetmust be replaced at the appropriate timeand the replacementcosts,whenforeseensincethestart,mustbeincludedintheinvestmentcosts.
4.2.4 Majorupgrades
Extraordinarymaintenanceandmajorupgradesareinvestmentscostwhichoccurduringtheoperational phase and are related to themodernization and expansionof the facility. They areinterventionswhichmodifytheperformanceinastructuralwayandproduceeffectsbeyondthefinancialyear(s)inwhichtheytakeplace.
Asageneralrule,theyshouldbeincludedintheanalysisintheyeartheyareplannedtooccuronly (i) if they are pertinent to the initial investment project and (ii) if they were alreadyscheduledintheex-antephase.Ifoneorbothconditionsarenotmet,theseinvestmentsshouldbeanalysedinseparatestudies.
The timingprofileofmajorupgradesmayvarydependingon thespecificRI.Suchupgradesareoftenplannedwellinadvance,inanticipationofnewtechnologieswhichwerenotavailableatthetimeoftheinitialdesignbutwereavailableatthestart-upoftheproject.
Itisimportanttodecidesincethebeginningwhetheranupgradeispartofthelife-cycleoftheRIorwhetherinsteaditconstitutesaself-standingproject.
4.2.5 Decommissioningandend-of-lifecosts
End-of-lifecostsrelatetoanydecommissioningcostsand/orenvironmentalmitigationcoststhat may be necessary at the end of the time horizon to dismantle the whole or individualcomponentsofthefixedassets.Majoritemsareusuallythecostsofdismantling,disposalandlandreclamation. In case of nuclear wastes, these costs can be particularly high (up to absorbingcompletelytheresidualvalue)andproducelong-standingfinancialresponsibility.
4.3 ResidualvalueThe residual value reflects the capacity of the remaining service potential of fixed assets
whoseeconomic life isnot yet completelyexhausted. Itmustbe included for theend-yearandwithanegativesign,sinceitisaninflow.Itwillbezeroornegligibleifatimehorizonequaltotheeconomiclifetimeoftheassethasbeenselectedorifdecommissioncostsareparticularlyhigh.Itistheonlyinflowitemofthetotalinvestmentcosts.

18
4.4 Presentvalueoftotalinvestmentcosts
Total investment costsmust be calculated along the entire time horizon as the discountedsumofthefinancialflowsofalltheinvestmentcostitemsfortheentiretimehorizon,regardlessthesourcesoffinancing.Inanex-anteperspective,thepresentvalueoftotalinvestmentcostsisthusasfollows:
<= = >?(8@A)?
0)12 + B?
(8@A)?+ CB?
(8@A)?+ DE?
(8@A)?+ >B?
(8@A)?− CG?
(8@A)?
whereNisthenumberofyearsofthetimehorizon,Dtisthedesignandpreparationcostsattimet,Ctistheconstructionandstart-upcostsattimet,RCtarethereplacementcostsatthetimet,MUtarethemajorupgradescostsattimet,DCtisthedecommissioningcostsattimet,RVtistheresidualvalueattimetandiistheselecteddiscountrate.
Similarly,inanex-postperspective,thepresentvalueoftotalinvestmentcostsis:
<= = H)(1 + ')) + I)(1 + ')) + JI)(1 + ')) + KL)(1 + ')) + HI)(1 + ')) − J=)(1 + '))0
)12
whereiistheselectedcapitalisationrate.
Inaninitinereperspective,bothdiscountedfuturecostsandcapitalisedpastcostsshouldbesummed.

19
5. Operatingcosts
5.1 Definition
In an ex-ante perspective, cost forecasts can be based on historic unit costs. In an ex-postperspective they can be retrieved from financial statements and balance sheets provided thenecessaryadjustmentstoadheretothecashflowmethod.
Operating costs canbedistinguishedbetween fixed (for a given capacity, they donot varywith the volume of good/service provided) and variable (they depend on the volume). Cost offinancing (i.e. interestpayments) followadifferent courseandmustnotbe includedwithin theoperatingcosts(buttheyshouldbeaccountedforinananalysisoffinancialsustainability).
Although it is always possible to compute the average annual operating costs, it should benotedthatoperatingcoststendtoberelativelyconstantwhentheRI isrunningat fullcapacity,but in the start-up and launchphase, before arriving at full capacity, there is a rampupphasewhichcanlastsomeyears(seeFigure3).Hence,assumingcoststobeconstantacrosstheentirelifetimeofRIisnotaccurateandcanfailtoprovideusefulinformation.Measuressuchasthenetpresentvalueprovidemuchmoreinsights,comparedtotheannualaverage,fortheaimsofcostestimation.
5.2 Mainitems
Although the actual composition is project-specific, typical operating costs include: rent ofbuildings or sheds, rental ofmachinery; personnel; ordinarymaintenance and repair of assets;utilities (consumption of rawmaterials, fuel, energy) and consumables; users support, servicespurchased from third parties. Other operating costs may include: environmental protectionmeasures, generalmanagement, administration and quality control costs, royalties paid for theuseofpatentedproductsorprocesses,promotionalcampaignsandotheroutreachexpenditures.Obviously,theweightofthesecostitemsisdifferentacrossvariousscientificdomainsandtypeofinfrastructures. As already mentioned, in line with the cash flow method items such asdepreciation, customarilyused in standardaccounting, shall notbe included for thepurposeofcostestimations.
AcostbookisalistofunitcostsforthemaincostitemsoftheRI(e.g.,costoftheaccessforoneday,unit costofadministrative/scientific/managerialpersonnel,etc.). It isusuallyproducedduringthepreparatoryphaseofinfrastructureandcanbeusedtoforecasttheoperatingcosts.
Personnel costs are usually distinguished by functions (research, administration, technicaloperation, etc.) and by category. As mentioned, if personnel contribution is provided in-kindcontributionstheyshouldbeincludedintheanalysisattheequivalentlabourcost, includingthevalueofsalaries,fringebenefit,andsocialsecuritycontributions.Apportionmentisneededincaseofdistributedfacilities,asalreadydiscussedforinvestmentcosts.
Trainingexpensesshouldalsobetakenintoaccount,asthoserelatedtothedevelopmentofscientific, technical and management skills and capabilities which are essential also for thesustainabilityoftheRI.
Operatingcostsincludealldisbursements(bothin-kindoroutflows)neededtooperateandmaintaintheneworupgradedfacility.

20
Equipment,materialsand labourcostsnecessary for cleaningandmaintaining thebuildingsandthefacilitiesingoodcondition,includingexpendituretofixbrokenpartsandreplacementofspare parts are included as repair and ordinarymaintenance costs. Asmentioned above, theyincludereplacementcostsoffixedassetifself-financedbytheprojectrevenues.
Utilitiesandsupportservicesinclude:fuel/diesel,electricity,gas,waterandrecycledwaste,aswellasotherspecificservices.Anestimateofutilitiesconsumption isessential for identifyingtheexistingsourcesofsupplyandanyexistingorpotentialbottlenecksorshortagesifrequestingeitherinternalorexternaladditionalsupplies.
Consumablesincluderawmaterials,basemetals,(semi)processedmaterialsandcomponents,packagingmaterials,containers, labmaterials,etc. Thetransportcostsfromsourceofsupplytothefacilityshallalsobeconsidered.
Users support refers to the cost-per-user related to the assistance to the users whenaccessing the facility (either physically or virtually). It has implications on the technical andscientific infrastructure, the timeof theadministrative, technicalandscientificpersonnel that isdedicated to each user (users office, referees, technical assessment of feasibility, specific user-demandedconsumables).Itmayalsoincludecostsrelatedtotheuseofguesthouseandcanteenfortheusers(tobeoperatedalsoonweek-endsandholidays)andpossiblecontributionstowardstravelofusersincaseoflackofexternalfunds.TheseitemscanvarysignificantlyacrossdifferenttypesofRIsbut,inanycase,theyrepresentactualcoststobereported.
Data Management, FAIR compliance, EOSC compliance result in significant costs for theimplementationofmetadataandmaintenanceofrepositoriesopentothereferenceusersand/ortothewiderpublicwhichmightexploit the interoperability.Suchcostsmay include:diskspace,computing power, networks, electric energy, specialised personnel (e.g., data stewards or datascientists);thesecostsareusuallyheavilydependentuponthenumberofusers.
5.3 PresentvalueofoperatingcostsSimilartoinvestmentcosts,operatingcostsmustbecalculatedalongtheentiretimehorizon
by reporting the total value of disbursement or in-kind contribution for each year of the timehorizonandforeachof themaincost items.Valueswillbeequal tozeroduringthedesignandconstructioncosts, then rampingupafter theopeningand startofoperationand finallyalmostconstantduringthefullcapacityphase.Thepresentvalueoftotaloperatingcostsiscalculatedasthesumofthediscountedandcapitalisedfinancialflowsofallthecostitemsfortheentiretimehorizon.

21
6. Annex:CasestudiesThecases included in thisannexareexamplesofdifferent typologiesofRIsandcoststructures.Theyaremeanttoprovidesuggestionsonhowtopresentthecostsandovercomingsomeofthemostcommonchallenges.ThecasestudiesareinspiredbyrealRIsbut,forobviousconfidentialityreasons, do not reflect their actual costs. They are however realistic examples reflecting – inproportion, evolution, apportionment and aggregation – reasonable estimates for the typologyandcoststructureconsidered.
ThecasesfollowthestructureoftheexceltemplateannexedtothepresentGuide.
Allcasesstartwithsettingthekey-parametersofaRI:
• Country:forthepropercomputationoftheappropriateinflationrate.• Baseyear,startdateandtimehorizon:forthesubsequentcomputationofdiscount
and/oractualization.• Capitalisationanddiscountrates:setalways,inthesecasestudies,attheratesof5%and
4%.Deviationsfromtheseparametersshouldbejustified.• Scaleandcurrencyshouldalsobemadeexplicit.
After setting the key-parameters, both investment and operating costs are presented. In thesecases,theexcerptsofthetablesalwaysrefertototalasdiscountedtotal.Finally,acostoverviewispresented.
6.1 Asingle-sitedRIinoperationThecasepresentedherecanbethoughtasastandardcasewithlowlevelofcomplexity.Itisthecaseofasingle-sitedRIinoperation.Thekeyparametersaresetasfollows:
The investment costs include all the relevant costs along the entire life-cycle: from design andconstruction, the foreseenupdate anddecommissioning. Theoperating costs followa standardstructure,witha ramp-upphase followedbya stabilisationofpricesanda little increaseat thetimeoftheforeseenmajorupgrade.

22
Table1Investmen
tand
ope
ratin
gcostso
fasingle-site
dRI-EU
Rmillion,nom
inalnotdisc
ounted
To
t.(disc
ounted
,EU
R20
18)
2006
20
07
2008
20
09
2010
20
11
2012
20
13-201
620
17
2018
20
19-202
520
26
Desig
nan
dpreparation
17.92
1.30
1.50
2.15
3.00
2.00
Physicalassets
13.01
1.00
1.20
1.50
2.00
1.50
Non
-physic
alassets
6.50
0.50
0.60
0.75
1.00
0.75
Person
nel
14.97
0.80
1.20
1.40
2.00
1.70
1.00
1.20
Majorupg
rade
4.62
2.00
2.50
Decommiss
ioning
2.19
3.00
Initialin
vestmen
tcosts
59.22
3.60
4.50
5.80
8.00
5.95
3.00
3.70
3.00
Replacem
entcosts
1.53
0.3
0.5
0.1
Totalinv
estm
entcosts
60.75
3.60
4.50
5.80
8.00
5.95
0.3
3.50
3.70
0.1
3.00
Resid
ualvalue
4.38
-6
Person
nel
27.11
1.20
1.40
1.60
1.90
1.90
1.90
0.90
Training
6.75
0.20
0.30
0.40
0.50
0.50
0.50
0.20
Utilities
5.41
0.20
0.25
0.30
0.40
0.40
0.40
0.20
Consum
ables
5.41
0.20
0.25
0.30
0.40
0.40
0.40
0.20
Usersup
port
8.77
0.10
0.30
0.50
0.70
0.70
0.70
0.30
Datam
anag
ement
0.81
0.05
0.05
0.05
0.05
0.05
0.05
0.05
Totalo
peratin
gcosts
54.25
1.95
2.55
3.15
3.95
3.95
3.95
1.85

23
Anoverviewoftotalcostsisprovidedbelow:
EUR Millionatbaseyear(2018)
Totaloperatingcosts,discountedYearlyoperatingcostsinthelastyearoftimehorizon
Totalinvestmentcosts,discountedResidualvalue,notdiscountedResidualvalue,discountedTotaloperatingcosts,notdiscounted
1.85
6.004.38
Totalinvestmentcosts,notdiscounted60.75
54.4854.25
42.32

24
6.2 AdistributedRIinoperationThis is the case of a distributedRI, including both national nodes and local sub-nodes. The keyparametersaresetasfollows:
Investment and operating costs can be presented aggregated per central hub and nationalnode(s). Investment costs are incurred up to 2013; from 2014 there are only operating costs.Operatingcostsincreaseuntiltheystabilizeaftertheramp-upphase.

25
Table2Investmen
tand
ope
ratin
gcostso
fadistrib
uted
RI-EUR
thou
sand
,nom
inalnotdisc
ounted
To
t.(disc
ounted
,EU
R20
18)
2007
20
08-
2011
20
12
2013
20
14
2015
20
16
2017
20
18
2019
…
2047
Centralhub
18
,455
12
8
1,78
2
1,78
2
1,78
2
Non-ph
ysica
lasset
5,68
4
80
540
540
540
Desig
n
1,70
5
24
162
162
162
In-kind
11,066
24
1,08
0
1,08
0
1,08
0
….
Node
Cou
ntry1
1,72
4
62
120
120
240
Node
coun
try2
743
33
55
55
90
Totalinvestm
entcosts
20,923
22
3
1,95
72,11
2
2,13
4
Resid
ualvalue
-1,500
Centralhub
18
6,23
5
1,00
1
2,00
92,92
2
4,46
19,55
3
9,70
7
9,70
7
9,70
7
Node
Cou
ntry1
144,33
2
775
1,55
7
2,26
4
3,45
7
7,40
37,52
2
7,52
2
7,52
2
Node
coun
try2
59’537
32
064
2
934
1,42
6
3,05
4
3,10
3
3,10
3
3,10
3
Totalope
ratin
gcosts
390,10
3
2,09
7
4,20
8
6,12
1
9,34
4
20,011
20
,333
20
,333
20
,333

26
Anoverviewofthetotalcostsisprovidedbelow:
EUR thousandatbaseyear(2018)
Totaloperatingcosts,discountedYearlyoperatingcostsinthelastyearoftimehorizon
Totalinvestmentcosts,discountedResidualvalue,notdiscountedResidualvalue,discountedTotaloperatingcosts,notdiscounted
20,333
1,500481
Totalinvestmentcosts,notdiscounted
390,103
14,38120,923
632,144

27
6.3 Anupgradeofanexistingsingle-sitedfacilityThis is the caseof a single-sitedRI; the case consideredhere concernsamajorupgradeof aRIexisting for over 50 years. Thismeans that the scope of the costing exercise is not the RI as awhole but the incremental scenario of the upgrade as compared to a business as usual (BAU)scenario.Themainchallengeshereconcerntheidentificationofaproperunitofanalysisandtherelatedtimehorizon. Indeterminingtheproperunitofanalysisapportionmentexercisesshouldbepossiblymade:forestimatingthecostofupgradeitwillbenecessarytoidentifyandapportiontherelatedcostsfrombalancesheetswhicharerelatedtotheentireRI.Itisinsteadessentialtoconsider only those costs which correspond to the incremental scenario with respect to thecounterfactual,i.e.,thebusinessasusual.Themainchallengeisthusto“isolate”theincremental,asshowedinthefigurebelow.
Figure5Upgradescenariovs.BAUscenario
Ofcoursethishasalsoaninfluenceonthetimehorizon;forinstance,inthecaseconsidered,eveniftheRIwasfoundedinthe1960sthebaseyearshouldrelatetotheupgrade–hence,itissetatyear 2000. It is not always straightforward to identify the correct base year as it is likely thatdifferent upgrading optionswere taken into considerations at differentmoments. Design costsshouldbeconsideredsunkcosts if theyarebornealso for thoseupgradeswhichare finallynotimplemented.
Thefollowingtablecontainsthekey-parametersasidentifiedperthecaseconsidered.
INCREM
ENTALSCEN
ARIO

28
Thetablebe
lowsh
owsthe
investmen
tcostsofa
majorupgrade
ofa
single-site
dRI.Itisw
orthnotingthatitisverylikelythatinth
efirstyearsth
eop
eratingcostsw
ouldberatherstable,beforetheup
gradeisfullyim
plem
ented,fo
llowingbyaru
mp-up
phaseand
thusastabilizatio
n.
Table3Investmen
tand
ope
ratin
gcostofa
single-site
dRIwith
am
ajorupgrade
-EUR
thou
sand
,nom
inalnotdisc
ounted
To
t.(disc
ounted
,EU
R20
18)
2000
20
01
2002
-202
120
22
2023
20
24
2025
20
26
2027
20
28-
2032
20
33
Desig
nan
dpreparation
2,31
9
172
237
Fixedassets
19,183
17
223
7…
900
800
ITassets
17,630
86
11
9…
2,70
02,40
0
Equipm
ent
51,726
17
223
7…
3,60
03,20
0
Person
nel
69,357
25
835
6…
900
800
IPRs
17,630
86
11
9…
900
800
Decommiss
ioning
22
,211
40
,000
Total
investmen
tcosts
200,05
7
946
946
…
9,00
0
8,00
0
40
,000
Consum
ables
992
10
0.0
100.0
100.0
100.0
115.5
127.1
139.8
97.9
Training
expenses
496
50
.0
50.0
50.0
50.0
57.8
63.5
69.9
48.9
Maintenan
ce
1,98
3
20
0.0
200.0
200.0
200.0
231.0
254.1
279.5
195.7
Administratio
n69
4
70
.0
70.0
70.0
70.0
80.9
88.9
97.8
68.5
Locatio
nrent
2,97
5
30
0.0
300.0
300.0
300.0
346.5
381.2
419.3
293.5
Person
nel
992
10
0.0
100.0
100.0
100.0
115.5
127.1
139.8
97.9
Totalo
peratin
gcosts
8,13
1
820
820
820
861
947
1,04
2
1,14
680
2

29
Asummarytablewithoverviewofinvestmentandoperatingcostsisprovidedbelow:
EUR thousandatbaseyear(2018)
200,057
11,8438,131
170,919
802
00
Totalinvestmentcosts,notdiscounted
Totaloperatingcosts,discountedYearlyoperatingcostsinthelastyearoftimehorizon
Totalinvestmentcosts,discountedResidualvalue,notdiscountedResidualvalue,discountedTotaloperatingcosts,notdiscounted

30
6.4 AdistributedRIinoperationThisisthecaseofadistributedRIinfrastructure,whosecentralhubisbasedinGermany.
TheparticularityofthisRIisthatitdoesnotfollowastandardcost-structurebutawave-likecoststructure (see Figure 3). One main challenge of this approach is to identify which are theinvestmentcostsandwhicharetheoperatingcosts.Indeed,differentlyfromwhathappenswithRIs with a standard cost-structure, the investment costs are incurred for each of the waves –hence,duringtheentirelife-cycleoftheRI.Inthisparticularcaseinvestmentandoperatingcostsspanoverthesametimehorizon.Inparticular,forthecaseconsideredhere,thephasesofdesign,preparation,andconstructionareconsideredtobepartoftheinvestmentcostsasreportedinthetablebelow.AnotherchallengeistheallocationofthecostsbetweenthecostsrelatedtothecoreoperationsoftheRI(thesurvey,inourcase),typicallycarriedoutbythenationalnodes,andthecostsrelatedtotheinternationalcoordination(bornebythecentralhub).

31
Table4Investmen
tand
ope
ratin
gcosts-Distrib
uted
RIw
ithwave-likecoststructure-E
URm
illion,nom
inalnotdisc
ounted
To
t.(disc
ounted
,EU
R20
18)
2002
20
03
2004
20
05
2006
20
07
2008
20
09-
2021
20
22
2023
Int.Co
ordina
tion
77.8
1.29
9
1.29
9
1.29
9
2.63
5
1.45
9
2.96
1
1.84
2
…
2.06
5
4.19
4
Desig
n65
.6
1.06
1
1.06
1
1.06
1
2.15
3
1.15
5
2.34
5
1.53
0
…
1.81
6
3.68
7
Preparation
5.3
0.11
9
0.11
9
0.11
9
0.24
1
0.15
2
0.30
8
0.15
6
…
0.08
2
0.16
7
Constructio
n6.8
0.11
9
0.11
9
0.11
9
0.24
1
0.15
2
0.30
8
0.15
6
…
0.16
7
0.34
0
Wav
es
130.0
0.85
5
0.85
5
0.85
5
1.73
6
0.61
8
1.25
5
0.64
6
…
6.22
0
12.629
Desig
n14
.0
0.21
4
0.21
4
0.21
4
0.43
5
0.28
4
0.57
7
0.28
8
…
0.40
6
0.82
5
Preparation
0.6
0.01
3
0.01
3
0.01
3
0.02
7
0.01
7
0.03
4
0.01
7
…
0.00
9
0.01
9
Constructio
n11
5.5
0.62
8
0.62
8
0.62
8
1.27
4
0.31
7
0.64
4
0.34
1
…
5.80
5
11.785
Totalinv
estm
entcosts
208.80
2.15
2.15
2.15
4.37
2.08
4.22
2.49
…
8.29
16
.82
Resid
ualvalue
1.03
1.2
Int.Co
ordina
tion
12.3
0.16
9
0.34
4
0.16
9
0.34
4
0.21
7
0.44
0
0.22
3
…
0.36
1
0.73
2
Waves
4.4
0.06
2
0.06
2
0.06
2
0.12
7
0.08
4
0.17
0
0.08
4
…
0.13
5
0.27
5
Totalo
peratin
gcosts
16.6
0.23
2
0.40
6
0.23
2
0.47
0
0.30
0
0.61
0
0.30
7
…
0.49
6
1.00
7

32
Thefinaltableshowsthemostrelevantsummaryinformationoftheanalysis.
EUR Millionatbaseyear(2018)
207.8
12.216.6
166.8
1.0
1.21.0
Totalinvestmentcosts,notdiscounted
Totaloperatingcosts,discountedYearlyoperatingcostsinthelastyearoftimehorizon
Totalinvestmentcosts,discountedResidualvalue,notdiscountedResidualvalue,discountedTotaloperatingcosts,notdiscounted

33
Glossary
Apportionment Thedivisionorsplitofresources(costsand/orpersonormachine-time)amongdifferent legalentitiesorprojectsaccordingtotheirproportionofactualuse.
Baseyear The point-in-time of the analysis, which serves as a base for financialcomputations.Itisthereferenceyearfortheanalysis,i.e.ex-ante,mid-term,ex-post.
Businessasusual Aninertialscenarioassumingnochangeintheoperation.
Capitalisation Theprocessofdetermining thepresent valueofpast flows (backwardperspective),adjustingforaproperfinancialcapitalisationrate.
Cashflow Theamountofmoneytransferredin-orout.
Currentprice Thecurrentprice,alsoknownasthenominalvalue,isthepriceatwhichgoodsandservicesaresold inthemarket.Differentlyfromrealprices,nominalpricesincludeinflation.
Constantprice Constantpricesareawayofmeasuringtherealvalueofagoodand/orservice. A year is chosen as the base year. For any subsequent ordifferentyear,thevalueofthegood/serviceismeasuredusingthepricelevelofthebaseyear,regardlessofvariationsintheinflationindex.
Counterfactual The scenario thatdescribeswhatwouldhappen in theabsenceof theproject/RI.
Deflating The action of changing current (nominal) prices into real (constant)pricesbyremovingtheeffectofpricechange.
Discountrate Theinterestrateusedtodiscountfuturecashvaluestodeterminetheirpresentvalue
Discounting The process of determining the present value of future cash flows(forwardperspective),adjustingforaproperdiscountrate
Do-minimum A scenario assuming only planned or committed minor futureinvestmentsneededtokeepunchangedthecurrentperformanceortoperformsmallimprovementoftheproject/RI.
In-kindcontribution Non-cash contribution provided by a legal entity (e.g. in terms ofpersonnel or machine time, supply of equipment, services, buildings,etc.)
Inflation Therateatwhichtheaveragepricelevelofabasketofselectedgoodsandservicesinaneconomyincreasesoveraperiodoftime.Itisaproxyoftheincreaseofthegeneral levelofprices.Realpricesareconvertedintocurrentonesbyaddinginflationtotheformer,andviceversa.
NetPresentValue The difference between the present value of inflows and the presentvaluesofoutflowsinagivenperiodoftime.
Presentvalue The capitalised or discounted value of a past or future cash flow at agivencapitalisationordiscountrate.