guidelines for the measurement of ambient air …mahenvis.nic.in/pdf/report/report_epm_naaqms...
TRANSCRIPT

Guidelines for the Measurement of Ambient Air Pollutants
Volume-I
CENTRAL POLLUTION CONTROL BOARDMinistry of Environment & Forests
Website: http://www.cpcb.nic.in
Guidelines forManual
Sampling & Analyses
National Ambient Air Quality Series:NAAQMS/36/2012-13

Guidelines for the Measurement of Ambient Air Pollutants
Volume-I
CENTRAL POLLUTION CONTROL BOARDMinistry of Environment & Forests Parivesh Bhawan, East Arjun Nagar, Delhi- 110032
Website: http://www.cpcb.nic.in
Guidelines forManual
Sampling &Analyses
National Ambient Air Quality Series:NAAQMS/36/2012-13

Prepared & Published by P R Division, Central Pollution Control Board on behalf ofSh. J. S. Kamyotra, Member Secretary, CPCB
Printing Supervision and Layout : Shri G. Ganesh, Ms. Anamika Sagar and Shri Satish Kumar
Printed at Viba Press Pvt. Ltd.C-66/3, Okhla Industrial Area, Phase-II, New Delhi-110020
CPCB, 300 Copies, 2013

i
Contribution
Overall Guidance & Supervision
Sh. J. S. Kamyotra
Dr. D. Saha
Laboratory experiments & Drafting of Guidelines
Air Laboratory Dr. D. Saha
Dr. S. K. Tyagi
Sh. A. K. Sen
Dr. R. C. Srivastava
Sh. A. Pathak
Sh. M. Satheesh
Sh. Ramesh Chand
Ms. Shaveta Kohli
Instrumentation Laboratory Dr. Somendra Singh
Sh. B. K. Jena
Data Formats Dr. D. Saha
Dr. R. C. Srivastava
Sh. M. Satheesh
Editing, Charts & Computer Setting Dr. D. Saha
Sh. Fasiur Rehman
Ms. Shaveta Kohli

Background
Guidelines for Sampling and Measurement of notified Ambient Air Quality Parameters (NAAQS 2009)
Under the provisions of the Air (Prevention & Control of Pollution) Act, 1981, the CPCB has notified fourth version of National Ambient Air Quality Standards (NAAQS) in 2009. This revised national standard aims to provide uniform air quality for all, irrespective of land use pattern, across the country. There are 12 identified health based parameters, which are to measure at the national level and with a view to have data comparison, need for uniform guidelines for monitoring, sampling, analyses, sample flow chart, data sheet based on standard method has been felt.
The methods prescribed in the notification for respective parameters are the combination of physical method, wet-chemical method and continuous on-line method. Therefore, to meet the NAAQS requirement, a combination of both manual and continuous method is invariably required at each monitoring location, besides good laboratory set up and infrastructure.
In addition to the above, an in house exercise for applicability of all prescribed / recommended analytical methods was also felt necessary. After review and demonstration in the Central Laboratory, Delhi, guidelines are being prepared and documented, as under:
1. Volume -I: Guidelines for manual sampling and analyses (along with sample flow chart and data sheets);
2. Volume-II: Guidelines for continuous sampling and real time analyses
ii
NATIONAL AMBIENT AIR QUALITY STANDARDS (2009)
Pollutants
Time Weighted
Average
Concentration in Ambient Air
Methods of Measurement
Industrial, Residential, Rural and
other Areas
Ecologically Sensitive Area
(Notified by Central
Government)
Sulphur Dioxide
(SO2), µg/m3
Annual *
24 Hours **
50
80
20
80
-Improved West and Gaeke Method-Ultraviolet Fluorescence
Nitrogen Dioxide (NO2), µg/m3
Annual *
24 Hours **
40
80
30
80
-Jacob & Hochheiser modified
(NaOH-NaAsO2) Method-Gas Phase Chemiluminescence
Particulate Matter
(Size less than 10µm)
or PM10, µg/m3
Annual *
24 Hours **
60
100
60
100
-Gravimetric
-TEOM
-Beta attenuation
Particulate Matter
(Size less than 2.5µm)
or PM2.5 , µg/m3
Annual *
24 Hours **
40
60
40
60
-Gravimetric
-TEOM
-Beta attenuation
Ozone (O3)
µg/m3
8 Hours *
1 Hour **
100
180
100
180
-UV Photometric
-Chemiluminescence
-Chemical Method
Lead (Pb)
µg/m3
Annual *
24 Hours **
0.50
1.0
0.50
1.0
-AAS/ICP Method after sampling on EPM 2000 or equivalent filter paper-ED-XRF using Teflon filter
Carbon Monoxide(CO), mg/m3
8 Hours **
1 Hour **
02
04
02
04
-Non dispersive Infrared (NDIR) Spectroscopy
Ammonia (NH3),
µg/m3
Annual *
24 Hours **
100
400
100
400
-Chemiluminescence
-Indophenol methodBenzene (C 6 H6),
µg/m3
Annual *
05
05
-Gas Chromatography (GC) based continuous analyzer
-Adsorption and desorption followed by GC analysis
Benzo(a)Pyrene (BaP) Particulate phase only, ng/m3
Annual *
01
01
-Solvent extraction followed by HPLC/GC analysis
Arsenic (As),
ng/m3
Annual *
06
06
-AAS/ICP Method after sampling on EPM 2000 or equivalent filter paper
Nickel (Ni),
ng/m3
Annual *
20
20
-AAS/ICP Method after sampling on EPM 2000 or equivalent filter paper
* Annual Arithmetic mean of minimum 104 measurements in a year at a particular site taken twice a week 24 hourly at uniform intervals.** 24 hourly or 8 hourly or 1 hourly monitored values, as applicable, shall be complied with 98% of the time in a year. 2% of the time, they may exceed the limits but not on two consecutive days of monitoring.
NOTE: Whenever and wherever monitoring results on two consecutive days of monitoring exceed the limits specified above for the respective category, it shall be considered adequate reason to institute regular or continuous monitoring and furtherinvestigations.
iii

iv v

iv v

Contents
S.No. Page
1. Guidelines for sampling and analysis of sulphur dioxide in ambient air (Imporved Westand Gaeke Method)
2. Guidelines for sampling and analysis of Nitrogen 7-10dioxide in ambient air (Modified Jacob and Hochheiser Method)
3. Guidelines for sampling and analysis of Particulate 11-14Matter (PM10) in ambient air (Gravimetric Method)
4. Guidelines for determination of PM2.5 in ambient air 15-30(Gravimetric Method)
5. Guidelines for sampling and analysis protocol for 31-34ozone in ambient air (Chemical Method)
6. Guidelines for sampling and analysis protocol for 35-39ammonia in ambient air (Indophenol Method)
7. Guidelines for sampling and Analysis of Benzo(a)pyrene & 40-47other PAHs in Ambient Air (Solvent Extraction & GC Analysis)
8. Guidelines for sampling and analysis of Lead, Nickel and Arsenic 48-55in ambient air (Atomic Absorption Spectrophotometer Method)
9. Data sheets A-P
1-6
vi 1
Guidelines for sampling and analysis of sulphur dioxide in ambient air (Improved West and Gaeke Method)
1. Purpose
The purpose of this protocol is to provide guidelines for monitoring and analysis of sulphur dioxide in ambient air.
2. Standard
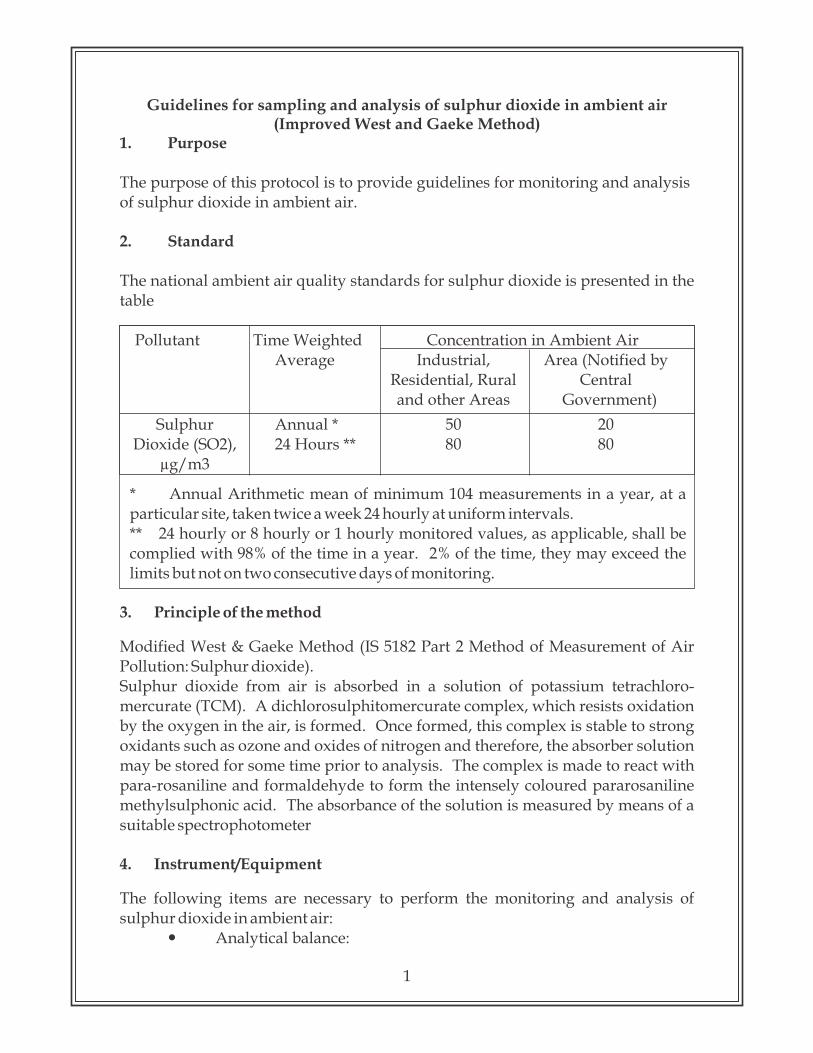
The national ambient air quality standards for sulphur dioxide is presented in the table
Pollutant Time Weighted Concentration in Ambient AirAverage Industrial, Area (Notified by
Residential, Rural Central and other Areas Government)
Sulphur Annual * 50 20Dioxide (SO2), 24 Hours ** 80 80
µg/m3
* Annual Arithmetic mean of minimum 104 measurements in a year, at a particular site, taken twice a week 24 hourly at uniform intervals.** 24 hourly or 8 hourly or 1 hourly monitored values, as applicable, shall be complied with 98% of the time in a year. 2% of the time, they may exceed the limits but not on two consecutive days of monitoring.
3. Principle of the method
Modified West & Gaeke Method (IS 5182 Part 2 Method of Measurement of Air Pollution: Sulphur dioxide).Sulphur dioxide from air is absorbed in a solution of potassium tetrachloro-mercurate (TCM). A dichlorosulphitomercurate complex, which resists oxidation by the oxygen in the air, is formed. Once formed, this complex is stable to strong oxidants such as ozone and oxides of nitrogen and therefore, the absorber solution may be stored for some time prior to analysis. The complex is made to react with para-rosaniline and formaldehyde to form the intensely coloured pararosaniline methylsulphonic acid. The absorbance of the solution is measured by means of a suitable spectrophotometer
4. Instrument/Equipment
The following items are necessary to perform the monitoring and analysis of sulphur dioxide in ambient air:
— Analytical balance:
Contents
S.No. Page
1. Guidelines for sampling and analysis of sulphur dioxide in ambient air (Imporved Westand Gaeke Method)
2. Guidelines for sampling and analysis of Nitrogen 7-10dioxide in ambient air (Modified Jacob and Hochheiser Method)
3. Guidelines for sampling and analysis of Particulate 11-14Matter (PM10) in ambient air (Gravimetric Method)
4. Guidelines for determination of PM2.5 in ambient air 15-30(Gravimetric Method)
5. Guidelines for sampling and analysis protocol for 31-34ozone in ambient air (Chemical Method)
6. Guidelines for sampling and analysis protocol for 35-39ammonia in ambient air (Indophenol Method)
7. Guidelines for sampling and Analysis of Benzo(a)pyrene & 40-47other PAHs in Ambient Air (Solvent Extraction & GC Analysis)
8. Guidelines for sampling and analysis of Lead, Nickel and Arsenic 48-55in ambient air (Atomic Absorption Spectrophotometer Method)
9. Data sheets A-P
1-6
vi 1
Guidelines for sampling and analysis of sulphur dioxide in ambient air (Improved West and Gaeke Method)
1. Purpose
The purpose of this protocol is to provide guidelines for monitoring and analysis of sulphur dioxide in ambient air.
2. Standard
The national ambient air quality standards for sulphur dioxide is presented in the table
Pollutant Time Weighted Concentration in Ambient AirAverage Industrial, Area (Notified by
Residential, Rural Central and other Areas Government)
Sulphur Annual * 50 20Dioxide (SO2), 24 Hours ** 80 80
µg/m3
* Annual Arithmetic mean of minimum 104 measurements in a year, at a particular site, taken twice a week 24 hourly at uniform intervals.** 24 hourly or 8 hourly or 1 hourly monitored values, as applicable, shall be complied with 98% of the time in a year. 2% of the time, they may exceed the limits but not on two consecutive days of monitoring.
3. Principle of the method
Modified West & Gaeke Method (IS 5182 Part 2 Method of Measurement of Air Pollution: Sulphur dioxide).Sulphur dioxide from air is absorbed in a solution of potassium tetrachloro-mercurate (TCM). A dichlorosulphitomercurate complex, which resists oxidation by the oxygen in the air, is formed. Once formed, this complex is stable to strong oxidants such as ozone and oxides of nitrogen and therefore, the absorber solution may be stored for some time prior to analysis. The complex is made to react with para-rosaniline and formaldehyde to form the intensely coloured pararosaniline methylsulphonic acid. The absorbance of the solution is measured by means of a suitable spectrophotometer
4. Instrument/Equipment
The following items are necessary to perform the monitoring and analysis of sulphur dioxide in ambient air:
— Analytical balance:

— Vacuum pump : Capable of maintaining an air pressure differential greater than 0.7 atmosphere at the desired flow rate
— Calibrated flow-measuring device to control the airflow from 0.2 to 1 l/min. — Absorber: all glass midget impinger — Spectrophotometer: Capable of measuring absorbance at 560 nm equipped with
1 cm path length cells.— Glass wares: low actinic glassware must be used for analysis
5. Reagents / Chemicals
All the chemicals should meet specifications of Analytical Reagent grade— Distilled water— Mercuric chloride— Potassium chloride / Sodium chloride— EDTA di sodium salt— Absorbing Reagent, 0.04 M Potassium Tetrachloro mercurate (TCM) - Dissolve
10.86 g, mercuric chloride, 0.066 g EDTA, and 6.0 g potassium chloride or 4.68 g sodium chloride in water and bring to the mark in a 1 litre volumetric flask. Caution : highly poisonous if spilled on skin, flush off with water immediately. The pH of this reagent should be approximately 4.0 but, it has been shown that there is no appreciable difference in collection efficiency over the range of pH 5 to pH 3. The absorbing reagent is normally stable for six months. If, a precipitate forms, discard the reagent after recovering the mercury.
— Sulphamic Acid (0.6%) - Dissolve 0.6 g sulphamic acid in 100 ml distilled water. Prepare fresh daily.
— Formaldehyde (0.2%) - Dilute 5 ml formaldehyde solution (36-38%) to 1 litre with distilled water. Prepare fresh daily.
— Purified Pararosaniline Stock Solution (0.2% Nominal) Dissolve 0.500 gm of specially purified pararosaniline (PRA) in 100 ml of distilled water and keep for 2 days (48 hours).
— Pararosaniline Working Solution - 10 ml of stock PRA is taken in a 250 ml volumetric flask. Add 15 ml conc. HCL and make up to volume with distilled water.
— Stock Iodine Solution (0.1 N) - Place 12.7 g iodine in a 250 ml beaker, add 40 g potassium iodide and 25 ml water. Stir until all is dissolved, then dilute to 1 litre with distilled water.
— Iodine Solution (0.01 N) - Prepare approximately 0.01 N iodine solution by diluting 50 ml of stock solution to 500 ml with distilled water.
— Starch Indicator Solution - Triturate 0.4 gm soluble starch and 0.002 g mercuric iodide preservative with a little water and add the paste slowly to 200 ml boiling water. Continue boiling until the solution is clear, cool, and transfer to a glass-stoppered bottle.
— Potassium iodate
2
— Stock Sodium Thiosulfate Solution (0.1 N) - Prepare a stock solution by placing 25 g sodium thiosulfate pentahydrate in a beaker, add 0.1 g sodium carbonate and dissolve using boiled, cooled distilled water making the solution up to a final volume of 1 litre. Allow the solution to stand one day before standardizing.
To standardize, accurately weigh to the nearest 0.1 mg, 1.5 g primary standard opotassium iodate dried at 180 C, dissolve, and dilute to volume in a 500 ml volumetric
flask. Into a 500 ml Iodine flask, transfer 50 ml of iodate solution by pipette. Add 2 g potassium iodide and 10 ml of N hydrochloric acid and stopper the flask. After 5 min, titrate with stock thiosulfate solution to a pale yellow. Add 5 ml starch indicator solution and continue the titration until the blue colour disappears. Calculate the normality of the stock solution.
— Sodium Thiosulphate Titrant (0.01 N) - Dilute 100 ml of the stock thiosulfate solution to 1 litre with freshly boiled and cooled distilled water.
— Standardized Sulphite Solution for Preparation of Working Sulphite-TCM Solution - Dissolve 0.30 g sodium metabisulphite (Na S O ) or 0.40 g sodium 2 2 5
sulphite (Na SO ) in 500 ml of recently boiled, cooled, distilled water. 2 3
Sulphite solution is unstable; it is, therefore, important to use water of the highest purity to minimize this instability. This solution contains the equivalent of 320-400 µg/ml of SO . 2
— Working Sulphite-TCM Solution - Measure 2 ml of the standard solution into a 100 ml volumetric flask by pipette and bring to mark with 0.04 M TCM. Calculate the concentration of sulphur dioxide in the working solution in micrograms of sulphur dioxide per millilitre. This solution is stable for 30
o odays if kept in the refrigerator at 5 C. If not kept at 5 C, prepare fresh daily.
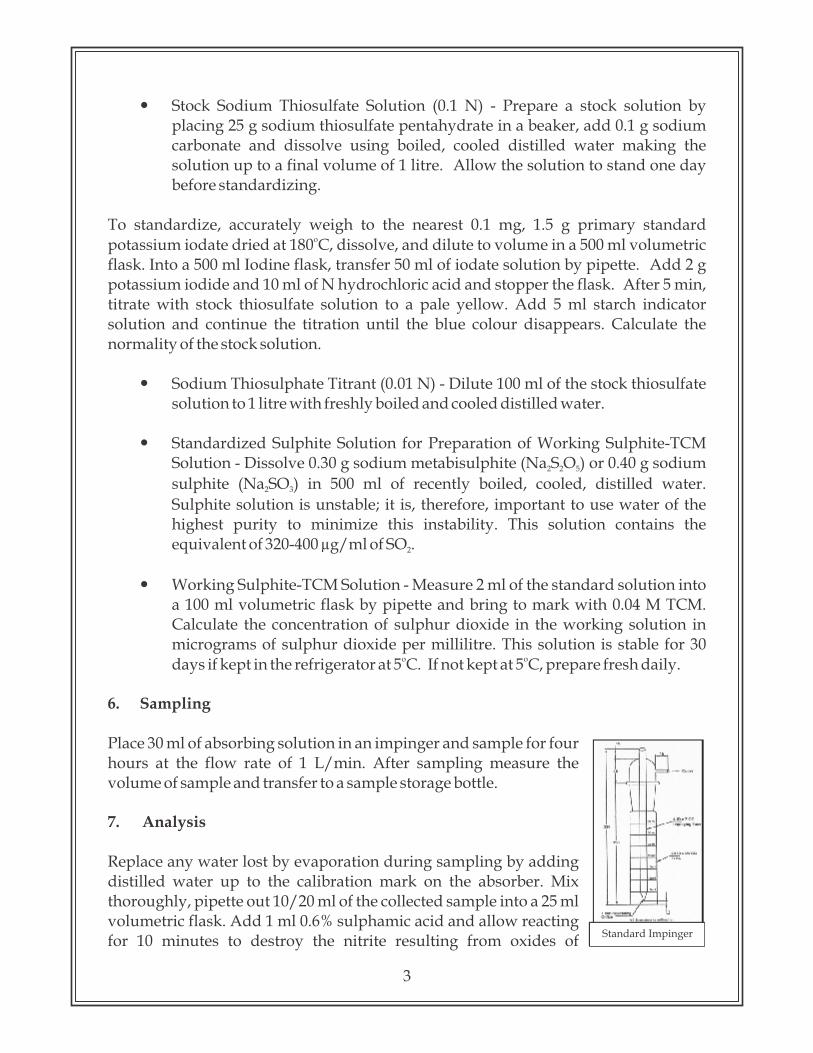
6. Sampling
Place 30 ml of absorbing solution in an impinger and sample for four hours at the flow rate of 1 L/min. After sampling measure the volume of sample and transfer to a sample storage bottle.
7. Analysis
Replace any water lost by evaporation during sampling by adding distilled water up to the calibration mark on the absorber. Mix thoroughly, pipette out 10/20 ml of the collected sample into a 25 ml volumetric flask. Add 1 ml 0.6% sulphamic acid and allow reacting for 10 minutes to destroy the nitrite resulting from oxides of Standard Impinger
3
— Vacuum pump : Capable of maintaining an air pressure differential greater than 0.7 atmosphere at the desired flow rate
— Calibrated flow-measuring device to control the airflow from 0.2 to 1 l/min. — Absorber: all glass midget impinger — Spectrophotometer: Capable of measuring absorbance at 560 nm equipped with
1 cm path length cells.— Glass wares: low actinic glassware must be used for analysis
5. Reagents / Chemicals
All the chemicals should meet specifications of Analytical Reagent grade— Distilled water— Mercuric chloride— Potassium chloride / Sodium chloride— EDTA di sodium salt— Absorbing Reagent, 0.04 M Potassium Tetrachloro mercurate (TCM) - Dissolve
10.86 g, mercuric chloride, 0.066 g EDTA, and 6.0 g potassium chloride or 4.68 g sodium chloride in water and bring to the mark in a 1 litre volumetric flask. Caution : highly poisonous if spilled on skin, flush off with water immediately. The pH of this reagent should be approximately 4.0 but, it has been shown that there is no appreciable difference in collection efficiency over the range of pH 5 to pH 3. The absorbing reagent is normally stable for six months. If, a precipitate forms, discard the reagent after recovering the mercury.
— Sulphamic Acid (0.6%) - Dissolve 0.6 g sulphamic acid in 100 ml distilled water. Prepare fresh daily.
— Formaldehyde (0.2%) - Dilute 5 ml formaldehyde solution (36-38%) to 1 litre with distilled water. Prepare fresh daily.
— Purified Pararosaniline Stock Solution (0.2% Nominal) Dissolve 0.500 gm of specially purified pararosaniline (PRA) in 100 ml of distilled water and keep for 2 days (48 hours).
— Pararosaniline Working Solution - 10 ml of stock PRA is taken in a 250 ml volumetric flask. Add 15 ml conc. HCL and make up to volume with distilled water.
— Stock Iodine Solution (0.1 N) - Place 12.7 g iodine in a 250 ml beaker, add 40 g potassium iodide and 25 ml water. Stir until all is dissolved, then dilute to 1 litre with distilled water.
— Iodine Solution (0.01 N) - Prepare approximately 0.01 N iodine solution by diluting 50 ml of stock solution to 500 ml with distilled water.
— Starch Indicator Solution - Triturate 0.4 gm soluble starch and 0.002 g mercuric iodide preservative with a little water and add the paste slowly to 200 ml boiling water. Continue boiling until the solution is clear, cool, and transfer to a glass-stoppered bottle.
— Potassium iodate
2
— Stock Sodium Thiosulfate Solution (0.1 N) - Prepare a stock solution by placing 25 g sodium thiosulfate pentahydrate in a beaker, add 0.1 g sodium carbonate and dissolve using boiled, cooled distilled water making the solution up to a final volume of 1 litre. Allow the solution to stand one day before standardizing.
To standardize, accurately weigh to the nearest 0.1 mg, 1.5 g primary standard opotassium iodate dried at 180 C, dissolve, and dilute to volume in a 500 ml volumetric
flask. Into a 500 ml Iodine flask, transfer 50 ml of iodate solution by pipette. Add 2 g potassium iodide and 10 ml of N hydrochloric acid and stopper the flask. After 5 min, titrate with stock thiosulfate solution to a pale yellow. Add 5 ml starch indicator solution and continue the titration until the blue colour disappears. Calculate the normality of the stock solution.
— Sodium Thiosulphate Titrant (0.01 N) - Dilute 100 ml of the stock thiosulfate solution to 1 litre with freshly boiled and cooled distilled water.
— Standardized Sulphite Solution for Preparation of Working Sulphite-TCM Solution - Dissolve 0.30 g sodium metabisulphite (Na S O ) or 0.40 g sodium 2 2 5
sulphite (Na SO ) in 500 ml of recently boiled, cooled, distilled water. 2 3
Sulphite solution is unstable; it is, therefore, important to use water of the highest purity to minimize this instability. This solution contains the equivalent of 320-400 µg/ml of SO . 2
— Working Sulphite-TCM Solution - Measure 2 ml of the standard solution into a 100 ml volumetric flask by pipette and bring to mark with 0.04 M TCM. Calculate the concentration of sulphur dioxide in the working solution in micrograms of sulphur dioxide per millilitre. This solution is stable for 30
o odays if kept in the refrigerator at 5 C. If not kept at 5 C, prepare fresh daily.
6. Sampling
Place 30 ml of absorbing solution in an impinger and sample for four hours at the flow rate of 1 L/min. After sampling measure the volume of sample and transfer to a sample storage bottle.
7. Analysis
Replace any water lost by evaporation during sampling by adding distilled water up to the calibration mark on the absorber. Mix thoroughly, pipette out 10/20 ml of the collected sample into a 25 ml volumetric flask. Add 1 ml 0.6% sulphamic acid and allow reacting for 10 minutes to destroy the nitrite resulting from oxides of Standard Impinger
3
nitrogen. Add 2 ml of 0.2% formaldehyde solution and 2 ml pararosaniline solution and make up to 25 ml with distilled water. Prepare a blank in the same manner using 10 ml of unexposed absorbing reagent. After a 30 min colour development interval and before 60 minutes, measure and record the absorbance of samples and reagent blank at 560 nm. Use distilled water; not the reagent blank, as the optical reference
8. Calibration
The actual concentration of the sulphite solution is determined by adding excess iodine and back titrating with standard sodium thiosulfate solution. To back-titrate, measure, by pipette, 50 ml of the 0.01 N iodine solution into each of two 500 ml iodine flasks A and B. To flask A (blank) add 25 ml distilled water and into flask B (sample) measure 25 ml sulphite solution by pipette. Stopper the flasks and allow to react for 5 minutes. Prepare the working sulphite-TCM solution at the same time iodine solution is added to the flasks. By means of a burette containing standardized 0.01 N thiosulfate, titrate each flask in turn to a pale yellow. Then add 5 ml starch solution and continue the titration until the blue colour disappears.
8.1. Preparation of Standards
Measure 0.5 ml, 1.0 ml, 1.5 ml, 2.0 ml, 2.5 ml, 3.0 ml, 3.5 ml and 4.0 ml of working sulphite TCM solution in 25 ml volumetric flask. Add sufficient TCM solution to each flask to bring the volume to approximately 10 ml. Then add the remaining reagents as described in the procedure for analysis. A reagent blank with 10 ml absorbing solution is also prepared. Read the absorbance of each standard and reagent blank
8.2. Standard Curve
Plot a curve absorbance (Y axis) versus concentration (X axis). Draw a line of best fit and determine the slope. The reciprocal of slope gives the calibration factor (CF).
9. Calculation
Concentration of sulphite solution: (V1-V2) x N x K
C = ________________ V
Where,C = SO concentration in µg/ml2
V1 = Volume of thiosulfate for blank, mlV2 = Volume of thiosulfate for sample, ml
4
N = Normality of thiosulfateK = 32000 (Milliequivalent weight SO2/µg)V = Volume of standard sulphite solution, ml
3C (SO µg/m )= (A - A ) x CF x V / V x V 2 s b s a t
Where,3C SO = Concentration of Sulphur dioxide, µg/m2
A = Absorbance of samples
A = Absorbance of reagent blankb
C = Calibration factor F3V = Volume of air sampled, ma
V = Volume of sample, mls
V = Volume of aliquot taken for analysis, mlt
10. Quality Control
Quality Control (QC) is the techniques that are used to fulfill requirements for quality. The QC procedures for the air sampling and monitoring sections of this protocol include preventative maintenance of equipment, calibration of equipment, analysis of field blanks and lab blanks.
11. Reference
IS 5182 Part 2 Method of Measurement of Air Pollution: Sulphur dioxide
5

FLOW CHART FOR MEASUREMENT OF SULPHUR DIOXIDE Place 30 ml of absorbing media in an impinger
Connect it to the gas-sampling
manifold of gas sampling device
(RDS/HVS).
Draw air at a sampling rate of 1 lpm for four hours
Check the volume of sample at the end of sampling and record it
Transfer the exposed samples in storage bottle and preserve
Prepare calibration graph as recommended in method
Take 10/20 ml. aliquot of sample in 25 ml. Vol. Flask
Take 10/20 ml. of unexposed sample in 25 ml. Vol. Flask (blank)
Add 1 ml Sulphamic acid. Keep it 10 minutes
Add 2 ml formaldehyde
Add 2 ml working PRA
Make up to mark (25 ml.) with distilled water.
Keep it 30 minutes for reaction
Set Zero of spectrophotometer with Distilled water
Measure absorbance at 560 nm
Calculate concentration using calibration graph
Calculate concentration of Sulphur dioxide in µg/m3
6
Guidelines for sampling and analysis of Nitrogen dioxide in ambient air(Modified Jacob and Hochheiser Method)
1. Purpose
The purpose of this protocol is to provide guidelines for monitoring of nitrogen dioxide in ambient.
2. Standard
The national ambient air quality standard for nitrogen dioxide is presented in the table:
* Annual Arithmetic mean of minimum 104 measurements in a year at a particular site taken twice a week 24 hourly at uniform intervals.** 24 hourly or 8 hourly or 1 hourly monitored values, as applicable, shall be complied with 98% of the time in a year. 2% of the time, they may exceed the limits but not on two consecutive days of monitoring.
3. Principle of the method
Modified Jacob & Hochheiser Method (IS 5182 Part 6 Methods for Measurement of Air Pollution: Oxides of nitrogen).Ambient nitrogen dioxide (NO ) is collected by bubbling air through a solution of 2
sodium hydroxide and sodium arsenite. The concentration of nitrite ion (NO ) 2
produced during sampling is determined colorimetrically by reacting the nitrite ion with phosphoric acid, sulfanilamide, and N-(1-naphthyl)-ethylenediamine di-hydrochloride (NEDA) and measuring the absorbance of the highly coloured azo-dye at 540 n m.
4. Instrument/Equipment
The following items are necessary to perform the monitoring and analysis of nitrogen dioxide in ambient air:
— Analytical balance:— Vacuum pump: Capable of maintaining a vacuum of at least 0.6 atmospheres
7
3080
Pollutant Time WeightedAverage
Concentration in Ambient AirIndustrial,
Residential, Rural and other Areas
Ecologically Sensitive Area (Notified by
Central Government)Nitrogen
dioxide (NO ), 2
µg/m3
Annual *24 Hours **
4080

across the flow control device. Flow control device capable of maintaining a constant flow of 200-1000 ml per minute through the sampling solution.
— Calibrated flow measuring device: To control the airflow from 0.2 to 1 l/min. — Absorber: a midget impinger — Spectrophotometer: Capable of measuring absorbance at 540 nm equipped
with 1 cm path length cells.— Glass wares: low actinic glassware must be used for analysis
5. Reagents / Chemicals
All the chemicals should meet specifications of ACS Analytical Reagent grade— Distilled water— Sodium hydroxide— Sodium Arsenite— Absorbing solution (Dissolve 4.0 g of sodium hydroxide in distilled water, add
1.0 g of sodium Arsenite, and dilute to 1,000 ml with distilled water)o— Sulphanilamide - Melting point 165 to 167 C
— N-(1-Naphthyl)-ethylenediamine Di-hydrochloride (NEDA) - A 1% aqueous solution should have only one absorption peak at 320 nm over the range of 260-400 nm. NEDA showing more than one absorption peak over this range is impure and should not be used
— Hydrogen Peroxide - 30%— Phosphoric Acid - 85%— Sulphanilamide Solution - Dissolve 20 g of sulphanilamide in 700 ml of
distilled water. Add, with mixing, 50 ml of 85% phosphoric acid and dilute to 1,000 ml. This solution is stable for one month, if refrigerated
— NEDA Solution - Dissolve 0.5 g of NEDA in 500 ml of distilled water. This solution is stable for one month, if refrigerated and protected from light
— Hydrogen Peroxide Solution - Dilute 0.2 ml of 30% hydrogen peroxide to 250 ml with distilled water. This solution may be used for one month, if, refrigerated and protected from light
— Sodium nitrite - Assay of 97% NaNO or greater2
— Sodium Nitrite stock solution (1000 µg NO /ml)2
— Sodium Nitrite solution (10 µg NO /ml.)2
— Sodium Nitrite working solution (1 µg NO /ml) (Dilute 2
with absorbing reagent, prepare fresh daily)
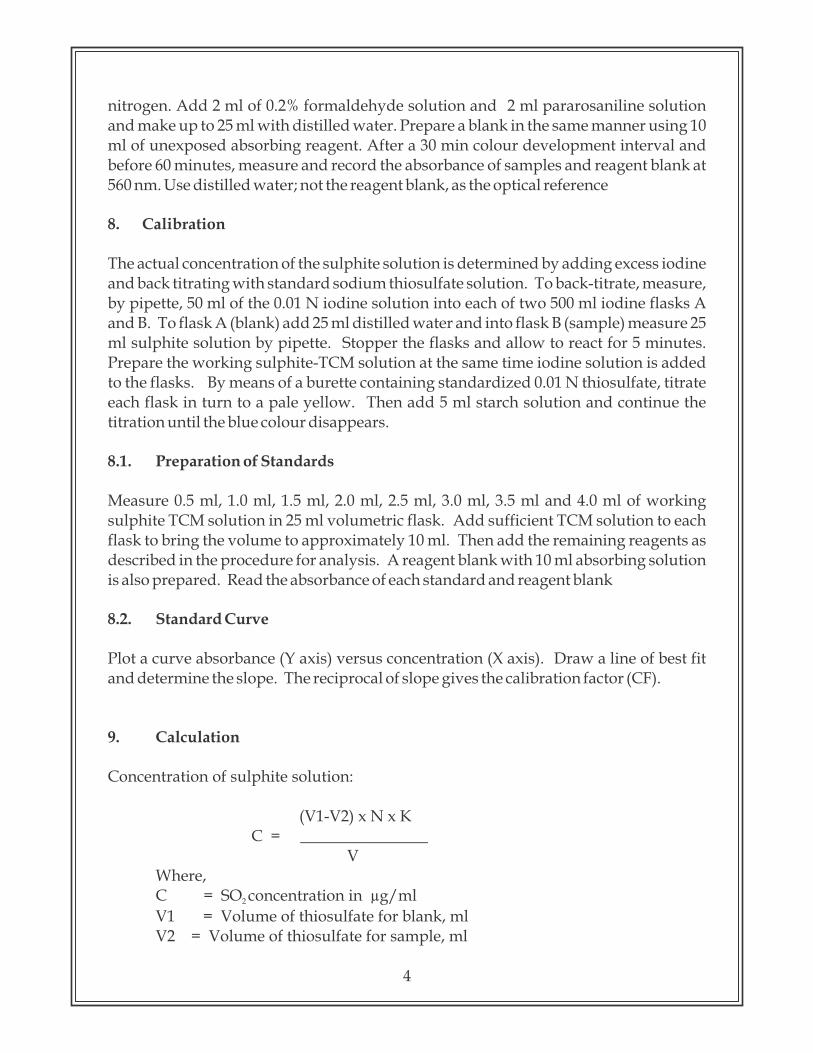
6. Sampling
Place 30 ml of absorbing solution in an impinger and sample for four hour at the flow rate of 0.2 to 1 L/min. After sampling measure the volume of sample and transfer to a sample storage bottle.
Standard Impinger
8
7. Analysis
Replace any water lost by evaporation during sampling by adding distilled water up to the calibration mark on the absorber, mix thoroughly.Pipette out 10 ml of the collected sample into a 50 ml volumetric flask. Pipette in 1 ml of hydrogen peroxide solution, 10 ml of sulphanilamide solution, and 1.4 ml of NEDA solution, with thorough mixing after the addition of each reagent and make up to 50 ml with distilled water.Prepare a blank in the same manner using 10 ml of unexposed absorbing reagent.After a 10 min colour development interval, measure and record the absorbance of samples and reagent blank at 540 nm.Use distilled water; not the reagent blank, as the optical referenceSamples with an absorbance greater than 1.0 must be re-analyzed after diluting an aliquot of the collected samples with an equal quantity of unexposed absorbing reagent.A randomly selected 5-10% of the samples should be re-analyzed as apart of an internal quality assurance program. 8. Calibration
8.1. Preparation of Standards
Pipette 1, 2, 3, 4, 5, 6, 7, 8, 9, 10, 12, 15 and 20 ml of working standard solution in to 50 ml volumetric flask. Fill to 20 ml mark with absorbing solution. A reagent blank with 10 ml absorbing solution is also prepared. Add reagents to each volumetric flask as in the procedure for analysis. Read the absorbance of each standard and reagent blank against distilled water reference.
8.2. Standard Curve:
Plot a curve absorbance (Y axis) versus concentration (X axis). Draw a line of best fit and determine the slope. The reciprocal of slope gives the calibration factor (CF).
9. Calculation3C (NO µg/m ) = (A - A ) x CF x V / V x V x 0.822 s b s a t
Where,3C NO = Concentration of Nitrogen dioxide, µg/m2
A = Absorbance of samples
A = Absorbance of reagent blankb
CF = Calibration factor 3V = Volume of air sampled, ma
V = Volume of sample, mls
V = Volume of aliquot taken for analysis, mlt
0.82 = Sampling efficiency
9
across the flow control device. Flow control device capable of maintaining a constant flow of 200-1000 ml per minute through the sampling solution.
— Calibrated flow measuring device: To control the airflow from 0.2 to 1 l/min. — Absorber: a midget impinger — Spectrophotometer: Capable of measuring absorbance at 540 nm equipped
with 1 cm path length cells.— Glass wares: low actinic glassware must be used for analysis
5. Reagents / Chemicals
All the chemicals should meet specifications of ACS Analytical Reagent grade— Distilled water— Sodium hydroxide— Sodium Arsenite— Absorbing solution (Dissolve 4.0 g of sodium hydroxide in distilled water, add
1.0 g of sodium Arsenite, and dilute to 1,000 ml with distilled water)o— Sulphanilamide - Melting point 165 to 167 C
— N-(1-Naphthyl)-ethylenediamine Di-hydrochloride (NEDA) - A 1% aqueous solution should have only one absorption peak at 320 nm over the range of 260-400 nm. NEDA showing more than one absorption peak over this range is impure and should not be used
— Hydrogen Peroxide - 30%— Phosphoric Acid - 85%— Sulphanilamide Solution - Dissolve 20 g of sulphanilamide in 700 ml of
distilled water. Add, with mixing, 50 ml of 85% phosphoric acid and dilute to 1,000 ml. This solution is stable for one month, if refrigerated
— NEDA Solution - Dissolve 0.5 g of NEDA in 500 ml of distilled water. This solution is stable for one month, if refrigerated and protected from light
— Hydrogen Peroxide Solution - Dilute 0.2 ml of 30% hydrogen peroxide to 250 ml with distilled water. This solution may be used for one month, if, refrigerated and protected from light
— Sodium nitrite - Assay of 97% NaNO or greater2
— Sodium Nitrite stock solution (1000 µg NO /ml)2
— Sodium Nitrite solution (10 µg NO /ml.)2
— Sodium Nitrite working solution (1 µg NO /ml) (Dilute 2
with absorbing reagent, prepare fresh daily)
6. Sampling
Place 30 ml of absorbing solution in an impinger and sample for four hour at the flow rate of 0.2 to 1 L/min. After sampling measure the volume of sample and transfer to a sample storage bottle.
Standard Impinger
8
7. Analysis
Replace any water lost by evaporation during sampling by adding distilled water up to the calibration mark on the absorber, mix thoroughly.Pipette out 10 ml of the collected sample into a 50 ml volumetric flask. Pipette in 1 ml of hydrogen peroxide solution, 10 ml of sulphanilamide solution, and 1.4 ml of NEDA solution, with thorough mixing after the addition of each reagent and make up to 50 ml with distilled water.Prepare a blank in the same manner using 10 ml of unexposed absorbing reagent.After a 10 min colour development interval, measure and record the absorbance of samples and reagent blank at 540 nm.Use distilled water; not the reagent blank, as the optical referenceSamples with an absorbance greater than 1.0 must be re-analyzed after diluting an aliquot of the collected samples with an equal quantity of unexposed absorbing reagent.A randomly selected 5-10% of the samples should be re-analyzed as apart of an internal quality assurance program. 8. Calibration
8.1. Preparation of Standards
Pipette 1, 2, 3, 4, 5, 6, 7, 8, 9, 10, 12, 15 and 20 ml of working standard solution in to 50 ml volumetric flask. Fill to 20 ml mark with absorbing solution. A reagent blank with 10 ml absorbing solution is also prepared. Add reagents to each volumetric flask as in the procedure for analysis. Read the absorbance of each standard and reagent blank against distilled water reference.
8.2. Standard Curve:
Plot a curve absorbance (Y axis) versus concentration (X axis). Draw a line of best fit and determine the slope. The reciprocal of slope gives the calibration factor (CF).
9. Calculation3C (NO µg/m ) = (A - A ) x CF x V / V x V x 0.822 s b s a t
Where,3C NO = Concentration of Nitrogen dioxide, µg/m2
A = Absorbance of samples
A = Absorbance of reagent blankb
CF = Calibration factor 3V = Volume of air sampled, ma
V = Volume of sample, mls
V = Volume of aliquot taken for analysis, mlt
0.82 = Sampling efficiency
9

10. Quality Control
Quality Control (QC) is the techniques that are used to fulfil requirements for quality. The QC procedures for the air sampling and monitoring sections of this protocol include preventative maintenance of equipment, calibration of equipment, analysis of field blanks and lab blanks.
11. Reference
IS 5182 Part 6 Methods for Measurement of Air Pollution: Oxides of Nitrogen
FLOW CHART FOR MEASUREMENT OF NITROGEN DIOXIDE
Place 30 ml of absorbing media in an impinger Connect it to the gas sampling manifold of gas sampling device
(RDS/HVS).
Draw air at a sampling rate of 1 lpm for four hours
Check the volume of sample at the end of sampling and record it
Transfer the exposed samples in storage bottle and preserve Prepare calibration graph as recommended in method
Take 10 ml. aliquot of sample in 50 ml. Vol. Flask
Take 10 ml. of unexposed sample in 50 ml. Vol. Flask (blank)
Add 1 ml hydrogen peroxide,
Add 10 ml sulphanilamide
Add 1.4 ml NEDA
Make up to mark (50 ml.) with distilled water.
Keep it 10 minutes for reaction
Set Zero of spectrophotometer with Distilled water
Measure absorbance at 540 nm
Calculate concentration using calibration graph
Calculate concentration of Nitrogen dioxide in µg/m3
10
Guidelines for sampling and analysis of Particulate Matter (PM ) in ambient air 10
(Gravimetric Method)1. Purpose
The purpose of this protocol is to provide guidelines for monitoring and analysis of Particulate Matter PM in ambient air. 10
2. Standard
The national ambient air quality standards for Particulate Matter PM is presented in 10
the table
3. Principle of the method
Air is drawn through a size-selective inlet and through a 20.3 X 25.4 cm (8 X 10 in) filter at a flow rate, which is typically 1132 L/min. Particles with aerodynamic diameter less than the cut-point of the inlet are collected, by the filter. The mass of these particles is determined by the difference in filter weights prior to and after sampling. The concentration of PM in the designated size range is calculated by dividing the weight 10
gain of the filter by the volume of air sampled.
4. Instrument/Equipment
The following items are necessary to perform the monitoring and analysis of Particulate Matter PM in ambient air:10
— Analytical balance:— Sampler : High Volume Sampler with size selective inlet for PM and 10
automatic volumetric flow control— Calibrated flow-measuring device to control the airflow at 1132 l/min. — Top loading orifice kit
* Annual Arithmetic mean of minimum 104 measurements in a year at a particular site taken twice a week 24 hourly at uniform intervals.** 24 hourly or 8 hourly or 1 hourly monitored values, as applicable, shall be complied with 98% of the time in a year. 2% of the time, they may exceed the limits but not on two consecutive days of monitoring.
Pollutant Time Weighted Average
Concentration in Ambient AirIndustrial,
Residential, Rural and other Areas
Ecologically Sensitive Area (Notified by
Central Government)Particulate
Matter, PM10, 3µg/m
Annual *24 Hours **
60100
60100
11

5. Reagents / Chemicals
Filter Media - A Glass fibre filter of 20.3 X 25.4 cm (8 X 10 in) size
6. Sampling
Field Sampling - Tilt back the inlet and secure it according to manufacturer's instructions. Loosen the faceplate wing nuts and remove the faceplate. Remove the filter from its jacket and centre it on the support screen with the rough side of the filter facing upwards. Replace the faceplate and tighten the wing nuts to secure the rubber gasket against the filter edge. Gently lower the inlet. For automatically flow-controlled units, record the designated flow rate on the data sheet. Record the reading of the elapsed time meter. The specified length of sampling is commonly 8 hours or 24 hours. During this period, several reading (hourly) of flow rate should be taken.After the required time of sampling, record the flow meter reading, take out the filter media from the sampler, and put in a container or envelope.
PM Sampler (Impaction Inlet) PM Sampler (Cyclonic Inlet)10 10
7. Analysis
Filter inspection: Inspect the filter for pin holes using a light table. Loose particles should be removed with a soft brush. Apply the filter identification number or a code to the filter if it is not a numbered. Condition the filter in conditioning room maintained within 20-30°C and 40-50% relative humidity or in an airtight desiccator for 24 hours. Take initial weight of the filter paper (Wi) before sampling. Condition the filter after sampling in conditioning room maintained within 20-30°C and 40-50% relative humidity or in an airtight desiccator for 24 hours. Take final weight of the filter paper (Wf)
12
8. Calibration
Periodical calibration of the sampler is being done by Orifice Transfer Standard - The PM sampler calibration orifice consists of a 3.175 cm (1.25 in) diameter hole in the end 10
cap of 7.62 cm (3 in) diameter by 20.3 cm (8 in) long hollow metal cylinder. This orifice is mounted tightly to the filter support in place of the inlet during calibration. A small tap on the side of the cylinder is provided to measure the pressure drop across the orifice. A flow rate of 1132 L/min through the orifice typically results in a pressure difference of several inches of water. The relationship between pressure difference and flow rate is established via a calibration curve derived from measurements against a primary standard such as a Roots meter at standard temperature and pressure. Flow resistances that simulate filter resistances are introduced at the end of the calibrator opposite the orifice by a set of perforated circular disks.
Top loading Orifice kit Calibration set up
9. Calculation
3 6C PM µg/m = (Wf - Wi) x 10 / V10
Where,3C PM = Concentration of PM , µg/m10 10
Wf = Initial weight of filter in gWi = Initial weight of filter in g
610 = Conversion of g to µg3V = Volume of air sampled, m
10. Quality Control
Quality Control (QC) is the techniques that are used to fulfill requirements for quality. The QC procedures for the air sampling and monitoring sections of this protocol
13
include preventative maintenance of equipment, calibration of equipment, analysis of field blanks and lab blanks.
11. Reference
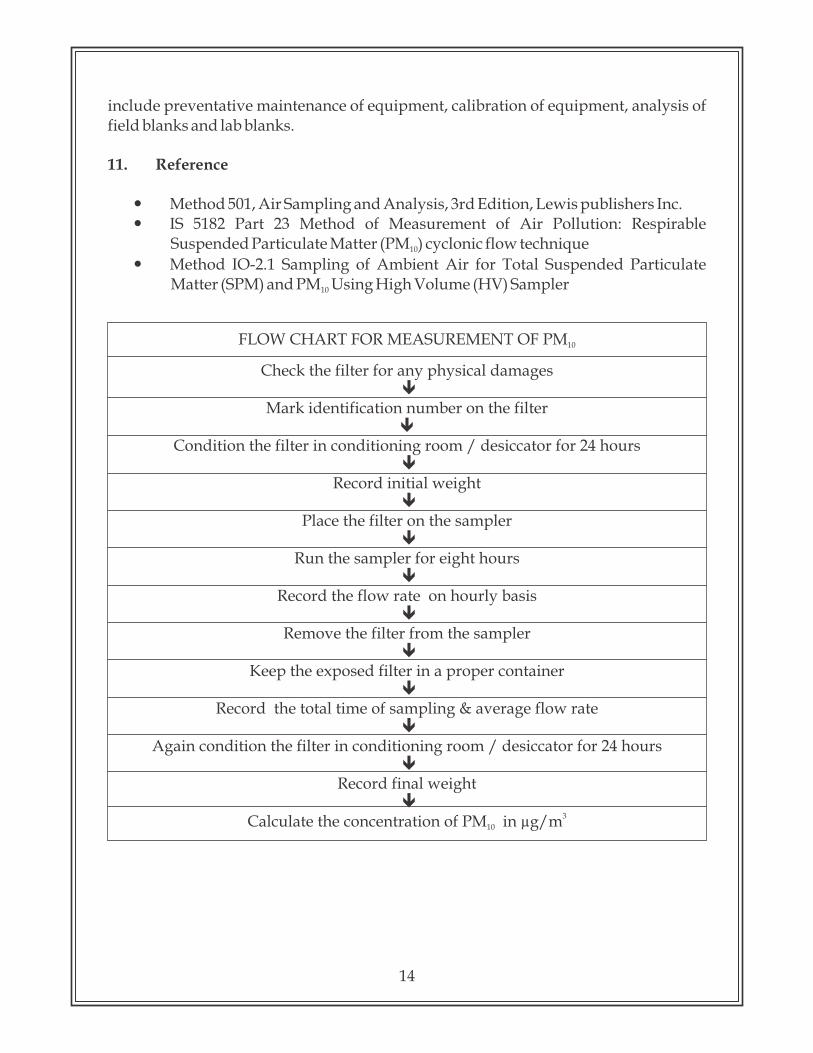
— Method 501, Air Sampling and Analysis, 3rd Edition, Lewis publishers Inc.— IS 5182 Part 23 Method of Measurement of Air Pollution: Respirable
Suspended Particulate Matter (PM ) cyclonic flow technique10
— Method IO-2.1 Sampling of Ambient Air for Total Suspended Particulate Matter (SPM) and PM Using High Volume (HV) Sampler10
FLOW CHART FOR MEASUREMENT OF PM 10
Check the filter for any physical damages ê
Mark identification number on the filterê
Condition the filter in conditioning room / desiccator for 24 hours ê
Record initial weight ê
Place the filter on the sampler ê
Run the sampler for eight hours ê
Record the flow rate on hourly basis ê
Remove the filter from the sampler ê
Keep the exposed filter in a proper container ê
Record the total time of sampling & average flow rate ê
Again condition the filter in conditioning room / desiccator for 24 hours ê
Record final weight ê
3Calculate the concentration of PM in µg/m10
14
Guidelines for determination of PM in ambient air (Gravimetric Method)2.5
1. Purpose
The purpose of this protocol is to provide guidelines for monitoring and analysis of Particulate Matter PM in ambient air. 2.5
2.0 Definition
PM refers to fine particles that are 2.5 micrometers (µm) or smaller in diameter. 2.5
Ambient air is defined as any unconfined part of the Earth's atmosphere, that the surrounding outdoor air in which humans and other organisms live and breathe.FRM - Federal Reference MethodFEM - Federal Equivalent Method
3.0 Standard
4.0 Principle
An electrically powered air sampler draws ambient air at a constant volumetric flow rate (16.7 lpm) maintained by a mass flow / volumetric flow controller coupled to a microprocessor into specially designed inertial particle-size separator (i.e. cyclones or impactors) where the suspended particulate matter in the PM size ranges is separated 2.5
for collection on a 47 mm polytetrafluoroethylene (PTFE) filter over a specified sampling period. Each filter is weighed before and after sample collection to determine the net gain due to the particulate matter. The mass concentration in the ambient air is computed as the total mass of collected particles in the PM size ranges divided by the 2.5
actual volume of air sampled, and is expressed in µg/m . The microprocessor reads averages and stores five-minute averages of ambient temperature, ambient pressure,
3
4060
Particulate Matter, PM , 2.5
3µg/m
Annual *24 Hours **
4060
* Annual Arithmetic mean of minimum 104 measurements in a year at a particular site taken twice a week 24 hourly at uniform intervals.** 24 hourly or 8 hourly or 1 hourly monitored values, as applicable, shall be complied with 98% of the time in a year. 2% of the time, they may exceed the limits but not on two consecutive days of monitoring.
Pollutant Time Weighted Average
Concentration in Ambient AirIndustrial,
Residential, Rural and other Areas
Ecologically Sensitive Area (Notified by
Central Government)
15

include preventative maintenance of equipment, calibration of equipment, analysis of field blanks and lab blanks.
11. Reference
— Method 501, Air Sampling and Analysis, 3rd Edition, Lewis publishers Inc.— IS 5182 Part 23 Method of Measurement of Air Pollution: Respirable
Suspended Particulate Matter (PM ) cyclonic flow technique10
— Method IO-2.1 Sampling of Ambient Air for Total Suspended Particulate Matter (SPM) and PM Using High Volume (HV) Sampler10
FLOW CHART FOR MEASUREMENT OF PM 10
Check the filter for any physical damages ê
Mark identification number on the filterê
Condition the filter in conditioning room / desiccator for 24 hours ê
Record initial weight ê
Place the filter on the sampler ê
Run the sampler for eight hours ê
Record the flow rate on hourly basis ê
Remove the filter from the sampler ê
Keep the exposed filter in a proper container ê
Record the total time of sampling & average flow rate ê
Again condition the filter in conditioning room / desiccator for 24 hours ê
Record final weight ê
3Calculate the concentration of PM in µg/m10
14
Guidelines for determination of PM in ambient air (Gravimetric Method)2.5
1. Purpose
The purpose of this protocol is to provide guidelines for monitoring and analysis of Particulate Matter PM in ambient air. 2.5
2.0 Definition
PM refers to fine particles that are 2.5 micrometers (µm) or smaller in diameter. 2.5
Ambient air is defined as any unconfined part of the Earth's atmosphere, that the surrounding outdoor air in which humans and other organisms live and breathe.FRM - Federal Reference MethodFEM - Federal Equivalent Method
3.0 Standard
4.0 Principle
An electrically powered air sampler draws ambient air at a constant volumetric flow rate (16.7 lpm) maintained by a mass flow / volumetric flow controller coupled to a microprocessor into specially designed inertial particle-size separator (i.e. cyclones or impactors) where the suspended particulate matter in the PM size ranges is separated 2.5
for collection on a 47 mm polytetrafluoroethylene (PTFE) filter over a specified sampling period. Each filter is weighed before and after sample collection to determine the net gain due to the particulate matter. The mass concentration in the ambient air is computed as the total mass of collected particles in the PM size ranges divided by the 2.5
actual volume of air sampled, and is expressed in µg/m . The microprocessor reads averages and stores five-minute averages of ambient temperature, ambient pressure,
3
4060
Particulate Matter, PM , 2.5
3µg/m
Annual *24 Hours **
4060
* Annual Arithmetic mean of minimum 104 measurements in a year at a particular site taken twice a week 24 hourly at uniform intervals.** 24 hourly or 8 hourly or 1 hourly monitored values, as applicable, shall be complied with 98% of the time in a year. 2% of the time, they may exceed the limits but not on two consecutive days of monitoring.
Pollutant Time Weighted Average
Concentration in Ambient AirIndustrial,
Residential, Rural and other Areas
Ecologically Sensitive Area (Notified by
Central Government)
15

filter temperature and volumetric flow rate. In addition, the microprocessor calculates the average temperatures and pressure, total volumetric flow for the entire sample run time and the coefficient of variation of the flow rate.
5.0 Interferences and Artefacts
The potential effect of body moisture or oils contacting the filters is minimized by using non-serrated forceps to handle the filters at all times. This measure also moderates interference due to static electricity. Teflon filters accumulate a surface electrical charge, which may affect filter weight. Static electricity is controlled by treating filters with a "Static Master" static charge neutralizer prior to weighing. Placement of filters on a "Static Master" unit is required for a minimum of 30 seconds before any filter can be weighed.Moisture content can affect filter weight. Filters must be equilibrated for a minimum of 24 hours in a controlled environment prior to pre- and post-weighing. The balance room's relative humidity must be maintained at a mean value range of 45 ± 5 % and its air temperature must be maintained at a mean value range of 25.0 ± 2.0 ºC.Airborne particulate can adversely affect accurate mass measurement of the filter. Filters undergoing conditioning should not be placed within an airflow path created by air conditioning ductwork, computer printers, or frequently opened doorways. Cleaning laboratory bench-tops and weighing areas daily, installing "sticky" floor mats at doorway entrances to the balance room and wearing clean lab coats over regular clothing can further minimize dust contamination.
5.1 Precision and Accuracy
The performance segment of the PM FRM specifies strict guidelines for controls that 2.5
must be observed, as well as the range of precision and accuracy of those controls. The 3flow rate through the instrument is specified as 16.67 lpm (1 m /hr). This flow must be
volumetrically controlled to a precision of 5% and an accuracy of 2%. The flow control must be upgraded at least every 30 seconds and recorded (logged) every five minutes. Barometric pressure, ambient temperature and filter temperature should be measured on the same schedule. Filter temperature, it must not exceed the ambient temperature by more than 5° C for more than 30 minutes. A fan blowing filtered ambient air through the enclosure provides the necessary cooling effect. It is necessary for the entire apparatus to provide accurate performance over a temperature range of -20 to 50° C. The supporting run-time (interval) data, which are stored in detailed 5-minute intervals in the sampler's microprocessor, as well as 24-hour integrated performance (filter) data, must be capable of being extracted at the completion of a 24-hour run. The FRM mandates the provision of an RS232 port for this purpose. Data may be extracted to a portable computer.Mass of the filter deposit, flow rate through the filter, and sampling time have typical precision of ± 0.2 mg, ± 5%, and ± 30 seconds, respectively. These uncertainties combine
16
3to yield a propagated precision of approximately ± 5 % at 10 µg/m and approximately 3± 2% at 100 µg/m .
6.0 Sitting Requirements
Samplers should be sited to meet the goals of the specific monitoring project. For routine sampling to determine compliance with the National Ambient Air Quality Standards (NAAQS), sampler sitting is described in CPCB guidelines shall applyThe monitoring should be done at outside the zone of influence of sources located within the designated zone of representation for the monitoring site.Height of the inlet must be 3 - 10 m above the ground level. And at a suitable distance from any direct pollution source including traffic.Large nearby buildings and trees extending above the height of the monitor may present barriers or deposition surfaces for PM. Distance of the sampler to any air flow obstacle i.e. buildings, must be more than two times the height of the obstacle above the sampler.There should be unrestricted airflow in three of four quadrants. Certain trees may also be sources of PM in the form of detritus, pollen, or insect parts. These can be avoided by locating samplers by placing them > 20 m from nearby trees.If collocated sampling has to be performed the minimum distance between two Samplers should be 2 m.
7.0 Apparatus and Materials
— Sampling equipment designated as FRM (Federal Reference Method) or FEM (Federal Equivalent Method)
— Certified Flow Transfer Standard for Flow CalibrationFollowing established EPA methods and procedures, all calibration transfer standards (i.e. temperature, pressure and flow) must be certified against traceable standards at least once per year. Calibration of these transfer standards will be conducted by the transfer standard manufacturer.
— Certified Standards for Pressure and Temperature (Optional)— Electronic microbalance with a minimum resolution of 0.001 mg and a precision
of ± 0.001 mg, supplied with a balance pan. The microbalance must be positioned on a vibration-damping balance support table.
— Calibration weights, utilized as Mass Reference Standards, should be non-corroding, range in weight from 100 mg to 200 mg, and be certified as traceable to NIST mass standards. The weights should be ASTM Class 1 category with a tolerance of 0.025 mg.
— Non-serrated forceps for handling filters.— Non-metallic, non-serrated forceps for handling weights.— Digital timer/stopwatch.
17

47 mm Filter: Teflon membrane, 46.2 mm effective diameter with a polypropylene support ring or filters as recommended by FRM / FEM sampler manufacturer.
— Filter support cassettes and covers.— Filter equilibration racks.— Relative Humidity / Temperature recorder.— NIST-certified or ISO traceable Hygrometer for calibration of relative humidity
readings.— NIST-certified ISO traceable Thermometer for calibration of temperature
readings.— Light box.— Radioactive (alpha particle) Polonium-210 ("Static Master") antistatic strips for
static charge neutralization however static charge gives low-moderate interference in stability of reading of balance.
— Antistatic, nitrate-free, phosphate-free, sulphate-free, and powder free vinyl gloves.
— Plastic petri-slide filters containers (Filter Cassette).— Zip-lock plastic bags, 6" 9".— Disposable laboratory wipes.— Filter equilibration cabinets.— Impactor oil/grease
8.0 Sampling and Analytical Procedure
8.1 Calibration and performance check of Sampler
8.1.1 External Leak Check:
Upon initial installation of the sampler, following sampler repair or maintenance and at least monthly, perform a sampler external leak check according to the manufacturer's guidelines.
8.1.2 Internal Leak Check:
Upon initial installation of the sampler, following sampler repair or maintenance, and at least monthly, perform a sampler internal leak check according to the manufacturer's guidelines
8.1.3 Single-point Ambient Temperature and Filter Temperature Verification Check:
—
18
A single-point temperature verification check of both the ambient temperature and filter temperature sensors must be performed at least once every month. The Temperature check is performed following manufacturer's guidelines
8.1.4 Ambient Temperature Calibration:
The ambient temperature calibration is to be performed upon initial installation, yearly after site installation after any major maintenance that might affect the temperature reading, and at any time thereafter when the sampler fails a verification check following manufacturer's guidelines.
8.1.5 Filter Temperature Calibration
The filter temperature calibration is to be performed upon initial installation, yearly after site installation, and at any time thereafter when the sampler fails either a single-point or multi-point temperature verification check. To perform the temperature calibrations of filter follow the manufacturer's instructions.
8.1.6 Pressure Verification Check
Single-point pressure verification must be performed at least once every month. The pressure check is performed following manufacturer's instructions.
8.1.7 Pressure Calibration
The pressure calibration is to be performed upon initial installation, yearly after site installation, and at any time thereafter when the sampler fails a single-point pressure verification check. Pressure calibration shall be performed following manufacturer's instructions.
8.1.8 Single-point Flow Verification Check
A single-point flow verification check must be performed at least every month. The flow check is performed following manufacturer's instructions.
8.1.9 Multi-Point Flow Calibration Procedure
A multi-point flow calibration must be performed upon initial installation and once per year thereafter. In addition, the multi-point calibration must be performed whenever a single-point flow verification check indicates that the sampler flow deviates from the flow transfer standard by more than ± 4%. The multi-point calibration is performed following manufacturer's instructions.
19

8.2 Selection and Procurement of Filters
The quality of filter papers to be used should technically meet the desired specifications. It is preferable to prepare the estimate for whole requirement and order the same in bulk with a request to supply the same batch/lot of filters to control analytical quality and blank values. During the selection of filters following points should be considered:
— Mechanical stability; — Chemical stability; — Particle or gas sampling efficiency; — Flow resistance; — Loading capacity; — Blank values; — Artefact formation; — Compatibility with analysis method; and — Cost and availability.
47 mm (diameter) Teflon (PTFE) filter paper with Polypropylene support ring manufactured by M/s Whatman or M/s Pall Life Sciences or equivalent having 2 µm pore sizes. The filter papers should have very low background concentrations for ion and elements.
8.2.1 Filter Inspection and Conditioning of Filter Papers
Filter papers selected for different analytical objectives should be conditioned by following steps:
— Inspect all the filter papers for holes or cracks. Reject, if any deformity is found.— Note down the batch/lot in log sheet.— Label all the filters following a general lab coding technique, which should be
unique to represent a sample.— Put the marked filters in petri dishes.— Use always proper (blunt) tweezers/forceps (made of non-reactive material) to
handle the filter papers in lab and field as well.— Prepare a sample-tracking sheet for each filter paper or a batch of filter paper.
8.2.2 Filter Inspection and Stability
To equilibrate, the filters are transferred from their sealed manufacturer's packaging to a filter-handling container such as a plastic petri-slide. The filters are handled with non-serrated forceps. Lab personnel must wear vinyl gloves as secondary when filters are being prepared for conditioning and weighing.
20
Before any filter is placed in a filter-handling container, it must be inspected for defects. This is done be an examination of the filter on a "light table". A filter must be discarded if any defects are identified. Specific defects to look for are:
— Pinhole - A small hole appearing as a distinct and obvious bright point of light when examined over a light table.
— Separation of ring - Any separation or lack of seal between the filter and the filter support ring.
— Chaff or flashing - Any extra material on the reinforcing ring or on the heat-seal area that would prevent an airtight seal during sampling.
— Loose materials - Any extra loose materials or dirt particles on the filter.— Discoloration - Any obvious discoloration that might be evidence of
contamination.— Other - A filter with any imperfection not described above, such as irregular
surfaces or other results of poor workmanship.
8.2.3 Filter Conditioning
A one-month storage period in a controlled environment, followed by one week equilibration in the weighing environment, found acceptable deviations in reweighing. Gravimetric measurement is the net mass on a filter by weighing the filter before and after sampling with a balance in a temperature and relative humidity controlled environment as described in Standard Operating Procedure. To minimize particle volatilization and aerosol liquid water bias, PM reference methods require that filters be equilibrated for 24 hours at a 2.5
constant (within ±5%) relative humidity 45 % and at a constant (within ±2ºC) temperature between 25ºC. These filter equilibrium conditions are intended to minimize the liquid water associated with soluble compounds and to minimize the loss of volatile species.
8.2.4 Lot Blanks Check
Randomly select three filters as lot blanks from each new lot received and place in individual containers. Equilibrate the exposed filters in a filter equilibration cabinet in the Balance Room that allows air circulation, but still reduces extraneous airborne particles from settling on filters. Weigh lot blanks every 24 hours on a designated balance. Record the lot number, filter number, mass, and dates of the lot blanks in the assigned quality control logbook. Once the mass difference between weighing is less than 0.015 mg for all three lot blanks, the filters have stabilized. Note the time taken from initial exposure of the filters to attainment of mass stability. This information is designated as the minimum equilibration period required before filters from the same lot can be pre-
21
weighed and used for routine sampling. Once this minimum equilibration period is determined, the lot blanks become lab blanks which are set aside for long-term exposure in the same equilibration cabinet where routine samples, field blanks, and trip blanks are equilibrated prior to pre- or post-weighing.
8.2.5 Laboratory Conditions for Weighing
Gravimetric analysis of the filters needs to be performed with a microbalance. The sensitivity and reliability of the electro-balance is about + 0.001 mg or 1 µg. Though tolerances on re-weights of Teflon-membrane filters are typically ± 0.010 mg, these sensitive balances require isolation from vibration and air currents. Balances placed in laminar flow hoods with filtered air minimize contamination of filters from particles and gases in laboratory air. Electrostatic effects contribute another main interference in gravimetric analysis of filters. It is established that residual charge on a filter could produce an electrostatic discharge between the filter on the pan and the metal casing of the electro balance, which induces non-gravimetric forces. This charge can be removed from most filter media by exposing the filter to a low-level radioactive source (500 Pico curies of polonium210 ) prior to and during sample weighing.
8.3 Electro Balance Controls and Calibration
Gravimetric mass analysis is performed using single pan electronic balance. If possible, polonium strip ionization units are used to reduce electrostatic effects in the weighing cavity and on individual filters. A segregated laboratory area is used to control human traffic and to stabilize the temperature and relative humidity of the weighing environment. The area is cleaned with a high efficiency vacuum cleaner, and a tacky floor covering is installed at the entrance to the sample handling room to minimize dust artifact. Gravimetric analysis of filters currently uses the difference method to determine the mass of the collected aerosol. The pre weight of each filter is measured prior to being sent into the field for sampling. Once exposed and returned to the sample handling room, the filter is removed petri dishes and the post weight of the filter is measured after conditioning. The mass of the aerosol is determined by calculating the difference between the pre and post weights.
8.3.1 Cleaning and Maintenance of the Sample Handling Room
The requirements for a sample handling room include a reduced dust environment, and, over the twenty-four hour period prior to analysis of exposed filters, temperature in the range of 25º C with variation less than ± 3º C, and relative humidity 45% ±5%. Every last working day, the sample handling room should be thoroughly cleaned, after insuring that all filters have been
22
protected against contamination. To reduce fugitive dust levels, all surfaces are cleaned with a high efficiency vacuum. The floors are cleaned with a mild cleaning solution, if necessary. Finally, all work surfaces are cleaned with reagent grade alcohol (or another reagent grade solvent, if necessary) and Kimwipes™. This procedure reduces the possibility of contamination if a filter falls to the work surface. Following the Friday cleaning, no analysis shall occur for at least twenty-four hours to reduce the potential for contamination of filters by compounds used in the cleaning process.
8.3.2 Calibration and Maintenance of balance
The balance is cleaned and calibrated every day for ranges at the start of operation. It is also recalibrated if the balance fails a "zero" test that is performed periodically. A calibration log database is maintained for each balance. Significant events concerning the balance and any balance maintenance other than routine procedures are recorded in the log of the lab manager.
8.3.3 Cleaning
Regular cleaning should be performed as following:
— Clean the metal and plastic forceps with ethanol and a Kimwipe™.— Clean the work surface around the balance with ethanol and a Kimwipe™.— Clean the top surface and the strips of the anti static ionizing units by gently
rubbing with a Kimwipe™ wetted with ethanol. Do not neglect to clean the ionizing unit in the electro balance.
— Replace the clean ionizing unit in the center back of the balance cavity, and close the door on the weighing chamber (if polonium strip is used).
8.3.4 Thorough Calibration of Balance (Once in 6 Months)
o Allow the balance to stabilize with no weights on the pan. The computer will automatically record the mass to the screen when the balance has stabilized; this is the "zero" mass. It should be within 0.010 mg of 0.000. If not, contact the lab manager (see step 3, section 4.3.2.1 for lab manager procedures).
o Set the zero on the balance by pressing the tare button on the balance. This forces the "zero" mass to be exactly 0.000.
o Calibrate the balance. Momentarily ground yourself by touching the balance casing. Use nylon forceps to remove the certified calibration weight from its container. Gently place it in the center and allow the mass reading to stabilize and stop decreasing. Take readings.
23

o Use a 200.000 mg or suitable mass of graded Calibration weight.
o Use a 20.000 mg or suitable mass graded Calibration weight.
o Remove the calibration weight from the bail, using the nylon forceps, and replace it in its storage container.
o Check the calibration of the balance using the test weight. Momentarily ground yourself by touching the balance casing. Use the nylon forceps to remove the test weight from its container.
o Place the test weight in the center of the balance pan and allow the mass reading to stabilize and stop decreasing. The computer will record a reading to the screen when the balance has stabilized. The test weight is an old 50.000 gm calibration weight.
o Allow the balance to return to "zero." Compare the zero value and the value determined for the 50.000 mg mass to the expected values posted on the balance. If they exceed 02 micrograms, repeat the procedure. If variations greater than 10 micrograms are observed, report to the laboratory manager so that he/she can take appropriate action (section 4.3.2.1 step 3).
o On a random basis, but at least semiannually, the laboratory supervisor shall request a comparison of the normal calibration standards with a master set of reference standard masses maintained by the laboratory supervisor. After calibration, measure these 200.000, 50.000, and 20.000 mg standards and report their masses to the supervisor. The results are used to verify the integrity of the electro balance and the standard masses used in daily calibrations.
o The electro balance is available to run controls or for routine determination of mass.
o Linearity checks (Once in a year otherwise after every repair/shifting of balance). To run a linearity check on the balance (if the balance is suspected to be damaged), utilize the series of four standard weights stored in the lab manager's desk. The four weights, 200 mg, 100 mg, 50 mg, and 20 mg, must be weighed and a regression line developed. Take following steps for performing Linearity checks:
o Use the nylon forceps to remove a weight from its container and place it on the weighing pan.
o Wait until the balance has stabilized (approximately one minute). Then, record the displayed weight as the 'y' value and the certified mass as the 'x' value.
o Remove the weight from the pan, using the plastic forceps, and replace it in its protective container.
24
o Repeat steps (i) through (iii) for the other three weights.
o Linearly regress the 'y' value versus the 'x' value. Calculate the r2 value.2o If the R is not better than 0.995, the balance requires maintenance.
8.3.5 Stability Check of Balance (Once in Month)
To check the stability of the balance, reweigh the last 20 archived control filters, and develop a regression line comparing the re-weight values to the original values. Use following steps:
— Reweigh the series of 20 old controls filters on the suspect balance.
— Plot the re-weights versus the original weights.
— Derive the best line fit equation correlating the original weights to the re-weights.
2— Calculate the standard deviation and the R of the line fit.2— If the standard deviation is greater than ±3 micrograms, and the R is not better
than 0.995, the balance should be carefully inspected and submitted for maintenance.
8.3.6 Daily Calibration of Balance
Internal Calibration should be performed daily before any Pre- or Post-sampling weighing.
8.3.7 Internal Calibration
Open the draft shield door for at least one minute to allow the balance-weighing chamber to equilibrate to room temperature, then, close the draft shield door. Press the "TARE" key when readout has stabilized to ensure zero-readout. The liquid crystal display (LCD) should display "0.000 mg". Press the key for ensuring the internal calibration.
8.3.8 External Calibration
Open the draft shield door. Place a 100 mg working reference standard calibration weight onto the microbalance pan with non-metallic forceps. Close the draft shield door. Record the date, temperature and relative humidity of the balance room, and mass readout in the quality control logbook assigned to the microbalance. Remove the calibration weight and tare the microbalance as described above. Enter the calibration data into logbook records and assign to
25

the calibration session in the quality control logbook assigned to the microbalance. External calibration must be performed for each day on which filters are pre-weighed and/or post-weighed.
8.3.9 Weighing of Filters
o Take out pre-conditioned filters by forceps one by one and weigh properly. Record the mass in data sheet and log books against respective filter numbers or code. Always use gloved hands and blunt tweezers to handle filters.
o Replace and close the filter container (Petri dishes). Weigh one Control Filters (Archived one) with each batch of ten weighing. Keep separate controls for Pre (Blank filter) and Post (Exposed) sampling filters.
o Put the values of all control measurement in Quality Control Charts against dates.
o Put Lab code on from Plastic petri-slide filter containers (Filter Cassette).o Take out conditioned filter from Plastic petri-slide filter containers (Filter
Cassette).o Weigh the preconditioned filter.o Record and store it in laboratory coded filter cassette.o Follow the same procedure for exposed filtero Place the weighed filter into a petri-slide, close tightly, and store at 4ºC for at
least one year after sampling.
8.4 Shipment of Pre-weighed filters
Put the marked pre-weighed filters in Zip pouch. Transport the filters in a dry clean box (temperature control is optional) to the field.
8.5 Field sampling
— On the Field Data Log, fill in the top portion of the form including: the date/time of visit, the site identification, sampler identification, site name, filter ID number, sample start and stop dates and times, and field operator initials.
— Perform all necessary pre-sampling procedures as described above.— Perform QA/QC checks or maintenance, if required. — Record all maintenance activities in the field log book; include time, date, and
any concerns that might affect the quality of the sample. — Remove the filter to be installed from its protective filter cassette carrier.— Fix the filter following manufacturer's instructions into place against the bottom
of the WINS impactor. — Check the system clock and make sure it is within 1 min of NIST time.
26
Strictly follow operator's manual for setting up the sampling programme (24 hours)
— The Filter Setup Screen shows the start date and time and the end date and time for the next sample. To change the sampling parameters follow the operator's manual
— Start Sampling run— Wait until the auto diagnosis for all relevant parameters finishes and the
sampler automatically switch over to SAMPLING mode. Check flow (16.7LPM) and Sample volume displays rightly on screen.
8.6 Recovering the Sample and Data from a Completed Sample Run
— From the Main Screen, note the current sampler-operating mode (top line, right side of display). If the sampler is in the WAIT mode or the SAMP (sampling) mode, the sampler has not completed the previously scheduled sampling run. Do not disturb the sampler unless necessary.
— If the sampler is in the DONE mode or the ERR mode, press STOP. This allows the sampler to write the final information into storage for the current sample run and must be performed prior to filter exchange. The sampler mode should now indicate STOP.
— Open the filter exchange mechanism by pulling straight back on the black handle. The filter holder will lower away from the WINS impactor.
— Remove the filter carrier from the filter holder.— Place the filter carrier in the filter cassette case.— From the Main Screen, access to the Filter Data screen following operator's
instruction. — Using the information displayed on the Filter Data screen, complete the Field
Data Log with the following information from the completed sample run:
a) Total Sample Volume - from the Vol. fieldb) Average Flow Rate - from the Ave. Flow fieldc) Coefficient of Variation - from the %CV fieldd) Total Run Time - from the Tot fielde) Maximum Temperature Difference - from the Temp Diff fieldf) Minimum, Average and Maximum Ambient Temperatures - from the
AmbT fieldsg) Minimum, Average and Maximum Filter Temperatures - from the FltT
fieldsh) Minimum, Average and Maximum Pressures - from the Pres fields i) If the sampler indicated there was an error, note the error in the field log
book and make any repairs as needed. Any fixes should be done prior to the next run date.
—
27

8.7 Calculation and Reporting of Mass Concentrations
The equation to calculate the mass of fine particulate matter collected on a Teflon filter is as below:
3M = (Mf - Mi) mg x 10 µg2.5
Where, M = total mass of fine particulate collected during sampling period (µg)2.5
Mf = final mass of the conditioned filter after sample collection (mg) Mi = initial mass of the conditioned filter before sample collection (mg)
310 = unit conversion factor for milligrams (mg) to micrograms (µg)
— Field records of PM samplers are required to provide measurements of the 2.5
total volume of ambient air passing through the sampler (V) in cubic meters at the actual temperatures and pressures measured during sampling. Use the following formula if V is not available directly from the sampler:
-3 3V = Qavg x t x 10 m
Where, 3V = total sample value (m )
Qavg = average flow rate over the entire duration of the sampling period (L/min)
t = duration of sampling period (min)3 310 = unit conversion factor for liters (L) into cubic meters (m )
8.7.1 The equation given below can be used to determine PM2.5 mass concentration:
PM = M / V2.5 2.5
Where, 3PM = mass concentration of PM particulates (µg/m )2.5 2.5
PM = total mass of fine particulate collected during sampling 2.5
period (µg) 3V = total volume of air sampled (m )
9.0 Reporting
Data reporting should be done in prescribed Format. The Format shall contain all information including calibration. The data sheet must be accompanied by Sample Tracking sheet.
28
10.0 References
1.0 40 CFR Parts 53 and 58 Revised Requirements for Designation of Reference and Equivalent Methods for PM2.5 and Ambient Air Quality Surveillance for Particulate Matter; Final Rule
2.0 CARB SOP MLD 0553.0 Aerosol Science & Technology: The PM 2.5 Federal Reference Method (FRM)."
35(4):339-3424.0 Federal Register/Vol. 72, No. 112/Tuesday, June 12, 2007/Rules and
Regulations5.0 PM2.5 Gravimetric Analysis - Revision 7, August 14, 2003, Page 2 of 24 RTI
(Research Triangle Institute, US)
29
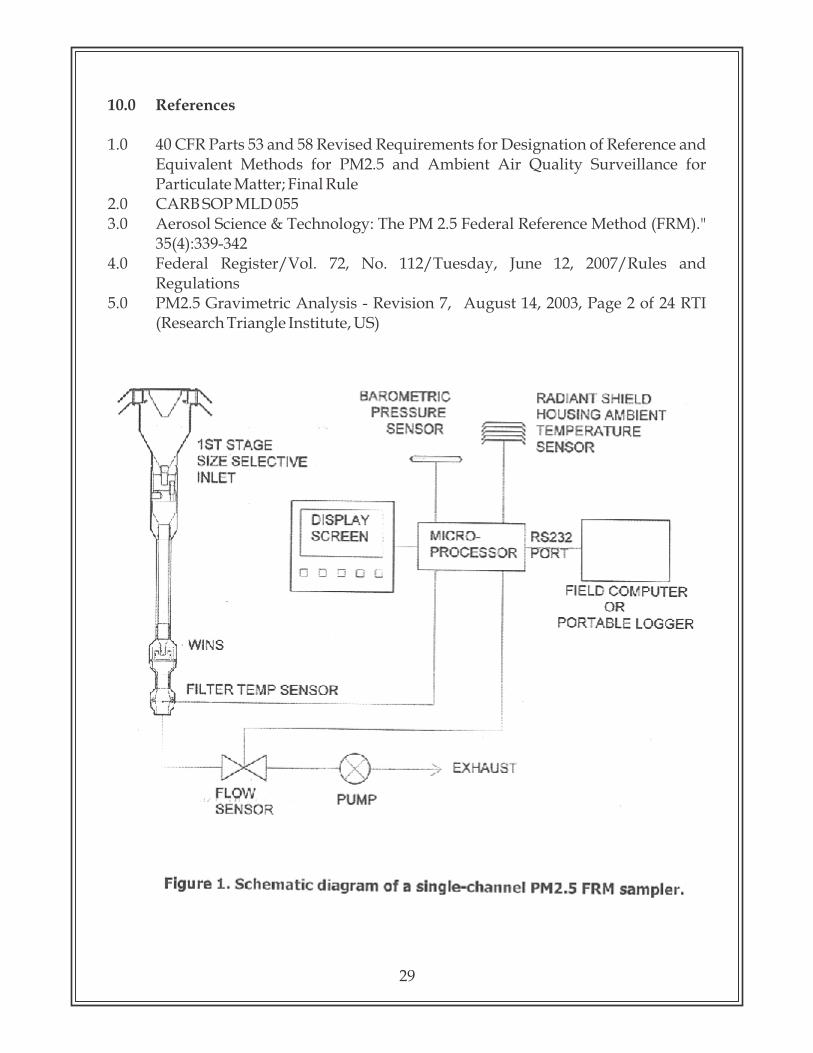

30
FLOW CHART FOR MEASUREMENT OF PM 2.5
Check the filter for any physical damages ê
Mark identification number on the filter ê
Condition the filter in conditioning room / desiccator for 24 hours ê
Record initial weight ê
Place the filter on the sampler ê
Run the sampler for eight hours ê
Record the flow rate on hourly basis ê
Remove the filter from the sampler ê
Keep the exposed filter in a proper container ê
Record the total time of sampling & average flow rate ê
Again condition the filter in conditioning room / desiccator for 24 hours ê
Record final weight ê
3Calculate the concentration of PM in µg/m2.5
Guidelines for sampling and analysis for ozone in ambient air(Chemical Method)
1. Purpose
The purpose of this protocol is to provide guidelines for monitoring of ozone in ambient air.
2. Standard
The national ambient air quality standards for ozone is presented in the table
3. Principle of the method
rdMethod 411, Air Sampling and Analysis, 3 Edition (Determination of oxidizing substances in the atmosphere)Micro-amounts of ozone and the oxidants liberate iodine when absorbed in a 1% solution of potassium iodine buffered at pH 6.8 + 0.2. The iodine is determined spectrophotometrically by measuring the absorption of tri-iodide ion at 352 nm.
The stoichiometry is approximated by the following reaction:
O + 3 KI + H O --> KI + 2 KOH + O3 2 3 2
4. Instrument/Equipment
The following items are necessary to perform the monitoring and analysis of ammonia in ambient air:
— Analytical balance:— Vacuum pump: Any suction pump capable of drawing the required sample
flow rate of 1 to 2 litre per minute— Calibrated flow measuring device to control the air flow from 1 to 2 l/min. — Absorber: All glass midget impinger
31
* Annual Arithmetic mean of minimum 104 measurements in a year at a particular site taken twice a week 24 hourly at uniform intervals.** 24 hourly or 8 hourly or 1 hourly monitored values, as applicable, shall be complied with 98% of the time in a year. 2% of the time, they may exceed the limits but not on two consecutive days of monitoring.
Pollutant Time Weighted Average
Concentration in Ambient AirIndustrial,
Residential, Rural and other Areas
Ecologically Sensitive Area (Notified by
Central Government)
Ozone (O ), 33µg/m
8 Hours *1 Hour **
100180
100180

—— Glass wares: low actinic glassware must be used for analysis
5. Reagents / Chemicals
All the chemicals should meet specifications of ACS Analytical Reagent grade— Distilled water— Absorbing Solution (1% KI in 0.1 m Phosphate Buffer) - Dissolve 13.6 g of
potassium dihydrogen phosphate (KH PO ), 14.2 g of disodium hydrogen 2 4
phosphate (Na HPO ) or 35.8 g of the dodecahydrate salt (Na HPO . 12 H O), 2 4 2 2 2
and 10.0 g of potassium iodide in sequence and dilute the mixture to 1 L with water. Keep at room temperature for at least 1 day before use. Measure pH and adjust to 6.8 + 0.2 with NaOH or KH PO . This solution can be stored for 2 4
several months in a glass stoppered brown bottle at room temperature without deterioration. It should not be exposed to direct sunlight.
— Stock Solution 0.025 M I (0.05N) - Dissolve 16 g of potassium iodide and 3.173 2
g of re-sublimed iodine successively and dilute the mixture to exactly 500 ml with water. Keep at room temperature at least 1 day before use. Standardize shortly before use, against 0.025 M Na S O . The sodium thiosulfate is 2 2 3
standardized against primary standard bi-iodate [KH(IO ) ] or potassium 3 2
dichromate (K Cr O ).2 2 7
— M I2 Solution - Pipette exactly 4.00 ml of the 0.025 M Stock solution into a 100 m low actinic volumetric flask and dilute to the mark with absorbing solution. Protect from strong light. Discard after use.
6. Sampling
Place 10 ml of absorbing solution in a standard impinger and sample for one hour at the flow rate of 1 L/min. Do not expose the absorbing reagent to direct sunlight. After sampling measure the volume of sample and transfer to a sample storage bottle.
7. Analysis
If, appreciable evaporation of the absorbing solution occurs during sampling, add water to bring the liquid volume to 10 ml. Within 30 to 60 minutes after sample collection, read the absorbance in a cuvette at 352 nm against a reference cuvette containing distilled water. Measure the absorbance of the unexposed reagent and subtract the value from the absorbance of the sample.
Spectrophotometer: Capable of measuring absorbance at 352 nm.
32
8. Calibration
8.1. Preparation of Standards
Calibrating Iodine Solution - For calibration purposes exactly 5.11 ml of the 0.001 M I2 solution (or equivalent volume for other molarity) is diluted with absorbing solution just before use to 100 ml (final volume) to make the final concentration equivalent to 1 µl of O /ml. This solution preparation accounts for the stoichiometry described in Section 3
3 at standard conditions of 101.3 kPa and 25°C. Discard this solution after use.
Obtain a range of calibration points containing from 1 µl to 10 µl of ozone equivalent per 10.0 ml of solution. Prepare by individually adding 1.0, 2.0, 4.0, 6.0, 8.0 and 10.0 mL of the calibrating iodine solution to 10.0 ml volumetric flasks.
Bring each to the calibration mark with absorbing reagent.Read the absorbance of each of the prepared calibration solutions at 352 nm against distilled water reference
8.2. Standard Curve
Plot a curve absorbance (Y axis) versus concentration (X axis). Draw a line of best fit and determine the slope. The reciprocal of slope gives the calibration factor (CF).
9. Calculation
3C (O µg/m ) = (A - A ) x CF x 1.962/ V3 s b a
Where,3C O = Concentration of Ozone in µg/m3
A = Absorbance of samples
A = Absorbance of reagent blankb
CF = Calibration factor 3V = Volume of air sampled in ma
1.962 = Conversion factor, µl to µg
10. Quality Control
Quality Control (QC) is the techniques that are used to fulfil requirements for quality. The QC procedures for the air sampling and monitoring sections of this protocol include preventative maintenance of equipment, calibration of equipment, analysis of field blanks and lab blanks.
33

11. Reference
rdMethod 411, Air Sampling and Analysis, 3 Edition (Determination of oxidizing substances in the atmosphere)
FLOW CHART FOR MEASUREMENT OF OZONE (CHEMICAL METHOD)
Place10 ml of absorbing media in an impinger ê
Connect it to the gas sampling manifold of gas sampling device (RDS/HVS). ê
Draw air at a sampling rate of 1 lpm for 60 minutes ê
Do not expose the absorbing reagent to direct sunlight ê
Add de ionized water to make up the evaporation loss during sampling and bring the volume to 10 ml.
êPrepare calibration graph as recommended in method
êWithin 30 to 60 minutes after sample collection, read the absorbance in a cuvette at
352 nm against a reference cuvette containing de ionized water ê
Calculate concentration using calibration graph ê
3Calculate concentration of Ozone in µg/m
34
Guidelines for sampling and analysis for ammonia in ambient air(Indophenol Method)
1. Purpose
The purpose of this protocol is to provide guidelines for monitoring of ammonia in ambient air.
2. Standard
The national ambient air quality standard for ammonia is presented in the table:
3. Principle of the method
Indophenol method (Method 401, Air Sampling and Analysis, 3rd Edition) Ammonia in the atmosphere is collected by bubbling a measured volume of air through a dilute solution of sulphuric acid to form ammonium sulphate. The ammonium sulphate formed in the sample is analyzed colorimetrically by reaction with phenol and alkaline sodium hypochlorite to produce indophenol, a blue dye. The reaction is accelerated by the addition of sodium nitroprusside as catalyst.
4. Instrument/Equipment
The following items are necessary to perform the sampling and analysis of ammonia in ambient air:
— Analytical balance— Vacuum pump: To maintain a flow rate up to 5 litre per minute— Flow measuring device: Calibrated flow meter to control the air flow from 1
to 2 l/min.
35
* Annual Arithmetic mean of minimum 104 measurements in a year at a particular site taken twice a week 24 hourly at uniform intervals.** 24 hourly or 8 hourly or 1 hourly monitored values, as applicable, shall be complied with 98% of the time in a year. 2% of the time, they may exceed the limits but not on two consecutive days of monitoring.
Pollutant Time Weighted Average
Concentration in Ambient AirIndustrial,
Residential, Rural and other Areas
Ecologically Sensitive Area (Notified by
Central Government)Ammonia (NH ), 3
3µg/mAnnual *
24 Hours **100400
100400

Absorber: A midget impinger or a fritted bubbler— Spectrophotometer: Capable of measuring absorbance at 630 nm.— Glass ware: Low actinic glass wares must be used for analysis.
5. Reagents / Chemicals
All the chemicals should meet specifications of ACS Analytical Reagent grade— Distilled water— 0.1N Sulphuric Acid (Absorbing solution): Dilute 3.0ml of concentrated H SO 2 4
(18 M) to 1 litre with distilled water. — Sodium nitroprusside: Dissolve 2 g sodium nitroprusside in 100 ml distilled
water. The solution keeps well in the refrigerator for 2 months.— 6.75 M sodium hydroxide: Dissolve 270 g sodium hydroxide in about 1 litre of
distilled water. Boil down to 600 ml. Cool and fill to 1 litre. Store in polyethylene bottle.
— Sodium hypochlorite solution: Dilute 5 to 6% AR grade sodium hypochlorite with distilled water to give a 0.1N solution (0.37%). Strength determined before dilution by iodometric titration using 0.1N standardized sodium thiosulfate solution or colorimetry after appropriate dilution.
— Stock sodium thiosulphate solution (0.1 N): Prepare the solution by placing 25g sodium thiosulfate pentahydrate, add 0.1g sodium carbonate and dissolve using boiled, cooled distilled water making the solution up to a final volume of 1litre. Allow the solution to stand one day before standardizing. Standardization of sodium thiosulfate solution:To standardize, accurately weigh to the nearest 0.1 mg, 1.5g primary standard potassium iodate dried at 180°C, dissolve and dilute to volume in 500ml volumetric flask.Into a 500ml Iodine flask, transfer 50 ml of iodate solution by pipette. Add 2 g potassium iodide and 10 ml of N hydrochloric acid and stopper the flask. After 5 min, titrate with stock thiosulfate solution to pale yellow. Add 5ml starch indicator solution and continue the titration until the blue colour disappears. Calculate the normality of the stock solution.
— Phenol solution 45% v/v: Dilute 45 ml Phenol to 100 ml with methanol— Sodium phosphate— Ammonium chloride or Ammonium sulfate— Hydrochloric acid— Buffer Solution: Dissolve 50 g of sodium phosphate (Na PO . 12 H O) and 74 ml 3 4 2
of 6.75 M NaOH in 1 L of distilled water— Working hypochlorite solution: Mix 30 ml of 0.1 N sodium hypochlorite and 30
ml of 6.75 M Sodium hydroxide and dilute to 100 ml with distilled water— Working Phenol solution: Mix 20 ml of 45% phenol solution with 1 ml of 2%
sodium nitroprusside and dilute to 100 ml with distilled water.
—
36
Ammonia stock solution (1 mg NH /ml)3
— Ammonia working solution (10 µg NH /ml) (Prepare fresh daily)3
6. Sampling
Place 10 ml of absorbing solution in an impinger and sample for one hour at the flow rate of 1 to 2 L/min. After sampling measure the final volume of sample and transfer to a sample storage bottle.
7. Analysis
Transfer contents of the sample bottle to a 25 ml glass stopper graduated cylinder. Maintain all the solutions and sample at 25°C. To the reagent blank, control and samples add 2 ml buffer, 5 ml of working phenol solution, mix, and fill to about 22 ml. with distilled water, then add 2.5 ml of working hypochlorite solution and rapidly mix. Dilute to 25 ml, mix and store in the dark for 30 minutes to develop colour. Measure the absorbance of the solution at 630 nm on a spectrophotometer using 1 cm cells.
8. Calibration and standardization
8.1. Preparation of Standards
Pipet 0.5, 1.0, 1.5, 2.0 ml of working standard solution in to 25 ml glass stoppered graduated cylinders. Fill to 10 ml mark with absorbing solution. A reagent blank with 10 ml absorbing solution is also prepared. Add reagents to each cylinder as in the procedure for analysis. Read the absorbance of each standard against reagent blank.
8.2. Standard Curve
Plot the absorbance as the ordinate (Y axis) versus concentration as the abscissa (X axis). Draw a line of best fit and determine the slope.
9. Calculation
3C ( NH µg/m ) = (A - A ) x CF x V / V x V3 s b s a t
Where,3C NH = Concentration of Ammonia in µg/m3
A = Absorbance of samples
A = Absorbance of reagent blankb
CF = Calibration factor 3V = Volume of air sampled in ma
V = Final volume of the sample in mls
V = Volume of the aliquot taken for analysis, mlt
—
37
38
10. Quality Control
Quality Control (QC) is the technique that is used to fulfill requirements for quality. The QC procedures for the air sampling and monitoring sections of this protocol include preventative maintenance of equipment, calibration of equipment, analysis of field blanks and lab blanks.Randomly selected 5-10% samples should be reanalysed as a part of internal quality assurance program.
11. Reference
Indophenol method (Method 401, Air Sampling and Analysis, 3rd Edition), Lewis publishers Inc.
39
FLOW CHART FOR MEASUREMENT OF AMMONIA
Dilute 10ml of concentrated HCl (12M) to 100 ml with distilled waterWash the glassware with the water and finally rinse it thrice with distilled water
êAdjust the Flow rate at 1L/min of the rotameter and the manifolds of the attached
APM 411/APM 460Dx ê
Place 10 ml of absorbing media in each midget impinger for samples and field blanks
Assemble (in order) prefilter &holder, flowmeter, impinger and pumpSample at the rate of 1L/min for 1hour duration
êRecord the sampling time, average flow rate and final volume of the solution
After the sample collection, transfer the solution in the impinger to polyethylene bottle and recap it tightly for transport to laboratory for analysis
êPrepare the absorbing media, various reagents and working solutions as per the
method described in protocolStandardize the sodium thiosulphate solution by titrating it against potassium
iodate and Sodium hypochlorite by titrating it against standardized sodium thiosulphate solution
êTake 25 ml measuring flasks and rinse with distilled water. Transfer the contents from polyethylene bottles to 25 ml measuring flasks (Maintain all the solutions at
25°C) Add 2 ml of buffer (to maintain pH)Add 5 ml of working phenol solution, mix, fill to about 22 ml with distilled water
and then add 2.5 ml of working hypochlorite solution & mix rapidlyStore in the dark for 30 mins to develop colour. Measure the absorbance of the
solution at 630 nm using UV Spectrophotometer
êPipette 0.5, 1.0 and 1.5 ml of working standard solution (working ammonia solution)
in 25 ml measuring flasksFill to 10 ml mark with absorbing solution (0.1 M H2SO4). Add the reagents as to
each flask as in the procedure for analysisRead the absorbance of each standard against the reagent blank.
ê Plot the calibration curve
ê3Calculate the concentration of NH in µg/m3

40
Guidelines for sampling and Analysis of Benzo(a)Pyrene & other PAHs in Ambient Air (Solvent Extraction & GC Analysis)
1. Purpose The purpose of this protocol is to provide guidelines for monitoring of Benzo (a) Pyrene (BaP) in ambient air.
Benzo (a) Pyrene (BaP) is one of the most important constituent of PAH compounds and also one of the most potent carcinogens. This can be measured in both particulate phase and vapour phase. In the vapour phase the concentration of B(a)P is significantly less than the particulate phase. Therefore, more care to be taken for the measurement of Benzo (a) Pyrene in the particulate phase. The molecular formula of B(a)P is C H 20 12
having molecular weight 252 and structural formula is given in following figure:
Structural Formula of Benzo (a) Pyrene (BaP)
2. Standard
The national ambient air quality standard for Benzo(a)pyrene is presented in table
* Annual Arithmetic mean of minimum 104 measurements in a year at a particular site taken twice a week 24 hourly at uniform intervals.** 24 hourly or 8 hourly or 1 hourly monitored values, as applicable, shall be complied with 98% of the time in a year. 2% of the time, they may exceed the limits but not on two consecutive days of monitoring.
Pollutant Time Weighted Average
3Concentration in Ambient Air (ng/m )Industrial,
Residential, Rural and other Areas
Ecologically Sensitive Area (Notified by
Central Government)Benzo(a)pyrene Annual 01 01
41
3. Principle of the Method
It is based on BIS method IS 5182 (Part 12):2004 and USEPA method (TO-13). This method is designed to collect particulate phase PAHs in ambient air and fugitive emissions and to determine individual PAH compounds using capillary gas chromatograph equipped with flame ionization detector. It is a high volume
3 3(1.2m /min) sampling method capable of detecting sub.ng/m concentration of PAH 3in 24 hours sample (i.e. collected in 3 shifts of 8 hour each with 480 m sampling volume
of air).
4. Equipment/Instruments
PM10 high volume sampler, Whatman Glass fibre (EPM-2000) or Equivalent Filter Paper, Ultra Sonicator (~40kHz frequency), Rotary Evaporator (Buchi type), Gas Chromatograph with Flame Ionization Detector fitted with Capillary Column (H.P. / Agilent Ultra 2 or equivalent, length 25 meter x 0.320mm, 0.17µm or more), Syringes (5 & 10 micro litre capacity), Variable volume micropipettes (0.5 & 1.0 ml capacity), Beakers (250 ml), Amber colour Vials 3ml and 5ml capacity, Chromatographic column (200-250 mm*10mmwith Teflon stopcock).
5. Chemical/Solvents
All chemicals, calibration /reference standards of B(a)P , other PAHs, Triphenyl benzene (internal standard, ultra residue grade) solvents like Toluene, Cyclohexane (with minimum residue less than 0.005%) etc.) & other chemicals like Silica -Gel (60-80 mesh size) should be of highest purity & of reputed make with traceability/purity and analysis certificate.
6. Sampling
6.1 Instrument/Filter Selection 24 hr. sampling using PM high volume sampler with 8 hourly samples using EPM-10
2000 glass fibre or equivalent filter.
6.2 Sampling Frequency
Sampling is done twice a week, total of 104 days monitoring in a year. Particulate laden Benzo(a)Pyrene samples are collected on glass fibre filter (EPM 2000 or equivalent) using PM sampler at a flow rate of more than 1m3/min per minute, at selected 10
location(s).

42
6.3 Sampling Height
Sampling height may be between 3-10 meters from the ground level for ambient air quality monitoring.
6.4 Sample Filter Storage
After sampling, filters are kept in the controlled laboratory conditions (20-25°C) in an envelope marked with necessary identification information if processed immediately, otherwise wrap the filters in Aluminium foil & kept it in refrigerator at 4°C in dark to avoid photo oxidation of PAHs.
6.5 Sample Processing
a. Extraction:Filter papers (half of all the filters papers collected in a day) are cut into strips using scissors and transfer to 250 ml beaker. Add ~50 ml. of Toluene (GC/HPLC grade). These samples are extracted with toluene using ultra sonic bath for about 30 minutes. Repeat the procedure twice (50ml x 2 times) for complete extraction. Alternatively, sample can be extracted using soxhlet extraction apparatus for about 8 hr. with Toluene and repeat it twice. Sample processing steps are shown in Figure - 1.
b. Filtration:
Filter the extracted samples with Whatman filter paper no.41 containing 2 gm of Anhydrous Sodium Sulphate (to remove moisture).
c. Concentration: After filtration, the filtrate is concentrated using Rotary vacuum evaporator
(Figure-2) to 2ml final volume.
Figure – 1: Sample Processing
43
a. Clean-up with silica Gel:
To clean up the impurities, pass 2 ml of concentrated sample through silica gel column (pre conditioned, 60-80 mesh, and 200-250mm×10 mm with Teflon stopcock). After cleaning add 5ml cyclohexane and collect the elute in 25 ml beaker. Repeat the process for at least 3 times and collect it in the same beaker. Alternatively Solid Phase Extraction (SPE) may be used for clean up the impurities of sample.
b. Re-concentration with rotary vacuum evaporator:
The Cleaned up extract/filtrate (approximately 17 ml) is further concentrated using rotary evaporator and it is evaporated to nearly dryness with Nitrogen.
Filter Extraction with Ultrasonicator
Figure – 2: Rotary Evaporator for Sample Concentration

44
f. Final Sample volume:
The dried sample is re-dissolved in 1ml of toluene and transfer into 4 or 5 ml amber vials final analysis.
g. Extracted Sample Storage:
Cover/Cap the sample vials /tubes and mark with necessary identification. Keep it in refrigerator at 4°C prior to the analysis as in Figure -3
Figure -3: Ready to Inject B(a)P Samples
7. Analysis/ Instrument Set-Up
GC Conditions:Injector: 300°C FID Temp: 320°CColumn: Ultra -2 (25m Length, 320µm diameter, 0.17µ) or equivalentOven: 120°C à2 min hold à 7°C/min à 300°C à 10 min holdRun Time: 37.71 minutesCarrier gas flow (N2): 0.50 ml/minGases for FID Flame:H2 flow: 40 ml/minZero grade air flow: 400 ml/min
7.1 Preparation of Standard Calibration Mixture
Stock Standard Solution PAH mix standard solution of 16 Compounds including B(a)P (Dr. Ehrenstorfer, Germany make PAH mix 63) of concentration 1000mg/l (or 1000ng/µl) in Toluene.
45
Working Standard Solution Working Standard Solutions ( 5, 10, 15, 20, 25 ng/µl concentrations) are prepared from stock solution by diluting 200 to 40 times the stock B(a)P or other PAH solution of 1000mg/l (or 1000ng/µl) concentration with Toluene.
Internal Standard 1, 2, 3-Tri Phenyl Benzene of concentration ~1000ng/µl is added in the working standard solution so that the final concentration of Internal standard is 10 ng/µl.
7.2 Calibration of GC
7.2.1 Internal Calibration
Inject 1µl of each Working Standard (5, 10, 15, 20, 25 ng/µl) in triplicate and plot the area ratio of analyte PAH Compound [i.e. B(a)P] and the corresponding internal standard against the concentration for each compound and internal standard. The instrument is calibrated as per its manual/software.
7.2.2 External Calibration
Inject 1µl of each Working Standard (5, 10, 15, 20, 25 ng/µl) made in Toluene into GC-FID and plot the area of analyte viz. PAH Compound [i.e.B(a)P] against the corresponding concentration of the standard. The instrument is calibrated as per its manual/software.The quantification of that analyte will be based on peak area response of respective compounds with respect to working calibration standard, that is calibration factor (the ratio of response to the amount of mass injected).The retention time of various PAHs compounds are obtained under the above GC conditions.
7.2.3 Sample injection
Take 2µl of sample from the amber vial using standard gas tight syringe and inject in the Capillary GC-FID instrument for analysis. Record the resulting concentration of each PAH compound including B(a)P. A 10ng/µl concentration B(a)P or other PAH standards are to be injected in GC/FID instrument with every batch of samples. As a control Internal Standard of 10 ng/µl conc. is added to each sample prior to the analysis in case of internal calibration is used.
8. Calculations
Calculate the concentration in ng/µl of each identified analyte or B(a)P in the sample extract (Cs) as follows:
Calculate the air volume from the periodic flow reading taken during sampling using the following equation:

46
V =Q x T Where,
3 Q =Average flow rate of sampling m /min T = sampling time, in min.
3 V = total sample volume at ambient conditions in m
Concentration of analyte i.e B(a)P:
3The concentration of PAH compound or Benzo(a)pyrene in ng /m in the air sampled is given by:
3 C (ng /m ) = Cs * Ve / Vi *VsWhere,Cs : Concentration of Benzo (a) pyrene in ng / µl in the sample extract recorded by GC.Ve : Final volume of extract in µl (i.e 1000)Vi : Injection Volume (i.e 1µl)
3 Vs : Volume of air sample in m
9. Quality Control
For recovery efficiency isotopically labelled B(a)P or other PAH surrogate standards are added to the samples prior to extraction & analysis. The recoveries should fall between 75- 125 % preferably.A 10 ng/µl concentration B(a)P or other PAH standards are to be injected in GC/FID instrument with every batch of samples or daily as a control. If substantial variation is found in observed concentration, instrument should be recalibrated.Internal Standard of 10 ng/µl conc. is added to each sample prior to the analysis in case of internal calibration is used.
10. Detection Limit
The minimum detectable concentration in terms of B(a)P for a sampling period of 8hour (with about 480 m3 of air passed) will be 1ng /m3 assuming 1.0 ml as the final volume of sample extract after clean-up and detectable concentration of 1ng/ µl of that sample extract. High resolution capillary mass spectrometry or high pressure liquid chromatography can improve sensitivity down to 1ng/m3.
11. References
BIS Method IS 5182 (Part 12):2004 USEPA Method TO-13,
47
FLOW CHART FOR MEASUREMENT OF BENZO(A)PYRENE
EPM 2000 filter paper ê
Ultrasonic extraction with Toluene (50 ml 3 times) ê
Filter & dry with Anhydrous Sodium Sulphate ê
Concentration with Rotary Evaporator ê
Clean up with Silica Gel Column Chromatography ê
Elution with Cyclo-Hexane (5 ml 3 times) ê
Evaporate to nearly dryness under Nitrogenê
Re-dissolved in 0.5 to 1.0 ml Toluene Re-dissolved in 2.5 ml Methanol ê ê
Capillary GC-FID or GC-MS HPLC/UV-Fluorescence Detector

48
Guidelines for sampling and analysis of Lead, Nickel and Arsenic in ambient air(Atomic Absorption Spectrophotometer Method)
1. Purpose
The purpose of this protocol is to provide guidelines for monitoring of lead, nickel and arsenic in ambient air.
2. Standard
The national ambient air quality standards for lead, nickel and arsenic is presented in the table
3. Principle of the method
The Atomic Absorption Spectroscopy (AAS) technique makes use of absorption spectrometry to assess the concentration of an analyte in the sample. The method is based on active sampling using PM High Volume Sampler and then sample analysis is 10
done by atomic absorption spectrophotometer.
4. Instrument/Equipment
The following items are necessary to perform the protocol for monitoring of lead and nickel in ambient air:
— PM sampler ( high volume design based)10
— Hot plate
* Annual Arithmetic mean of minimum 104 measurements in a year at a particular site taken twice a week 24 hourly at uniform intervals.** 24 hourly or 8 hourly or 1 hourly monitored values, as applicable, shall be complied with 98% of the time in a year. 2% of the time, they may exceed the limits but not on two consecutive days of monitoring.
Pollutant Time Weighted Average
Concentration in Ambient AirIndustrial,
Residential, Rural and other Areas
Ecologically Sensitive Area (Notified by
Central Government)Lead (Pb) ,
3µg/mAnnual *
24 Hours **0.501.0
0.501.0
Nickel (Ni), 3ng/m
Annual * 20 20
Arsenic(As), 3ng/m
Annual * 06 06
49
Microwave Digestive System— Analytical balance— Digestion chamber— Polyethylene or polypropylene bottle— Glasswares— Top loading orifice kit — FAAS (Flame Atomic Absorption Spectrophotometer) or
GFAAS (Graphite Furnace Atomic Absorption Spectrophotometer)
5. Reagents / Chemicals
— Filter Paper: EPM 2000 or equivalent, 20.3 X 25.4 cm (8 X 10 in)— Hydrochloric Acid (HCl) Concentrated (AR grade)— Nitric Acid (HNO ) Concentrated (AR grade)3
— Sulphuric Acid (H SO ) Concentrated (AR grade)2 4
— Metal Standard Solutions (Certified standard)— Sodium borohydride (GR/AR grade).— Potassium iodide (GR/AR grade)— Distilled / De-ionized
6. Sampling
6.1 Sampling procedure
Tilt back the inlet and secure it according to manufacturer's instructions. Loosen the face-plate wing-nuts and remove the face plate. Remove the filter from its jacket and centre it on the support screen with the rough side of the filter facing upwards. Replace the face-plate and tighten the wing-nuts to secure the rubber gasket against the filter edge. Gently lower the inlet. For automatically flow-controlled units, record the designated flow rate on the data sheet. Record the reading of the elapsed time meter. The specified length of sampling is commonly 8 hours or 24 hours. During this period, several reading (hourly) of flow rate should be taken. After the required time of sampling, record the flow meter reading and take out the filter media from the sampler and put in a container or envelope.
6.2 Sample storage
After collecting samples, transport the filters to the laboratory, taking care to minimize contamination and loss of the sample. Glass fibre filters should be transported or shipped in a shipping envelope. Store these protective envelopes up to 30°C until analysis. The maximum sample holding times is usually 180 days. Analyze the samples within 180 days.
—

50
7. Analysis
7.1 Extraction of Samples
The collected sample on glass fibre filters may be extracted by either hot plate procedure or by microwave extraction (Method IO-3.1).
7.1.1 Microwave extraction
Cut 1"x 8" strip or half the filter from the 8"x10" filter sample and place on its edge in a labelled centrifuge tube using vinyl gloves or plastic forceps. Using the plastic forceps, crush the filter strip down into the lower portion of the centrifuge tube to ensure acid volume will cover entire filter. Add 10.0 ml of the extraction solution to each of the centrifuge tubes (3% conc. HNO and 8% conc. HCl). Place the centrifuge tubes in a 3
Teflon vessel containing 31 ml of deionized water. Place the vessel caps with the pressure release valves on the vessels hand-tight and tighten using the capping station to a constant torque of 12 ft-lb. Place the vessels in the microwave carousel. Connect each sample vessel to the overflow vessel using the Teflon connecting tubes. Place the carousel containing the 12 vessels on to the turntable of the microwave unit. Irradiate the sample vessels at 486 W (power output) for 23 min.
Allow the pressure to dissipate, then remove the carousel containing the vessels and cool in tap water for 10 min. using the caping station uncap the microwave vessels, remove the labelled centrifuge tube containing samples. Add 10ml of deionized water to each centrifuge tube. Cap the centrifuge tube tightly and mix the contents thoroughly for 2-3 minutes to complete extraction. The final extraction volume is 20ml based upon the above procedure. Filter the extracted fluid with Whatman No. 41 and make up the final volume to 100 ml, the filtered sample is now ready for analysis.
7.1.2 Hot plate procedure
Cut a 1" x 8" strip or half the filter from the 8" x 10" filter using a stainless steel pizza cutter. Place the filter in a beaker using vinyl gloves or plastic forceps. Cover the filter with the extraction solution (3% HNO & 8% HCl). Place beaker on the hot-plate 3
(Temperature below 80°C), contained in a fume hood, and reflux gently while covered with a watch glass for 30 min. Do not allow sample to dry. Remove the beakers from the hot-plate and allow to cool. Rinse the beaker walls and wash with distilled water. Add approximately 10 mL reagent water to the remaining filter material in the beaker and allow to stand for at least 30 min. Transfer the extraction fluid in the beaker to a 100 mL volumetric flask or other graduated vessel. Rinse the beaker and any remaining solid material with distilled water and add the rinses to the flask. Dilute to the mark with distilled water (Type I) water and shake. The final extraction solution concentration is 3 % HNO /8% HCl. The filtered sample is now ready for analysis3
51
7.2 Analysis of samples
7.2.1. Instrument / Equipment
A light beam containing the corresponding wavelength of the energy required to raise the atoms of the analyte from the ground state to the excited state is directed through the flame or furnace. This wavelength is observed by a monochromator and a detector that measure the amount of light absorbed by the element, hence the number of atoms in the ground state in the flame or furnace. A hollow cathode lamp for the element being determined provides a source of that metal's particular absorption wavelength.
The method describes both flame atomic absorption (FAA) spectroscopy and graphite furnace atomic absorption (GFAA) spectroscopy. Atomic Absorption Spectrophotometer - analyze the metals by Flame, if results are below detection limit then go for GTA. Arsenic is analyzed by Flame - VGA.
7.2.2. Flame Procedure
Set the atomic absorption spectrophotometer for the standard condition as follows: choose the correct hollow cathode lamp, align the instrument, position the monochromator at the value recommended by the manufacturer, select the proper monochromator slit width, set the light source current, ignite the flame, regulate the flow of fuel and oxidant, adjust the burner for maximum absorption and stability and balance the meter. Run a series of standards of the metal of interest and construct a calibration curve. Aspirate the blanks and samples. Dilute samples that exceed the calibration range. For Lead (Pb) and Nickel (Ni), the wavelength required for analysis is 217nm and 232nm respectively. Where as in case of Arsenic (As), the VGA should attach with Flame and the wavelength required for analysis is 193.7nm.
7.2.3. Furnace Procedure
As a general rule, samples that can be analyzed by flame or furnace may be more conveniently run with flame since flame atomic absorption is faster, simpler and has fewer interference problems. Tube life depends on sample matrix and atomization temperature. A conservative estimate of tube life is about 50 firings. Read the metal value in µg/L from the calibration curve or directly from the read-out of the instrument.
8. Calibration
Prepare standard solutions from the stock solutions. Select at least three standards to cover linear range as recommended by method. Aspirate the standards into the flame or inject the standards into the furnace and record the absorbance. Prepare the calibration graph by plotting absorbance and concentration in µg/ml.

52
8.1. Preparation of Standards
For each metal that is to be determined, standards of known concentration must be acquired commercially certified standards.
8.2. Standard Curve
Standard curve is prepared by using standard solutions of known concentration.
9. Quality Control
To produce good quality data, perform quality control checks and independent audits of the measurement process; document their data and use materials, instruments and measurement procedures that can be traced to an appropriate standard of reference. Shewart's analytical quality control chart should be maintained for good quality data. Detection limit and working range for each metal should be followed of the working instrument.
9.1 Precision
Analyze the pretreated sub-samples. Calculate the standard deviation (S) and coefficient of variation (CV) where CV = S.100/mean value. If the CV is greater than 10%, check the whole procedure for possible errors and/or contamination. The precision of the method is normally better than + 5% at the 95% confidence level.
9.2 Accuracy
Analyze the pretreated Certified Reference Material (CRM) or internal reference material. Calculate the mean and the standard deviation. If the value given for the CRM is within the interval of mean + standard deviation, the method has the required accuracy. If not, check the whole procedure.
10. Calculations
10.1 Sample Air Volume
Sample air volume can be calculated by using the following equation:
V = (Q) (t)
Where,3V = volume of air, m
3Q = average sampling rate, m /min.t = time in minutes.
53
10.2 Metal Concentration
C = (Ms - Mb) x Vs x Fa/V x Ft
Where,3C = concentration, µg metal/m .
Ms = metal concentration µg/mLMb = blank concentration µg/mLVs = total volume of extraction in mL
2Fa = total area of exposed filter in cm3V = Volume of air sampled in m
2Ft = Area of filter taken for digestion in cm
11. References
— Method IO-2.1 Sampling of Ambient Air for Total Suspended Particulate Matter (SPM) and PM10 Using High Volume (HV) Sampler
rd— Method 501, Air Sampling and Analysis, 3 Edition, Lewis publishers Inc.— IS 5182 Part 23 Method of Measurement of Air Pollution :Respirable
Suspended Particulate Matter (PM10) cyclonic flow technique — EPA compendium method IO 3— EPA compendium method IO 3.1— EPA compendium method IO 3.2
th— Standard Method-American Public Health Association (APHA), 20 Edition, 1998.
FLOW CHART FOR SAMPLE PROCESSING OF LEAD, NICKEL AND ARSENIC IN AMBIENT AIR
Collect the particulate matter on glass fibre filter (EPM 2000 or equivalent) using PM sampler (High Volume Sampling).10
ê
Divide the filter paper in two equal parts ê
Half portion of filter paper for the measurement of lead, nickel and arsenicê
Extract the sample by either hot plate procedure or by microwave extraction
êAnalysis of extracted sample using recommended method

54
FLOW CHART FOR MEASUREMENT OF LEAD AND NICKEL BY FLAME-ATOMIC ABSORPTION SPECTROPHOTOMETER:
Method I (Method IO-3 ,IO-3.2)Switch on Atomic Absorption Spectrophotometer
êSelect and set the Hollow Cathode Lamp of desired metal and programming the
instrument accordingly ê
Adjust and align the instrument as per requirement ê
Switch on Compressor for Air and Open the required gas cylinders (Air - Acetylene for Flame analysis), Ignite the Flame
Calibration with metal standards as recommended in method ê
Prepare calibration graph ê
Analyze the digested samples ê
Calculate the concentration using calibration graph
FLOW CHART FOR MEASUREMENT OF LEAD, NICKEL AND ARSENIC BY GRAPHITE TUBE-ATOMIC ABSORPTION SPECTROPHOTOMETER:
Method II (Method IO-3,IO-3.2)Switch on Atomic Absorption Spectrophotometer
êPlace the furnace, adjust and align the instrument as per requirement of GTA.
êSelect and set the Hollow Cathode Lamp of desired metal and programming the
instrument accordingly for standards and samples ê
Switch on Chiller and keep the Temperature at 200 C. Open the Nitrogen gas ê
Clean the Graphite Tube with a firing ê
Click the START Button ê
Calibration with metal standards as recommended in method ê
Prepare calibration graph ê
Analyze the digested samples ê
Calculate the concentration using calibration graphê
Note: Always follow the instructions of the Instrument/ Operational manual given by the supplier
55
FLOW CHART FOR MEASUREMENT OF ARSENIC BY FLAME- ATOMIC ABSORPTION SPECTROPHOTOMETER USING VAPOUR GENERATION
ASSEMBLY (VGA):Method III
(Standard Method- American Public Health Association (APHA), 20th Edition, 1998.)
Switch on Atomic Absorption Spectrophotometer ê
Select and set the Hollow Cathode Lamp of Arsenic and programming the instrument accordingly
êAdjust and align the instrument as per requirement -VGA
êSwitch on Compressor for Air and Open the required gas cylinders (Air - Acetylene
for Flame analysis and Nitrogen for Hydride Generator) ê
Ignite the Flame ê
Check the flow rate of Hydride Generator ê
Calibration with Arsenic standards as recommended in method ê
Prepare calibration graph ê
Analyze the digested samples ê
Calculate the concentration using calibration graph
Note: Always follow the instructions of the Instrument / Operational manual given by the supplier

56
DISCLAIMER
The guidelines for the measurement of Ambient Air Pollutants (NAAQS 2009) are based on the reference methods (Viz. Indian Standards, United States Environment Protection Agency and Inter Society Committee) based on field and laboratory experiences.
Efforts have been made to make it user friendly and easily understandable, however comments and suggestions towards its improvement are solicited.
© Central Pollution Control Board, 2011
A
CE
NTR
AL
PO
LLU
TIO
N C
ON
TRO
L B
OA
RD
FIE
LD D
AT
A S
HE
ET
FO
R G
AS
EO
US
PO
LLU
TA
NT
S
Sta
tion:
D
ate:
Gra
ph F
acto
r S
O2
Gra
ph F
acto
r
NO
2
Shi
ft Is
t Shi
ft IIn
d S
hift
III
rd S
hift
Mon
itorin
g P
erio
d 06
:00A
M-
10:0
0AM
10:0
0AM
-
02:0
0 P
M
02:0
0PM
-06
:00P
M
06:0
0PM
-10
:00P
M
10:0
0PM
-02
:00A
M
02:0
0AM
-06
:00A
M
Par
amet
er S
O2
NO
2 S
O2
NO
2 S
O2
NO
2
SO
2
NO
2
SO
2
NO
2
SO
2
NO
2
Ho
urly
Flo
w R
ate
(lpm
)
Ave
rag
e Fl
ow R
ate
(lpm
)
Tota
l Op
erat
ion
Tim
e (M
inut
es)
Initi
al V
olum
e o
f Sam
ple
(ml)
Fina
l Vo
lum
e o
f Sam
ple
(m
l)
Vo
lum
e Ta
ken
For
Ana
lysi
s (m
l)
Tota
l Vo
lum
e o
f A
ir S
amp
led
(lit
.)
Ab
sorb
ance
(B
lank
)
Ab
sorb
ance
(S
amp
le)
Co
ncen
trat
ion
(µg
/m3 )
24 H
our
ly A
vera
ge
SO
2 (µ
g/m
3 ):
24
Ho
urly
Ave
rag
e N
O2
(µg
/m3 ):
Rem
arks
:
Nam
e &
Sig
natu
re o
f Off
icia
l on
dut
y
An
alyz
ed b
y:
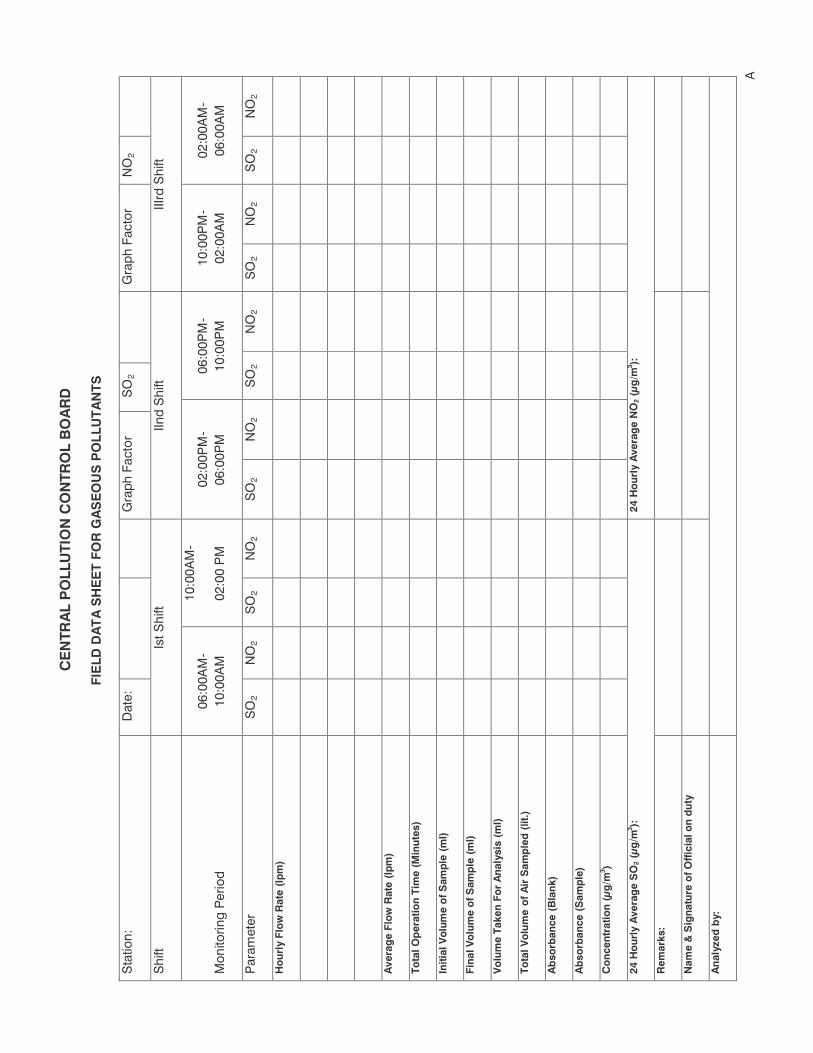

B
CE
NTR
AL
PO
LLU
TIO
N C
ON
TRO
L B
OA
RD
RE
SU
LTS
DA
TA
SH
EE
T F
OR
GA
SE
OU
S P
OLL
UT
AN
TS
& P
M10
Loca
tio
n:
Mo
nth
:
Yea
r:
TIM
E (
Hrs
.)
06-1
0
10-1
4
14-1
8
18-2
2
22-0
2 0
2-06
4
HR
S.
MA
X
24
HR
S.A
VG
8
HR
S. A
VG
PM
10
24 H
RS
. A
VG
PA
RA
ME
TE
R
/DA
TE
SO
2 N
O2
SO
2 N
O2
SO
2 N
O2
SO
2 N
O2
SO
2 N
O2
SO
2 N
O2
SO
2
NO
2
SO
2
NO
2
06-1
4
14-2
2
22-0
6
PM
10
No
te: A
ll va
lues
are
exp
ress
ed in
µg/
m3
Wea
ther
Co
ndit
ion:
Cle
ar/C
loud
y/R
ainy
Nam
e &
Sig
natu
re o
f O
ffic
ial o
n D
uty:
C
hec
ked
by:
C
CENTRAL POLLUTION CONTROL BOARD
DATA SHEET FOR PARTICULATE MATTER (Size less than 10 µm) or PM 10
Station: Date:
Shift
Monitoring Duration
Filter Paper No.
Hourly Flow Rate (m3/minute)
Average Flow Rate (m3/minute)
Total Operation Time (Minutes)
Initial Weight of Filter Paper (gms.)
Final Weight of Filter Paper (gms.)
Dust Contents (gms.)
Total Volume of Air Sampled (m3)
Concentration (µg/m3)
24 Hourly Average SPM (µg/m3):
Remarks:
Name & Signature of Official
on Duty:
Analyzed by:

D
SA
MP
LE T
RA
CK
ING
SH
EET
(P
M2
.5)
Filter
Pap
er N
os.
Sen
der
’s
or
Oper
ator’s
Sig
nat
ure
Rec
eive
d b
y
(Sig
nat
ure
)
F.Pa
per
Typ
e
Lot/
Bat
ch N
o.
Site
Des
crip
tion
Dat
e of
Sam
plin
g
Insp
ection
Dat
e of
insp
ection
In
spec
tion d
one
by
Cer
tified
by
Lab C
ode
Pre-
conditio
nin
g
Nat
ure
D
ate
and T
ime
D
one
by
Cer
tified
by
Pre-
wei
ghin
g D
ate
and T
ime
Wei
ghed
by
Bal
ance
Cal
ibra
tion (
Y/N
) Contr
ol w
eight
Sta
tus
D
ispat
ch d
etai
l D
ate
To (
Spec
ify
Sites
)
Fi
lter
Rec
eivi
ng
Dat
e &
Tim
e Sites
Sam
plin
g d
ate
& t
ime
Conditio
n o
f filter
s
Po
st C
onditio
nin
g N
ature
D
ate
and T
ime
D
one
by
Cer
tified
by
Po
st-w
eighin
g
Dat
e &
Tim
e W
eighed
by
Bal
ance
Cal
ibra
tion (
Y/N
) Contr
ol w
eight
Sta
tus
D
ispat
ch D
etai
l D
ate
& t
ime
To (
Spec
ify
Lab)
Para
met
ers
Res
ults
Exp
ecte
d
by
the
dat
e
E
CENTRAL POLLUTION CONTROL BOARD
PM2.5 ANALYSIS REPORT
Name of the Project : Name of Executing Agency : Sampling Location ID and Name : Monitoring Season : Date and Time of Monitoring : ID of Instrument used : Last date of Calibration : Field Sampling Done by : Analysis Done By : Filter ID : Start time
Closing time
Initial Weight (mg)
Final weight (mg)
Flow rate (LPM)
Air Volume (m3)
Calculation: Volume of air passed (V) = Sampling Duration (Min) X LPM (Average) Dust collected on Filter (M) = (Final weight – Initial weight) * 1000 µg Concentration = M / V µg/m3 Remarks: Meteorological conditions: Temperature – (Min & Max) % RH – (Min & Max) Rain fall – Sampling Stoppage time (if any) with reason: Name & Signature of Field Operator Name & Signature of Analyst
Report Checked by (Supervisor) Report Approved by (Officer in charge)

D
SA
MP
LE T
RA
CK
ING
SH
EET
(P
M2
.5)
Filter
Pap
er N
os.
Sen
der
’s
or
Oper
ator’s
Sig
nat
ure
Rec
eive
d b
y
(Sig
nat
ure
)
F.Pa
per
Typ
e
Lot/
Bat
ch N
o.
Site
Des
crip
tion
Dat
e of
Sam
plin
g
Insp
ection
Dat
e of
insp
ection
In
spec
tion d
one
by
Cer
tified
by
Lab C
ode
Pre-
conditio
nin
g
Nat
ure
D
ate
and T
ime
D
one
by
Cer
tified
by
Pre-
wei
ghin
g D
ate
and T
ime
Wei
ghed
by
Bal
ance
Cal
ibra
tion (
Y/N
) Contr
ol w
eight
Sta
tus
D
ispat
ch d
etai
l D
ate
To (
Spec
ify
Sites
)
Fi
lter
Rec
eivi
ng
Dat
e &
Tim
e Sites
Sam
plin
g d
ate
& t
ime
Conditio
n o
f filter
s
Po
st C
onditio
nin
g N
ature
D
ate
and T
ime
D
one
by
Cer
tified
by
Po
st-w
eighin
g
Dat
e &
Tim
e W
eighed
by
Bal
ance
Cal
ibra
tion (
Y/N
) Contr
ol w
eight
Sta
tus
D
ispat
ch D
etai
l D
ate
& t
ime
To (
Spec
ify
Lab)
Para
met
ers
Res
ults
Exp
ecte
d
by
the
dat
e
E
CENTRAL POLLUTION CONTROL BOARD
PM2.5 ANALYSIS REPORT
Name of the Project : Name of Executing Agency : Sampling Location ID and Name : Monitoring Season : Date and Time of Monitoring : ID of Instrument used : Last date of Calibration : Field Sampling Done by : Analysis Done By : Filter ID : Start time
Closing time
Initial Weight (mg)
Final weight (mg)
Flow rate (LPM)
Air Volume (m3)
Calculation: Volume of air passed (V) = Sampling Duration (Min) X LPM (Average) Dust collected on Filter (M) = (Final weight – Initial weight) * 1000 µg Concentration = M / V µg/m3 Remarks: Meteorological conditions: Temperature – (Min & Max) % RH – (Min & Max) Rain fall – Sampling Stoppage time (if any) with reason: Name & Signature of Field Operator Name & Signature of Analyst
Report Checked by (Supervisor) Report Approved by (Officer in charge)

F
DATA SHEET FOR OZONE IN AMBIENT AIR
Monitoring Duration
Average Flow Rate (lpm)
Total Sampling Time (Minutes)
Total Volume of Air Sampled (lit.)
Volume of Sample (ml)
Absorbance (Blank)
Absorbance (Sample)
Conc. (µg/m3)
0600-0700
0700-0800
0800-0900
0900-1000
1000-1100
1100-1200
1200-1300
1300-1400
1400-1500
1500-1600
1600-1700
1700-1800
1800-1900
1900-2000
2000-2100
2100-2200
2200-2300
2300-2400
2400-0100
0100-0200
0200-0300
0300-0400
0400-0500
0500-0600
G
CE
NTR
AL
PO
LLU
TIO
N C
ON
TRO
L B
OA
RD
Dat
a Sh
eet
for
Ozo
ne
Mon
th:
S
tatio
n:
Du
rati
on
Dat
e06
-07
07
-08
08
-09
09
-10
10
-11
11
-12
12
-13
13
-14
14
-15
15
-16
16
-17
17
-18
18
-19
19
-20
20
-21
21
-22
22
-23
23
-24
24
-01
01
-02
02
-03
03
-04
04
-05
05
-06
Conc
entr
atio
ns in
µg/
m3

H
CENTRAL POLLUTION CONTROL BOARD AIR LAB DIVISION
FIELD DATA SHEET (BaP/PAH MONITORING)
Monitoring Location Details: Sheet No.----------
Monitoring team members (Names with Signatures & Dates):
1____________________ 2.________________ ____ 3._______________ ______
Project Coordinator (Name with Signature): _______________ ________________
Date & time of start Date & time of close Run Time in Minutes
Instrument Make & S.No
Average Flow Rate Total Air Volume
Filter Paper No Final Weight (gm) Initial Weight (gm)
Net Weight (gm) PM10 Conc. (ug/m3) Special Weather Note (Rainy/cloudy/Sunny/ Windy/stormy Day)
Pl fill which ever Shift applicable
Time
Mano- meter Reading m3/min Ti
mer
R
ead
ing Time Mano-
meter Reading m3/min Ti
mer
R
eadi
ng Time Mano-
meter Reading m3/min Ti
mer
R
ead
ing
6.00 14.00 22.00 7.00 15.00 23.00 8.00 16.00 24.00 9.00 17.00 01.00 10.00 18.00 02.00 11.00 19.00 03.00 12.00 20.00 04.00 13.00 21.00 05.00 14.00 22.00 06.00 Avg. Flow m3/min
Avg. Flow m3/min
Avg. Flow m3/min
I
CENTRAL POLLUTION CONTROL BOARD AIR LAB DIVISION
BaP/PAH ANALYSIS REPORT
Report S. No. _______________ Date: ________________
S.No. Sampling Location
Sample details
Date of Sampling
Time of sampling
Benzo(a)Pyrene (ng/m3)
TPAH (ng/m3) (if analysed)
1. 2. 3. 4. 5. 6.
Note: Sample analyzed using Capillary GC-FID.
(Analyst) (Supervisor) (I/C –Laboratory)

J
CENTRAL POLLUTION CONTROL BOARD
DATA SHEET FOR PARTICULATE MATTER (Size less than 10 µm) or PM10
Station: Date:
Shift
Monitoring Duration
Filter Paper No.
Hourly Flow Rate (m3/minute)
Average Flow Rate (m3/minute)
Total Operation Time (Minutes)
Initial Weight of Filter Paper (gms.)
Final Weight of Filter Paper (gms.)
Dust Contents (gms.)
Total Volume of Air Sampled (m3)
Concentration (µg/m3)
24 Hourly Average SPM (µg/m3):
Remarks:
Name & Signature of Official
on Duty:
Analysed by:
K
CENTRAL POLLUTION CONTROL BOARD
Parivesh Bhawan, East Arjun Nagar, Delhi -110 032
Trace Metals Analysis Report
1. Report no. & issue date : 2. Name of the Project : 3. Sample matrix : 4. Date & time of sample collection : 5. Samples collected by :
6. Date & time of sample receipt : 7. Date of sample analysis : 8. Sample registration no. & date : 9. Sampling plan reference : 10. Test method reference : 11. Report sent to (Name & Address) :
S. No. Sample Code Pb (µg/ml) Ni (µg/ml) As (µg/ml) Statement: 1. The results relate only to the samples tested. 2. The report shall not be reproduced except in full, without the written approval
of the laboratory. Analyst Supervisor In-Charge

L
CENTRAL POLLUTION CONTROL BOARD Parivesh Bhawan, East Arjun Nagar, Delhi -110 032
Analysis report of Metals
Month: Station:
Date 24 hour average concentration
Lead (µg/m3) Nickel (ng/m3) Arsenic (ng/m3)
Analyst Supervisor Incharge
M
Form A-1 Ambient Air Quality Data Reporting Format (Annual)
Monitoring Agency
:
Year :
Name of City : Name of Station : Station Code :
Area :
Parameters Unit No. of 24
Hourly observations
Annual Mean
Measurement Method #
Sulphur dioxide (SO2) µg/m3 Improved West and Gaeke Method
Ultraviolet Fluorescence Any Other
Nitrogen dioxide (NO2) µg/m3 Jacob & Hochheiser modified (NaOH-NaAsO2) Method
Gas Phase Chemiluminescence Any Other
Ammonia (NH3) µg/m3 Chemiluminescence Indophenol method Any Other
Particulate Matter, PM 10 µg/m3 Gravimetric Beta attenuation TEOM Any Other
Particulate Matter, PM 2.5 µg/m3 Gravimetric Beta attenuation TEOM Any Other
Lead (Pb) µg/m3 AAS/ICP Method after sampling on EPM 2000 or equivalent filter paper
ED-XRF using Teflon filter Any Other
Nickel (Ni) ng/m3 AAS/ICP Method after sampling on EPM 2000 or equivalent filter paper Any Other
Arsenic (As) ng/m3 AAS/ICP Method after sampling on EPM 2000 or equivalent filter paper Any Other
Benzo (a) Pyrene (BaP) ng/m3 Solvent extraction followed by HPLC/GC analysis
Any Other
Benzene (C6H6) µg/m3
Gas Chromatography (GC) based continuous analyzer
Adsorption and desorption followed by GC analysis
Any Other
# Tick (√) mark the method followed
(Checked & Compiled by) (Authorized Signatory)

N
Form D-1 Ambient Air Quality Data Reporting Format (24 Hours)
Monitoring Agency :
Month & Year :
Name of City :
Name of Station : Station Code :
Area :
Dateâ Concentration
SO2 (µg/m3)
NO2
(µg/m3) PM10
(µg/m3) PM2.5
(µg/m3) NH3
(µg/m3)
Benzene (µg/m3)
Measurement Method #
Improved West and Gaeke Method
Jacob & Hochheiser modified (NaOH-NaAsO2) Method
Gravimetric Gravimetric Chemiluminescence
Gas Chromatography (GC) based continuous analyzer
Beta attenuation Beta attenuation
Ultraviolet Fluorescence
Gas Phase Chemiluminescence TEOM TEOM Indophenol
method
Adsorption and desorption followed by GC analysis
Any Other Any Other Any Other Any Other Any Other Any Other
# Tick (√) mark the method followed Note: 24 hourly Data of Benzene required for calculation of Annual average (Checked & Compiled by) (Authorized Signatory)
O
Form D-2 Ambient Air Quality Data Reporting Format (01 Hour/08Hours)
Monitoring Agency : Month & Year : Name of City : Name of Station : Station Code : Area : CO
(mg/m3) CO
(mg/m3) Ozone (µg/m3)
Ozone (µg/m3)
Measurement Method #
Non dispersive Infrared (NDIR) Spectroscopy
UV Photometric Chemiluminescence
Any Other Chemical Method Any Other
Hours 01 Hour 08 Hours 01 Hour 08 Hours # Tick (√) mark the method followed (Checked & Compiled by) (Authorized Signatory)
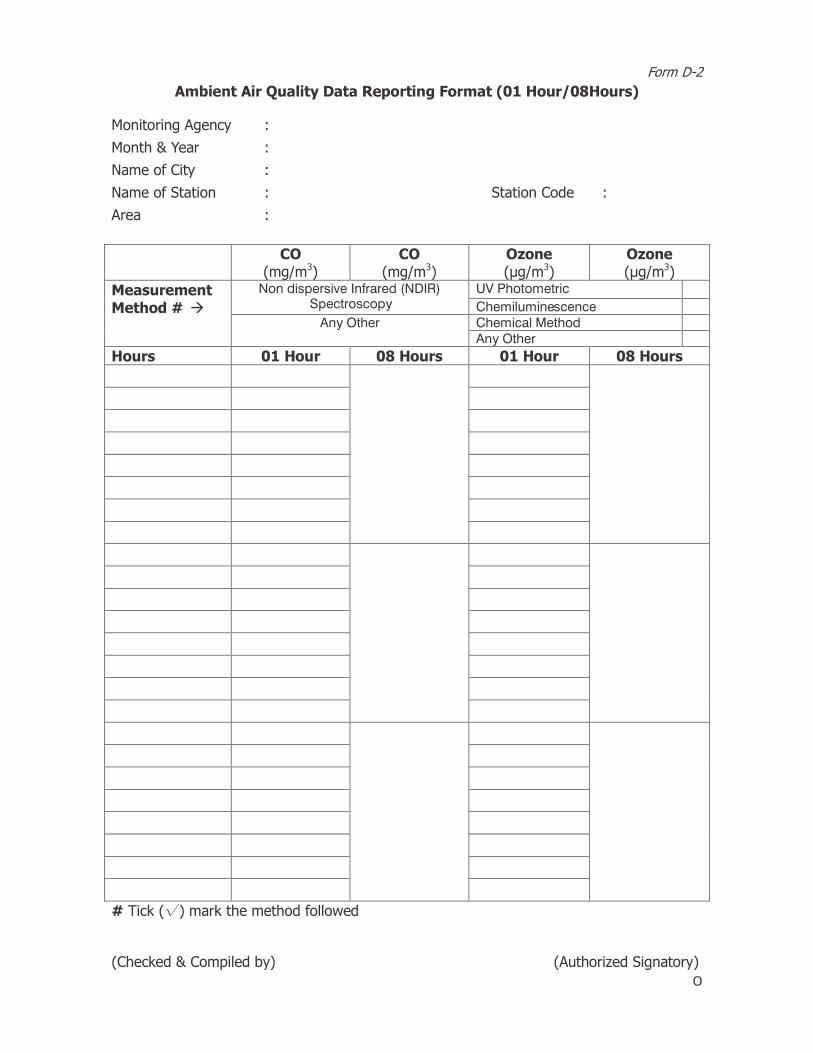

P
Form D-3
Ambient Air Quality Data Reporting Format (24 Hours)
Monitoring Agency
:
Month & Year :
Name of City :
Name of Station : Station Code :
Area :
Date
Concentration in PM10
Lead (Pb)
(µg/m3) Nickel (Ni)
(ng/m3) Arsenic (As)
(ng/m3)
BaP (ng/m3)
Measurement Method #
AAS/ICP Method after sampling on EPM 2000 or equivalent filter paper
AAS/ICP Method after sampling on EPM 2000 or equivalent filter paper
AAS/ICP Method after sampling on EPM 2000 or equivalent filter paper
Solvent extraction followed by HPLC/GC analysis
Any Other Any Other Any Other Any Other
Note: 24 hourly Data of Nickel, Arsenic & BaP required for calculation of Annual average
(Checked & Compiled by) (Authorized Signatory)
Zonal Offices of Central Pollution Control Board
PARIVESH BHAWAN, CPCB HEAD OFFICE
Central Pollution Control Board‘Parivesh Bhawan’, East Arjun Nagar,
Shahdara, Delhi -110 032Tel. 011-43102030
Telefax- 22305793/22307078/22301932/22304948e-mail : [email protected] Web: cpcb.nic.in
BA
NG
ALO
RE
BH
OP
AL
KO
LK
ATA
LU
CK
NO
W
SH
ILLO
NG
VA
DO
DA
RA
AG
RA
PR
OJE
CT
OFFIC
E
1st and 2nd Floors, Nisarga Bhavan,A-Block, Thimmaih Main Road, 7th D Cross,
Shivanagar, Opp. Pushpanjali Theatre,Banglore - 560 010
Tel. 080-23233827 (O) 080-23233739/23233827/23233996 Fax- 080-23234059
3rd Floor, Shakar Bhawan, North TT Nagar, Bhopal - 462 003
Tel. 0755-2775587 (O)2775385/86 (EPABX)Fax - 0755-2775587
Southernd ConclaveBlock 502, 5th & 6th Floors, 582 Rajdanga, Main Road,
Kolkata - 700 107Tel. 033-24416332 (Direct)24414289/4677/6003/6634 Fax - 033-24418725
Ground Floor, PICUP Bhawan, Vibhuti Khand, Gomti Nagar,
Lucknow - 226 010Tel. 0522-4087601/2721915/16
0522-4087600 (EPABX)Fax 0522-2721891
TUM-SIR Lower Motinagar,Near Fire Brigade H.Q.
Shillong - 793 014Tel. 0364-2520923/2522859
Fax 0364-2520805
Parivesh BhawanOpp. VMC Ward Office No. 10,
Subhanpura, Vadodara - 390 023Tel. 0265-2283226/ 2283245
Fax 0265-2283294
4, Dholpur House, M.G. Road,
Agra - 282 001Tel. 0562-2421548Fax 0562-2421568
A Clean PARIVESH for all is our goal

Guidelines for the Measurement of Ambient Air Pollutants
Volume-II
CENTRAL POLLUTION CONTROL BOARDMinistry of Environment & Forests
Website: http://www.cpcb.nic.in
Guidelines forReal TimeSampling
& Analyses
National Ambient Air Quality Series:NAAQMS/37/2012-13

Guidelines for the Measurement of Ambient Air Pollutants
Volume-II
CENTRAL POLLUTION CONTROL BOARDMinistry of Environment & Forests Parivesh Bhawan, East Arjun Nagar, Delhi- 110032
Website: http://www.cpcb.nic.in
Guidelines forReal TimeSampling
& Analyses
National Ambient Air Quality Series:NAAQMS/37/2012-13

Prepared & Published by P R Division, Central Pollution Control Board on behalf ofSh. J. S. Kamyotra, Member Secretary, CPCB
Printing Supervision and Layout : Shri G. Ganesh, Ms. Anamika Sagar and Shri Satish Kumar
Printed at Viba Press Pvt. Ltd.C-66/3, Okhla Industrial Area, Phase-II, New Delhi-110020
CPCB, 300 Copies, 2013

i
Contribution
Overall Guidance & Supervision
Sh. J. S. Kamyotra
Dr. D. Saha
Laboratory experiments & Drafting of Guidelines
Sh. D. C. Jakhwal
Sh. Rajinder Singh
Sh. Vedparkash
Sh. L. K Kapila
Sh. Rattanlal
Sh. Subhash Chand
Data Formats Dr. D. Saha
Dr. R.C. Srivastava
Sh. M. Satheesh
Editing, Charts & Computer Dr. D. Saha
Sh. D. C. Jakhwal
Sh. Fasiur Rehman
Ms. Shaveta Kohli
Setting

iii
NATIONAL AMBIENT AIR QUALITY STANDARDS (2009)
Pollutants
Time Weighted Average
Concentration in Ambient Air Methods of MeasurementIndustrial,
Residential, Rural and
other Areas
Ecologically Sensitive Area
(Notified by Central
Government) Sulphur Dioxide
(SO2), µg/m3
Annual * 24 Hours **
50 80
20 80
-Improved West and Gaeke Method-Ultraviolet Fluorescence
Nitrogen Dioxide (NO2), µg/m3
Annual *
24 Hours **
40
80
30
80
-Jacob & Hochheiser modified
(NaOH-NaAsO2) Method
-Gas Phase Chemiluminescence
Particulate Matter
(Size less than 10µm)
or PM10, µg/m3
Annual *
24 Hours **
60
100
60
100
-Gravimetric
-TEOM
-Beta attenuation
Particulate Matter
(Size less than 2.5µm)
or PM2.5, µg/m3
Annual *
24 Hours **
40
60
40
60
-Gravimetric
-TEOM
-Beta attenuation
Ozone (O3)
µg/m3
8 Hours *
1 Hour **
100
180
100
180
-UV Photometric
-Chemiluminescence
-Chemical Method
Lead (Pb)
µg/m3
Annual *
24 Hours **
0.50
1.0
0.50
1.0
-AAS/ICP Method after sampling on EPM 2000 or equivalent filter paper-ED-XRF using Teflon filter
Carbon Monoxide (CO), mg/m3
8 Hours **
1 Hour **
02
04
02
04
-Non dispersive Infrared (NDIR) Spectroscopy
Ammonia (NH3),
µg/m3
Annual *
24 Hours **
100
400
100
400
-Chemiluminescence
-Indophenol blue method
Benzene (C6H6),
µg/m3
Annual *
05
05
-Gas Chromatography (GC) based continuous analyzer
-Adsorption and desorption followed by GC analysis
Benzo(a)Pyrene (BaP) Particulate phase only, ng/m3
Annual *
01
01
-Solvent extraction followed by HPLC/GC analysis
Arsenic (As),
ng/m3
Annual *
06
06
-AAS/ICP Method after sampling on EPM 2000 or equivalent filter paper
Nickel (Ni),
ng/m3
Annual *
20
20
-AAS/ICP Method after sampling on EPM 2000 or equivalent filter paper
* Annual Arithmetic mean of minimum 104 measurements in a year at a particular site taken twice a week 24 hourly at uniform intervals.
** 24 hourly or 8 hourly or 1 hourly monitored values, as applicable, shall be complied with 98% of the time in a year. 2% of the time, they may exceed the limits but not on two consecutive days of monitoring.
NOTE: Whenever and wherever monitoring results on two consecutive days of monitoring exceed the limits specified above for the respective category, it shall be considered adequate reason to institute regular or continuous monitoring and further investigations.
Background
Guidelines for Sampling and Measurement of notified Ambient Air Quality Parameters (NAAQS 2009)
Under the provisions of the Air (Prevention & Control of Pollution) Act, 1981, the CPCB has notified fourth version of National Ambient Air Quality Standards (NAAQS) in 2009. This revised national standard aims to provide uniform air quality for all, irrespective of land use pattern, across the country. There are 12 identified health based parameters, which are to measure at the national level and with a view to have data comparison, need for uniform guidelines for monitoring, sampling, analyses, sample flow chart, data sheet based on standard method has been felt.
The methods prescribed in the notification for respective parameters are the combination of physical method, wet-chemical method and continuous on-line method. Therefore, to meet the NAAQS requirement, a combination of both manual and continuous method is invariably required at each monitoring location, besides good laboratory set up and infrastructure.
In addition to the above, an in house exercise for applicability of all prescribed / recommended analytical methods was also felt necessary. After review and demonstration in the Central Laboratory, Delhi, guidelines are being prepared and documented, as under:
1. Volume -I: Guidelines for manual sampling and analyses (along with sample flow chart and data sheets);
2. Volume-II: Guidelines for real time sampling and analyses
Note: Guidelines are laboratory and infrastructure specific thus may not be applicable uniformly and need to develop based on infrastructure and expertise
ii

viv

viv

Contents
S.No. Page
1. Guidelines for Automatic Measurement of Sulphur Dioxide in ambient air (UV Fluorescence Method)
2. Guidelines for Automatic Measurement of Particulate 12-15Matter (PM and PM ) in ambient air (Beta 2.5 10
Attenuation Method)
3. Guidelines for Automatic Measurement of Carbon 16-22Monoxide (CO) in ambient air (Non-Dispersive Infrared Method)
4. Guidelines for Automatic Measurement of Oxides of 23-34Nitrogen (NO - NO - NO ) and Ammonia (NH ) in 2 x 3
ambient air (Chemiluminescence Method)
5. Guidelines for Automatic Measurement of Ozone (O ) 35-403
in ambient air (UV Photometric Method)
6. Guidelines for Automatic Measurement of benzene 41-46(BTX) in ambient air (Gas Chromatography based Continuous Method)
7. Data Formats A-D
1-11
vi 1
Guidelines for Automatic Measurement of Sulphur Dioxide in ambient air(UV Fluorescence Method)
1.0 Purpose
The purpose of this protocol is to provide guidelines for monitoring of Sulphur Dioxide (SO ) in ambient air.2
2.0 Principle
The UV fluorescence method is based on the fluorescence emission of light by SO 2
molecules previously excited by UV radiation.
The first reaction step is:
1SO + hu (UV) SO * 2 2
Then in the second step, the excited SO * molecule returns to the original ground state, 2
emitting an energy H 1 according to the reaction:
1SO * ® SO + hu (UV) 2 2
The intensity of the fluorescent radiation is proportional to the number of SO 2
molecules in the detection volume and is therefore proportional to the concentration of SO .2
Therefore:F = k [SO ]2
Where:F = is the intensity of fluorescence radiation;K = is the factor of proportionality;
[SO ] = concentration of SO2 2
The air sample flows into the inlet of the analyser where it is scrubbed to remove any interference by aromatic hydrocarbons that may be present. A hydrocarbon scrubber device usually accomplishes this.
Then the air sample flows into a reaction chamber, where it is irradiated by UV radiation with a wavelength range of (200-220) nm. The UV fluorescence light, in the wavelength range of (240-420) nm, is optically filtered and then converted to an electrical signal by a UV detector, for example, a photomultiplier tube.
®

2
The response of the analyser is proportional to the number of SO molecules in the 2
reaction chamber. Therefore, either temperature or pressure has to be kept constant, or if variation of these parameters is expected, the measured values have to be corrected. For this UV fluorescence method to yield accurate concentration measurements, it must be calibrated against some primary standard (see clause 5.4).
3.0 Instrument/Equipment
3.1 UV fluorescence Analyser - for measurement of Sulphur Dioxide in air
The analyser should be complete with analyser section, sample pump, detector amplifier/control section, meter, and recording system. The UV fluorescence analyser shall meet the performance specifications as prescribed. The main components are described below.
3.2 Selective Traps for Interfering Agents
One or more selective traps should be used before the reaction chamber to remove interfering gases such as aromatic hydrocarbons. These selective traps shall not retain any SO and shall be changed in accordance with manufacturer's instruction manual.2
If high concentrations of H S are expected in the ambient air, a selective scrubber 2
should be used.
3.3 Optical Assembly and Fluorescence Cell
The UV lamp emission may be pulsed electronically or mechanically for synchronous detection and amplification of the signal. The lamp shall have a stabilised power supply to ensure a stable emission of light. An optical filter is used to restrict the wavelengths to a range, which allows excitation of the SO molecule and yet minimise 2
the interference of water vapour, aromatic hydrocarbons or nitric oxide.
The UV detector, for example, the photomultiplier tube, detects the fluorescence light emitted by the SO molecules in the reaction chamber. A selective optical filter placed 2
in front of the UV detector, reduces the signal due to scattering of the incident light. The reaction chamber shall be made of material inert to SO and UV radiation. The cell 2
should be heated above the dew point to avoid water condensation, and temperature fluctuations. The optical trap of the chamber prevents reflection of the exciting UV radiation. The optical assembly should be placed in a heated enclosure.
3.4 Pressure Regulator
The output signal of the analyser depends on the pressure in the reaction chamber and
3
is therefore proportional to the density of SO (number of SO molecules) present in the 2 2
reaction chamber. Variations of internal pressure shall be measured and the signal corrected or controlled by means of a regulator. The signal may have to be corrected also for external pressure and temperature fluctuations. Significant pressure corrections are due to synoptic meteorological changes (up to + 3%) or by the attitude of the measurement site (about 10% decrease in pressure for an 800 m rise in attitude).
Note: One of the main causes of a reduced pressure in the reaction chamber is a pressure drop in the sample line.
3.5 Flow Rate Controller and Indicator
It is recommended that the flow rate be kept constant by means of a flow controller. A flow rate indicator should be included in the instrument.
3.6 Air Pump
A pump, which draws air through the analyser, is placed at the end of the sample flow path. If the use of UV lamp produces ozone, it is recommended to vent this ozone outside the room and far away from the sampling inlet, or a suitable charcoal filter may trap it.
4.0 SO Calibration Gas Mixtures2
4.1 Primary Calibration Method - Several equivalent methods for primary calibration can be used:
- static volumetric dilution- permeation tube sources- TCM - Tetra-chloromercurate method- gravimetric preparation of gas mixture in combination with various dilution
systemsSeveral methods for generating SO calibration gas standard mixtures are proposed 2
below. Whatever method is chosen, it is recommended that it be compared periodically against another independent traceable calibration method. The range of SO calibration 2
concentrations selected shall be in between 10% to 90% of the SO concentration range 2
in use.
4.2 Transfer Standard Calibration Method
Other methods to prepare calibration standard gases may also is used, if they are compared to one or more of the above mentioned methods. Even though any of the

4
primary calibration methods may be used as transfer standards, in practice, it is easier to use a laboratory calibrated permeation source or cylinder of SO . The latter may be 2
3used either directly (with cylinders containing 0.1 mg/m3 to 10.0 mg/m (0.03 ppm to 5 ppm) of SO in air), or with appropriate quantitative dilution (using cylinders 2
3containing ten to several hundred g/m of SO in air).2
Note: Gas cylinders shall be made of an inert material or have been passivized to ensure stability of +/-3% for the period of use expected. Low concentration cylinder must be checked regularly against primary standards.
4.3 Operational (Field) Span Check
To aid in the quality control of the routine operation of the analyser on-site, span checks may be performed regularly (e.g. daily or weekly). For example, an internal permeation device may form an integral part of the apparatus, or an external calibrated cylinder, with appropriate dilution if necessary, may be used.
The described span check system is suitable for quality control in routine operation to verify that the analyser is operating correctly, but may not be suitable for proper calibration as described in 5.1. The span check system should regularly be compared to a laboratory-based calibration system as described in 5.1.
4.4 Zero Gas
Zero air used in the calibration of the analyser should not contain a concentration of SO 2
detectable by the analyser under calibration. The concentration of O in the zero air 2
shall be within +/-2% of the normal composition of air (20.9%).
4.5 Span Gas (Calibration Gas)
The span gas must be capable of providing an accurate, stable and reliable concentration of measured gas.
4.6 MultipointCalibration
Multipoint calibration consists of three or more test concentrations including zero concentration. A concentration between 80% and 90% of the full-scale range of the analyzer under calibration, and one or more intermediate concentrations spaced approximately equally over the scale range are required. Multipoint calibrations are used to establish or verify the linearity of analyzer on initial installation and after any major repair. If a non-linear analyzer is being calibrated, additional calibration points should be included to adequately define the calibration relationship, which should be a smooth drive. Multipoint calibrations are likely to be more accurate than two point's
5
calibration because of the averaging effect of the multiple points.
The analyzers have zero and span adjustment controls, which should be adjusted based on the zero and highest test concentration to provide the desired scale range within the analyzer's specifications. Zero and span controls adjustment often affect the zero/span value, so the adjustments may have to be repeated several times to obtain consistent values i.e. zero or span concentrations.
5.0 Physical Zero and Span adjustments
All ambient monitoring analyzer have provision for zero and span adjustments. These adjustments are used to obtain the desired nominal scale range, to provide convenient scale units, and to periodically adjust the analyzer response to correct for calibration drift. Zero and span adjustments must always be followed by a calibration. Allow sufficient time between the adjustments and the calibration for the analyzer to stabilize.
6.0 Quality Control
There should be a quality control plan, which allows for modification of the frequency and number of points required for calibration. Such a quality control program assures the accuracy and reliability of the air quality data collected. The calibration program must include information of dates of calibration, atmospheric conditions, control setting and other pertinent data. The analyzer should be calibrated or re-calibrated:
(a) on its initial installation;(b) following its relocation;(c) after every repair or service;(d) if an interruption in operation of more than a few days; and(e) on detection of malfunction or changing of the analyzer in calibration.
In routine operation calibration of analyzer should be checked periodically defining period (once a week) to maintain close agreement between the calibration values used to convert analyzer responses to concentration measurements and the actual response of the analyzer. The frequency of routine periodic calibration is a matter of judgment and is a trade-off among several considerations, including:
(i) the inherent stability of the analyzer under the prevailing conditions of temperature, pressure, line voltage, etc. at the monitoring site;
(ii) the quality of the ambient measurement needed;(iii) the risk of collecting invalid data because of a malfunction or invalid data or
response problem with the analyzer that would not be discovered until the calibration is carried out.

6
When a new monitoring instrument is installed, zero and span calibration should be very frequent, may be daily. After obtaining enough data on the drift performance of the analyzer, the calibration frequency can be adjusted to provide a suitable compromise among the various considerations mentioned above. To facilitate the process of determining calibration frequency, it is strongly recommended that control charts should be used to monitor the zero and span drift performance of each analyzer. If the drift becomes excessive, then the corrective action has to be taken.
7.0 Precautions
a) Operate the analyser in air- conditioned and dust proof room b) Follow standard safety practices for the handling and storage of calibration gas
cylinders & the installation and use of the analyser. c) Do not expose calibration cylinders to direct sunlight or excessive heat.d) Maintain the same sample cell flow rate during sampling and calibration. Use
the same sample pump.
8.0 Sampling
When sampling the outside ambient from an enclosure, utilize a sampling line or probe extending at least 1 metre from the enclosure, and protected against the entry of precipitation. Place the analyser in an enclosure with atmospheric control so the temperature remains constant within ± 5° C. Record the temperature and pressure of the atmosphere sample.
9.0 Operation of the analyzer
Install the instrument in a suitable location. Follow the manufacturer's operating instructions to set the various parameters correctly, including UV source lamp intensity, sample flow rate, and (if applicable) the activation of the electronic temperature/pressure compensation. Check to ensure that the manufacturer's performance specifications are met or exceeded. If necessary, the location shall also be temperature controlled to minimise the effect of the temperature dependence of the instrument.
Sample air through the instrument and record the SO concentration by means of a 2
suitable recording device (for example, chart recorder, electronic data acquisition system, etc.). During continuous operation of the instrument, checks of the instrument zero, span, and operational parameters shall be made at least one a week. In order to ensure optimum analyser performance, follow the maintenance schedule as detailed in the manufacturer's instruction manual. It is recommended that the analyser be fully either serviced every 6 month or annually as appropriate based on the performance of
7
the analyser. A full calibration of the instrument should be carried out before and after this service.
10.0 Calibration System and Equipment
10.1 Requirements - Prior to Calibration or Zero/Span Check
a) The analyzer under calibration should be in operation for at least overnight so that it is fully warmed up and stabilized.
b) Allow the analyzer to sample test atmosphere with known concentration of pollutants.
c) During calibration, the analyzer should be operating in its normal sampling mode and it should sample the test atmosphere through all filters, scrubbers, conditioners, and other components used during normal ambient sampling and through as much of the ambient air inlet system as is practicable.
d) Complete all operational adjustments of the analyzer.
10.2 Preparation of Primary Test Gases
10.3 Static Injection System
Static calibration mixtures are prepared by introducing a known volume of pure gas into a given volume of dilution gas. The use of static injection system greatly reduces the possibilities of error. The only disadvantage with this system is availability of a small quantity of air for analysis. The availability of air quality depends on the size of the container and the maximum permissible excessive pressure.
Generally, glass bottles and flasks are used for static injection system. The exact determination of volume of the container is a basic prerequisite for static injection. The exact volume of glass bottle can be determined by filling the bottle with distilled water and then measure the volume of water by taking out from the bottle. The bottle volume is again determined by increasing the glass bottle pressure by 1.0 bar. The excess pressure allows the water to pass through a calibrated wet gas meter.
The volume of gas obtained from glass bottle should be corrected to normal conditions (25°C at 1013 hPa). A precision measuring manometer with a tolerance of 0.1% or an electronic pressure calibration standard may be used to ascertain the exact pressure of the container.
The glass bottle is evacuated and filled with dilution gas (zero gas) and a measured quantity of pure gas (100%) is injected by calibrated syringe (micro syringes) directly into the glass bottle through the septum. The gases (pure and dilution) are mixed inside the glass bottle by an externally controlled stirrer. This gas mixture is now used for calibration of analyzers.

8
10.4 CalculationThe concentration by volume of a pure gas can be calculated from the following equation:
Volume of InjectionCalibration concentration = Concentration of pure gas x
Volume of Dilution Gas
10.5 Permeation System
A permeation device is a gas source, which permanently emits a constant known quantity of a pure gas. It consists of a small container with a permeable wall, typically consisting entirely of PTFE (Teflon) or of stainless steel with a small PTFE wafer. The gases to be used (SO , NO , H S etc.) to generate standard gas mixture of variable 2 2 2
concentration, is kept pure in liquid form. Since the compound is liquid, it will always have a constant vapour pressure, if temperature is constant.
Gravimetric method is used for calibrating the permeation tube at different flow rate. The pre-weighted permeation tube (SO , NO , H S etc.) are kept in permeation oven for 2 2 2
constant temperature. After an interval of about 10 days, the tubes are taken out and weighed. The permeation rate of tubes is calculated by dividing the weight loss by time period.
10.6 CalculationDifference in Weight ( µg)
Permeation Rate (PR) = Time Period (Min)
Permeation Rate ( g / min)Concentration (C) =
3Dilution Gas Flow (m / min)
3C = µg / m
10.7 Procedure for Calibration with Permeation Tube
i) Take a new permeation tube and put it into permeation oven of a calibration unit for stabilisation at least for 48 hours.
ii) After the stabilisation take the initial weight (w ) of permeation tube in a 1
balance, which can measure up to 5 decimal value and record date & time (t ). 1
Put back the tube again in permeation oven in same condition as earlier.iii) Take out the permeation tube from oven approximately after 10 days and
weight it again (w ) and note down the date & time (t ) and put back the tube into 2 2
permeation oven.
9
iv) Calculations:Difference in Weight (w - w ) gms1 2
Permeation Rate (PR) = Difference in Time (t - t ) min2 1
Permeation Rate (PR) ( g / min.)SO Concentration = 2
3 S* x Dilution Flow (m / min)
S* = SO Concentration at 25 Degree Centigrade,231.0 ppb = 2.618 µg / m
10.8 Example
Let us take the permeation tube of Sulphur dioxide for calibration:Date = 20.05.09, Time = 11 a.m. (t )1
Weight of permeation tube = 0.05250 gms. (w )1
Date = 31.05.09, Time = 10.30 a.m. (t )2
Weight of permeation tube = 0.04936 gms. (w )2
Difference in weights (w - w )1 2
0.05250 - 0.4936 = 0.00314 gmsTime Difference (t - t )2 1
10 days, 23 hrs., 30 minutes = 15810 minutes
0.00314 gms.Permeation Rate = = 0.199 µg / min.
15810 minutes
Sulphur Dioxide concentration at different flow rates:
0.199 µg / min.50 liters / hr. =
0.833 x10⁻³ m3 / min x 2.618 µg / m3
= 91.25 ppb
100 litres / hr. = 45.52 ppb150 litres / hr. = 30.83 ppb200 litres / hr. = 22.83 ppb

10
11.0 Calibration of the Ambient SO2Analyser
11.1 Principle - During this procedure, the ambient SO analyser shall be operated at 2
its normal flow rate and temperature. The calibration includes measurements of zero air, span gas and at least five SO concentrations (using a primary calibration gas 2
standard described in section 11.3 & 11.6) which shall be spaced to cover the ambient range.For all calibrations, flow of calibration gases to the manifold shall exceed, by at least 20%, the total flow required by the instrument attached to the manifold, with the excess appropriately vented at atmospheric pressure.
11.2 Calibration Procedure
11.3 Zero Calibration - Switch on the analyzer at ZERO mode and zero gas from internal source will be measured by the analyzer. After the reading has stabilized, check the display of the zero value. In case of derivation, adjust the zero value.
11.4 Span Calibration - After the ZERO calibration has been done, switch the analyzer at SPAN mode. SO span gas (pre-determined concentration) from 2
permeation tube, kept in permeation oven, would be measured by the analyzer. In case of any deviation in the displayed value and the span gas concentration adjust the reading of analyzer to the span value. Repeat ZERO and SPAN calibration for atleast three times or till stable and true values are indicated. After ZERO and SPAN calibration, switch the analyzer at SAMPLE mode. Now, analyzer will measure SO 2
present in the ambient air.
11.5 Field Calibration Procedure with a Transfer Standard - A two-point calibration of the analyser with a transfer standard calibrated previously against a reference calibration system is acceptable in field conditions.
12.0 OPERATIONAL CHECKS
12.1 Zero and Span Settings
If the required zero and span corrections performed in accordance with calibration procedure are greater than 80% of the range, have the analyser serviced.
12.2 Sample Flow Rate
If the sample flow rate has changed by more than ± 20% of the initial value, check the particulate filter for blockage, and the sample pump for proper operation. Check the filter monthly by measuring the flow rate with and without the filter in place. Replace the filter if the drop is more than 5%.
11
12.3 Temperature Control
Check the temperature of the shelter or room in which the analyser is located. If, it has changed by more than ± 5°C, have the heating-cooling system serviced.
13.0 Record
The calibration record of analyzer with details like calibration data, calibration equation, analyzer identification, analyzer location, calibration standards used and their traceability, identity of calibration equipment used shall be maintained by the concerned laboratory staff.
14.0 References
1. ISO 10498.2. 1999 Ambient Air - Determination of Sulphur Dioxide - Ultraviolet Fluorescence method.
2. CPCB DOC: CB/CL/SOP/5.6/8, Issue No. 01, Issue date: 17.07.2003, Procedure for calibration of ambient air quality monitoring analyzers
Schematic Flow Diagram of Sulphur Dioxide Analyser
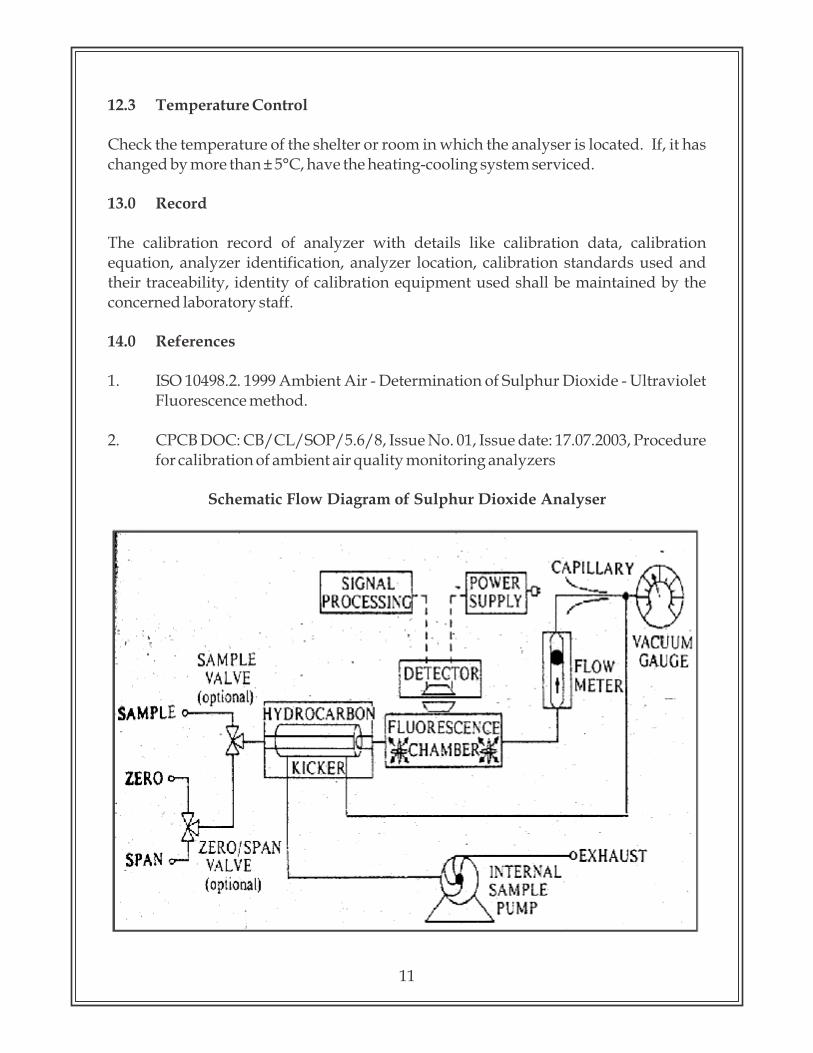

12
Guidelines for Automatic Measurement ofParticulate Matter (PM and PM ) in 2.5 10
ambient air(Beta Attenuation Method)
1.0 Purpose
The purpose of this protocol is to provide guidelines for monitoring of particulate matter (PM and PM ) in ambient air. 2.5 10
2.0 Principle
The Dust monitor automatically measures and records airborne particulate concentration levels (in milligrams or micrograms per cubic meter) using the principle of beta ray attenuation. Each hour, a small C (Carbon-14 or Krypton 85) element emits 14
a constant source of high-energy electrons (known as beta rays) through a spot of clean filter tape. These beta rays are detected and counted by a sensitive scintillation detector to determine a zero reading. The Monitor automatically advances this spot of tape to the sample nozzle, where a vacuum pump then pulls a measured and controlled amount of dust-laden air through the filter tape, loading it with ambient dust (PM or 2.5
PM , depending upon the sampling head). At the end of the hour, this dirty spot is 10
placed back between the beta source and the detector thereby causing an attenuation of the beta ray signal which is used to determine the mass of the particulate matter on the filter tape and the volumetric concentration of particulate matter in ambient air.
3.0 Instrument/Equipment
3.1 Beta Ray Attenuation - for measurement of particulate matter (PM and PM ) 2.5 10
in air
The monitor consists of three basic components: the detector / logger, the pump and a sampling inlet (PM or PM ). Each of these components is self - contained and may be 2.5 10
easily disconnected for servicing or replacement. The Beta Ray Attenuation monitor shall meet the performance specifications as prescribed.
4.0 Calibration
4.1 Factory Calibration Method
The entire particulate matter monitor is tested to traceable standards and then operated in a chamber with dust laden atmosphere. The results of this testing provide data points that are used in the data regression and final calibration. The built in membrane calibrator is tested to assure conformity during test period.
4.2 Automatic Calibration Method
The monitor has a built in Mass Membrane Calibrator. The membrane is automatically
13
moved into the beta Pathway to determine the 'mass' of the membrane each hour or when the filter tape advances. Each membrane has a factory verified mass and that value is stored in the monitor. When the hourly membrane calibration is made, the computed value is compared to the stored factory value to determine proper operation.
4.3 Zero testing
Zero testing of blank filter paper is performed at the beginning and end of each sample period to insure the stability of the measurement system. Zero testing is based on the ability of the monitor to hold a constant output when measuring blank filter paper. If the difference between the two values exceeds a preset limit a data error message is logged in the error log and the digital value is marked.
5.0 Operation of the Particulate Matter Monitor
5.1 Normal Operation Mode
Every cycle of the normal operation mode consists of three main parts, automatic calibration, sampling, counting and calculation. Logging of data collected occurs after each calculation.
5.2 Operation Cycle The particulate matter monitor uses a sampling algorithm that optimizes the total time required to complete a cycle. The basic cycle always includes an automatic calibration that is performed during the sampling period, but at a different point on the filter, as the data is being sampled. The process is as follows:
i) The initial measurement of clean filter tape (I0) is performed at the beginning of the cycle for a period of four minutes.
ii) The filter tape is advanced 50 mm approximately and the sampling (depends upon the sampling head PM or PM ) begins on the spot in which I0 was just 2.5 10
measured. Air is drawn through this spot on the filter tape for 50 minutes.
iii) At the same time the second measurement (I1) occurs (at a point on the tape 50 mm back) for a period of four minutes. The purpose for this measurement is to perform verification for instrument drift caused by varying external parameters such as temperature and relative humidity. A third measurement (I2) occurs with the reference membrane extended over the same place on the tape. The sample time should be chosen greater than or equal to 5 minutes, so as allow for overlapping Auto calibration time. The purpose of this measurement is to verify that the instrument is operational.

14
iv) The tape is moved back app. 50 mm to measure the beta ray absorption through the section that has collected dust (I3). Finally the concentration calculation is performed to complete the cycle.
v) A new measurement cycle then begins.
5.3 Sampling
During the sampling period incoming dust - laden air may be pumped through an optional external PM10 (or PM ) inlet head to remove particles greater than 10 (or 2.5) 2.5
µm in diameter. The air then goes through the filter tape, where particles less than or equal to 10 (or 2.5) µm in diameter are deposited. First the filter tape is advanced 50 mm approximately from the counting station to the sampling nozzle. Next the nozzle is lowered to the tape surface and the vacuum pump is turned ON. At the end of the sampling period the pump is tuned OFF, the nozzle is raised and the tape is moved backward the same distance of 50 mm approximately.
5.4 Counting and Calculation
The final part of the operation mode is the counting of the beta particles through the dusty section of tape and then the calculation and logging of the dust concentration. The tape is then advanced 12.5 mm approximately to begin the next cycle.
5.5 Logging
Data that is computed every sample period is logged in the local memory for the current day. Normal measurement mode starts immediately after the operation mode of the meter is set ON by the operator, cycling indefinitely until the mode is set OFF.
5.6 Software Description - Setup Mode
The monitor saves various setup parameters needed to perform the desired calculations. These includes date, time, Average reference membrane mass density (ABS), Background concentration (BKGD), Regression factor (K), Absorption coefficient (µ ), Pressure flow proportionality (CV), Flow offset (QO) and the sample sw
period tS. Once stored these numbers do not need to be reloaded. ABS, BKGD, K, µ , C sw V
and Q are constants established at the factory by extensive test and calibration.O
5.7 Calculations
The software uses the constant and the input variables available with each monitor to calculate the output data. The output data is used for to calculate daily statistics. The
15
monitor measures the beta ray attenuation at several times during the sampling cycle.
6.0 Record
The time to time calibration record of each particulate matter monitor with details like calibration data, calibration equation, monitor identification number, location, calibration foil used and their traceability used shall be maintained by the concerned laboratory staff.
7.0 References
1. Designated as an Automated Equivalent Methods: EQPM-0308-170 for PM 2.5
and EQPM-0798-122 for PM by USEPA10
Schematic Flow Diagram of Particulate Matter (PM or PM ) Monitor2.5 10

16
Guidelines for Automatic Measurement of Carbon Monoxide (CO) in ambient air (Non-Dispersive Infrared Method)
1.0 Purpose
The purpose of this protocol is to provide guidelines for monitoring of carbon monoxide (CO) in ambient air.
2.0 Principle
Non Dispersive Infra-Red (NDIR) photometry provides a method of utilising the integrated absorption of infra-red energy over most of the spectrum for a given compound to provide a quantitative determination of the concentration of Carbon Monoxide (CO) in ambient air. The spectrometer measures the absorption by CO at 4.7 m using two parallel infrared beams through a sample cell, a reference cell and a selective detector. The detector signal is led to an amplifier control section and the analyser output measured on a meter and recording system. Some instruments use gas filter correlation to compare the IR absorption spectrum between the measured gas and other gases present in the sample, in a single sample cell. These instruments utilize a highly concentrated sample of CO as a filter for the IR transmitted through the sample cell, to yield a beam that cannot be further attenuated by the CO in the sample and thus acts as a reference beam. The board-band radiation that passes through the sample cell and the CO filter is filtered again by a narrow-band-pass filter that allows only the CO-sensitive portion of the band to pass to the detector. The removal of wavelength sensitive to other gases reduces interferences.
3.0 Instrument/Equipment
3.1 NDIR Analyser - for measurement of carbon monoxide in air
The analyser should be complete with analyser section, sample pump, amplifier/control section, meter, and recording system. The NDIR analyser shall meet the performance specifications as prescribed.
3.2 Calibration Standards and Equipment
The calibration of ambient air quality measuring carbon monoxide analyzer require a stable, homogeneous gas mixture having the concentration suitable for measuring range of the analyzer to be calibrated. All such test concentrations must be derived from local or working standards that are certified and traceable to primary standards.
17
3.2.1 Zero Gas Zero gas is defined as gas, which does not contain the parameters to be monitored (any impurity). The concentration of zero gas must be zero in respect of pollutant being calibrated.
3.2.2 Span Gas (Calibration Gas)
The span gas must be capable of providing an accurate, stable and reliable concentration of measured gas.
3.2.3 Multipoint Calibration
Multipoint calibration consists of three or more test concentrations including zero concentration. A concentration between 80% and 90% of the full-scale range of the analyzer under calibration, and one or more intermediate concentrations spaced approximately equally over the scale range are required. Multipoint calibrations are used to establish or verify the linearity of analyzer on initial installation and after any major repair. If a non-linear analyzer is being calibrated, additional calibration points should be included to adequately define the calibration relationship, which should be a smooth drive. Multipoint calibrations are likely to be more accurate than two point's calibration because of the averaging effect of the multiple points.
The analyzers have zero and span adjustment controls, which should be adjusted based on the zero and highest test concentration to provide the desired scale range within the analyzer's specifications. Zero and span controls adjustment often affect the zero/span value, so the adjustments may have to be repeated several times to obtain consistent values i.e. zero or span concentrations.
3.2.4 Pressure Regulators for the CO Cylinders
A two-stage regulator with inlet and delivery pressure gauges will be required for the CO calibration standard cylinder. Procure regulators for each cylinder if individual cylinders are to be used for individual calibration points. Ensure the cylinders have a non-reactive diaphragm and suitable delivery pressure. Consult the supplier from whom the CO cylinders are to be obtained for the correct cylinder fitting size required for the regulator.
3.2.5 Flow Controller
The flow controller can be any device (valve) capable of adjusting and regulating the flow from the calibration standard. If the dilution method is to be used for calibration, a second device is required for the zero-air. For dilution, the controllers shall be capable of regulating the flow ± 1%.
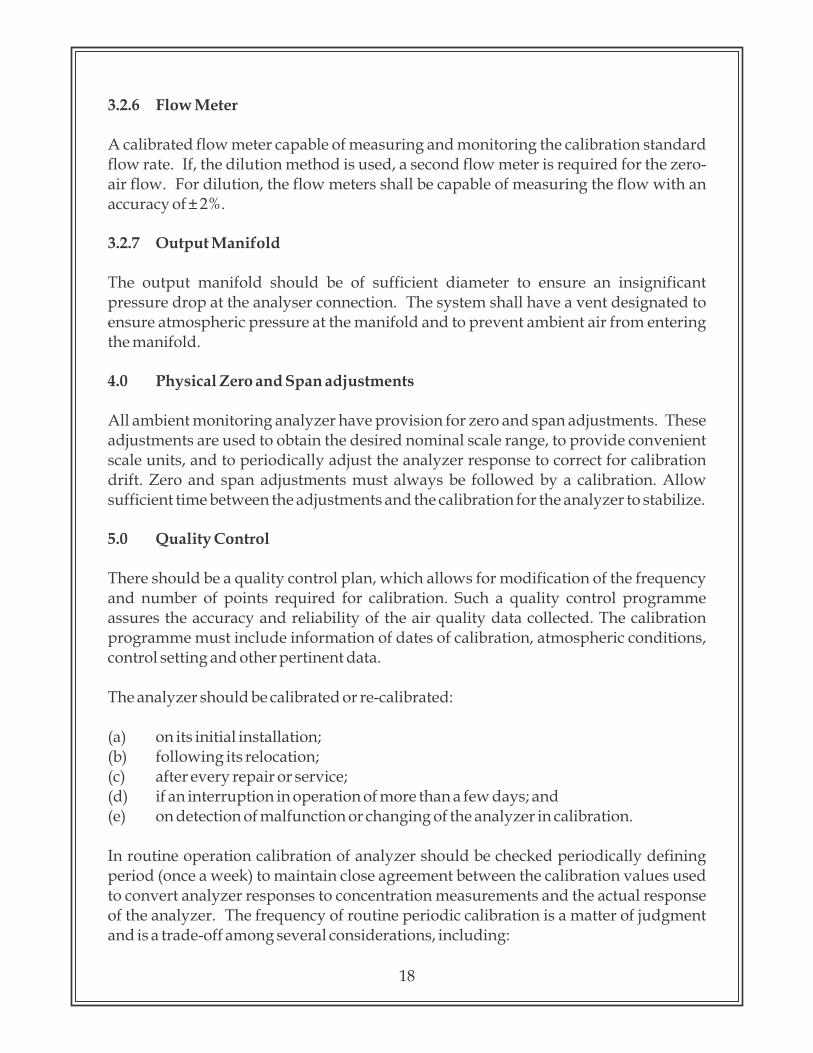
18
3.2.6 Flow Meter
A calibrated flow meter capable of measuring and monitoring the calibration standard flow rate. If, the dilution method is used, a second flow meter is required for the zero-air flow. For dilution, the flow meters shall be capable of measuring the flow with an accuracy of ± 2%.
3.2.7 Output Manifold
The output manifold should be of sufficient diameter to ensure an insignificant pressure drop at the analyser connection. The system shall have a vent designated to ensure atmospheric pressure at the manifold and to prevent ambient air from entering the manifold.
4.0 Physical Zero and Span adjustments
All ambient monitoring analyzer have provision for zero and span adjustments. These adjustments are used to obtain the desired nominal scale range, to provide convenient scale units, and to periodically adjust the analyzer response to correct for calibration drift. Zero and span adjustments must always be followed by a calibration. Allow sufficient time between the adjustments and the calibration for the analyzer to stabilize.
5.0 Quality Control
There should be a quality control plan, which allows for modification of the frequency and number of points required for calibration. Such a quality control programme assures the accuracy and reliability of the air quality data collected. The calibration programme must include information of dates of calibration, atmospheric conditions, control setting and other pertinent data.
The analyzer should be calibrated or re-calibrated:
(a) on its initial installation;(b) following its relocation;(c) after every repair or service;(d) if an interruption in operation of more than a few days; and(e) on detection of malfunction or changing of the analyzer in calibration.
In routine operation calibration of analyzer should be checked periodically defining period (once a week) to maintain close agreement between the calibration values used to convert analyzer responses to concentration measurements and the actual response of the analyzer. The frequency of routine periodic calibration is a matter of judgment and is a trade-off among several considerations, including:
19
(i) the inherent stability of the analyzer under the prevailing conditions of temperature, pressure, line voltage, etc. at the monitoring site;
(ii) the quality of the ambient measurement needed;(iii) the risk of collecting invalid data because of a malfunction or invalid data or
response problem with the analyzer that would not be discovered until the calibration is carried out.
When a new monitoring instrument is installed, zero and span calibration should be very frequent, may be daily. After obtaining enough data on the drift performance of the analyzer, the calibration frequency can be adjusted to provide a suitable compromise among the various considerations mentioned above. To facilitate the process of determining calibration frequency, it is strongly recommended that control charts should be used to monitor the zero and span drift performance of each analyzer. If the drift becomes excessive, then the corrective action has to be taken.
6.0 Precautions
a) Operate the analyser in air- conditioned and dust proof room b) Follow standard safety practices for the handling and storage of calibration gas
cylinders & the installation and use of the analyser. c) Do not expose calibration cylinders to direct sunlight or excessive heat.d) Maintain the same sample cell flow rate during sampling and calibration. Use
the same sample pump.
7.0 Sampling
When sampling the outside ambient from an enclosure, utilize a sampling line or probe extending at least 1 metre from the enclosure, and protected against the entry of precipitation. Place the analyser in an enclosure with atmospheric control so the temperature remains constant within ± 5° C. Record the temperature and pressure of the atmosphere sample.
8.0 Operation of the analyser
(i) Press ON/OFF switch of the analyzer to ON;(ii) Check that the sampling tube is connected with sampling glass manifold and the
suction pump is in operation;(iii) Let the analyzer warm up and stabilize for atleast 30 minutes or as specified in
the manual;(iv) Do not change the programme or configuration of the analyzer as they are
preset; and(v) After the warm up period, put the analyzer on SAMPLE mode by pressing the
sample key.
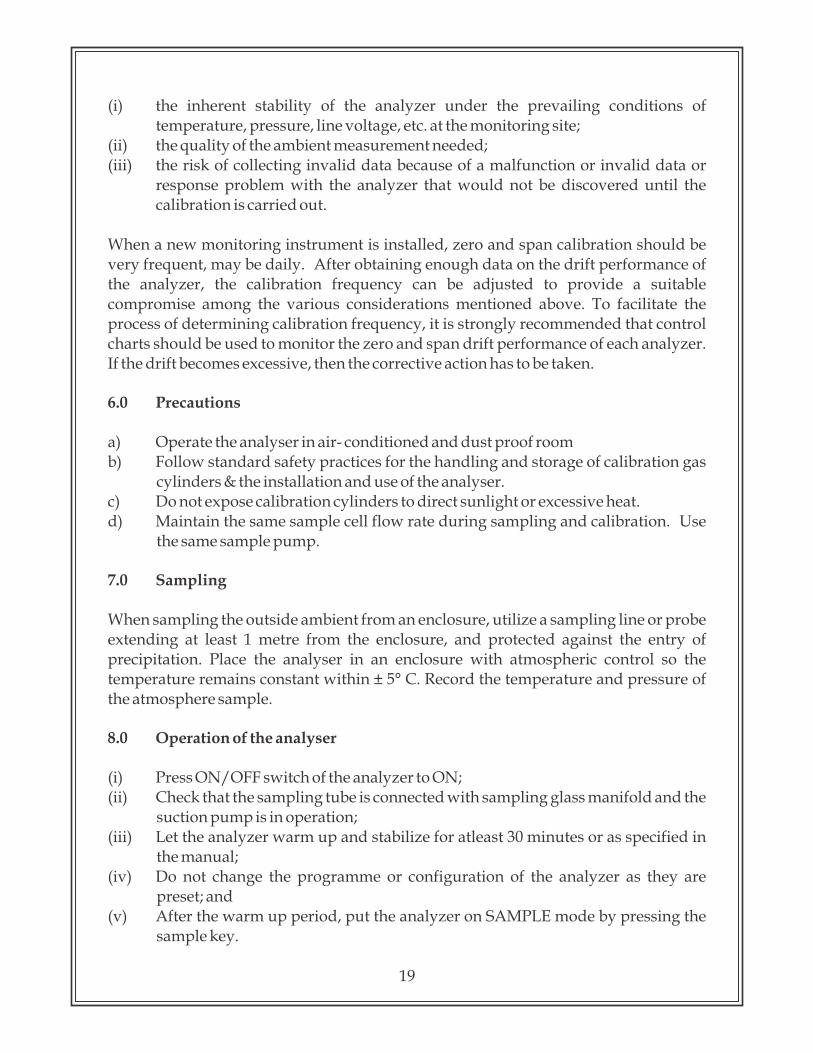
20
9.0 Procedure of Calibration
9.1 Calibration of Working Standard
(i) The working standard should be calibrated with Certified Reference Material (CRM);
(ii) Established the concentration of the working standard relative to the primary standard;
(iii) Primary standard should be traceable to NIST / BIS primary standard; and(iv) Confirm the stability of the working standard over a minimum period of one
week. (v) Flow or volume measuring instruments like, bubble flow meter or gas meter
shall be calibrated and certified at regular intervals against NPL, New Delhi / FCRI, Palghat standards.
9.2 Requirements - Prior to Calibration or Zero/Span Check
a) The analyzer under calibration should be in operation for at least overnight so that it is fully warmed up and stabilized.
b) Allow the analyzer to sample test atmosphere with known concentration of pollutants.
c) During calibration, the analyzer should be operating in its normal sampling mode and it should sample the test atmosphere through all filters, scrubbers, conditioners, and other components used during normal ambient sampling and through as much of the ambient air inlet system as is practicable.
d) Complete all operational adjustments of the analyzer.
9.3 Zero and Span Calibration Procedures
(i) Zero Calibration
Switch the analyzer at ZERO mode and zero gas (N ) from external source is measured 2
by the analyzer. After the reading has stabilized, check the display of zero value. In case of derivation, adjust the ZERO value.
(ii) Span Calibration
After the ZERO calibration has been done, connect the span gas cylinder, of known concentration of CO. Switch on the analyzer of SPAN mode. Open the regulator valve of the cylinder and the analyzer will start measuring the span gas concentration. In case of any variation in the measured value and SPAN gas concentration, adjust the reading of the analyzer to the SPAN gas concentration value. Repeat ZERO and SPAN calibration for atleast three times till stable and true value are indicated. After ZERO
21
and SPAN calibration, switch the analyzer at SAMPLE mode. Now, analyzer will measure the carbon monoxide present in the ambient air.
10.0 Calculation
To convert ppm volume fraction to milligrams per cubic metre, use the following equation:
r x mr x 298r r = ------------------------1
24 450 x T x 101.3
Where:r = is the CO mass concentration, in milligrams per cubic1
metrer = is the CO mass concentration, ppm volume fraction2
m = is the molar mass of carbon monoxide, (28 g/mol)r
298 = is the standard absolute temperature, in Kelvinr = is the measured gas pressure, in kilopascals24 450 = is the molecular volume of 1 mole, in millilitresT = is the measured absolute gas temperature, in Kelvin101.3 = is the standard gas pressure, in kilopascals
11.0 OPERATIONAL CHECKS
11.1 Zero and Span Settings
If the required zero and span corrections performed in accordance with calibration procedure are greater than 80% of the range, have the analyser serviced.
11.2 Sample Flow Rate
If the sample flow rate has changed by more than ± 20% of the initial value, check the particulate filter for blockage, and the sample pump for proper operation. Check the filter monthly by measuring the flow rate with and without the filter in place. Replace the filter if the drop is more than 5%.
11.3 Temperature Control
Check the temperature of the shelter or room in which the analyser is located. If, it has changed by more than ± 5° C, have the heating-cooling system serviced.
2

22
12.0 Record
The calibration record of each analyzer with details like calibration data, calibration equation, analyzer identification, analyzer location, calibration standards used and their traceability, identity of calibration equipment used shall be maintained by the concerned laboratory staff.
13.0 References
1. ISO Method No. 4224, 1999
2. CPCB DOC: CB/CL/SOP/5.6/8, Issue No. 01, Issue date: 17.07.2003, Procedure for calibration of ambient air quality monitoring analyzers
Schematic Flow Diagram of Carbon Monoxide Analyser
23
Guidelines for Automatic Measurement of Oxides of Nitrogen (NO - NO - NOx) 2
and Ammonia (NH ) in ambient air (Chemiluminescence Method)3
1.0 Purpose
The purpose of this protocol is to provide guidelines for monitoring of oxides of nitrogen (NO - NO - NO ) and Ammonia (NH ) in ambient air.2 x 3
2.0 Principle
The measurement method is based upon the chemiluminescent reaction between Nitric oxide (NO) with Ozone (O ) in a reaction chamber.3
NO + O = NO * + O3 2 2
A portion of the resultant Nitrogen dioxide (NO ) is produced in a highly excited 2
energy state (NO *) and subsequently decay to the ground level state emitting light in 2
broad frequency band with a peak of 1200 nm.
NO * = NO + Photons (hV)2 2
The intensity of the light emitted is linearly proportion to the NO concentration and is measured by a photo-multiplier tube. The instrument is designed for the measurement of total Oxides of Nitrogen (NOx), Nitric Oxide (NO) and indirect determination of Nitrogen Dioxide (NO ) and Ammonia (NH ). The NO and NH calculated by 2 3 2 3
subtraction of NO from NOx and NOx from NOy.
NOx = NO + NO2
NO = NOx - NO --------------------(1)2
NO = NO + NO + NHY 2 3
NH = NO - NOx -------------------(2)3 Y
3.0 Instrument/Equipment
3.1 Chemiluminescence Analyser - for measurement of oxides of nitrogen and ammonia in air
The Chemiluminescenceanalyzer is a combination of NH converter and an NO-NO -3 2
NOx analyzer. Ammonia in the air sample is oxidized to nitric oxide (NO) with a converter. Sample air is drawn at a flow rate of 0.6 L/min from the converter into the NH analyzer through a particulate filter, a glass capillary, and a solenoid valve. The 3
solenoid valve routes the sample either directly into the reaction chamber (NO mode),

24
through the molybdenum converter and the reaction chamber (NOx mode), or through the ammonia converter and the reaction chamber (Nt mode).
3.2 Converters - For the accurate determination of nitrogen dioxide it is essential that the instrument converters have a high degree of efficiency (95 %+) for the conversion of NO to NO. The converters employed in commercially available 2
instruments are of two basic types.
Thermal Converters are made of a high grade stainless steel and operate at elevated temperatures, 600-800°C. At these temperatures the breakdown of NO into NO and O 2 2
occurs readily. These converters, though adequate for the breakdown of NO to NO, 2
have the obvious disadvantage of converting ammonia into NO.
Chemical converters are to be found in the majority of Chemiluminescence instruments used for ambient monitoring. These converters have the advantage of a much lower operating temperature, 200-400°C, with efficient NO conversion. 2
Molybdenum and carbon converters have been in general use and are available in commercial instruments.
NH - NO Converter consists of a ceramic cylinder bearing a heating resistor. This 3
cylinder is surrounded by glass wool. It contains the quartz tube filled with quartz wool in order to improve the efficiency of NH to NO conversion. The temperature 3
range of these tubes is in between 950 - 1000° C.
3.3 Air Inlet Filter - A Teflon filter capable of removing all particulate matter greater than 5µm in diameter.
3.4 Sample Lines - The sample lines and all parts of the instrument that come in contact with the sample stream should be made of glass, Teflon or stainless steel.
3.5 Vacuum Pump - A pump capable of a minimum vacuum of 78 kPa.
4.0 Calibration Standards
The nitric oxide (NO) in N and NH in air is used to calibrate the Analyser. These 2 3
standard gases should be traceable to a National or International Standard. Selection of the NO and NH standards concentration are dependent on the operating range of the 3
analyzer to be calibrated and on the dilution capability of the calibration system. NO cylinders normally used are in the 25-59 + 2% ppm v/v range in N . The NO calibration 2
cylinder must be free of any nitrogen dioxide, and should be re analysed on a regular basis, preferably every six months.
25
4.1 Zero Gas
The air supply must be free of contaminants that would cause a detectable analyzer response, or react independently with NO.
4.2 Span Gas (Calibration Gas)
The span gas must be capable of providing an accurate, stable and reliable concentration of measured gas.
4.3 Multipoint Calibration
Multipoint calibration consists of three or more test concentrations including zero concentration. A concentration between 80% and 90% of the full-scale range of the analyzer under calibration, and one or more intermediate concentrations spaced approximately equally over the scale range are required. Multipoint calibrations are used to establish or verify the linearity of analyzer on initial installation and after any major repair. If a non-linear analyzer is being calibrated, additional calibration points should be included to adequately define the calibration relationship, which should be a smooth drive. Multipoint calibrations are likely to be more accurate than two point's calibration because of the averaging effect of the multiple points.
The analyzers have zero and span adjustment controls, which should be adjusted based on the zero and highest test concentration to provide the desired scale range within the analyzer's specifications. Zero and span controls adjustment often affect the zero/span value, so the adjustments may have to be repeated several times to obtain consistent values i.e. zero or span concentrations.
5.0 Physical Zero and Span adjustments
All ambient monitoring analyzer have provision for zero and span adjustments. These adjustments are used to obtain the desired nominal scale range, to provide convenient scale units, and to periodically adjust the analyzer response to correct for calibration drift. Zero and span adjustments must always be followed by a calibration. Allow sufficient time between the adjustments and the calibration for the analyzer to stabilize.
6.0 Quality Control
There should be a quality control plan, which allows for modification of the frequency and number of points required for calibration. Such a quality control programme assures the accuracy and reliability of the air quality data collected. The calibration programme must include information of dates of calibration, atmospheric conditions, control setting and other pertinent data.

26
The analyzer should be calibrated or re-calibrated:
a. on its initial installation;b. following its relocation;c. after every repair or service;d. if an interruption in operation of more than a few days; ande. on detection of malfunction or changing of the analyzer in calibration.
In routine operation calibration of analyzer should be checked periodically defining period (once a week) to maintain close agreement between the calibration values used to convert analyzer responses to concentration measurements and the actual response of the analyzer. The frequency of routine periodic calibration is a matter of judgment and is a trade-off among several considerations, including:
the inherent stability of the analyzer under the prevailing conditions of temperature, pressure, line voltage, etc. at the monitoring site;the quality of the ambient measurement needed;the risk of collecting invalid data because of a malfunction or invalid data or response problem with the analyzer that would not be discovered until the calibration is carried out.
When a new monitoring instrument is installed, zero and span calibration should be very frequent, may be daily. After obtaining enough data on the drift performance of the analyzer, the calibration frequency can be adjusted to provide a suitable compromise among the various considerations mentioned above. To facilitate the process of determining calibration frequency, it is strongly recommended that control charts should be used to monitor the zero and span drift performance of each analyzer. If the drift becomes excessive, then the corrective action has to be taken.
Precautions
(a) Operate the analyser in air- conditioned and dust proof room (b) Follow standard safety practices for the handling and storage of calibration gas
cylinders & the installation and use of the analyser. (c) Do not expose calibration cylinders to direct sunlight or excessive heat.(d) Maintain the same sample cell flow rate during sampling and calibration.
Use the same sample pump.
7.0 Sampling
When sampling the outside ambient from an enclosure, utilize a sampling line or probe extending at least 1 metre from the enclosure, and protected against the entry of
27
precipitation. Place the analyser in an enclosure with atmospheric control so the temperature remains constant within + 5o C. Record the temperature and pressure of the atmosphere sample.
8.0 Operation of the analyser
Press ON/OFF switch of the analyzer to ON;Check that the sampling tube is connected with sampling glass manifold and the suction pump is in operation;Let the analyzer warm up and stabilize for atleast 30 minutes or as specified in the manual;Do not change the programme or configuration of the analyzer as they are preset; andAfter the warm up period, put the analyzer on SAMPLE mode by pressing the sample key.
9.0 Requirements - Prior to Calibration or Zero/Span Check
The analyzer under calibration should be in operation for at least overnight so that it is fully warmed up and stabilized. Allow the analyzer to sample test atmosphere with known concentration of pollutants. During calibration, the analyzer should be operating in its normal sampling mode and it should sample the test atmosphere through all filters, scrubbers, conditioners, and other components used during normal ambient sampling and through as much of the ambient air inlet system as is practicable. Complete all operational adjustments of the analyzer.
10.0 Calibration System and Equipment
In the procedure that follows, NH , NO and NO calibrations are performed using a 3 2
dynamic dilution system. Ammonia and Nitric oxide calibrations are performed by dynamic flow dilution of a NH & NO standard with a clean air stream. Nitrogen 3
dioxide calibrations are performed by the rapid gas phase reaction between NO and O 3
to provide a stoichiometric quantity of NO , equal to the decrease in the NO 2
concentration. The reaction is the same as shown as Section 3.0, except that the NO remains in excess rather than the ozone as described in 3.0. This reaction is commonly referred to as Gas Phase Titration (GPT). An alternative NO calibration is the 2
generation of known test atmospheres by means of a NO permeation device.2
10.1 Calibration System- All components in the calibration system should be made of glass, Teflon or stainless steel. The system is designed to provide dynamic dilution for NO, NH and GPT for NO . The dilution section comprises two independent flow 3 2
controls that can be varied individually to provide a dilution ration of up to 1,000 to 1.

28
The GPT section comprises a current-regulated ozone generator through which a portion of the dilution air flows even when the ozonator is not in operation. For dynamic dilution, the metered NO combines with this portion of the dilution air and passes through the reaction chamber. It then combines with the balance of the dilution air and passes through the sampling manifold. For GPT the flow path is the same except that a portion of the oxygen in the air passing through the ozone generator is converted to ozone.
10.2 Air Flow Controller - A device capable of maintaining constant clean-air flow up to 5 L/min within + 2% of the required flow rate.
10.3 Air Flowmeter - A calibrated flowmeter capable of measuring air flow rates within + 2%.
10.4 Nitric Oxide Flow Controller - A device capable of maintaining constant NO flow within + 2% of the required flow rate.
10.5 Nitric Oxide Flowmeter - A calibrated flowmeter capable of measuring NO flow rates within + 2%.
10.6 Two-Stage Regulator - The two-stage pressure regulator for the standard NO and NH cylinders must be of stainless steel to prevent any reaction of the external gas.3
10.7 Ozone Generator - The generator must be capable of generating stable levels of O for the GPT of NO to provide NO concentrations throughout the calibration range.3 2
10.8 Reaction Chamber - The chamber used for the reaction of O with excess NO 3
should be of sufficient volume that the residence time is not less than 2 minutes (11).
10.9 Mixing Chamber - A chamber used to allow thorough mixing of reaction products and dilution air.
11.0 Procedure of Calibration
Prior to start of calibration, for safety purposes, insure proper venting of the analyzer exhaust and the calibration system have excess flow. Insure that the analyzer and the calibration system have been on for a time sufficient to provide stable operation.
11.1 Flow Conditions - Insure that the air and gas flow systems are calibrated under the conditions of use against an authoritative standard. Different output calibration gas concentrations are obtained simply by changing the ratios of flow rates between the NO & NH and dilution air channels. It is preferable to maintain a constant dilution air-3
flow and to vary the NO and NH flow. The total flow required at the sampling 3
manifold should equal the analyzer demand plus at least 50% excess. The following equations can be used to pre-calculate the specific gas dilution air-flow rates required
29
for the desired calibration points, usually 20, 40, 60 and 80% of the instrument range.
STD x FSS = -------------- (1)
FS + FDWhere :
S = desired output concentrations of NO in ppmSTD = NO standard cylinder concentration in ppmFS = NO standard cylinder flow rate
3FD = dilution air flow rate in cm /min.
3Solving equation (1) for the NO or NH standard flow rate (FS) that will produce the desired concentration for a given dilution flow rate (FD) gives:
S FDFS = ------------ (2)
STD - S
11.2 Zero Calibration - Activate the zero air source and allow the analyzer to sample the zero air until a stable zero response is obtained. Adjust the analyzer NH , NOx, NO 3
and NO zero controls as described in the instrument manual. It is good practice to 2
recheck the zero at the end of the multipoint calibration, especially if large span adjustments were made.
11.3 Preparation for the NO and NOx Calibration - Set the zero air and NO standard flow rates as determined in 12.1 for generating a NO concentration at 80% of the instrument range setting. Sample this NO concentration for a minimum of 15 minutes or until the NO and NOx responses are stable.
11.4 NO and NOx Span Adjustment - Adjust as necessary the analyzer NO and NOx span controls to obtain recorder responses equal to the NO (NOx in this case as well) concentration generated.
11.5 Preparation for the NO2 Calibration - Set the dilution air and NO standard flow rates as determined in 12.1 for generating a NO concentration of about 80% of the instrument range setting. Sample this NO concentration for a minimum of 15 minutes or until the NO, NOx and NO recorder responses are stable. Record the readings.2
Note: The NO calibration is conveniently performed by re-establishing the 80% of 2
scale NO-NOx calibration point, using the same dilution air and NO standard flow rates used in 12.3.

30
11.6 Gas Phase Titration - Activate the ozone generator and adjust the ozone output so as to decrease the NO concentration by approximately 80%. The decrease must not exceed 90% of the NO concentration being sampled prior to the GPT. Sample this NO-NO mixture for a minimum of 15 minutes or until the NO, NOx and NO recorder 2 2
responses are stable. Record the readings. Calculate the indicated NO concentration as 2
per Section 11.1.
11.7 Nitrogen Dioxide Span Adjustment - Adjust as necessary the analyzer NO 2
span control to obtain a recorder response equal to the calculated NO concentration.2
Generate at least two additional calibration points evenly spaced across the remainder of the instrument operating scale by decreasing the O output while maintaining the 3
dilute air and NO standard flow rates constant. For each calibration point generated, calculate the NO concentration, and insure that the NO recorder responses are correct. 2 2
11.7 Determination of Converter Efficiency of NO - Calculate the analyzer 2
converter efficiency as per Section 13.2 for the NO concentration generated in Section 2
12.6. The converter efficiency must be 95% or greater to be acceptable
11.8 Preparation for the NH Calibration - Set the zero air and NH standard flow 3 3
rates as determined in 12.1 for generating a NH concentration at 80% of the instrument 3
range setting. Sample this NH concentration for a minimum of 15 minutes or until the 3
NH3 response is stable. Adjust as necessary the analyzer NH span control to obtain 3
recorder responses equal to the NH concentration generated. 3
11.9 Determination of Converter Efficiency of NH - It is necessary to check the 3
efficiency of the NH converter every 6 months at least. In this case it is necessary to 3
inject NH gas and to check the read value with the known (span) concentration. 3
12.0 Calculations
12.1 Calculation of NO concentration2
NOx = NO + NO2
NO = NOx- NO -------------------- (1)2
NO = NO + NO + NHY 2 3
NH = NOY - NOx ------------------- (2)3
12.2 Calculation of NO Converter Efficiency (CE) 2
[NOx]Converter Efficiency = ---------------- 100
[NOx]GPT
31
12.3 Calculation of NH3 Converter Efficiency (CE)
[NH ] measured3
Converter Efficiency = --------------------------- 100 [NH ] target3
13.0 Calibration with Permeation System
A permeation device is a gas source, which permanently emits a constant known quantity of a pure gas. It consists of a small container with a permeable wall, typically consisting entirely of PTFE (Teflon) or of stainless steel with a small PTFE wafer. The gases to be used (SO , NO , NH , H S etc.) to generate standard gas mixture of variable 2 2 3 2
concentration, is kept pure in liquid form. Since the compound is liquid, it will always have a constant vapour pressure, if temperature is constant. Gravimetric method is used for calibrating the permeation tube at different flow rate. The pre-weighted permeation tube (SO , NO , H S etc.) are kept in permeation oven for constant 2 2 2
temperature. After an interval of about 10 days, the tubes are taken out and weighed. The permeation rate of tubes is calculated by dividing the weight loss by time period.
13.1 CalculationDifference in Weight (µ g)
Permeation Rate (PR) = --------------------------------Time Period (Min)
Permeation Rate ( µg / min)Concentration (C) = -----------------------------------------
3Dilution Gas Flow (m / min)
3C = µg / m
13.2 Procedure for Calibration with Permeation Tube
Take a new permeation tube and put it into permeation oven of a calibration unit for stabilisation at least for 48 hours.After the stabilisation take the initial weight (w1) of permeation tube in a balance, which can measure up to 5 decimal value and record date & time (t1). Put back the tube again in permeation oven in same condition as earlier.Take out the permeation tube from oven approximately after 10 days and weight it again (w2) and note down the date & time (t2) and put back the tube into permeation oven.

32
Calculations:Difference in Weight (w1 - w2) g
Permeation Rate (PR) = -----------------------------------------------------------Difference in Time (t2 - t1) min
Permeation Rate (PR) ( µg / min.)NO Concentration = ---------------------------------------------------------2
3N* x Dilution Flow (m / min)
N* = NO Concentration at 25 ºC,231.0 ppb = 1.88 µg / m
or NH Concentration at 25 ºC,331.0 ppb = 0.758 g / m
13.3 Example
Let us take the permeation tube of Nitrogen Dioxide for calibration:Date = 20.05.09, Time = 11 a.m. (t )1
Weight of permeation tube = 0.05250 gms. (w )1
Date = 31.05.09, Time = 10.30 a.m. (t )2
Weight of permeation tube = 0.04936 gms. (w )2
Difference in weights (w - w )1 2
0.05250 - 0.4936 = 0.00314 gTime Difference (t - t )2 1
10 days, 23 hrs. 30 minutes = 15810 minutes
0.00314 gPermeation Rate = ---------------------- = 0.199 µg / min.
15810 minutes
Nitrogen Dioxide concentration at different flow rates:
0.199 µg / min.50 liters / hr. = -----------------------------------------------------
30.833 x10⁻³ m3 / min x 1.88 µg / m
= 127 ppb
100 litres / hr.= 63.5 ppb150 litres / hr.= 42.3 ppb200 litres / hr.= 31.6 ppb
33
Ammonia concentration at different flow rates:
0.199 µg / min.50 liters / hr. = ----------------------------------------------------------
30.833 x10⁻³ m3 / min x 0.758 µg / m
= 315 ppb100 litres / hr. = 157.5 ppb150 litres / hr. = 105 ppb200 litres / hr. = 78 ppb
14.0 OPERATIONAL CHECKS
14.1 Zero and Span Settings
If the required zero and span corrections performed in accordance with calibration procedure are greater than 80% of the range, have the analyser serviced.
14.2 Sample Flow Rate
If the sample flow rate has changed by more than + 20% of the initial value, check the particulate filter for blockage, and the sample pump for proper operation. Check the filter monthly by measuring the flow rate with and without the filter in place. Replace the filter if the drop is more than 5%.
14.3 Temperature Control
Check the temperature of the shelter or room in which the analyser is located. If, it has changed by more than + 5° C, have the heating-cooling system serviced.
15.0 Record
The calibration record of each analyzer with details like calibration data, calibration equation, analyzer identification, analyzer location, calibration standards used and their traceability, identity of calibration equipment used shall be maintained by the concerned laboratory staff.
16.0 References
rd1. ISC Method No. 416, 3 Edition, 19892. USEPA Environmental Technology Verification (ETV) Programme3. CPCB DOC: CB/CL/SOP/5.6/8, Issue No. 01, Issue date: 17.07.2003, Procedure
for calibration of ambient air quality monitoring analyzers

34
Flow Diagram of Oxides of Nitrogen and Ammonia Analyser
35
Guidelines for Automatic Measurement of Ozone (O ) in ambient air3
(UV Photometric Method)
1.0 Purpose
The purpose of this protocol is to provide guidelines for monitoring of ozone (O ) in 3
ambient air.
2.0 Principle
The method is based on the photometric assay of ozone (O ) concentrations in a 3
dynamic flow system. The concentration of O is determined in an absorption cell from 3
the measurement of the amount of light absorbed at a wavelength of 254 nm. The method is based on the absorption coefficient of O at 254 nm, the optical path length 3
through the sample, and the transmittance, temperature and pressure of the sample. The quantities above are related by the Beer-Lambert absorption law. I
-aclTransmittance = --------- = e Io
Where:
-1 -1a = absorption coefficient of O at 254 nm = 310 atm c m at 0° C and 101.3 kPa3
e = O concentration in units of atmosphere3
l = optical path of absorption cell length in cmI = intensity of light passing through cell with an ozone sampleI = intensity of light passing through cell with zero air o
Typically, an air sample is first directed through a scrubber that removes any O 3
present, but otherwise does not affect the sample. The ozone-free sample then flows through the absorption cell, and its transmittance is measured. This constitutes the zero cycle. At a present time, solenoid switches and another air sample flows directly into the absorption cell, bypassing the scrubber and its transmittance is measured. This constitutes the ozone measurement cycle. The difference in transmittance between the two cycles is a measure of the O concentration. The complete measurement cycle takes 3
about 20 to 30 seconds. Microprocessor-controlled electronics perform timing functions, condition the signal and perform arithmetic operations in commercially available analyzers.
3.0 Instrument/Equipment
3.1 Ozone Photometric Analyzer
Commercially available, complete with sample pump and sample flow meter. All

36
connections to the ozone and analyzer must be constructed of glass, Teflon or other inert materials.
3.2 Air Inlet Filter
A Teflon filter capable of removing all particulate matter greater than 5 µm in diameter.
3.3 Recorder
Capable of full-scale display of voltages from the instrument DC amplifier. These are commonly found in full-scale ranges of 10 mV to 1V.
3.4 Calibration Apparatus
Ultraviolet Photometer (UV Photometer)commercially available. The UV photometers are primary standards for determinations of ozone in air. The units differ from the ozone photometric analyzer is that the UV photometers do not contain an ozone scrubber, and are designed to make pressure and temperature corrections for the measured ozone to standard conditions (25° C and 101.3 kPa).
4.0 Quality Control
There should be a quality control plan, which allows for modification of the frequency and number of points required for calibration. Such a quality control programme assures the accuracy and reliability of the air quality data collected. The calibration programme must include information of dates of calibration, atmospheric conditions, control setting and other pertinent data.
The analyzer should be calibrated or re-calibrated:
(a) on its initial installation;(b) following its relocation;(c) after every repair or service;(d) if an interruption in operation of more than a few days; and(e) on detection of malfunction or changing of the analyzer in calibration.
In routine operation calibration of analyzer should be checked periodically defining period (once a week) to maintain close agreement between the calibration values used to convert analyzer responses to concentration measurements and the actual response of the analyzer. The frequency of routine periodic calibration is a matter of judgment and is a trade-off among several considerations, including:
a) the inherent stability of the analyzer under the prevailing conditions of
37
temperature, pressure, line voltage, etc. at the monitoring site;b) the quality of the ambient measurement needed;c) the risk of collecting invalid data because of a malfunction or invalid data or
response problem with the analyzer that would not be discovered until the calibration is carried out.
When a new monitoring instrument is installed, zero and span calibration should be very frequent, may be daily. After obtaining enough data on the drift performance of the analyzer, the calibration frequency can be adjusted to provide a suitable compromise among the various considerations mentioned above. To facilitate the process of determining calibration frequency, it is strongly recommended that control charts should be used to monitor the zero and span drift performance of each analyzer. If the drift becomes excessive, then the corrective action has to be taken.
5.0 Precautions
a) Operate the analyser in air- conditioned and dust proof room b) Follow standard safety practices for the handling and storage of calibration gas
cylinders & the installation and use of the analyser. c) Do not expose calibration cylinders to direct sunlight or excessive heat.d) Maintain the same sample cell flow rate during sampling and calibration. Use
the same sample pump.
6.0 Sampling
When sampling the outside ambient from an enclosure, utilize a sampling line or probe extending at least 1 metre from the enclosure, and protected against the entry of precipitation. Place the analyser in an enclosure with atmospheric control so the temperature remains constant within ± 5° C. Record the temperature and pressure of the atmosphere sample.
7.0 Operation of the analyser
(a) Press ON/OFF switch of the analyzer to ON;(b) Check that the sampling tube is connected with sampling glass manifold and the
suction pump is in operation;(c) Let the analyzer warm up and stabilize for atleast 30 minutes or as specified in
the manual;(d) Do not change the programme or configuration of the analyzer as they are
preset; and(e) After the warm up period, put the analyzer on SAMPLE mode by pressing the
sample key.

38
8.0 Requirements - Prior to Calibration or Zero/Span Check
a) The analyzer under calibration should be in operation for at least overnight so that it is fully warmed up and stabilized.
b) Allow the analyzer to sample test atmosphere with known concentration of pollutants.
c) During calibration, the analyzer should be operating in its normal sampling mode and it should sample the test atmosphere through all filters, scrubbers, conditioners, and other components used during normal ambient sampling and through as much of the ambient air inlet system as is practicable.
d) Complete all operational adjustments of the analyzer.
9.0 Zero and Span Calibration Procedures
(i) Zero Calibration
Switch the analyzer at ZERO mode and zero gas from internal source will be measured by the analyzer. After the reading has stabilized, check the display of the zero value. In case of any deviation, adjust the ZERO value.
(ii) Span Calibration (internal)
After the ZERO calibration has been done, switch the analyzer at SPAN mode. The analyzer has internal UV span source for providing O of known concentration. The 3
span value is pre-determined. The analyzer would measure the span value. In case of any deviation in the displayed value and the actual span concentration, adjust the voltage of the UV source corresponding to the span value. Repeat ZERO and SPAN calibration for atleast three times or till stable and true values are indicated. After ZERO and SPAN calibration, switch the analyzer at SAMPLE mode. Now, analyzer will measure the O gas present in the ambient air.3
(iii) Span Calibration (External)
Connect the ozone analyzer to the output manifold of the calibration system. Check to insure proper operating parameters according to the instrument manual. The ozone source consists of a quartz tube into which purified air is introduced and then irradiated with a stable low-pressure mercury lamp. The level of irradiation is controlled by an adjustable metal sleeve that fits around the lamp. At a fixed level of irradiation and at a constant temperature and humidity, ozone is produced at a uniform rate. By careful control of the flow of air through the quartz tube, and/or adjustment of the irradiation level, test atmospheres can be generated that contain stable but variable concentrations of ozone. An output manifold with a vent is attached to the Ozonator. Ozone outputs must be available to cover the complete analyzer
39
operating range, typically 0.00 to 1.00 ppm. The dilution system should have a total flow capability of a least 5 L/min. Any alternative system capable of these outputs is acceptable.
10.0 Calculation
If a UV photometer was used in the calibration, the ozone readings are the true ozone concentrations already corrected to standard conditions (25° C and 101.3 kPa).
True Ozone (ppm) = Ozone Reading - Zero Reading
Where:Ozone Reading = The UV photometer ozone readout for each calibration point test
atmosphere Zero Reading= The UV photometer ozone readout for the zero
air stream
11.0 OPERATIONAL CHECKS
11.1 Zero and Span Settings
If the required zero and span corrections performed in accordance with calibration procedure are greater than 80% of the range, have the analyser serviced.
11.2 Sample Flow Rate
If the sample flow rate has changed by more than ± 20% of the initial value, check the particulate filter for blockage, and the sample pump for proper operation. Check the filter monthly by measuring the flow rate with and without the filter in place. Replace the filter if the drop is more than 5%.
11.3 Temperature Control
Check the temperature of the shelter or room in which the analyser is located. If, it has changed by more than ± 5° C, have the heating-cooling system serviced.
12.0 Record
The calibration record of each analyzer with details like calibration data, calibration equation, analyzer identification, analyzer location, calibration standards used and their traceability, identity of calibration equipment used shall be maintained by the concerned laboratory staff.

40
13.0 References
rd1. ISC, Method No. 417, 3 Edition, 1989.
Schematic Flow Diagram of Dual Cell Ozone Analyser
41
Guidelines for Automatic Measurement of benzene (BTX) in ambient air(Gas Chromatography based Continuous Method)
1.0 Purpose
The purpose of this protocol is to provide guidelines for monitoring of Benzene (Benzene, toluene, Ethyl benzene M+P xylene and O-Xylene) in ambient air by online real time monitoring instruments.
2.0 Principle
The principal of operation of volatile organic compound is based on chromatographic separation in the gaseous phase of measured compound, coupled with a photo ionization detector for detection of these compounds. The sampling gas is drawn into a sampling tube at regulated flow. This is heated and ventilated by carrier gas, this way desorption is done. Transfer of adsorbed compound from sampling tube to pre concentration tube is carried out with a carrier gas. The sampled VOC are re adsorbed in very small volume of adsorbent, which is known as pre concentrator. A strong and fast increase in temperature of graphitized carbon at 350 c together with ventilation of carbon with carrier gas enables desorption of the compounds, which are injected into column. The nitrogen is introduced at inlet of pre concentration tube, which causes displacement of sample in the column. The separation of each compound takes place in this column. The output is measured by a PID detector and the concentrations are displayed on the instrument.
3.0 Instrument/Equipment
VOC Analyser - for measurement of Benzene in the ambient air is used for the measurement of this compound.The analyser should be complete with analyser section, sample pump, amplifier/control section, meter, and recording system. The analyser shall meet the performance specifications as prescribed.
4.0 Sampling
When sampling the outside ambient from an enclosure, utilize a sampling line or probe extending at least 1 metre from the enclosure, and protected against the entry of precipitation. Place the analyser in an enclosure with atmospheric control so the temperature remains constant at 25° C ± 3° C. Record the temperature and pressure of the atmosphere sample.
4.1 Operation of the Analyser
Connect the analyser with sampling line. Check if dust filter is required to be replaced.

42
Put on the power supply. Analyser is pre programmed or can be re-configured in configuration mode where range, date time, language, measuring cycle etc can be programmed. Return to main menu. Put the analyser in instantaneous mode and let the instrument to come out of warm up mode. Put the instrument on sample mode it will start the measurement of VOC present in the ambient air. The instrument will monitor Benzene, toluene, Ethyl benzene M+P xylene. Data will log in station computer.
5.0 Calibration
5.1 Requirements - Prior to Calibration or Zero/Span Check
a) The analyzer under calibration should be in operation for at least overnight so that it is fully warmed up and stabilized.
b) Allow the analyzer to sample test atmosphere with known concentration of pollutants.
c) During calibration, the analyzer should be operating in its normal sampling mode and it should sample the test atmosphere through all filters, scrubbers, conditioners, and other components used during normal ambient sampling and through as much of the ambient air inlet system as is practicable.
d) Complete all operational adjustments of the analyzer.
5.2 Standards and Equipment
The calibration of ambient air quality measuring BTX analyzer require a stable, homogeneous gas mixture having the concentration suitable for measuring range of the analyzer to be calibrated. All such test concentrations must be derived from local or working standards that are certified and traceable to primary standards. Built in bench or dilution system is used for calibration.
5.3 Pressure Regulators for the BTX Cylinders
A two-stage regulator with inlet and delivery pressure gauges will be required for the Benzene calibration standard cylinder. Procure regulators for each cylinder if individual cylinders are to be used for individual calibration points. Ensure the cylinders have a non-reactive diaphragm and suitable delivery pressure. Consult the supplier from whom the BTX cylinders are to be obtained for the correct cylinder fitting size required for the regulator.
5.4 Flow Controller/calibrator
The flow controller can be any device (valve) capable of adjusting and regulating the flow from the calibration standard. If the dilution method is to be used for calibration, a second device is required for the zero-air. For dilution, the controllers shall be capable
43
of regulating the flow ± 1%.All the modern dilution system/calibrators have the high precision and accuracy in maintaining the critical flows. The calibrator has the facility to calibrate the instrument with gas cylinder or permeation bench. Out put of the calibrator is connected with the span port of the analyzer.
5.5 Zero Gas
Zero gas is defined as gas, which does not contain the parameters to be monitored (any impurity). The concentration of zero gas must be zero in respect of pollutant being calibrated.
5.6 Span Gas (Calibration Gas)
The span gas must be capable of providing an accurate, stable and reliable concentration of measured gas. Span gas can be gas mixtures or permeation tubes. What so ever may the span source it must be certified and traceable to NIST. The working standard should also be verified with CRM.
5.7 Zero and Span Calibration Procedures
a) Zero Calibration
Switch the analyzer at ZERO mode and connect zero gas of (N of 99.995% purity) from 2
external source. After the reading has stabilized, check the display of zero value. In case of deviation, adjust the ZERO value.
b) Span Calibration
After the ZERO calibration has been done, connect the span gas cylinder or permeation bench, of known concentration of Benzene. Switch on the analyzer to SPAN mode. Open the regulator valve of the cylinder and the analyzer will start measuring the span gas concentration. Let the instrument run for three to four cycles for stabilization of results. Observe the chromatogram of the analyzer, and in case there is any variation in the measured value and SPAN gas concentration, adjust the reading of the analyzer to the SPAN gas concentration value. Let it be stabilized again for at least three cycles. On obtaining a desired stable SPAN concentration the instrument should be flushed out with zero air for one or two cycles. After ZERO and SPAN calibration, switch the analyzer to SAMPLE mode. Now, analyzer will measure the benzene and its compounds as per its configuration in the ambient air.
c) Multipoint Calibration
Multipoint calibration consists of three or more test concentrations including zero concentration. A concentration between 80% and 90% of the full-scale range of the

44
analyzer under calibration, and one or more intermediate concentrations spaced approximately equally over the scale range are required. Multipoint calibrations are used to establish or verify the linearity of analyzer on initial installation and after any major repair. The analyzers have zero and span adjustment controls, which should be adjusted based on the zero and highest test concentration to provide the desired scale range within the analyzer's specifications. Zero and span controls adjustment often affect the zero/span value, so the adjustments may have to be repeated several times to obtain consistent values i.e. zero or span concentrations.
6.0 Calculation
To convert ppb volume fraction to micrograms per cubic metre, use the following equation:
r x m x 298 2 r
r = ------------------------1
24 450 x T x 101.3
Where:3r = is the Benzene mass concentration, in microgram /m 1
r = the Benzene mass concentration, ppb volume fraction2
m = is the molar mass of Benzene, (78 g/mol)r
298 = is the standard absolute temperature, in Kelvinr = is the measured gas pressure, in kilopascals24. 450= is the molecular volume of 1 mole, in millilitresT = is the measured absolute gas temperature, in Kelvin101.3 = is the standard gas pressure, in kilopascals
7.0 Precautions
— Operate the analyser in air- conditioned and dust proof room. The temperature should be between 20-25 degree Celsius
— Follow standard safety practices for the handling and storage of calibration gas cylinders & the installation and use of the analyser.
— Do not expose calibration cylinders to direct sunlight or excessive heat.— Maintain the same sample cell flow rate during sampling and calibration. Use
the same sample pump.
8.0 Quality control
There should be a quality control plan, which allows for modification of the frequency and number of points required for calibration. Such a quality control programme assures the accuracy and reliability of the air quality data collected. The calibration programme must include information of dates of calibration, atmospheric conditions,
r
45
control setting and other pertinent data.
The analyzer should be calibrated or re-calibrated:
(a) on its initial installation;(b) following its relocation;(c) after every repair or service;(d) if an interruption in operation of more than a few days; and(e) on detection of malfunction or changing of the analyzer in calibration.
In routine operation calibration of analyzer should be checked periodically defining period (once a week) to maintain close agreement between the calibration values used to convert analyzer responses to concentration measurements and the actual response of the analyzer. The frequency of routine periodic calibration is a matter of judgment and is a trade-off among several considerations, including:
(a) the inherent stability of the analyzer under the prevailing conditions of temperature, pressure, line voltage, etc. at the monitoring site;
(b) the quality of the ambient measurement needed;(c) the risk of collecting invalid data because of a malfunction or invalid data or
response problem with the analyzer that would not be discovered until the calibration is carried out.
When a new monitoring instrument is installed, zero and span calibration should be very frequent, may be daily. After obtaining enough data on the drift performance of the analyzer, the calibration frequency can be adjusted to provide a suitable compromise among the various considerations mentioned above. To facilitate the process of determining calibration frequency, it is strongly recommended that control charts should be used to monitor the zero and span drift performance of each analyzer. If the drift becomes excessive, then the corrective action has to be taken.
9.0 Record
The calibration record of analyzer with details like calibration data, calibration equation, analyzer identification, analyzer location, calibration standards used and their traceability, identity of calibration equipment used shall be maintained by the concerned laboratory staff.
10.0 References
1. Quantitation by Portable Gas Chromatography: Mass Spectrometry of VOCs Associated with Vapor Intrusion by Justin D. Fair,WilliamF. Bailey, Robert A. Felty, Amy E. Gifford, Benjamin Shultes,and Leslie H. Volles

46
FLOW DIAGRAM OF BTX ANALYSER
47
DISCLAIMER
The guidelines for the measurement of Ambient Air Pollutants (NAAQS 2009) are based on the reference methods (Viz. International Standards Organization and Inter Society Committee) based on field and laboratory experiences.
Efforts have been made to make it user friendly and easily understandable, however comments and suggestions towards its improvement are solicited.
© Central Pollution Control Board, 2011

A
Form A-1
Ambient Air Quality Data Reporting Format (Annual)
Monitoring Agency
:
Year :
Name of City :
Name of Station : Station Code :
Area :
Parameters Unit No. of 24
Hourly observations
Annual Mean
Measurement Method #
Sulphur dioxide (SO2) µg/m3 Improved West and Gaeke Method
Ultraviolet Fluorescence Any Other
Nitrogen dioxide (NO2) µg/m3 Jacob & Hochheiser modified (NaOH-NaAsO2) Method
Gas Phase Chemiluminescence Any Other
Ammonia (NH3) µg/m3 Chemiluminescence Indophenol method Any Other
Particulate Matter, PM 10 µg/m3 Gravimetric Beta attenuation TEOM Any Other
Particulate Matter, PM 2.5 µg/m3 Gravimetric Beta attenuation TEOM Any Other
Lead (Pb) µg/m3 AAS/ICP Method after sampling on EPM 2000 or equivalent filter paper
ED-XRF using Teflon filter Any Other
Nickel (Ni) ng/m3 AAS/ICP Method after sampling on EPM 2000 or equivalent filter paper Any Other
Arsenic (As) ng/m3 AAS/ICP Method after sampling on EPM 2000 or equivalent filter paper Any Other
Benzo (a) Pyrene (BaP) ng/m3 Solvent extraction followed by HPLC/GC analysis
Any Other
Benzene (C6H6) µg/m3
Gas Chromatography (GC) based continuous analyzer
Adsorption and desorption followed by GC analysis
Any Other # Tick (√) mark the method followed
(Checked & Compiled by) (Authorized Signatory) B
Form D-1
Ambient Air Quality Data Reporting Format (24 Hours)
Monitoring Agency :
Month & Year :
Name of City : Name of Station : Station Code :
Area :
Date Concentration
SO2 (µg/m3)
NO2
(µg/m3) PM10
(µg/m3) PM2.5
(µg/m3) NH3
(µg/m3)
Benzene (µg/m3)
Measurement Method #
Improved West and Gaeke Method
Jacob & Hochheiser modified (NaOH-NaAsO2) Method
Gravimetric Gravimetric Chemiluminescence
Gas Chromatography (GC) based continuous analyzer Beta attenuation Beta attenuation
Ultraviolet Fluorescence
Gas Phase Chemiluminescence TEOM TEOM Indophenol
method Adsorption and desorption followed by GC analysis
Any Other Any Other Any Other Any Other Any Other Any Other
# Tick (√) mark the method followed Note: 24 hourly Data of Benzene required for calculation of Annual average
(Checked & Compiled by) (Authorized Signatory)

C
Form D-2 Ambient Air Quality Data Reporting Format (01 Hour/08Hours)
Monitoring Agency : Month & Year : Name of City : Name of Station : Station Code : Area : CO
(mg/m3) CO
(mg/m3) Ozone (µg/m3)
Ozone (µg/m3)
Measurement Method #
Non dispersive Infrared (NDIR) Spectroscopy
UV Photometric Chemiluminescence
Any Other Chemical Method Any Other
Hours 01 Hour 08 Hours 01 Hour 08 Hours # Tick (√) mark the method followed (Checked & Compiled by) (Authorized Signatory)
D
Form D-3 Ambient Air Quality Data Reporting Format (24 Hours)
Monitoring Agency
:
Month & Year :
Name of City :
Name of Station : Station Code :
Area : Date
Concentration in PM10
Lead (Pb)
(µg/m3) Nickel (Ni)
(ng/m3) Arsenic (As)
(ng/m3)
BaP (ng/m3)
Measurement Method #
AAS/ICP Method after sampling on EPM 2000 or equivalent filter paper
AAS/ICP Method after sampling on EPM 2000 or equivalent filter paper
AAS/ICP Method after sampling on EPM 2000 or equivalent filter paper
Solvent extraction followed by HPLC/GC analysis
Any Other Any Other Any Other Any Other
Note: 24 hourly Data of Nickel, Arsenic & BaP required for calculation of Annual average
(Checked & Compiled by) (Authorized Signatory)

Zonal Offices of Central Pollution Control Board
PARIVESH BHAWAN, CPCB HEAD OFFICE
Central Pollution Control Board‘Parivesh Bhawan’, East Arjun Nagar,
Shahdara, Delhi -110 032Tel. 011-43102030
Telefax- 22305793/22307078/22301932/22304948e-mail : [email protected] Web: cpcb.nic.in
BA
NG
ALO
RE
BH
OP
AL
KO
LK
ATA
LU
CK
NO
W
SH
ILLO
NG
VA
DO
DA
RA
AG
RA
PR
OJE
CT
OFFIC
E
1st and 2nd Floors, Nisarga Bhavan,A-Block, Thimmaih Main Road, 7th D Cross,
Shivanagar, Opp. Pushpanjali Theatre,Banglore - 560 010
Tel. 080-23233827 (O) 080-23233739/23233827/23233996 Fax- 080-23234059
3rd Floor, Shakar Bhawan, North TT Nagar, Bhopal - 462 003
Tel. 0755-2775587 (O)2775385/86 (EPABX)Fax - 0755-2775587
Southernd ConclaveBlock 502, 5th & 6th Floors, 582 Rajdanga, Main Road,
Kolkata - 700 107Tel. 033-24416332 (Direct)24414289/4677/6003/6634 Fax - 033-24418725
Ground Floor, PICUP Bhawan, Vibhuti Khand, Gomti Nagar,
Lucknow - 226 010Tel. 0522-4087601/2721915/16
0522-4087600 (EPABX)Fax 0522-2721891
TUM-SIR Lower Motinagar,Near Fire Brigade H.Q.
Shillong - 793 014Tel. 0364-2520923/2522859
Fax 0364-2520805
Parivesh BhawanOpp. VMC Ward Office No. 10,
Subhanpura, Vadodara - 390 023Tel. 0265-2283226/ 2283245
Fax 0265-2283294
4, Dholpur House, M.G. Road,
Agra - 282 001Tel. 0562-2421548Fax 0562-2421568
A Clean PARIVESH for all is our goal