guidelines for land capability assessment in...
TRANSCRIPT
GUIDELINES FOR LAND CAPABILITY ASSESSMENT
IN VICTORIA
R K ROWE D F HOWE N F ALLEY
Land Capability Assessment Section
January 1981 SOIL CONSERVATION AUTHORITY 378 Cotham Road, Kew, Victoria 3101
ONTENTS
i
C ACKNOWLEDGEMENTS .........................................................................................................................................................iii PREFACE ....................................................................................................................................................................................iv PART 1 – LAND CAPABILITY ASSESSMENT........................................................................................................................1
1 LAND CAPABILITY.....................................................................................................................................................1 1.1 INTRODUCTION.................................................................................................................................................1 1.2 PRINCIPLES.........................................................................................................................................................1 1.3 SCALES OF APPLICATION OF LAND CAPABILITY INFORMATION........................................................2
2. BASIC CONCEPTS .......................................................................................................................................................3 2.1 LAND....................................................................................................................................................................3 2.2 LAND COMPONENTS: LAND SYSTEMS: LAND CAPABILITY MAP UNITS ..........................................3 2.3 LAND USE: LAND UTILIZATION TYPE ........................................................................................................4 2.4 ENVIRONMENTAL EFFECTS: HAZARDS ....................................................................................................4 2.5 LAND CHARACTERISTICS: LAND QUALITIES...........................................................................................4 2.6 LAND CAPABILITY CLASS, SUB-CLASS.......................................................................................................5 2.7 CAPABILITY: SUITABILITY ...........................................................................................................................6
3. DEVELOPMENT OF LAND CAPABILITY RATING SYSTEMS..............................................................................7 3.1 INITIAL PROCEDURES......................................................................................................................................7 3.2 CONTINUED DEVELOPMENT: INFORMATION FEEDBACK.....................................................................7
4. THE DATA NEEDS.......................................................................................................................................................8 4.1 MAPPING LAND CAPABILITY UNITS............................................................................................................8 4.2 AERIAL-PHOTO INTERPRETATION ...............................................................................................................8 4.3 SOIL TESTS .........................................................................................................................................................8
4.3.1 Tests for Unified Soil Group........................................................................................................................9 4.3.2 Tests for Shrink-swell Potential ...................................................................................................................9 4.3.3 Permeability Test .......................................................................................................................................10 4.3.4 TEST FOR DISPERSIBLE CLAYS .........................................................................................................14 4.3.5 DETERMINATION OF pH.......................................................................................................................14
4.4 DATA RECORDING..........................................................................................................................................14 5. APPLYING THE SYSTEMS .......................................................................................................................................15
PART II THE LAND CAPABILITY RATING SYSTEMS......................................................................................................17 6. LAND CAPABILITY RATING SYSTEMS FOR ENGINEERING USES.................................................................18 7. LAND CAPABILITY RATING SYSTEMS FOR SEPTIC WASTE DISPOSAL ......................................................22 8. LAND CAPABILITY RATING SYTEMS FOR EARTH RESOURCES ...................................................................26
LA9. ND CAPABILITY RATING SYTEMS FOR LAND-BASED RECREATION.....................................................31 10. LAND CAPABILITY RATING SYTEMS FOR GRAZING..................................................................................38
................................................................................11. LAND CAPABILITY RATING SYTEMS FOR CROPPING 41 12. LAND CAPABILITY RATING SYTEMS FOR FORESTRY ...............................................................................43
PART III PROCEDURES FOR CARRYING OUT LAND CAPABILITY STUDIES ............................................................44 13. GENERAL PROCEDURES ....................................................................................................................................45 14. REPORT FORMATS AND PRESENTATION.......................................................................................................50 15. STANDARD SECTIONS ........................................................................................................................................55
15.1 PREFACE ...........................................................................................................................................................55 15.2 STATEMENTS OF LIMITATIONS FOR REPORTS AND MAPS..................................................................55
15.2.1 Limitations on Use of Reports ...................................................................................................................55 15.2.2 Statement of Limitations for Land Capability Maps..................................................................................55
.2.315 General Statement of Scope and Limitations.............................................................................................56 15.3 PRESENTATION OF THE CAPABILITY CLASSES ON MAPS ...................................................................57 15.4 SYMBOLS FOR DIAGNOSTIC CRITERIA AND SUB-CLASSES AND THEIR USE..................................57 15.5 LAND CHARACTERISTICS USED IN LAND CAPABILITY ASSESSMENT .............................................59 15.6 CONSERVATION MANAGEMENT PRACTICES..........................................................................................65
A. General recommendations for engineering activities ..........................................................................................65

LIST OF FIGURES
ii
Fig. 1 Principles of two field methods for soil hydraulic conductivity measurements...........................13 LIST OF TABLES
Table 1. Hydraulic conductivity of various surface soil materials (m/day)...........................................11 Table 2: Hydraulic conductivities of major soils in forest catchments in the ACT. (After Talsma and Hallam, 1980) .........................................................................................................................................12 Table 14.1 Land Capability Classes – Generalised Definitions ............................................................52

ACKNOWLEDGEMENTS The approach to land capability assessment outlined below has been greatly influenced by an evaluation of overseas assessment procedures undertaken by F R Gibbons (1976), His continued support and advice is gratefully acknowledged. We have, however, also drawn heavily on a number of other reports including the proceedings of several FAO conferences (the most recent being FAO Soil Bulletin 32) and the USDA Soil Conservation Service, Soil Survey Interpretation (1972-73). We are particularly grateful to Professor G W Olson of Cornell University for his advice on procedures of land evaluation being practiced in the United States. Although it is not possible to name them all, many officers of the Soil Conservation Authority have willingly contributed to the development of these guidelines. Of particular assistance have been the contributions made by R T Costello, M J Ransom, J Dickie, A Harris and L Russell. We express our thanks to all of these officers because the success of the guidelines is largely the result of their willing efforts and continued interest in land capability assessment.
iii

iv
PREFACE These Guidelines are intended to assist the staff of the Soil Conservation Authority in the production of land capability information. They should lead to increased expertise in land capability assessment and result in more consistent interpretations of capability across the State. Land capability information is required by the Authority to assist in: (1) making land use determinations in proclaimed water supply catchments; (2) the development of advice to land managers where alternative management practices or changes in land use may be desirable to achieve soil conservation; and (3) providing information on land capability to land use planners. The Guidelines include explanatory notes and definitions of terms relating to land capability assessment, some simple tests for data needed to make ratings, sets of capability rating systems for a range of land uses, administrative procedures, recommended formats and standardised material for the reporting of land capability studies. Our knowledge of the theory and application of land capability assessment is evolving as our understanding of the relationships between land and its use increases and new approaches are developed. Thus, the Guidelines is not intended to be a static document but will change to meet the changing needs for land capability and land use planning. When changes become necessary or as new assessment systems are developed, the modifications will be sent to holders of the Guidelines for inclusion in the folder. No part of these Guidelines may be reproduced, quoted or used as a reference in published papers without the written permission of the Soil Conservation Authority.
PART 1 – LAND CAPABILITY ASSESSMENT
1 LAND CAPABILITY
1.1 INTRODUCTION Who does not plan ahead at some time? If we build a house we must draw a plan which helps us to ensure that there are enough materials and they are properly used to achieve our objectives. If we start up a business, we examine the alternative courses of action available and try to predict their consequences so that we may select that which is most likely to enable us to achieve our objectives, for example, maximise profits without risking security. So also with using the land – we need to plan ahead. It is advisable to know what the land is capable of and what is needed to achieve the land use objectives. This involves assessing both the productivity of the land under specified management and risks involved, and where necessary, deciding what action to take to reduce the risks. The proposed approach to land capability assessment provides a rational, relatively objective and consistent means of doing this. The assessment systems can be designed to predict levels of production and the effect of the use on the land, or to indicate the levels of management required to achieve specified levels of production or standards of conservation. The systems developed by the Authority provide an analysis of the physical characteristics of land which do not change appreciably with time and which can be overlaid with economic and/or social considerations which do change with time. They therefore provide basic information for land use planning. The most usual type of land capability rating system is a table (see Part II), in which those land characteristics or land qualities which have the greatest effect on the performance of the land in a specific kind of use are listed, and the range over which they have an effect is subdivided into a number of classes, each of which represents a stage in the performance scale. The system adopted by the Soil Conservation Authority has five classes, with Class 1 having the highest capability.
1.2 PRINCIPLES Three principles are fundamental to the approach and methods employed in land capability assessment. These are as follows:
• The kind of use is to be specified This principle recognizes that different kinds of land use have different requirements. Thus, assessment of land capability is only meaningful when applied to specific kinds of land use, each with their own requirements.
• Inputs and management are to be specified Land in itself, without inputs or management, rarely if ever possesses productive potential. Even the collection of wild fruit requires labour, whilst the use of natural wilderness for nature conservation requires measures for its protection. The productive potential and the effect on the land of any use also depend on the kinds
1

and levels of inputs, such as labour, fertilizers, special equipment, and management skills.
• Effects of use on the land are to be considered There are, no doubt, forms of land use which appear to be highly profitable in the short term, but which are likely to lead to such effects as soil erosion, progressive pasture degradation, or adverse changes in river regimes. Knowledge of such consequences is needed to allow appropriate decisions to be made so that the desired land use objectives can be attained. A common objective is sustained use, which requires that the land must not be allowed to deteriorate to the extent that it affects long term production. This principle does not mean that the environment should be preserved in a completely unaltered state. Most kinds of land use necessitate changes to the land. Agriculture commonly involves clearing of natural vegetation and changes in soil fertility. Thus, for any proposed form of land use, the probable consequences for the environment should be assessed and such assessments taken into consideration in determining capability.
1.3 SCALES OF APPLICATION OF LAND CAPABILITY INFORMATION Three main levels of land use planning are commonly recognized:
• Regional or strategy planning (broad scale) • Local, municipal or group area planning (intermediate scale) • Landholder, subdivision or farm planning (detailed scale)
Land capability assessment aims to provide relevant data at the appropriate scale for each level. It is not possible to satisfy the requirements of all three levels of planning in a single map since each needs a different scale of information. Regional planning can be satisfied with small scale mapping ranging from 1:250 000 to 1:100 000 and more detailed and specific information. Map scales of 1:50 000 to 1:25 000 are most useful for local, municipal or group area planning. The kind of land use may also be described in various levels of detail. For example, one may distinguish between agriculture, forestry and recreation at the broadest level, but agriculture can be subdivided into cropping, grazing and other forms, and cropping can be further subdivided into such uses as cereal cropping and row cropping.
2

2. BASIC CONCEPTS
2.1 LAND In the Department’s work in land capability assessment, land is considered to include all the elements of the physical environment, including climate, geology, topography, soils, hydrology and vegetation. Thus “land” is used in a wider sense than the traditional concept of just soil or terrain. Variation in soils, or soils and landforms, is often used as the basis for identifying different land mapping units within a local area. Where other features such as climate or rook type are uniform. Although one or other characteristic such as soils or relief may exert a dominant influence, it is the interaction between all of the various land characteristics which determines the potential for land use. Hence it is “land” which is employed as the basis for land capability assessment.
2.2 LAND COMPONENTS: LAND SYSTEMS: LAND CAPABILITY MAP UNITS Identification of areas of land which are uniform with respect to a broad range of land characteristics is a main objective of the SCA land system mapping approach. Such areas are referred to as land components. Land systems, which are the most usual mapping units, are areas of land where the land components occur in consistent patterns. Land systems are usually mapped at scales of 1:250 000 or 1:100 000 but land component mapping requires larger scales. Land capability rating systems are designed for application to areas of land which are uniform with respect to the relevant diagnostic criteria. Land components as defined in land system studies are general purpose units which provide a general characterisation of the land. Although they may be appropriate as land capability map units it is possible that the specific land use being considered may be better served for capability rating by amalgamation or subdivision of the land components as defined above. It is also possible that an entirely new map unit need be defined on the basis of the land characteristic data presented in the land system report, possibly even supplemented by new data. It must be accepted, however, that is probably not realistic to aim for absolute uniformity of a land map unit, so a sensible amount of variability must be expected. In some areas, where extreme variation occurs over small distances, a complex map unit may be defined. The capability rating will in effect apply to the whole of the map unit. It is possible to rate land systems by combining the ratings for the individual components in various proportioning systems. When presenting land system capability ratings, it is desirable to tabulate the separate component capability ratings as well as the proportional land systems capability rating, even if the components are not mapped. This will facilitate the task of recognizing land capability at a larger scale (in selected areas) where the need may subsequently arise.
3
2.3 LAND USE: LAND UTILIZATION TYPE Land use may be described simply in terms of the kind of production involved, and this may be as specific as required, e.g. agriculture, cropping, cereal cropping, or even winter oats cropping. In land capability assessment, however, it is necessary to provide information about management inputs to achieve the kind of production. To identify this a more detailed statement, the land utilization type, is introduced which requires specification of both the kind of production and the principal management requirements. The degree of detail provided depends on the level of planning for which the capability ratings are required. Most existing land capability assessment systems are based on average management, but although this may be stated, just what is meant by average is often not stated. Some example of simple land utilization types are:
• Commercial wheat production on large freehold farms, with high capital and low labour intensity, and a high level of mechanization and management.
• Extensive cattle grazing, with medium levels of capital and labour intensity, on freehold land.
• Softwood plantations operated by a Government Department of Forestry, with high capital, low labour intensity and advanced technology.
• A national park for recreation and tourism.
2.4 ENVIRONMENTAL EFFECTS: HAZARDS The use land for any purpose may alter the land itself through modification of the land characteristics. Such changes are described by the term environmental effects and these can be detrimental or beneficial. In general terms, a hazard may be defined as a potential source of harm. In the context of land capability assessment, a hazard is an environmental effect resulting from the use of the land which threatens to reduce the ability of the land to produce or to be used to attain a desired objective. It usually relates to a specific kind of user, but may also affect the productivity of adjacent land or water. Hazards are specified in terms of the type of effect (e.g. sheet erosion, nutrient decline, waterlogging) and the degree of impact. The description of hazard should also include a statement of the probability of the development of the effect, for example, there may be a high probability of serious dryland salting. It should be noted that some natural land characteristics have an adverse effect on production, but this is not strictly a land characteristic which may limit the use of the land. If land management changes the flooding characteristics of the land, then this is an environmental effect which may be adverse or beneficial. Thus, increased frequency of flooding would be a hazard to residential land use, but may be beneficial for water-fowl.
2.5 LAND CHARACTERISTICS: LAND QUALITIES A land characteristic is a property of land that can be measured or estimated. Examples are slope angle, rainfall, soil texture, and depth to bedrock.
4
In determining land capability, however, it may be necessary to take account of interaction between two or more land characteristics. For example, the hazard of soil erosion is determined by the interaction between slope angle, slope length, soil permeability, soil structure, rainfall intensity and other characteristics. Because of the problem of accounting for interactions, it may in some instances be necessary to use an assessment of the combined effect of several land characteristics. For convenience, such a combined variable is referred to as a land quality. A land quality is a complex characteristic of land which has a well understood influence on the capability of land for a specific use. Examples are the availability of soil moisture for plant growth, erosion resistance, and the ability of soil to retain nutrients. Although a land quality may be measured or calculated from the values of its contributing land characteristics, this type of data is most likely to be used where quantification is difficult or not possible with existing facilities. Land qualities or characteristics used to determine land capability classes or subclasses are known as diagnostic criteria. For every diagnostic criterion there will be a critical value or set of critical values which are used to define capability class limits. Land mapping units used in land capability assessment are described in terms of land characteristics or land qualities.
2.6 LAND CAPABILITY CLASS, SUB-CLASS The land capability class indicates the degree or severity of the limitations from which it is possible to infer the degree of production (or success) in the use specified by the land utilization type. The Soil Conservation Authority has accepted as a standard five-class capability rating system. The class is denoted by numbers 1 to 5. Capability Class 1 has the highest capability, the least limitations and higher hazards to the land. Capability Classes 2 and 3 have successively lower capabilities, more limitations and higher hazards to the land. Capability Class 4 indicates that the capability is low and the limitations and hazards to the land are such that it is marginal for the use specified. Capability Class 5 indicates that under most circumstances it is unlikely that such use could be sustained even with very substantial inputs. Land capability sub-classes indicate the kinds and number of limitations which are involved in assigning the capability class. The sub-class is denoted by letters, each of which identifies a diagnostic criterion. A list of diagnostic criteria and the symbols to be used in designating sub-classes is provided in Section 15.4.
5

2.7 CAPABILITY: SUITABILITY Confusion sometimes arises over the use of the terms “capability” and “suitability”. In some instances they are used synonymously, in others a distinction is made. In the content of land evaluation, capability should be used in reference to the influence that the characteristics of the land have on the use. Suitability applies where other considerations such as location or access are also favourable. For example, a piece of land may have a high capability for absorbing liquid effluent, but may not be near enough to the source of the effluent to make it suitable for that purpose.
6

3. DEVELOPMENT OF LAND CAPABILITY RATING SYSTEMS
3.1 INITIAL PROCEDURES The development of a land capability rating system requires the involvement of people with expertise in the type of land use of concern. Initially a definition of the kind of land use or the land utilization type is required, and this should be determined in co-operation with the potential users of the system. This must include a statement of the level of management on which the system will be based. It is then necessary to identify those land characteristics or land qualities which have dominant effects on the production and hazards to land and water arising from the land utilization type. The relationship between the level or value of the land characteristic and aspects of the performance of the land is sought either from experts in the relevant kind of use or by experiments. The range of values over which each of the land characteristics has an effect is then subdivided into five classes, each of which represents a stage in the performance range which relates to the respective capability class definitions (see Section 2.6). Wherever possible, quantification of values should be attempted. The first draft of the capability rating table must be tested in the field before it is accepted for general use.
3.2 CONTINUED DEVELOPMENT: INFORMATION FEEDBACK Although each land capability rating table released for general application should provide a sound basis for making capability ratings, it is inevitable that weaknesses or inadequacies will become apparent as it is used over a wide range of situations. Problems encountered by users of the rating systems should be referred to the Land Capability Section of the Authority. For the present, a single Head Office file has been created for the handling of comments on land capability assessment – SC/R/70.9. When it becomes necessary to revise a rating system, a copy of the new system will be sent to all holders of the “Guidelines” and the superseded rating system should be withdrawn from the folder and destroyed.
7
4. THE DATA NEEDS
4.1 MAPPING LAND CAPABILITY UNITS Land capability ratings are applied to areas of land which are uniform, with practical limits, with respect to the land characteristics in the relevant rating system. Land system and land component information, where available, provides basic data about the land characteristics. In most situations, the boundaries of land systems should be relevant for mapping land capability units, the land components must be carefully examined to ensure that they distinguish areas which differ in those characteristics required for the capability rating. In some instances, for example, the slope range within a land component defined for the land systems study may exceed that required to define a single capability map unit. Where class limits of land characteristics used to define the component differ significantly from those used in the rating systems, new capability units must be defined and mapped. Large scale aerial photos can be valuable aids to mapping land capability units, and it may be worthwhile having the study area flown to provide appropriate aerial-photo coverage if it does not exist. Stereo-interpretation of aerial photos can be used to map slope classes as well as helping to identify other land differences (see Section 4.2), Preliminary capability map units based on aerial-photo interpretation should be field checked to confirm the boundaries, and additional data may be collected at the same time. Confirmation of the soils as indicated in the land component definition is necessary, and such data as depth of topsoil or depth to watertable may have to be collected by field examination.
4.2 AERIAL-PHOTO INTERPRETATION Aerial photographs provide a valuable record of the nature of the land, and may be used simply to illustrate the different kinds of land. Viewing air photo pairs stereoscopically is a valuable aid to land capability assessment since it is possible to see a three-dimensional image of the land and to identify differences in slope angle and shape of the land surface. Differences in photo-tone and the detailed patterns which may be present, can also be used to infer certain land characteristics. The skilful use of aerial photographs can provide much of the data required for mapping and rating land capability units, although some field checking and data collection is also necessary.
4.3 SOIL TESTS As a matter of routine a number of soil tests are carried out in the Authority laboratory. These cover both physical and chemical tests which are required to characterise soils for land system studies and physical tests for farm dam construction.
8
In many instances special techniques and equipment are needed to make the tests and these are best carried out in a well equipped laboratory. There are, however, a few relatively simple standard tests which can be used to provide an indication of the values for some of the data needed for some capability ratings and which can be carried out with a basic set of equipment. It must be emphasized however, that unless carried out correctly, these tests give only approximate results. For more accurate results, samples should be sent to the central soil laboratory for analysis.
4.3.1 Tests for Unified Soil Group A series of field tests which require no special equipment are available to make a tentative classification of a soil material into one of the groups of the Unified Soil Classification. These are set out in the Authority publication “Soil Conservation Theory” (Garden and Feehan 1978) and in numerous standard soil engineering texts.
4.3.2 Tests for Shrink-swell Potential Field tests to provide an estimate of the shrink-swell potential are liable to give unreliable results unless the critical moisture content (defined as the liquid limit) is achieved. Where a number of tests are to be done, several samples should also be sent to the laboratory for accurate analysis to provide a check. The test is carried out in the following way:
(1) The soil is well crushed and sieved through a #40 sieve, which has holes 0.4 mm across. A reasonably fine kitchen sieve is about the right grade. The material passing that sieve is roughly that portion which would pass the #40 sieve. If such a sieve is not available the coarse material which can be separated by hand should be removed.
(2) The soil which passes the #40 sieve is mixed with sufficient water to bring it to its liquid limit. This is the condition at which the wet soil mass just starts to flow as a viscous fluid.
(3) When in this condition a small trough of semi-circular cross-section is completely filled with the soil; excess soil is cut off with a knife or spatula. The trough should be about 10 cm long and about 2.5 cm across. To reduce the risk of the soil block breaking as it dries and shrinks, the inner surfaces of the trough are coated with petroleum jelly.
(4) The trough and wt soil are placed in a warm dry place to allow the soil to dry thoroughly.
(5) When thoroughly dry, (technically oven dry), the length of the dry soil block is measured and the linear shrinkage determined. For the capability rating tables, linear shrinkage is expressed as a percentage of the original length of the soil block (the internal length of the trough).
Note that the shrink-swell potential obtained relates to the finer fraction of the soil sand this is the value in the rating tables. If the soil contains a large proportion of material coarser than #40 sieve, the actual shrink-swell potential of the whole soil may be lower.
9
4.3.3 Permeability Test
4.3.3.1 Introduction The correct term for permeability is hydraulic conductivity, but the former term is commonly used. The soil hydraulic conductivity represents the amount of water than can flow through a unit cross-section in the soil in unit timer under standard conditions. It can be expressed as the number of cubic metres of water (or 1000 litres) passing through 1 square metre of cross-section per day, m3/m2 . day, or in metres per day, which is the same. The intention of hydraulic conductivity tests is to determine the potential rate of water movement through the soil. In layered soil profiles, in which each soil horizon is likely to have a different hydraulic conductivity, the direction and rate of flow are strongly affected by the layering and the slope of these layers. For example water seeping out through an A horizon above a clayey B horizon in a road batter illustrates the situation where the conductivity in a lateral direction is greater than in a vertical direction, and hence flow is mainly lateral. In those cases when soil hydraulic conductivity data is relevant to land capability ratings or seepage calculations it is always necessary to consider the probable referred pathways for the water, their thickness, conductivity and slope, as well as the likely fate of that water during the various seasons as it moves through the soil. On in this context is it useful to carry out hydraulic conductivity tests. A final point is that hydraulic conductivities are highly variable over short distances in the same soil. Ten tests or so in a small area are usually adequate to obtain a representative average for a much wider area on the same soil, but this depends on the inherent variability which is not the same for each soil type. The use of the geometric mean as an averaging method is recommended. A geometric mean of n values, V1, V2, ….., Vn, is the nth root of all n values multiplied together. This method reduces the influence of extreme results on the average value.
4.3.3.2 Methodology Several field methods exist for measuring in situ hydraulic conductivity of soil. The principles of two that are recommended, the Talsma and Hallam shallow well pump-in method and the inversed augerhole or Porchet method, are illustrated in Figure 1. A booklet giving details of the procedures is being prepared by the Soil Conservation Authority. The conventional percolation test, which is prescribed by the EPA and the Health Commission for assessing the suitability of soil for septic-tank effluent absorption., can be conducted in a manner to enable tone to calculate a K-value for the soil (see Fig. 1: Inversed augerhole or Porchet method). The percolation rate obtained from the percolation test is the rate of fall of water level in the test hole, usually expressed in cm per hour. However, this percolate rate is affected by the procedure followed (size and shape of hold, depth of filling with water, antecedent soil moisture conditions, etc.,) and the two methods referred to above are preferred.
10
11
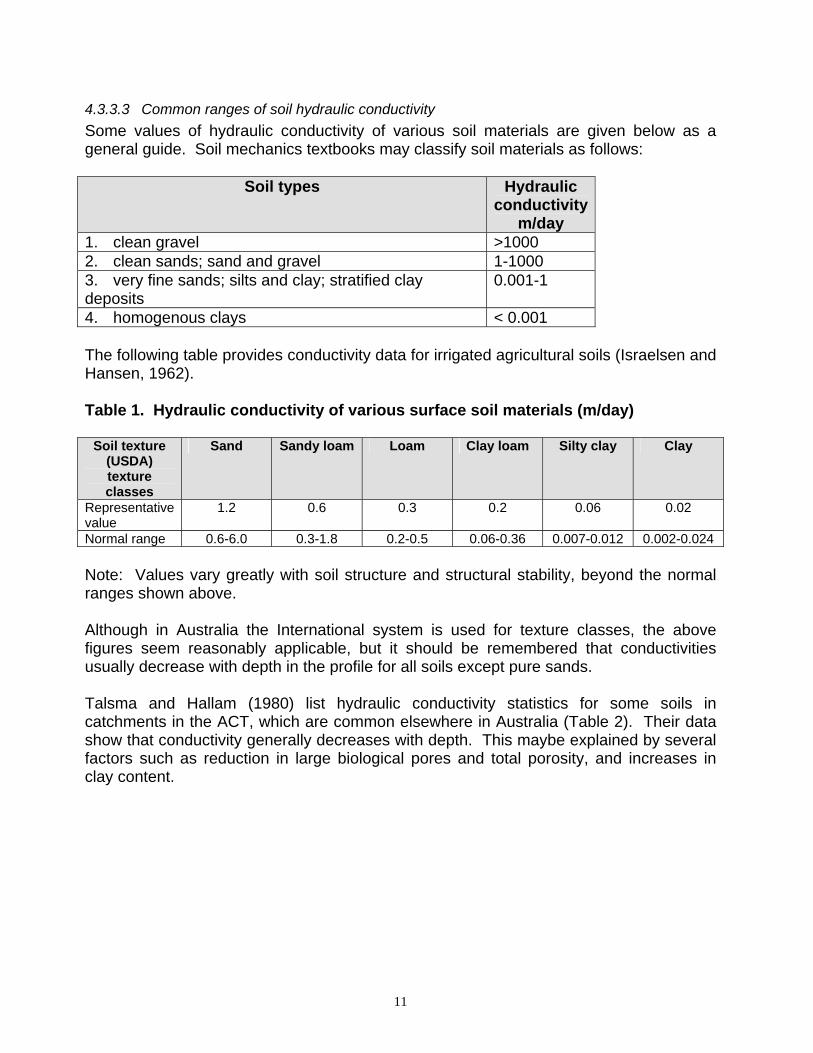
4.3.3.3 Common ranges of soil hydraulic conductivity Some values of hydraulic conductivity of various soil materials are given below as a general guide. Soil mechanics textbooks may classify soil materials as follows:
Soil types Hydraulic conductivity
m/day 1. clean gravel >1000 2. clean sands; sand and gravel 1-1000 3. very fine sands; silts and clay; stratified clay deposits
0.001-1
4. homogenous clays < 0.001 The following table provides conductivity data for irrigated agricultural soils (Israelsen and Hansen, 1962). Table 1. Hydraulic conductivity of various surface soil materials (m/day)
Soil texture (USDA) texture classes
Sand Sandy loam Loam Clay loam Silty clay Clay
Representative value
1.2 0.6 0.3 0.2 0.06 0.02
Normal range 0.6-6.0 0.3-1.8 0.2-0.5 0.06-0.36 0.007-0.012 0.002-0.024 Note: Values vary greatly with soil structure and structural stability, beyond the normal ranges shown above. Although in Australia the International system is used for texture classes, the above figures seem reasonably applicable, but it should be remembered that conductivities usually decrease with depth in the profile for all soils except pure sands. Talsma and Hallam (1980) list hydraulic conductivity statistics for some soils in catchments in the ACT, which are common elsewhere in Australia (Table 2). Their data show that conductivity generally decreases with depth. This maybe explained by several factors such as reduction in large biological pores and total porosity, and increases in clay content.

Table 2: Hydraulic conductivities of major soils in forest catchments in the ACT. (After Talsma and Hallam, 1980)
Hydraulic conductivity values (m/day), or 1001/m2.day) Catchment location, elevation (m), and
geology
Landscape component
Soil classification (a) Northcote et al (1975)
(b) Stace et al (1968)
Depth interval (m) Geometric mean Median Range
Piccadilly, 1070-1300, metamorphosed sediments
Exposed slopes Shaded slopes
(a) Gn 4.14, rough ped red earth (b) Krasnozem
0-0.10
0.30-0.60 0.70-1.00
0-0.10 0.30-0.60 0.70-1.00
22.5
0.50 0.88 61.3 1.11 2.29
21.6
0.50 - - -
6.0-112
0.073-2.91 - - -
Bull’s Head 1150-1400, Granite and metamorphosed sediments
Granite “ “ “ “ Metamorphosed “ “
(a) Dr 4.21, friable red duplex (b) Red Podzolic (a) Gn 4.14, rough ped duplex (b) Krasnozem
0-0.10
0.15-0.25 0.30-0.60 0.70-1.00 1.10-1.40
0-0.10
0.30-0.60 0.70-1.00
25.6 1.7
0.67 0.14
0.032
60.5 0.70 0.49
25.1 1.72 0.68 0.15
0.036 - - -
3.0-812
0.27-8.04 0.031-12.96 0.008-2.68
0.0029-1.47 - - -
Bushrangers 980-1260, Granite
All parts Top slopes Bottom slopes
(a) Gn 2.14, massive red earth (b) Red earth
0-0.10
0.30-0.60 0.70-1.00
0.30-0.60 0.70-1.00
27.82
0.12 0.022
0.042 0.019
26.44
0.10 0.024
- -
3.46-112
0.010-5.53 0.0010-0.24
- -
Uriarra 640-760 Volcanic
Individual soil groups (a) Gn 2.74, mottled yellow massive earth (b) yellow earth (a) Dr 2.41, hard pedal duplex (b) red podzolic (a) Gn 2.74 plus Dr 2.41 Dy 3.41, hard pedal mottled yellow duplex (b) yellow podzolic
0-0.10
0.30-0.60 0.70-1.00
0-0.10 0.30-0.60
0.70-1.00
0-0.10 0.30-0.60 0.70-1.00
3.9
0.17 0.024
6.8 0.21
0.042 0.019 1.38
0.012 0.0019
- - - - - -
0.026 -
0.0019
- - - - - -
0.0015-0.24 -
0.00011-0.17
12

Fig. 1 Principles of two field methods for soil hydraulic conductivity measurements A. Inversed augerhole or Porchet method, (Kessler & Oosterbaan, 1974) (i) Homogenous soil, no impermeable layer at or near bottom of hole
K = 1.15r 1- n
r/2)n( logr/2)1( logtt
htht +−+ (1)
(ii) Impervious layer at bottom of hole:
K = 1.15r 1- n
n)( log1)( logtt
htht − (2)
Where hti = waterlevel in hole at any time ti t1 = time at beginning of test tn = time at end of test B. Shallow well pump-in method, (Talsma & Hallam, 1980) (i) Homogenous soil, no impermeable layer at or near bottom of hole: K = Q {sinh-1 (H/r) – 1}/2πH2 For the preferred ration of H/r = 10 (equation 1) reduces to: K = Q/πH2 (ii) Impervious layers at shallow depth: S < 2H The approximate equation is – K = 3Q1n (H/r)/πH(3H + 2S) Where: Q = steady infiltration rate H = depth of wetting in hole S = depth to impermeable layer
13
4.3.4 TEST FOR DISPERSIBLE CLAYS A distinction must be made between dispersion and slaking as both phenomena may occurring during the test. Slaking is the process of collapse of the air-dry soil fragment when placed in water. Most soil aggregates slake when placed in water because of the internal stresses caused by entrapped air and by swelling of soil particles. Dispersion involves the separation of the finest soil particles and their suspension in the water. When dispersion occurs the water around the soil fragment becomes milky or cloudy. A simple qualitative test for dispersibility involves gently dropping a small fragment of air-dry soil (up to 0.5 cm across) into a beaker of clean rain water and observing the resulting dispersion after 15 to 20 minutes. High dispersion is indicated when a dense cloud of clay is produced and only the coarser soil particles remain. The proportion of the volume of material left undispersed after 24 hours may be estimated visually. Low dispersion results in only a slight milkiness in the water or none at all. For accurate results laboratory analyses are essential.
4.3.5 DETERMINATION OF pH A pH test kit such as the produced by the CSIRO is required for field determination of pH. The directions accompanying the kit should be adhered to. The test involves mixing a small amount of soil with a compound pH indicator followed by dusting with a non-reactive white powder to show the colour. After three minutes the pH is determined by comparing the colour with a standard colour chart that has been subdivided into the appropriate pH levels. It is not possible however, to accurately determine the pH by this method, and it is thus acceptable to record only to the nearest 0.5 pH unit.
4.4 DATA RECORDING The use of a standard form for recording data required for land capability assessment has several benefits. The form acts as a check-list which may help prevent necessary data being overlooked, it ensures that the data record is more easily handled by others; if a large amount of data is collected, automated data handling techniques, including computers, are more readily employed when the data records are already well organised. A standard data record sheet is available.
14
5. APPLYING THE SYSTEMS The assessment of land capability requires:
• The appropriate capability rating systems (tables) • A map showing the land capability map units • Data on the diagnostic criteria for each land capability map unit.
Land capability rating systems of the “limitations table” type are used as follows:
• Select the table for the use or activity of interest
• For each map unit construct a table with a diagnostic criteria from the rating table listed down the left side and the five capability classes along the top to form five columns
• For each map unit note the value for each diagnostic criterion in the unit description, and place a tick in the column under the capability class whose class limits encompass the value. The completed table is referred to as the capability analysis table.
• Construct a summary table by listing the map units down the left side and the land utilization types across the top. For each map unit, note the class of the most severely limiting diagnostic criterion and write it in the appropriate column with the symbol for that diagnostic criterion as a subscript (symbols are set out in Section 15.4). If desired, all of the most limiting criteria (the sub-classes) may be included.
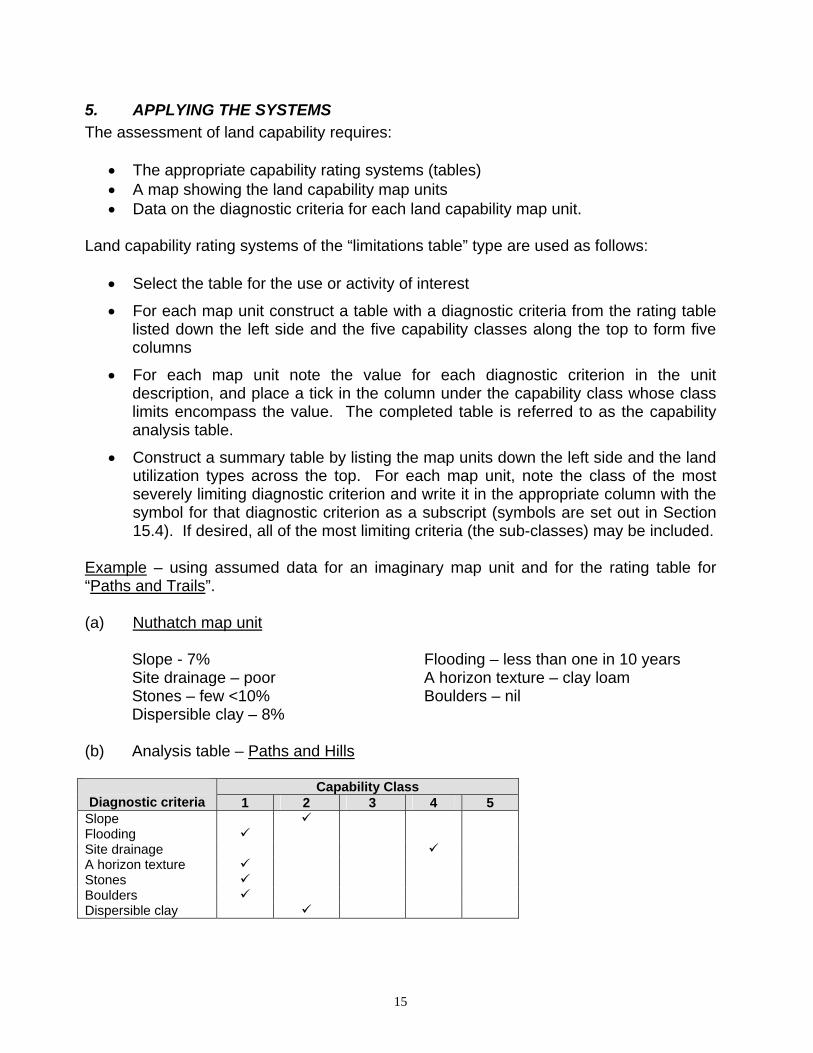
Example – using assumed data for an imaginary map unit and for the rating table for “Paths and Trails”. (a) Nuthatch map unit Slope - 7% Flooding – less than one in 10 years Site drainage – poor A horizon texture – clay loam Stones – few <10% Boulders – nil Dispersible clay – 8% (b) Analysis table – Paths and Hills
Capability Class Diagnostic criteria 1 2 3 4 5
Slope Flooding Site drainage A horizon texture Stones Boulders Dispersible clay
15
16
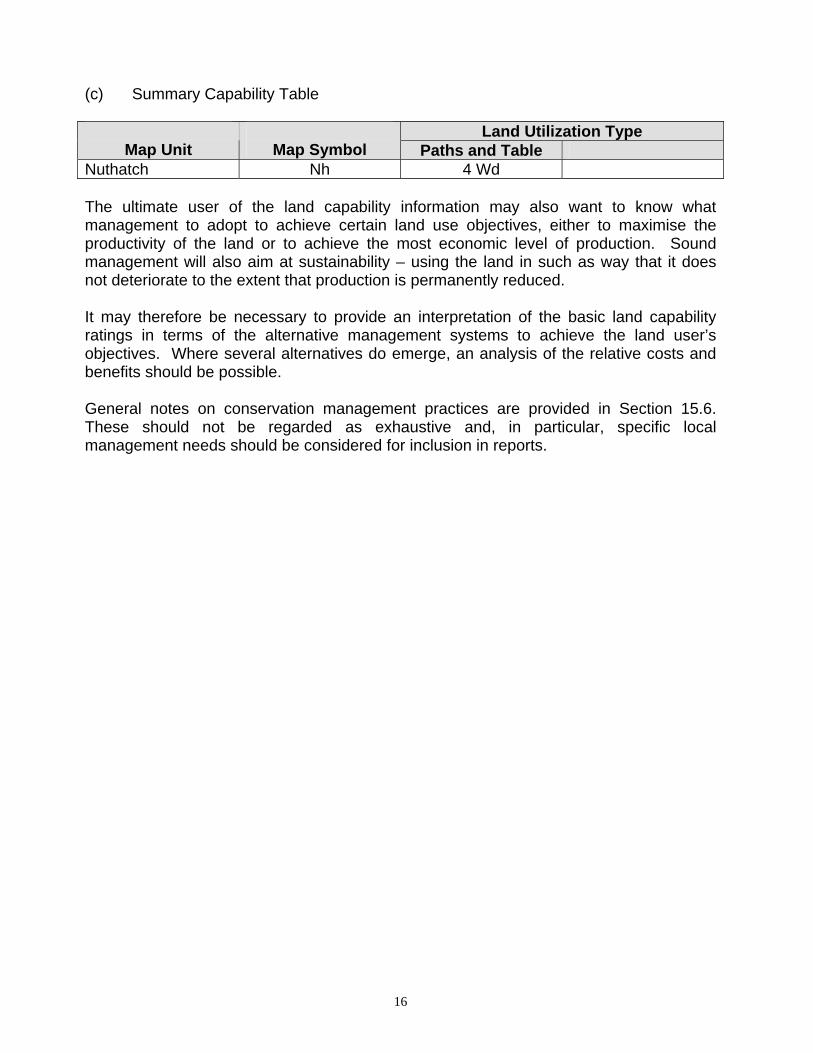
(c) Summary Capability Table
Land Utilization Type Map Unit
Map Symbol Paths and Table
Nuthatch Nh 4 Wd The ultimate user of the land capability information may also want to know what management to adopt to achieve certain land use objectives, either to maximise the productivity of the land or to achieve the most economic level of production. Sound management will also aim at sustainability – using the land in such as way that it does not deteriorate to the extent that production is permanently reduced. It may therefore be necessary to provide an interpretation of the basic land capability ratings in terms of the alternative management systems to achieve the land user’s objectives. Where several alternatives do emerge, an analysis of the relative costs and benefits should be possible. General notes on conservation management practices are provided in Section 15.6. These should not be regarded as exhaustive and, in particular, specific local management needs should be considered for inclusion in reports.
PART II THE LAND CAPABILITY RATING SYSTEMS
17

6. LAND CAPABILITY RATING SYSTEMS FOR ENGINEERING USES LAND CAPABILITY RATING FOR BUILDING FOUNDATIONS Areas capable of being used for the construction of structures with one or two stores. It is assumed that commonly used earth moving equipment is available. The table considers factors which affect both construction and the capability of the immediate site for activities closely related to dwellings. Effluent disposal, ease of servicing and access are considered separately.
CAPABIITY CLASS LAND FEATURES
AFFECTING USE
TYPE OF CONSTRUCTION 1 2 3 4 5
• Stumps or strip footings
Less than 5% 5% to 8% 8% to 15% 15% to 35% More than 35%
• Concrete slab Less than 2% 2% to 5% 5% to 10% 10% to 25% More than 25%
SLOPE (1)
• Piles Less than 5% 5% to 10% 10% to 25% 25% to 45% More than 45% FLOODING None - - Less than once in
100 years More than once in 100
years SITE DRAINAGE Excessively well
drained, well drained Moderately well
drained Imperfectly
drained Poorly drained Very poorly drained
DEPTH TO SEASONAL WATERTABLE
Deeper than 120 cm 120 cm to 80 cm 80 cm to 50 cm 50 cm to 30 cm Shallower than 30 cm
DEPTH TO HARD ROCK (2)
More than 120 cm 120 cm to 80 cm 80 cm to 30 cm Less than 30 cm -
• Stumps or strip footings or piles
Less than 10% 10% to 15% 15% to 30% More than 30% - STONES
• Concrete slab Less than 10% 10% to 20% 20% to 40% More than 40% - • Stumps, strips Less than 0.1% 0.1% to 0.5% 0.5% to 5% More than 5% - BOULDERS AND
ROCK OUTCROP (3)
• Concrete slab Less than 0.2% 0.2% to 1% 1% to 10% More than 10% -
• Stumps or strip footings or piles
SW, SW, GP, GM, GC, SC
SP, SM, CL MH, CH OL, OH, ML Pt UNIFIED SOIL GROUP (4)
• Concrete slab GE, SW, GP, GM, SP, SM, GC
CL, CH, MH ML, OL OH Pt
• Stumps or strip footings or piles
Less than 4% 4% to 12% 12% to 20% More than 20% - SHRINK-SWELL POTENTIAL (5)
• Concrete slab Less than 12% 12% to 20% More than 20% - -
Notes: (1) SLOPE: Downgrade by one class in slope failure hazard areas (2) DEPTH TO HARD ROCK: Material which cannot be excavated by normal earthmoving equipment (3) BOULDERS & ROCK OUTCROP: 0.1% to 1 m2 per 1000 m2
0.5% is 1 m2 per 200 m2 5% is 1 m2 per 20 m2 (4) UNIFIED SOIL GROUP: This is determined for material at the sides and base of excavation. Topsoil is ignored. (5) SHRINK-SWELL POTENTIAL: Comments as for Unified Soil Group.
18
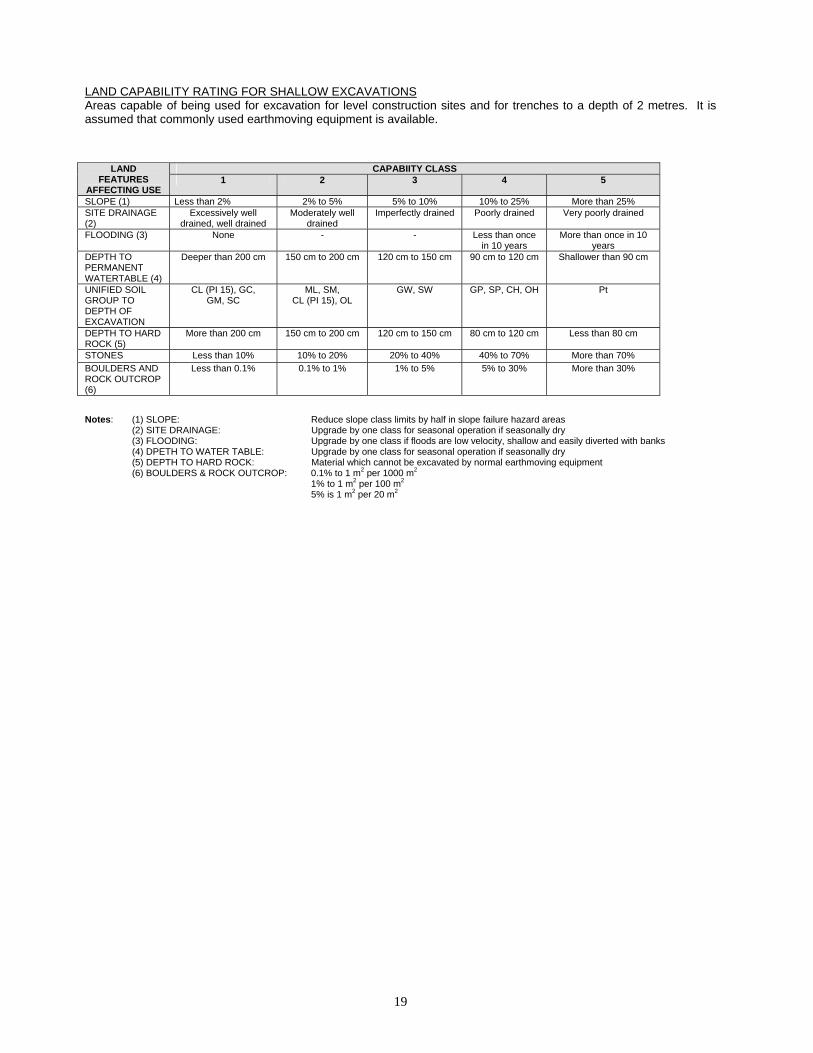
LAND CAPABILITY RATING FOR SHALLOW EXCAVATIONS Areas capable of being used for excavation for level construction sites and for trenches to a depth of 2 metres. It is assumed that commonly used earthmoving equipment is available.
CAPABIITY CLASS LAND FEATURES
AFFECTING USE 1 2 3 4 5
SLOPE (1) Less than 2% 2% to 5% 5% to 10% 10% to 25% More than 25% SITE DRAINAGE (2)
Excessively well drained, well drained
Moderately well drained
Imperfectly drained Poorly drained Very poorly drained
FLOODING (3) None - - Less than once in 10 years
More than once in 10 years
DEPTH TO PERMANENT WATERTABLE (4)
Deeper than 200 cm 150 cm to 200 cm 120 cm to 150 cm 90 cm to 120 cm Shallower than 90 cm
UNIFIED SOIL GROUP TO DEPTH OF EXCAVATION
CL (PI 15), GC, GM, SC
ML, SM, CL (PI 15), OL
GW, SW GP, SP, CH, OH Pt
DEPTH TO HARD ROCK (5)
More than 200 cm 150 cm to 200 cm 120 cm to 150 cm 80 cm to 120 cm Less than 80 cm
STONES Less than 10% 10% to 20% 20% to 40% 40% to 70% More than 70% BOULDERS AND ROCK OUTCROP (6)
Less than 0.1% 0.1% to 1% 1% to 5% 5% to 30% More than 30%
Notes: (1) SLOPE: Reduce slope class limits by half in slope failure hazard areas (2) SITE DRAINAGE: Upgrade by one class for seasonal operation if seasonally dry (3) FLOODING: Upgrade by one class if floods are low velocity, shallow and easily diverted with banks (4) DPETH TO WATER TABLE: Upgrade by one class for seasonal operation if seasonally dry (5) DEPTH TO HARD ROCK: Material which cannot be excavated by normal earthmoving equipment (6) BOULDERS & ROCK OUTCROP: 0.1% to 1 m2 per 1000 m2 1% to 1 m2 per 100 m2
5% is 1 m2 per 20 m2
19

LAND CAPABILITY RATING FOR SECONDARY ROADS AND CAR PARKS Areas capable of being used for the construction of roads with sealed surfaces for light vehicles and with drainage and kerbing. It is assumed that commonly used earthmoving equipment is available.
CAPABIITY CLASS LAND FEATURES
AFFECTING USE 1 2 3 4 5
SLOPE (1) Secondary Roads Less than 4% 4% to 8% 8% to 12% 12% to 25% More than 25% Car Parks Less than 3% 3% to 5% 5% to 8% 8% to 15% More than 15% SITE DRAINAGE (2)
Excessively well drained, well drained
Moderately well drained
Imperfectly drained Poorly drained Very poorly drained
FLOODING (3) None - - Less than once in 10 years
More than once in 10 years
DEPTH TO SEASONAL WATERTABLE
More than 150 cm 150 cm to 90 cm 90 cm to 60 cm 60 cm to 30 cm Less than 30 cm
UNIFIED SOIL GROUP FOR SUB-GRADE (4)
GP, GW, SW, GC SM, SC, GM SP, CL, CH, MH, ML
OL, OH Pt
DEPTH TO HARD ROCK (5)
More than 100 cm 100 cm to 75 cm 75 cm to 40 cm 40 cm to 15 cm Less than 15 cm
STONES Less than 10% 10% to 20% 20% to 40% 40% to 70% More than 70% BOULDERS AND ROCK OUTCROP (6)
Less than 0.1% 0.1% to 0.5% 0.5% to 5% 5% to 30% More than 30%
SHRINK-SWELL POTENTIAL (7)
Less than 4% 4% to 12% 12% to 20% More than 20% -
Notes: (1) SLOPE: Reduce slope class limits by half in slope failure hazard areas (2) SITE DRAINAGE: Upgrade by one class if construction is carried out when conditions are dry (3) FLOODING: Upgrade by one class if floods are low velocity, shallow and easily diverted with banks (4) UNIFIED SOIL GROUP: This is determined for the portion of the profile which will underlie the completed road base (5) HARD ROCK: Material which cannot be ripped and would require blasting (6) BOULDERS AND ROCK OUTCROP: 0.1% is 1 m2 per 1000 m2 0.5% is 1 m 2 per 200 m2 1% is 1 m2 per 100 m2 5% is 1 m2 per 20 m2 (7) SHRINK-SWELL POTENTIAL: Comments as for Unified Soil Group
20

LAND CAPABILITY RATING FOR EARTHEN DAMS Areas capable of being used for the construction of small water storages with earthen embankments (1)
CAPABIITY CLASS LAND FEATURES
AFFECTING USE 1 2 3 4 5
SLOPE (2) Gully Dam 2% to 4% 4% to 8% 0-2% to 8-12% 12% to 15% More than 15% Hillside Tank 2% to 5% 5% to 10% 0-2% to 10-15% 15% to 20% More than 20% FLOODING (3) None - - Less than once
in 25 years More than once in 25
years UNIFIED SOIL GROUP (4)
GC, GM, SC SM CL (PI<15) CL (PI<15), ML, OH
OL, MH, OH SP, SW, GP, GW, Pt
THICKNESS OF CONSTRUCTION MATERIAL
More than 200 cm 200 cm to 100 cm 100 cm to 75 cm 75 cm to 30 cm Less than 30 cm
STONES Less than 5% 5% to 20% 20% to 50% 50% to 75% More than 75% BOULDERS AND ROCK OUTCROP (5)
Less than 0.05% 0.05% to 0.1% 0.1% to 1% 1% to 5% More than 5%
PERMEABILITY (6)
Slower than 0.1 l/ m2 day
0.1 to 1 l/m2 day 1 to 5 l/m2 day 5 to 10 l/m2 day Faster than 10 l/m2 day
SHRINK-SWELL POTENTIAL (7)
Less than 4% 4% to 12% 12% to 20% More than 20% -
DEPTH TO HARD ROCK (8)
More than 300 cm 300 cm to 200 cm 200 cm to 150 cm 150 cm to 80 cm Less than 80 cm
DISPERSIBLE CLAY (9)
2% to 6% 6% to 10% 10% to 16% More than 16% or less than 2%
-
DEPTH OF TOPSOIL (10)
10 cm to 25 cm 25 cm to 50 cm 50 cm to 100 cm 0 to 10 cm
100 cm to 200 cm
More than 200 cm
Notes: (1) This rating table does not consider catchment conditions, expected yield (2) SLOPE: Reduce slope class limits by half in slope failure hazard areas (3) FLOODING: Upgrade by one class if floods are low velocity, shallow and easily diverted with banks (4) UNIFIED SOIL GROUP: Determined for material to be used for bank construction (5) BOULDERS & ROCK OUTCROP: 0.05% is 1 m2 per 2000 m2 0.1% is 1 m2 per 1000 m2 1% is 1 m2 per 100 m2 5% is 1 m2 per 20 m2 (6) PERMEABILITY: This test is carried out in material at the expected depth of the base of the excavation. A rate of 10 l/m2 is approximately 0.5 cm drop n head per hour in a 10 cm diameter test hole after thorough wetting (7) SHRINK-SWELL POTENTIAL: Determined for material to be used for bank construction (8) DEPTH TO HARD ROCK: Material which cannot be ripped and would require blasting (9) DISPERSIBLE CLAY: Determined for material to be used for bank construction (10) DEPTH OF TOPSOIL: Material to be stockpiled for re-spreading.
21

7. LAND CAPABILITY RATING SYSTEMS FOR SEPTIC WASTE DISPOSAL
22
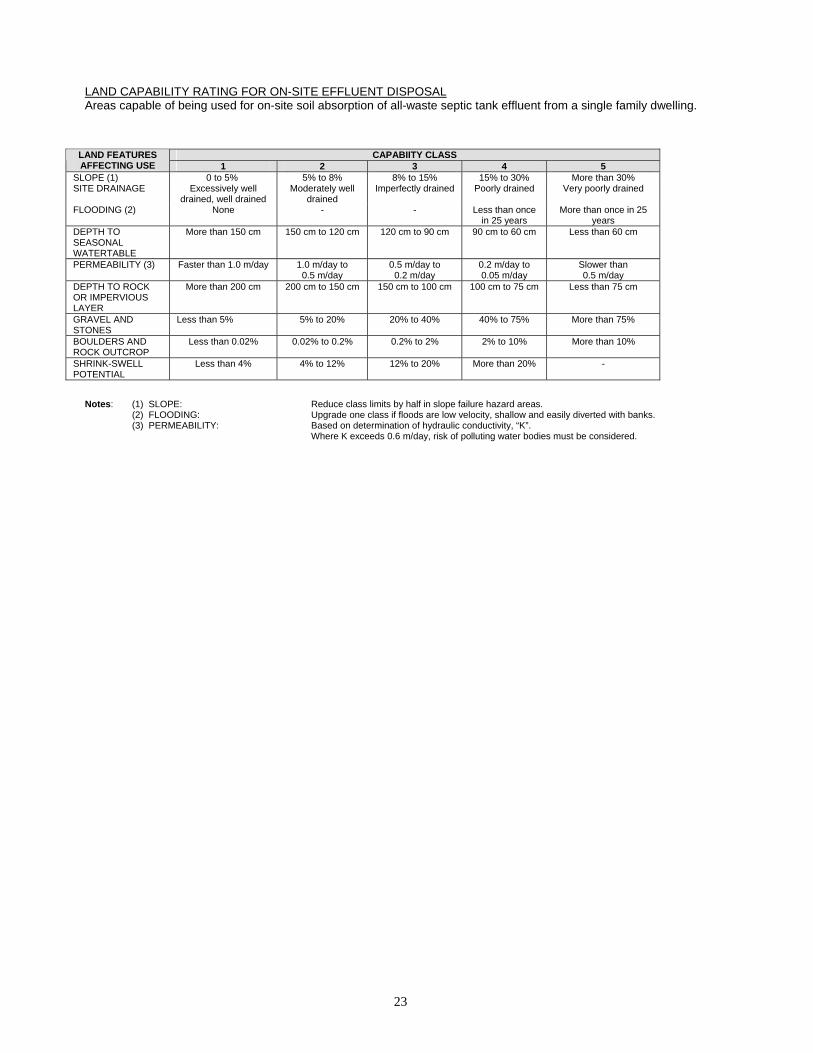
LAND CAPABILITY RATING FOR ON-SITE EFFLUENT DISPOSAL Areas capable of being used for on-site soil absorption of all-waste septic tank effluent from a single family dwelling.
CAPABIITY CLASS LAND FEATURES AFFECTING USE 1 2 3 4 5
SLOPE (1) 0 to 5% 5% to 8% 8% to 15% 15% to 30% More than 30% SITE DRAINAGE Excessively well
drained, well drained Moderately well
drained Imperfectly drained Poorly drained Very poorly drained
FLOODING (2) None - - Less than once in 25 years
More than once in 25 years
DEPTH TO SEASONAL WATERTABLE
More than 150 cm 150 cm to 120 cm 120 cm to 90 cm 90 cm to 60 cm Less than 60 cm
PERMEABILITY (3) Faster than 1.0 m/day 1.0 m/day to 0.5 m/day
0.5 m/day to 0.2 m/day
0.2 m/day to 0.05 m/day
Slower than 0.5 m/day
DEPTH TO ROCK OR IMPERVIOUS LAYER
More than 200 cm 200 cm to 150 cm 150 cm to 100 cm 100 cm to 75 cm Less than 75 cm
GRAVEL AND STONES
Less than 5% 5% to 20% 20% to 40% 40% to 75% More than 75%
BOULDERS AND ROCK OUTCROP
Less than 0.02% 0.02% to 0.2% 0.2% to 2% 2% to 10% More than 10%
SHRINK-SWELL POTENTIAL
Less than 4% 4% to 12% 12% to 20% More than 20% -
Notes: (1) SLOPE: Reduce class limits by half in slope failure hazard areas. (2) FLOODING: Upgrade one class if floods are low velocity, shallow and easily diverted with banks. (3) PERMEABILITY: Based on determination of hydraulic conductivity, “K”. Where K exceeds 0.6 m/day, risk of polluting water bodies must be considered.
23
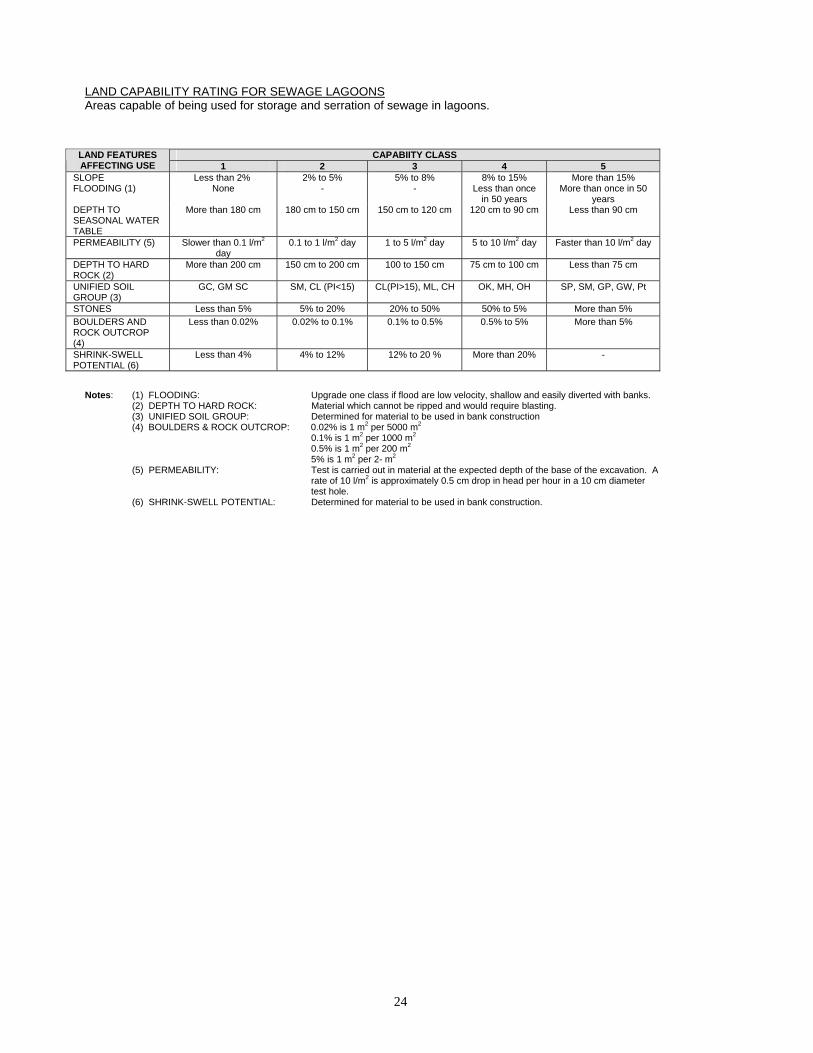
LAND CAPABILITY RATING FOR SEWAGE LAGOONS Areas capable of being used for storage and serration of sewage in lagoons.
CAPABIITY CLASS LAND FEATURES AFFECTING USE 1 2 3 4 5
SLOPE Less than 2% 2% to 5% 5% to 8% 8% to 15% More than 15% FLOODING (1) None - - Less than once
in 50 years More than once in 50
years DEPTH TO SEASONAL WATER TABLE
More than 180 cm 180 cm to 150 cm 150 cm to 120 cm 120 cm to 90 cm Less than 90 cm
PERMEABILITY (5) Slower than 0.1 l/m2 day
0.1 to 1 l/m2 day 1 to 5 l/m2 day 5 to 10 l/m2 day Faster than 10 l/m2 day
DEPTH TO HARD ROCK (2)
More than 200 cm 150 cm to 200 cm 100 to 150 cm 75 cm to 100 cm Less than 75 cm
UNIFIED SOIL GROUP (3)
GC, GM SC SM, CL (PI<15) CL(PI>15), ML, CH OK, MH, OH SP, SM, GP, GW, Pt
STONES Less than 5% 5% to 20% 20% to 50% 50% to 5% More than 5% BOULDERS AND ROCK OUTCROP (4)
Less than 0.02% 0.02% to 0.1% 0.1% to 0.5% 0.5% to 5% More than 5%
SHRINK-SWELL POTENTIAL (6)
Less than 4% 4% to 12% 12% to 20 % More than 20% -
Notes: (1) FLOODING: Upgrade one class if flood are low velocity, shallow and easily diverted with banks. (2) DEPTH TO HARD ROCK: Material which cannot be ripped and would require blasting. (3) UNIFIED SOIL GROUP: Determined for material to be used in bank construction (4) BOULDERS & ROCK OUTCROP: 0.02% is 1 m2 per 5000 m2 0.1% is 1 m2 per 1000 m2 0.5% is 1 m2 per 200 m2 5% is 1 m2 per 2- m2
(5) PERMEABILITY: Test is carried out in material at the expected depth of the base of the excavation. A rate of 10 l/m2 is approximately 0.5 cm drop in head per hour in a 10 cm diameter test hole. (6) SHRINK-SWELL POTENTIAL: Determined for material to be used in bank construction.
24
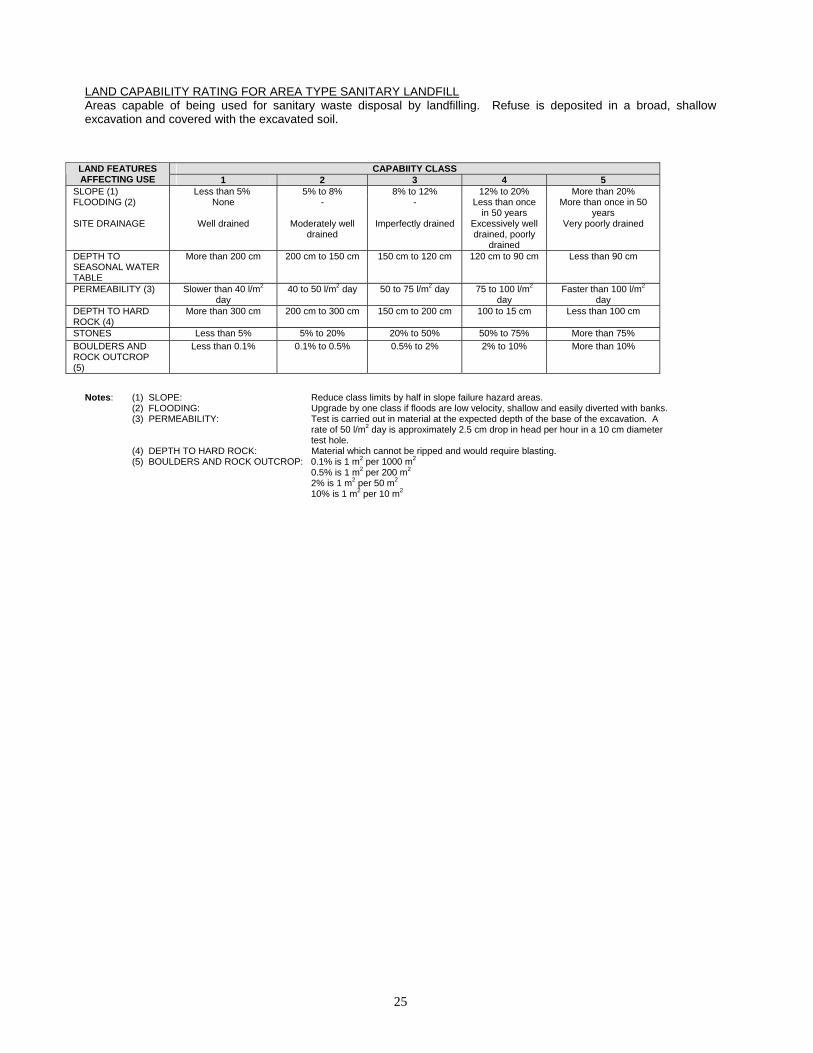
LAND CAPABILITY RATING FOR AREA TYPE SANITARY LANDFILL Areas capable of being used for sanitary waste disposal by landfilling. Refuse is deposited in a broad, shallow excavation and covered with the excavated soil.
CAPABIITY CLASS LAND FEATURES AFFECTING USE 1 2 3 4 5
SLOPE (1) Less than 5% 5% to 8% 8% to 12% 12% to 20% More than 20% FLOODING (2) None - - Less than once
in 50 years More than once in 50
years SITE DRAINAGE Well drained Moderately well
drained Imperfectly drained Excessively well
drained, poorly drained
Very poorly drained
DEPTH TO SEASONAL WATER TABLE
More than 200 cm 200 cm to 150 cm 150 cm to 120 cm 120 cm to 90 cm Less than 90 cm
PERMEABILITY (3) Slower than 40 l/m2 day
40 to 50 l/m2 day 50 to 75 l/m2 day 75 to 100 l/m2 day
Faster than 100 l/m2 day
DEPTH TO HARD ROCK (4)
More than 300 cm 200 cm to 300 cm 150 cm to 200 cm 100 to 15 cm Less than 100 cm
STONES Less than 5% 5% to 20% 20% to 50% 50% to 75% More than 75% BOULDERS AND ROCK OUTCROP (5)
Less than 0.1% 0.1% to 0.5% 0.5% to 2% 2% to 10% More than 10%
Notes: (1) SLOPE: Reduce class limits by half in slope failure hazard areas. (2) FLOODING: Upgrade by one class if floods are low velocity, shallow and easily diverted with banks. (3) PERMEABILITY: Test is carried out in material at the expected depth of the base of the excavation. A rate of 50 l/m2 day is approximately 2.5 cm drop in head per hour in a 10 cm diameter test hole. (4) DEPTH TO HARD ROCK: Material which cannot be ripped and would require blasting. (5) BOULDERS AND ROCK OUTCROP: 0.1% is 1 m2 per 1000 m2 0.5% is 1 m2 per 200 m2 2% is 1 m2 per 50 m2 10% is 1 m2 per 10 m2
25

8. LAND CAPABILITY RATING SYTEMS FOR EARTH RESOURCES
26
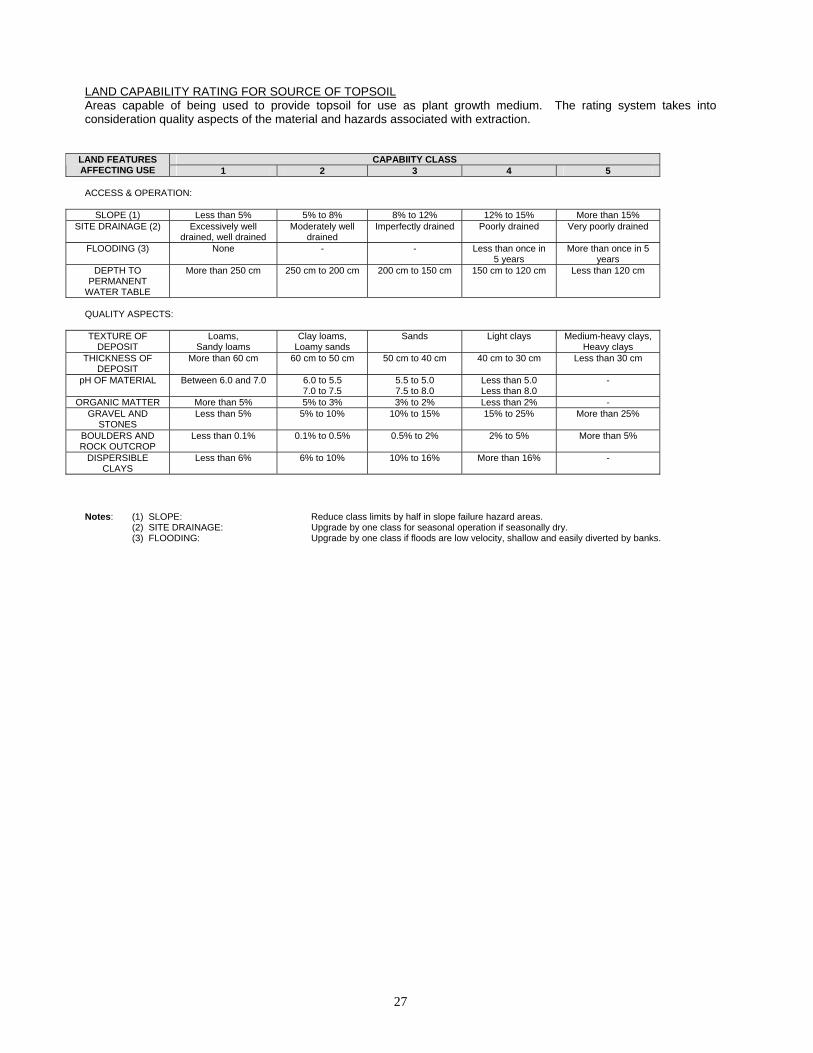
LAND CAPABILITY RATING FOR SOURCE OF TOPSOIL Areas capable of being used to provide topsoil for use as plant growth medium. The rating system takes into consideration quality aspects of the material and hazards associated with extraction.
CAPABIITY CLASS LAND FEATURES AFFECTING USE 1 2 3 4 5 ACCESS & OPERATION:
SLOPE (1) Less than 5% 5% to 8% 8% to 12% 12% to 15% More than 15% SITE DRAINAGE (2) Excessively well
drained, well drained Moderately well
drained Imperfectly drained Poorly drained Very poorly drained
FLOODING (3) None - - Less than once in 5 years
More than once in 5 years
DEPTH TO PERMANENT
WATER TABLE
More than 250 cm 250 cm to 200 cm 200 cm to 150 cm 150 cm to 120 cm Less than 120 cm
QUALITY ASPECTS: TEXTURE OF
DEPOSIT Loams,
Sandy loams Clay loams,
Loamy sands Sands Light clays Medium-heavy clays,
Heavy clays THICKNESS OF
DEPOSIT More than 60 cm 60 cm to 50 cm 50 cm to 40 cm 40 cm to 30 cm Less than 30 cm
pH OF MATERIAL Between 6.0 and 7.0 6.0 to 5.5 7.0 to 7.5
5.5 to 5.0 7.5 to 8.0
Less than 5.0 Less than 8.0
-
ORGANIC MATTER More than 5% 5% to 3% 3% to 2% Less than 2% - GRAVEL AND
STONES Less than 5% 5% to 10% 10% to 15% 15% to 25% More than 25%
BOULDERS AND ROCK OUTCROP
Less than 0.1% 0.1% to 0.5% 0.5% to 2% 2% to 5% More than 5%
DISPERSIBLE CLAYS
Less than 6% 6% to 10% 10% to 16% More than 16% -
Notes: (1) SLOPE: Reduce class limits by half in slope failure hazard areas. (2) SITE DRAINAGE: Upgrade by one class for seasonal operation if seasonally dry. (3) FLOODING: Upgrade by one class if floods are low velocity, shallow and easily diverted by banks.
27

LAND CAPABILITY RATING FOR SOURCES OF SAND Areas capable of being used to provide sand (particles 0.2 mm to 2 mm). The rating system takes into consideration quality aspects of the material and hazards associated with extraction.
CAPABIITY CLASS LAND FEATURES AFFECTING USE 1 2 3 4 5 ACCESS & OPERATION:
SLOPE (1) Less than 5% 5% to 8% 8% to 12% 12% to 15% More than 15% SITE DRAINAGE (2) Excessively well
drained, well drained Moderately well
drained Imperfectly drained Poorly drained Very poorly drained
FLOODING (3) None - - Less than once in 5 years
More than once in 5 years
DEPTH TO PERMANENT
WATER TABLE
More than 250 cm 250 cm to 200 cm 200 cm to 150 cm 150 cm to 120 cm Less than 120 cm
QUALITY ASPECTS: UNIFIED SOIL
GROUP SW SP SM - All other groups in
Unified System THICKNESS OF
DEPOSIT More than 200 cm 200 cm to 150 cm 150 cm to 90 cm 90 cm to 60 cm Less than 60 cm
THICKNESS OF OVERBURDEN
Less than 2% of deposit thickness, D
2% to 5% of D 5% to 10% of D 10% to 20% of D More than 20% of D
GRAVEL AND STONES
Less than 5% 5% to 10% 10% to 15% 15% to 25% More than 25%
BOULDERS AND ROCK OUTCROP
Less than 0.1% 0.1% to 0.5% 0.5% to 2% 2% to 5% More than 5%
ORGANIC MATTER Less than 1% 1% to 2% 2% to 10% More than 10% DISPERSIBLE
CLAYS Less than 6% 6% to 10% 10% to 16% More than 16% -
Notes: (1) SLOPE: Reduce class limits by half in slope failure hazard areas. (2) SITE DRAINAGE: Upgrade by one class for seasonal operation if seasonally dry. (3) FLOODING: Upgrade by one class if floods are low velocity, shallow and easily diverted by banks.
28
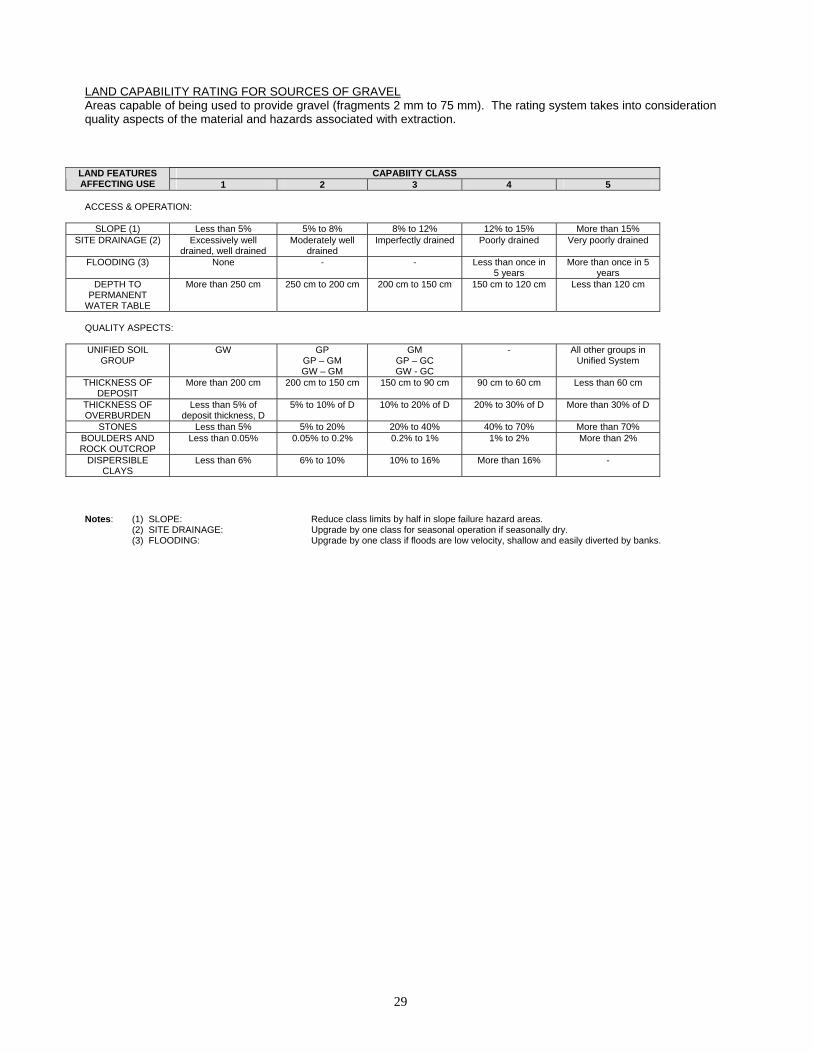
LAND CAPABILITY RATING FOR SOURCES OF GRAVEL Areas capable of being used to provide gravel (fragments 2 mm to 75 mm). The rating system takes into consideration quality aspects of the material and hazards associated with extraction.
CAPABIITY CLASS LAND FEATURES AFFECTING USE 1 2 3 4 5 ACCESS & OPERATION:
SLOPE (1) Less than 5% 5% to 8% 8% to 12% 12% to 15% More than 15% SITE DRAINAGE (2) Excessively well
drained, well drained Moderately well
drained Imperfectly drained Poorly drained Very poorly drained
FLOODING (3) None - - Less than once in 5 years
More than once in 5 years
DEPTH TO PERMANENT
WATER TABLE
More than 250 cm 250 cm to 200 cm 200 cm to 150 cm 150 cm to 120 cm Less than 120 cm
QUALITY ASPECTS: UNIFIED SOIL
GROUP GW GP
GP – GM GW – GM
GM GP – GC GW - GC
- All other groups in Unified System
THICKNESS OF DEPOSIT
More than 200 cm 200 cm to 150 cm 150 cm to 90 cm 90 cm to 60 cm Less than 60 cm
THICKNESS OF OVERBURDEN
Less than 5% of deposit thickness, D
5% to 10% of D 10% to 20% of D 20% to 30% of D More than 30% of D
STONES Less than 5% 5% to 20% 20% to 40% 40% to 70% More than 70% BOULDERS AND ROCK OUTCROP
Less than 0.05% 0.05% to 0.2% 0.2% to 1% 1% to 2% More than 2%
DISPERSIBLE CLAYS
Less than 6% 6% to 10% 10% to 16% More than 16% -
Notes: (1) SLOPE: Reduce class limits by half in slope failure hazard areas. (2) SITE DRAINAGE: Upgrade by one class for seasonal operation if seasonally dry. (3) FLOODING: Upgrade by one class if floods are low velocity, shallow and easily diverted by banks.
29
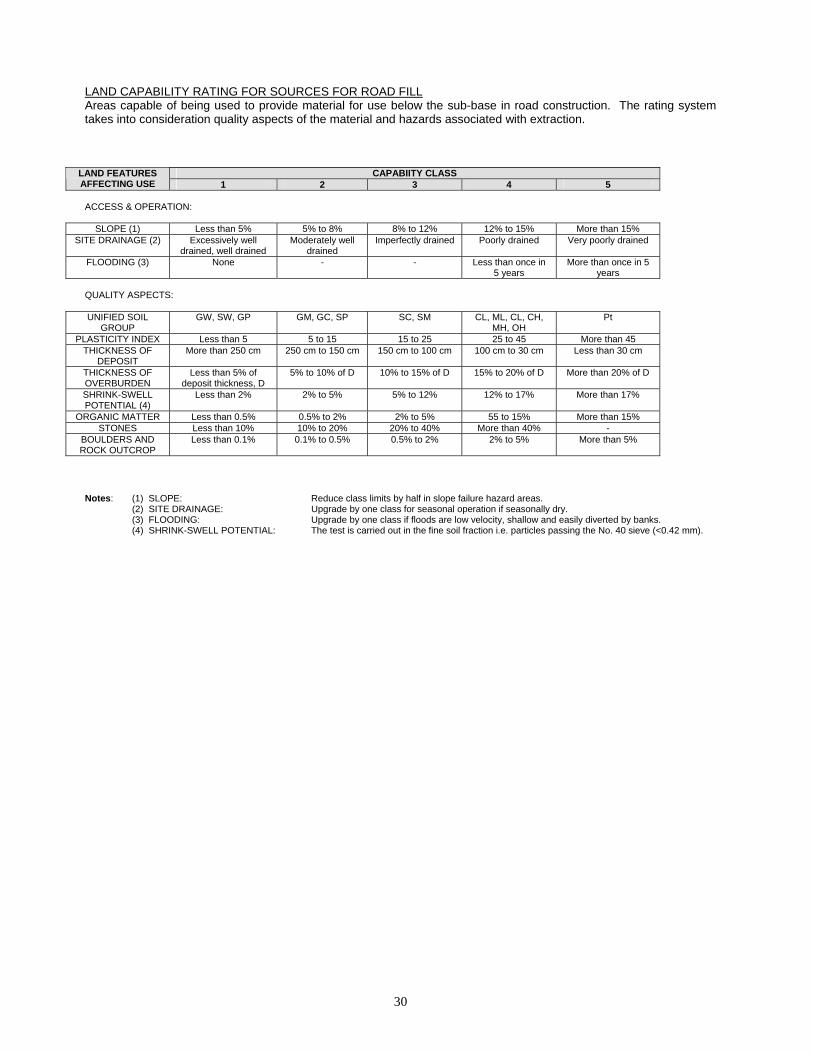
LAND CAPABILITY RATING FOR SOURCES FOR ROAD FILL Areas capable of being used to provide material for use below the sub-base in road construction. The rating system takes into consideration quality aspects of the material and hazards associated with extraction.
CAPABIITY CLASS LAND FEATURES AFFECTING USE 1 2 3 4 5 ACCESS & OPERATION:
SLOPE (1) Less than 5% 5% to 8% 8% to 12% 12% to 15% More than 15% SITE DRAINAGE (2) Excessively well
drained, well drained Moderately well
drained Imperfectly drained Poorly drained Very poorly drained
FLOODING (3) None - - Less than once in 5 years
More than once in 5 years
QUALITY ASPECTS: UNIFIED SOIL
GROUP GW, SW, GP GM, GC, SP SC, SM CL, ML, CL, CH,
MH, OH Pt
PLASTICITY INDEX Less than 5 5 to 15 15 to 25 25 to 45 More than 45 THICKNESS OF
DEPOSIT More than 250 cm 250 cm to 150 cm 150 cm to 100 cm 100 cm to 30 cm Less than 30 cm
THICKNESS OF OVERBURDEN
Less than 5% of deposit thickness, D
5% to 10% of D 10% to 15% of D 15% to 20% of D More than 20% of D
SHRINK-SWELL POTENTIAL (4)
Less than 2% 2% to 5% 5% to 12% 12% to 17% More than 17%
ORGANIC MATTER Less than 0.5% 0.5% to 2% 2% to 5% 55 to 15% More than 15% STONES Less than 10% 10% to 20% 20% to 40% More than 40% -
BOULDERS AND ROCK OUTCROP
Less than 0.1% 0.1% to 0.5% 0.5% to 2% 2% to 5% More than 5%
Notes: (1) SLOPE: Reduce class limits by half in slope failure hazard areas. (2) SITE DRAINAGE: Upgrade by one class for seasonal operation if seasonally dry. (3) FLOODING: Upgrade by one class if floods are low velocity, shallow and easily diverted by banks. (4) SHRINK-SWELL POTENTIAL: The test is carried out in the fine soil fraction i.e. particles passing the No. 40 sieve (<0.42 mm).
30
9. LAND CAPABILITY RATING SYTEMS FOR LAND-BASED RECREATION
31
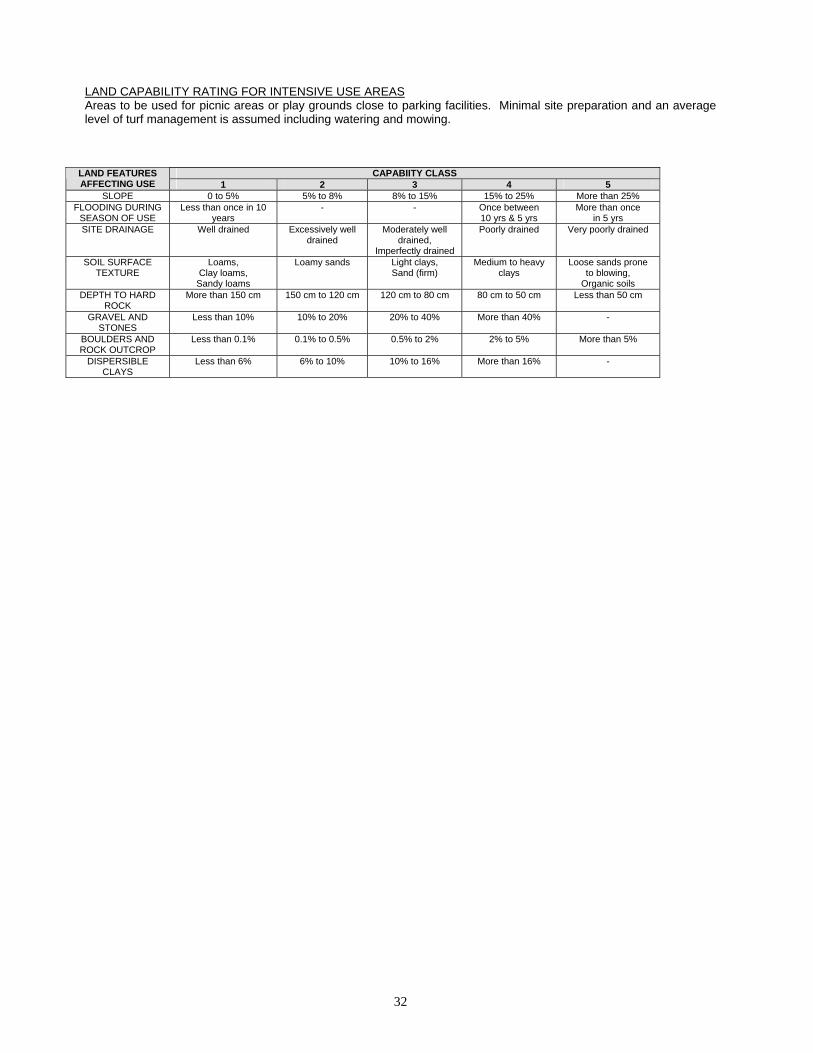
LAND CAPABILITY RATING FOR INTENSIVE USE AREAS Areas to be used for picnic areas or play grounds close to parking facilities. Minimal site preparation and an average level of turf management is assumed including watering and mowing.
CAPABIITY CLASS LAND FEATURES AFFECTING USE 1 2 3 4 5
SLOPE 0 to 5% 5% to 8% 8% to 15% 15% to 25% More than 25% FLOODING DURING
SEASON OF USE Less than once in 10
years - - Once between
10 yrs & 5 yrs More than once
in 5 yrs SITE DRAINAGE Well drained Excessively well
drained Moderately well
drained, Imperfectly drained
Poorly drained Very poorly drained
SOIL SURFACE TEXTURE
Loams, Clay loams,
Sandy loams
Loamy sands Light clays, Sand (firm)
Medium to heavy clays
Loose sands prone to blowing,
Organic soils DEPTH TO HARD
ROCK More than 150 cm 150 cm to 120 cm 120 cm to 80 cm 80 cm to 50 cm Less than 50 cm
GRAVEL AND STONES
Less than 10% 10% to 20% 20% to 40% More than 40% -
BOULDERS AND ROCK OUTCROP
Less than 0.1% 0.1% to 0.5% 0.5% to 2% 2% to 5% More than 5%
DISPERSIBLE CLAYS
Less than 6% 6% to 10% 10% to 16% More than 16% -
32
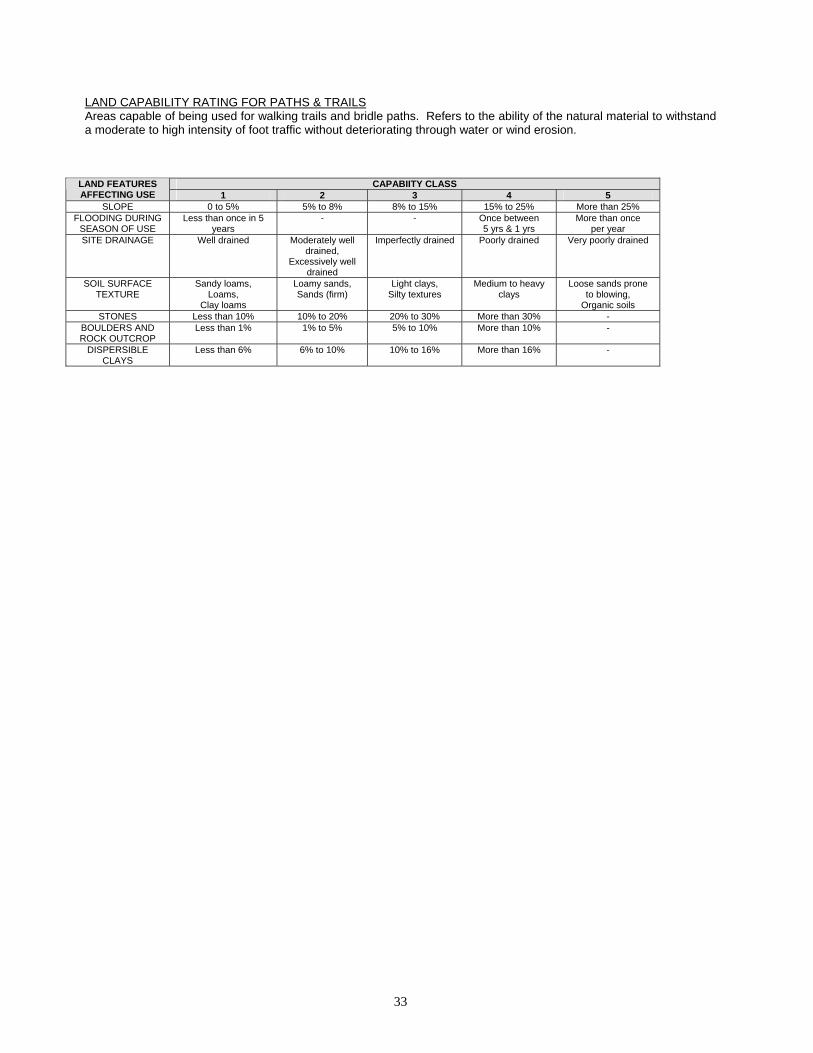
LAND CAPABILITY RATING FOR PATHS & TRAILS Areas capable of being used for walking trails and bridle paths. Refers to the ability of the natural material to withstand a moderate to high intensity of foot traffic without deteriorating through water or wind erosion.
CAPABIITY CLASS LAND FEATURES AFFECTING USE 1 2 3 4 5
SLOPE 0 to 5% 5% to 8% 8% to 15% 15% to 25% More than 25% FLOODING DURING
SEASON OF USE Less than once in 5
years - - Once between
5 yrs & 1 yrs More than once
per year SITE DRAINAGE Well drained Moderately well
drained, Excessively well
drained
Imperfectly drained Poorly drained Very poorly drained
SOIL SURFACE TEXTURE
Sandy loams, Loams,
Clay loams
Loamy sands, Sands (firm)
Light clays, Silty textures
Medium to heavy clays
Loose sands prone to blowing,
Organic soils STONES Less than 10% 10% to 20% 20% to 30% More than 30% -
BOULDERS AND ROCK OUTCROP
Less than 1% 1% to 5% 5% to 10% More than 10% -
DISPERSIBLE CLAYS
Less than 6% 6% to 10% 10% to 16% More than 16% -
33
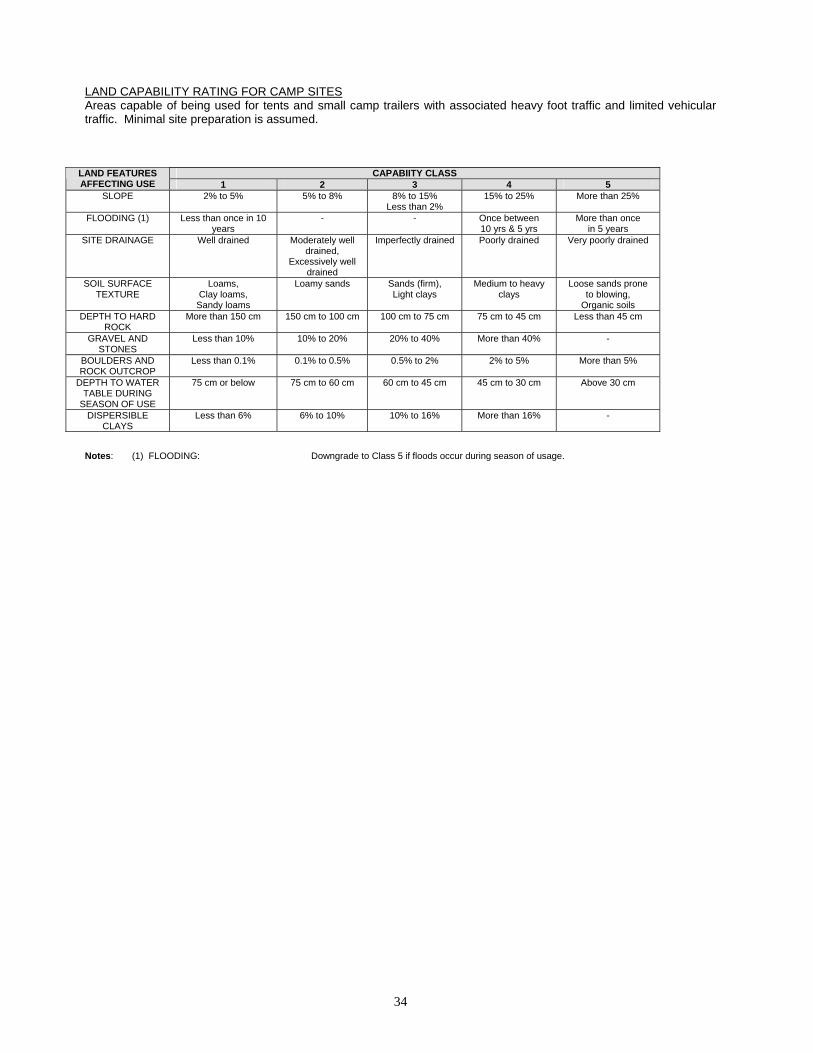
LAND CAPABILITY RATING FOR CAMP SITES Areas capable of being used for tents and small camp trailers with associated heavy foot traffic and limited vehicular traffic. Minimal site preparation is assumed.
CAPABIITY CLASS LAND FEATURES AFFECTING USE 1 2 3 4 5
SLOPE 2% to 5% 5% to 8% 8% to 15% Less than 2%
15% to 25% More than 25%
FLOODING (1) Less than once in 10 years
- - Once between 10 yrs & 5 yrs
More than once in 5 years
SITE DRAINAGE Well drained Moderately well drained,
Excessively well drained
Imperfectly drained Poorly drained Very poorly drained
SOIL SURFACE TEXTURE
Loams, Clay loams,
Sandy loams
Loamy sands Sands (firm), Light clays
Medium to heavy clays
Loose sands prone to blowing,
Organic soils DEPTH TO HARD
ROCK More than 150 cm 150 cm to 100 cm 100 cm to 75 cm 75 cm to 45 cm Less than 45 cm
GRAVEL AND STONES
Less than 10% 10% to 20% 20% to 40% More than 40% -
BOULDERS AND ROCK OUTCROP
Less than 0.1% 0.1% to 0.5% 0.5% to 2% 2% to 5% More than 5%
DEPTH TO WATER TABLE DURING
SEASON OF USE
75 cm or below 75 cm to 60 cm 60 cm to 45 cm 45 cm to 30 cm Above 30 cm
DISPERSIBLE CLAYS
Less than 6% 6% to 10% 10% to 16% More than 16% -
Notes: (1) FLOODING: Downgrade to Class 5 if floods occur during season of usage.
34
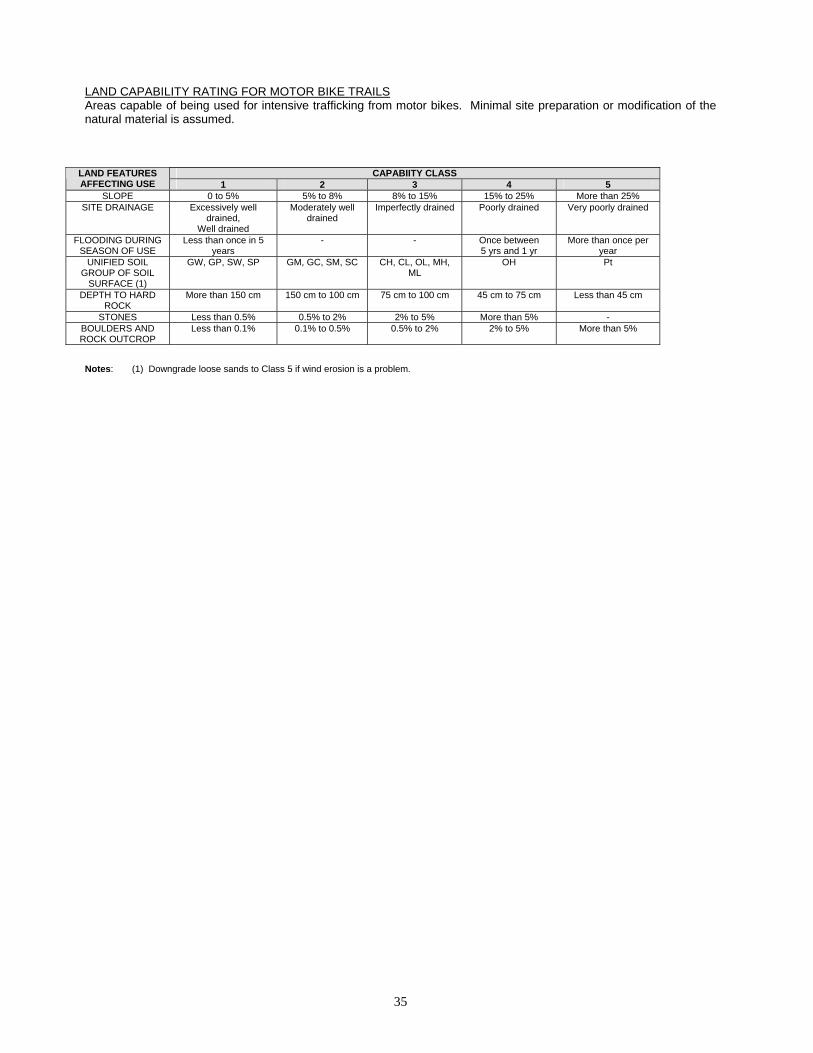
LAND CAPABILITY RATING FOR MOTOR BIKE TRAILS Areas capable of being used for intensive trafficking from motor bikes. Minimal site preparation or modification of the natural material is assumed.
CAPABIITY CLASS LAND FEATURES AFFECTING USE 1 2 3 4 5
SLOPE 0 to 5% 5% to 8% 8% to 15% 15% to 25% More than 25% SITE DRAINAGE Excessively well
drained, Well drained
Moderately well drained
Imperfectly drained Poorly drained Very poorly drained
FLOODING DURING SEASON OF USE
Less than once in 5 years
- - Once between 5 yrs and 1 yr
More than once per year
UNIFIED SOIL GROUP OF SOIL
SURFACE (1)
GW, GP, SW, SP GM, GC, SM, SC CH, CL, OL, MH, ML
OH Pt
DEPTH TO HARD ROCK
More than 150 cm 150 cm to 100 cm 75 cm to 100 cm 45 cm to 75 cm Less than 45 cm
STONES Less than 0.5% 0.5% to 2% 2% to 5% More than 5% - BOULDERS AND ROCK OUTCROP
Less than 0.1% 0.1% to 0.5% 0.5% to 2% 2% to 5% More than 5%
Notes: (1) Downgrade loose sands to Class 5 if wind erosion is a problem.
35
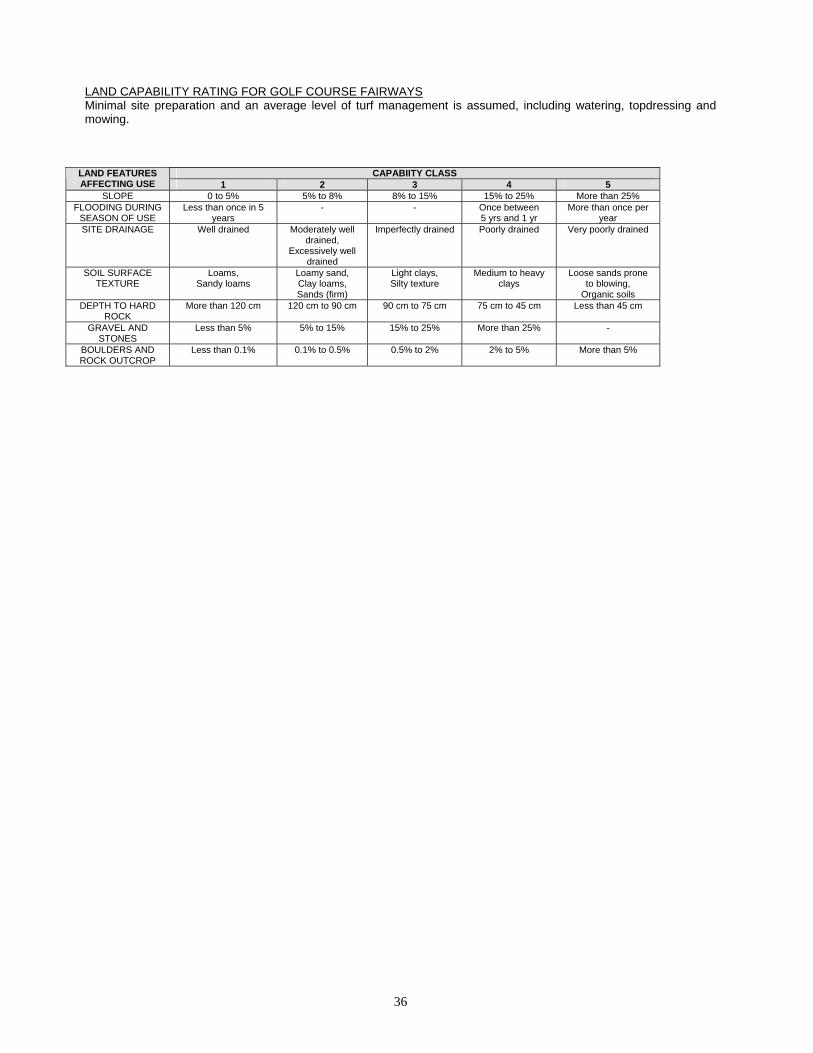
LAND CAPABILITY RATING FOR GOLF COURSE FAIRWAYS Minimal site preparation and an average level of turf management is assumed, including watering, topdressing and mowing.
CAPABIITY CLASS LAND FEATURES AFFECTING USE 1 2 3 4 5
SLOPE 0 to 5% 5% to 8% 8% to 15% 15% to 25% More than 25% FLOODING DURING
SEASON OF USE Less than once in 5
years - - Once between
5 yrs and 1 yr More than once per
year SITE DRAINAGE Well drained Moderately well
drained, Excessively well
drained
Imperfectly drained Poorly drained Very poorly drained
SOIL SURFACE TEXTURE
Loams, Sandy loams
Loamy sand, Clay loams, Sands (firm)
Light clays, Silty texture
Medium to heavy clays
Loose sands prone to blowing,
Organic soils DEPTH TO HARD
ROCK More than 120 cm 120 cm to 90 cm 90 cm to 75 cm 75 cm to 45 cm Less than 45 cm
GRAVEL AND STONES
Less than 5% 5% to 15% 15% to 25% More than 25% -
BOULDERS AND ROCK OUTCROP
Less than 0.1% 0.1% to 0.5% 0.5% to 2% 2% to 5% More than 5%
36

LAND CAPABILITY RATING FOR PLAYING FIELDS Areas capable of being used for the development of ovals and fields for organized sporting events. Minimum site preparation and an average level of turf management is assumed including watering, topdressing and mowing.
CAPABIITY CLASS LAND FEATURES AFFECTING USE 1 2 3 4 5
SLOPE 0 to 2% 2% to 5% 5% to 8% 8% to 15% More than 15% FLOODING DURING
SEASON OF USE Less than once in 10
years - - Once between
10 yrs and 5 yr More than once in 5
years SITE DRAINAGE Well drained Moderately well
drained, Excessively well
drained
Imperfectly drained Poorly drained Very poorly drained
DEPTH TO HARD ROCK
More than 150 cm 150 cm to 120 cm 120 cm to 80 cm 80 cm to 50 cm Less than 50 cm
SOIL SURFACE TEXTURE
Loams, Sandy loams
Clay loams, Sands (firm)
Light clays Medium to heavy clays
Loose sands prone to blowing,
Organic soils BOULDERS AND ROCK OUTCROP
Less than 0.02% 0.02% to 0.1% 0.1% to 1% 1% to 5% More than 5%
SHRINK-SWELL POTENTIAL
Less than 4% 4% to 12% 12% to 20% More than 20% -
37
10. LAND CAPABILITY RATING SYTEMS FOR GRAZING
38
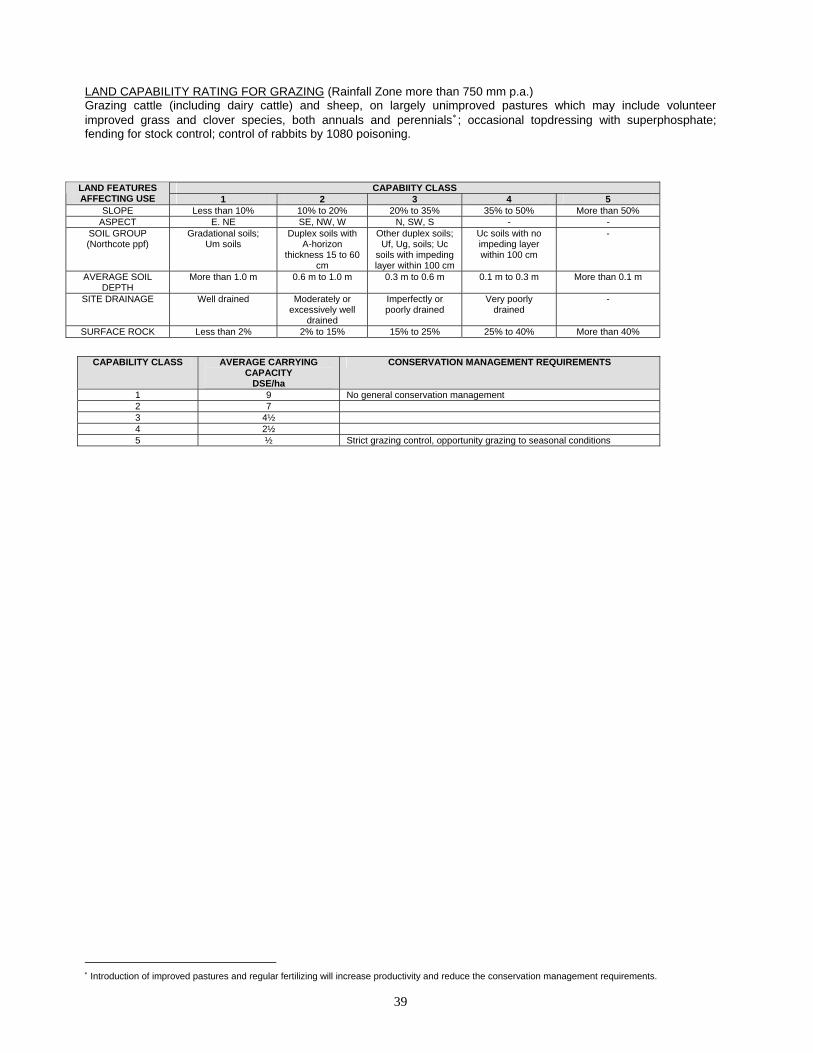
LAND CAPABILITY RATING FOR GRAZING (Rainfall Zone more than 750 mm p.a.) Grazing cattle (including dairy cattle) and sheep, on largely unimproved pastures which may include volunteer improved grass and clover species, both annuals and perennials∗; occasional topdressing with superphosphate; fending for stock control; control of rabbits by 1080 poisoning.
CAPABIITY CLASS LAND FEATURES AFFECTING USE 1 2 3 4 5
SLOPE Less than 10% 10% to 20% 20% to 35% 35% to 50% More than 50% ASPECT E. NE SE, NW, W N, SW, S - -
SOIL GROUP (Northcote ppf)
Gradational soils; Um soils
Duplex soils with A-horizon
thickness 15 to 60 cm
Other duplex soils; Uf, Ug, soils; Uc
soils with impeding layer within 100 cm
Uc soils with no impeding layer within 100 cm
-
AVERAGE SOIL DEPTH
More than 1.0 m 0.6 m to 1.0 m 0.3 m to 0.6 m 0.1 m to 0.3 m More than 0.1 m
SITE DRAINAGE Well drained Moderately or excessively well
drained
Imperfectly or poorly drained
Very poorly drained
-
SURFACE ROCK Less than 2% 2% to 15% 15% to 25% 25% to 40% More than 40%
CAPABILITY CLASS AVERAGE CARRYING
CAPACITY DSE/ha
CONSERVATION MANAGEMENT REQUIREMENTS
1 9 No general conservation management 2 7 3 4½ 4 2½ 5 ½ Strict grazing control, opportunity grazing to seasonal conditions
∗ Introduction of improved pastures and regular fertilizing will increase productivity and reduce the conservation management requirements.
39
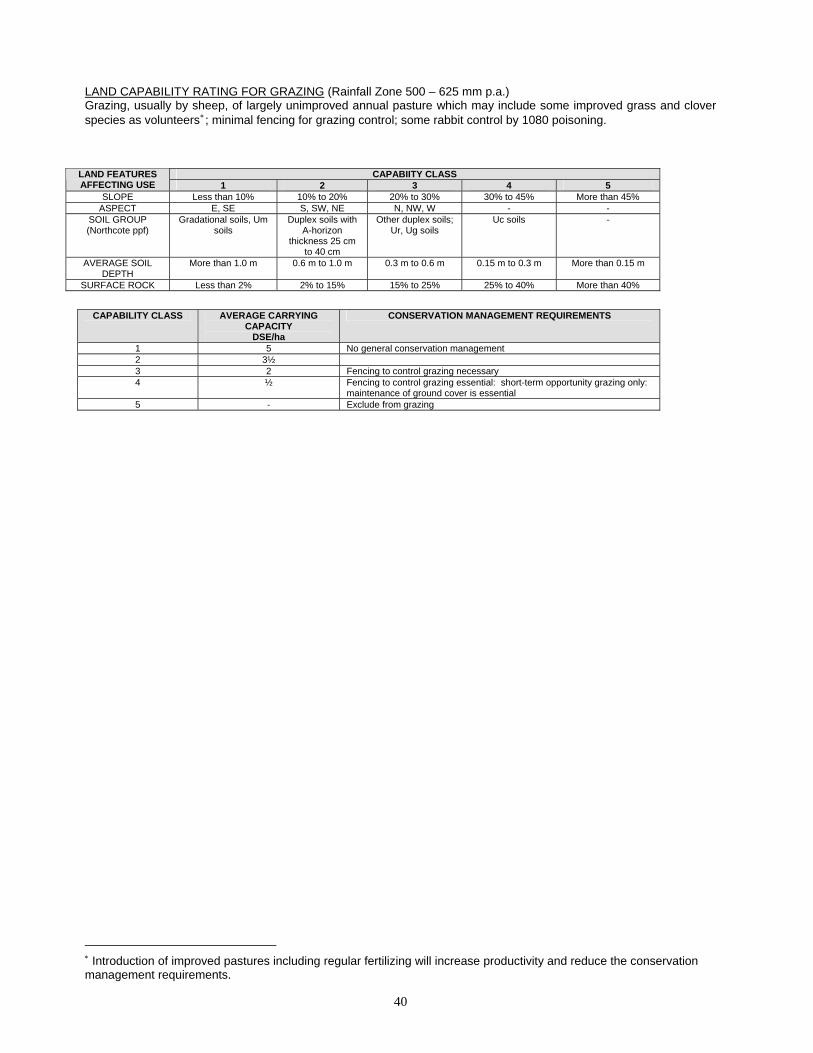
LAND CAPABILITY RATING FOR GRAZING (Rainfall Zone 500 – 625 mm p.a.) Grazing, usually by sheep, of largely unimproved annual pasture which may include some improved grass and clover species as volunteers∗; minimal fencing for grazing control; some rabbit control by 1080 poisoning.
CAPABIITY CLASS LAND FEATURES AFFECTING USE 1 2 3 4 5
SLOPE Less than 10% 10% to 20% 20% to 30% 30% to 45% More than 45% ASPECT E, SE S, SW, NE N, NW, W - -
SOIL GROUP (Northcote ppf)
Gradational soils, Um soils
Duplex soils with A-horizon
thickness 25 cm to 40 cm
Other duplex soils; Ur, Ug soils
Uc soils -
AVERAGE SOIL DEPTH
More than 1.0 m 0.6 m to 1.0 m 0.3 m to 0.6 m 0.15 m to 0.3 m More than 0.15 m
SURFACE ROCK Less than 2% 2% to 15% 15% to 25% 25% to 40% More than 40%
CAPABILITY CLASS AVERAGE CARRYING
CAPACITY DSE/ha
CONSERVATION MANAGEMENT REQUIREMENTS
1 5 No general conservation management 2 3½ 3 2 Fencing to control grazing necessary 4 ½ Fencing to control grazing essential: short-term opportunity grazing only:
maintenance of ground cover is essential 5 - Exclude from grazing
∗ Introduction of improved pastures including regular fertilizing will increase productivity and reduce the conservation management requirements.
40
11. LAND CAPABILITY RATING SYTEMS FOR CROPPING
41
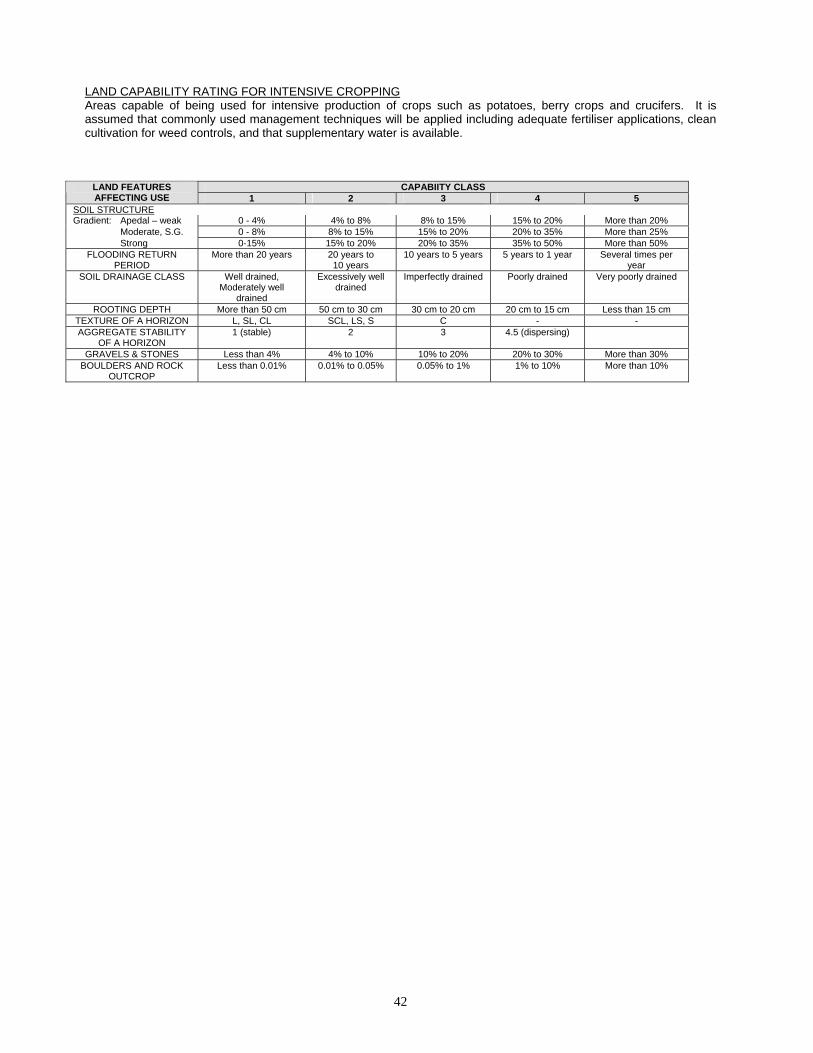
LAND CAPABILITY RATING FOR INTENSIVE CROPPING Areas capable of being used for intensive production of crops such as potatoes, berry crops and crucifers. It is assumed that commonly used management techniques will be applied including adequate fertiliser applications, clean cultivation for weed controls, and that supplementary water is available.
CAPABIITY CLASS LAND FEATURES AFFECTING USE 1 2 3 4 5
SOIL STRUCTURE
Gradient: Apedal – weak 0 - 4% 4% to 8% 8% to 15% 15% to 20% More than 20% Moderate, S.G. 0 - 8% 8% to 15% 15% to 20% 20% to 35% More than 25% Strong 0-15% 15% to 20% 20% to 35% 35% to 50% More than 50%
FLOODING RETURN PERIOD
More than 20 years 20 years to 10 years
10 years to 5 years 5 years to 1 year Several times per year
SOIL DRAINAGE CLASS Well drained, Moderately well
drained
Excessively well drained
Imperfectly drained Poorly drained Very poorly drained
ROOTING DEPTH More than 50 cm 50 cm to 30 cm 30 cm to 20 cm 20 cm to 15 cm Less than 15 cm TEXTURE OF A HORIZON L, SL, CL SCL, LS, S C - - AGGREGATE STABILITY
OF A HORIZON 1 (stable) 2 3 4.5 (dispersing)
GRAVELS & STONES Less than 4% 4% to 10% 10% to 20% 20% to 30% More than 30% BOULDERS AND ROCK
OUTCROP Less than 0.01% 0.01% to 0.05% 0.05% to 1% 1% to 10% More than 10%
42
12. LAND CAPABILITY RATING SYTEMS FOR FORESTRY
43
44
PART III PROCEDURES FOR CARRYING OUT LAND CAPABILITY STUDIES
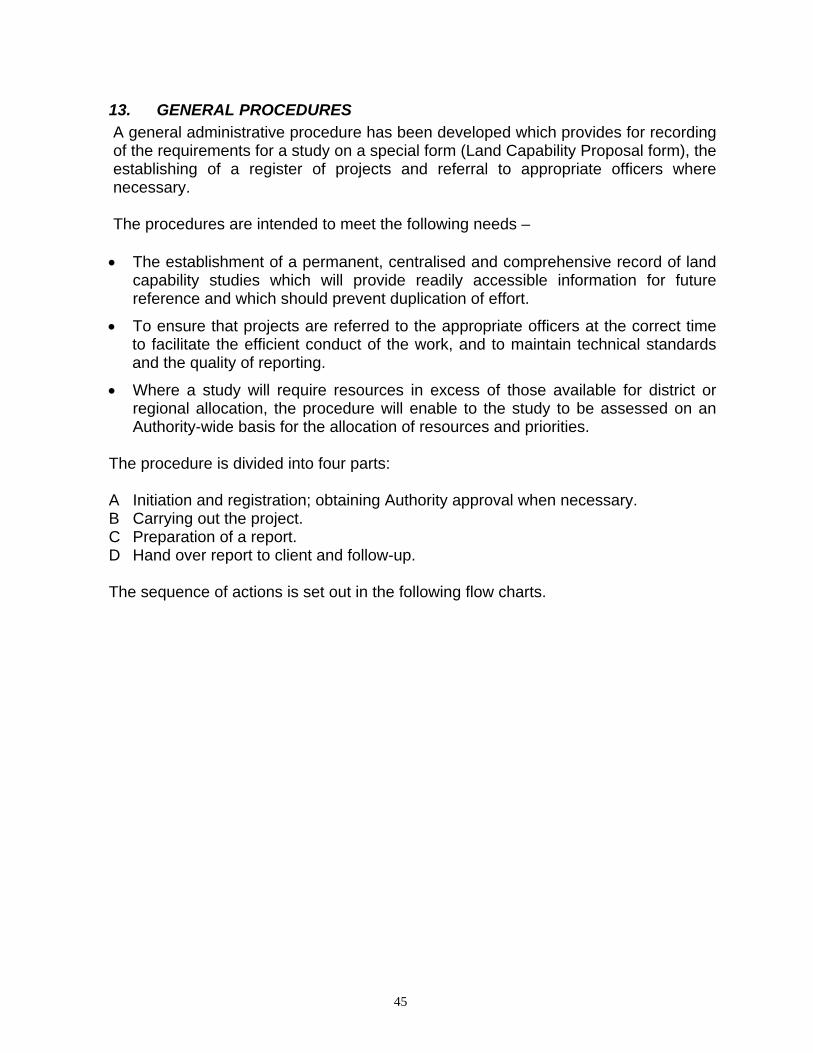
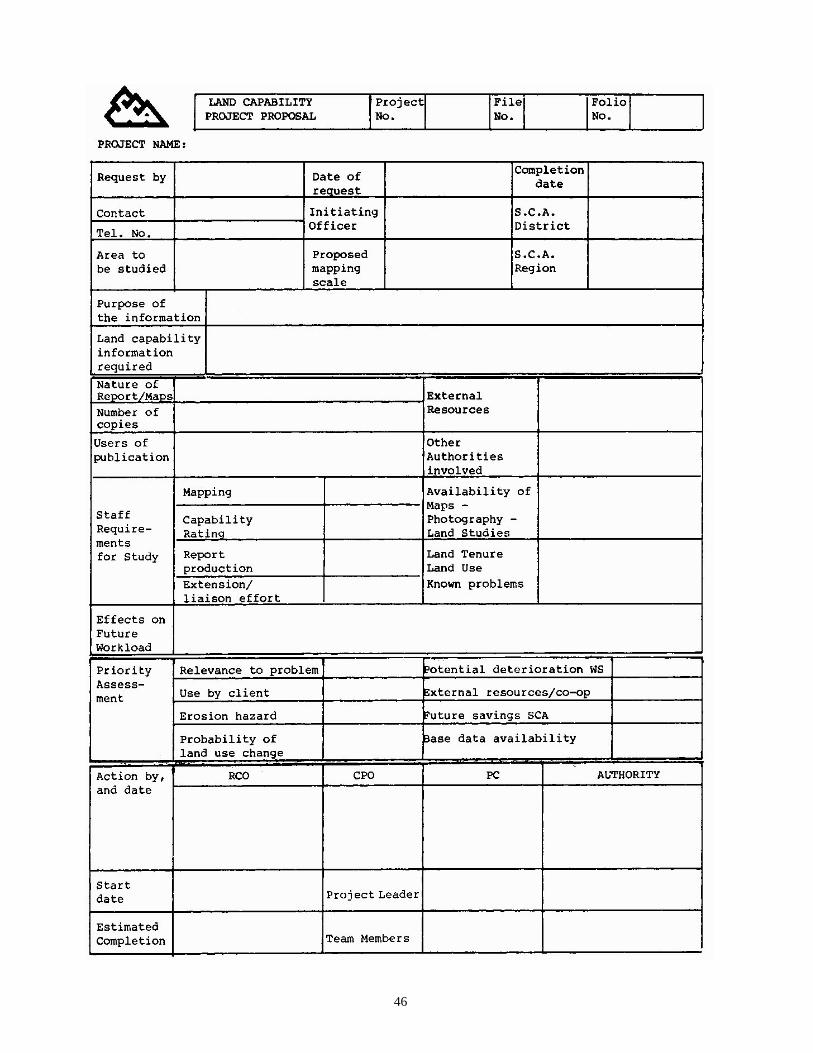
13. GENERAL PROCEDURES A general administrative procedure has been developed which provides for recording of the requirements for a study on a special form (Land Capability Proposal form), the establishing of a register of projects and referral to appropriate officers where necessary. The procedures are intended to meet the following needs – • The establishment of a permanent, centralised and comprehensive record of land
capability studies which will provide readily accessible information for future reference and which should prevent duplication of effort.
• To ensure that projects are referred to the appropriate officers at the correct time to facilitate the efficient conduct of the work, and to maintain technical standards and the quality of reporting.
• Where a study will require resources in excess of those available for district or regional allocation, the procedure will enable to the study to be assessed on an Authority-wide basis for the allocation of resources and priorities.
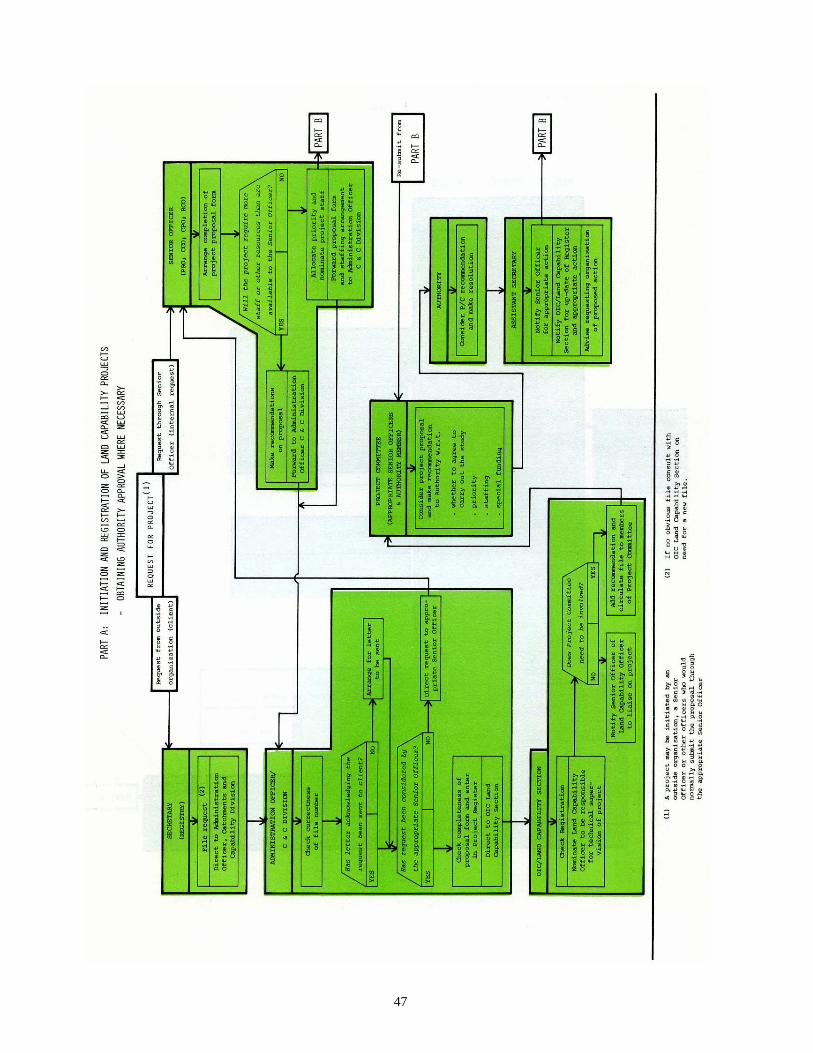
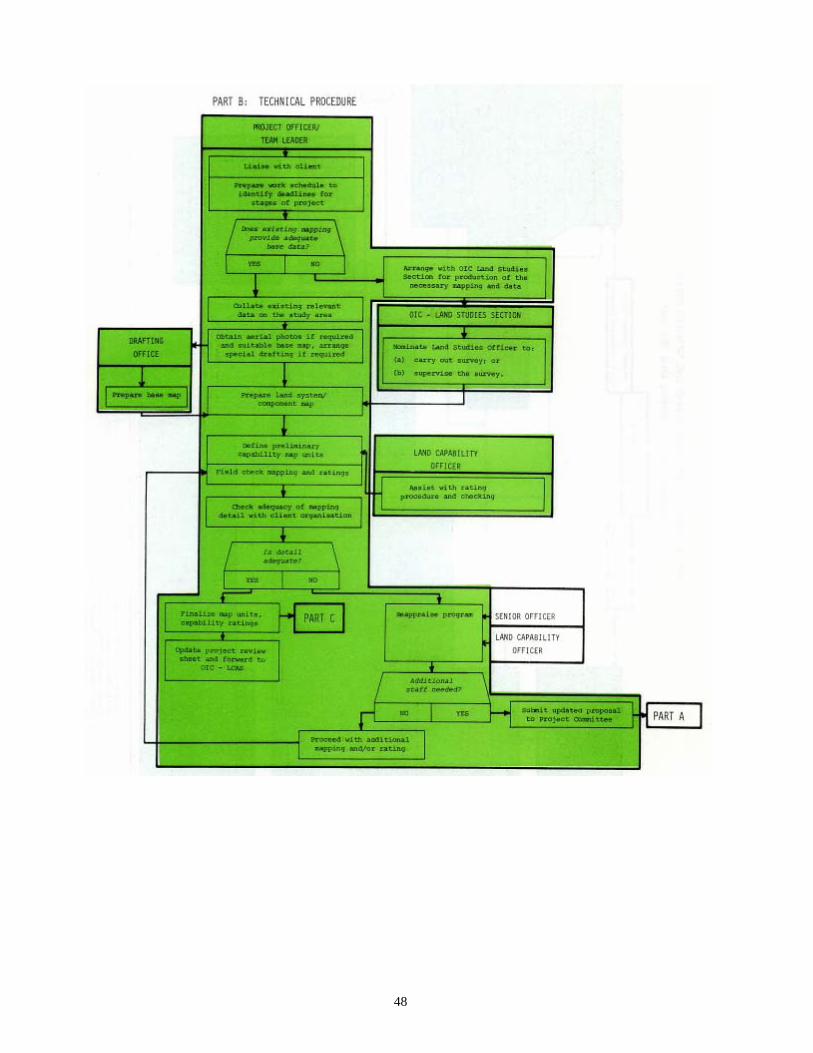
The procedure is divided into four parts: A Initiation and registration; obtaining Authority approval when necessary. B Carrying out the project. C Preparation of a report. D Hand over report to client and follow-up. The sequence of actions is set out in the following flow charts.
45
46
47
48

49
14. REPORT FORMATS AND PRESENTATION To ensure consistency of presentation of Authority land capability reports, responsibilities are delegated thus:
i) REPORTING SECTION: Compilation and assembly of report; sequence of report contents, as distinct from the introductory pages; correct technical expression and terminology; consultation with P&I Section regarding final sizes and treatments of off-standard items such as maps, tables, figures, etc., to ensure best practicable result, having regard to costs, production practicability and finished appearance.
ii) P&I SECTION: Production and presentation standards, including typing; editorial services as and when practicable or desirable; cost and production control; general distribution as distinct from specific recipients for whom the report is prepared or to whom the
The preferred sequence for the parts of a report are set out here. It should be noted that all these parts do not necessarily have to be used in every report. When a series of similar reports is to be produced for a particular client (e.g. Town & Country Planning Board – Rural Land Mapping Program) a special format may be established, but the general framework should be used as far as possible. The needs of the client of the objective of the report should be clearly understood and the format chosen should meet those needs or objectives.
• TITLE PAGE - Title of study Author(s) Soil Conservation logo Name of Section (optional) Date of release of the report
• STATEMENT OF SCOPE AND LIMITATIONS Appropriate statements to inform the user of the scope of the report and the limits of its application. Standard statements to cover the usual limitation are provided in Section 15.2.
• TABLE OF CONTENTS
• PREFACE - This includes a brief explanation of the Authority’s involvement with the land capability assessment and its relevance in the planning process. A standard preface is provided in Section 15.1
PART 1 SUMMARY AND CONCLUSIONS
• OUTLINE OF THE STUDY
• CONCLUSIONS
50

51
The purpose of this section is to provide all the information that the non-technical reader may want without introducing technical matters or details. A locality plan and brief description of the background to the study should be included. In general the conclusions are what the reader will want. The land capability maps are included in this part unless they are too big, in which case they should be on a map pocket at the back of the report. PART 2 TECHNICAL ASPECTS OF THE STUDY
• OUTLINE OF METHODS A basic explanation of the procedures involved in land capability assessment is needed. The two stages – data collection and interpretation should be referred to. A concise description of the way the map units and the basic land characteristics were produced and how this material has been used to produce the capability ratings is required. It is important to state whether the map units are compound (land system or land unit) or simple (component). • LAND CAPABILITY ASSESSMENT * The major land utilization types used are defined (if necessary the rating table for each is presented in an appendix). * The capability classes for each rating system are defined. Table 14.1 presents general definitions which should be adapted to meet the specific requirements of the project. * A brief explanation of the procedure involved in sorting the relevant land characteristics for each land capability map unit through the rating tables may be necessary. • DESCRIPTION OF THE LAND – This section contains brief descriptions under the headings listed below. The intention is to describe the range of variation over the study area. Note that the more detailed descriptions of each land system or land capability map unit in terms of these land characteristics are included in an appendix. This section may be omitted if the information in the appendix is adequate. * Climate * Topography (landforms, slopes, elevational ranges) * Geology * Soils * Existing vegetation * Present land use * The water resources (streamflow, quality, storages) * Existing erosion.
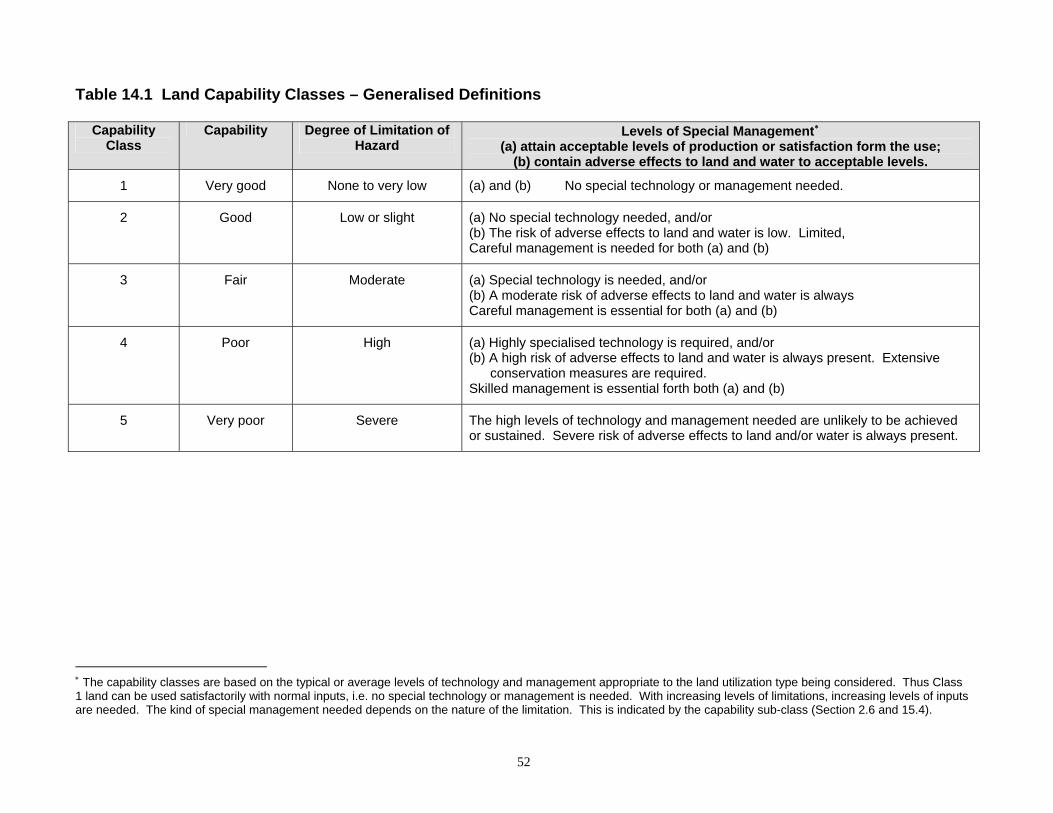
Table 14.1 Land Capability Classes – Generalised Definitions
Capability Class
Capability Degree of Limitation of Hazard
Levels of Special Management∗ (a) attain acceptable levels of production or satisfaction form the use;
(b) contain adverse effects to land and water to acceptable levels.
1 Very good None to very low (a) and (b) No special technology or management needed.
2 Good Low or slight (a) No special technology needed, and/or (b) The risk of adverse effects to land and water is low. Limited, Careful management is needed for both (a) and (b)
3 Fair Moderate (a) Special technology is needed, and/or (b) A moderate risk of adverse effects to land and water is always Careful management is essential for both (a) and (b)
4 Poor High (a) Highly specialised technology is required, and/or (b) A high risk of adverse effects to land and water is always present. Extensive
conservation measures are required. Skilled management is essential forth both (a) and (b)
5 Very poor Severe The high levels of technology and management needed are unlikely to be achieved or sustained. Severe risk of adverse effects to land and/or water is always present.
∗ The capability classes are based on the typical or average levels of technology and management appropriate to the land utilization type being considered. Thus Class 1 land can be used satisfactorily with normal inputs, i.e. no special technology or management is needed. With increasing levels of limitations, increasing levels of inputs are needed. The kind of special management needed depends on the nature of the limitation. This is indicated by the capability sub-class (Section 2.6 and 15.4).
52

53
• LAND CAPABILITY RATINGS A summary table of the capability ratings for all the map units for each of the land utilization types is presented. This consists of the capability class and sub-classes, however, the amount of detail provided should be consistent with the objectives of the study (Section 15.4). Interpretations of the effects of the limitations on the use or activity, and the impact on the land and the water may be included here or in the detailed map unit description tables in an appendix. Maps showing the capability classes for the different map units for each use or activity are also included. The maps are coloured according to the standard colours (Section 15.3), or, if a large number of copies is to be produced, either the cross-hatching or the stippling and shading (preferred if the necessary transfers are available) are used to show the capability classes. • MANAGEMENT GUIDELINES In many cases the provision of management guidelines related to the capability classes will be an essential part of the capability information. A statement of general conservation management practices is included in Section 15.6. Modifications to these or additional practices required to meet local conditions should be included if needed. • AREAS OF SPECIAL CONSERVATION INTEREST It may be desirable to draw attention to the existence of proclaimed catchments or other areas of special concern to the SCA. • APPENDICES The objective is to keep the main part of the report as brief and informative, and as non-technical as possible. If needed, detailed and more technical material is included as appendices. However the need for such detail, even in an appendix must be carefully considered in relation to the objectives of the study and the report, and the needs of the client. • Descriptions of the Map Units – Each map unit is briefly described in
terms of the dominant soil, topographic characteristics, capability for the land uses under consideration, the major limitations to the various land uses and their impact on the use, or hazards to land and water, and notes on special management are included. A table is the simplest form of presentation. This is the presentation of the capability classes within each compound map unit are also indicated.
• Soil Descriptions, Tests and Other Laboratory Results – Descriptions of the dominant soils are presented. The results of tests, including laboratory analyses of soil or other material, are also presented in tables in this appendix.
54
If considered necessary, standard descriptions of the analytical or test procedures can be provided by the Land Capability Section.
• Land Capability Rating Systems – The rating systems are included in this appendix, however it may not be necessary to include these in all reports.
• Land Characteristics Which Affect Land Capability – Descriptions of land characteristics or land qualities used (e.g. slope, profile, drainage, flooding hazard) and brief explanations as to why they are important in determining land capability, are included in this appendix. Notes on the most commonly used diagnostic criteria are provided in Section 15.5.
• Maps – Maps, other than the land capability rating maps which are in the main part of the report, are included at the end of the report. The main map shows the basic map units (land systems or components); others which may be included are for slopes, geology, drainage patterns and erosion.
• ACKNOWLEDGEMENTS – Acknowledgements of the contribution of
persons or organisations not credited with authorship of the report are made in this section.
• REFERENCES – List published material used in preparing the report.
• GLOSSARY – Glossary of Technical Terms – Terms which may not be
readily understood by users of the report are included at the end of the report.
55
15. STANDARD SECTIONS
15.1 PREFACE Three requirements for sound land use planning are:
• An understanding of the extent to which the use will be limited by the nature characteristics of the land,
• The effect the use will have on the land and the water derived from it,
• The need for special land management or structural design to overcome limitations or to restrict the impacts to acceptable levels.
Land capability assessment is a rational and systematic means of obtaining this information. The Soil Conservation Authority is able to provide land capability information for a range of uses and at different scales to meet the various needs of planning. This information provides a relatively stable base on which to superimpose other planning considerations.
15.2 STATEMENTS OF LIMITATIONS FOR REPORTS AND MAPS There is a need for standard statements which will preface land capability reports or be included on the face of land capability maps produced by the Authority.
15.2.1 Limitations on Use of Reports (i) File reports – Not for distribution beyond the immediate client and not to be
quoted in other than Authority correspondence. (ii) Unpublished reports – Generally produced for use by a client, - 10 – 100 copies
may be produced. These are distributed to the immediate client and a limited number of others who may be directly involved in the study. Material from these reports should not be reproduced or quoted or used as a reference in published papers, without the written permission of the Soil Conservation Authority. For unpublished reports, the disclaimer should include the statement – “No material may be extracted from the report for publication without the written permission of the Soil Conservation Authority”.
(iii) Published reports – These are reports which are produced for general distribution. The usual requirements for acknowledgement of the source when reproduced or quoted should be observed.
15.2.2 Statement of Limitations for Land Capability Maps It is necessary that users of the maps are aware of the limitations inherent in maps of this type, particularly in relation to:
• Precision of the map-unit boundaries • The effect of changes to map scale • Uniformity of the map units
56
Statements relating to the first two points are included in the general statement (15.2.3). With regard to the latter point the two types of map units usually used in land capability studies must be distinguished. –
• Compound map units (e.g. land systems) where several land types are mapped together because of the existence of consistent sequences/patterns of land types;
• Simple map units (e.g. land component) where the objective is to map areas which are uniform.
The following statements should be included on the face of land capability maps. Other limitations to the use of the map are included in the general statement at the front of the report should be also referred to on the map. This map should only be used within the limitations set out in the accompanying report.
• For compound map units – “The boundaries on this map separate areas within which a limited number of different land types are present”.
• For simple map units – “The boundaries on this map separate areas considered to be uniform with respect to those land characteristics relevant to the study. However, some map units may contain small proportions of different land, either because of the difficulty of mapping them at the scale adopted or because they were not readily discernible during the mapping.”
• Additional Statements for Inclusion on Maps – (a) Other limitations to the use of the maps are included in the general
statement at the front of the report (see 15.2.3) and should be referred to on the map viz. – “This map should only be used within the limitations set out in the accompanying report”.
(b) When a land system map is to be reproduced, and modification to the previously released boundaries or descriptions are made, the following statement should be included on the map face. “This map is based on previous land system studies by SCA, adapted where necessary as a result of these investigations”.
(c) For either type of map, additional statements should be made to tell the user when the field work was carried out, whether the mapping was the result of reconnaissance or detailed surveying, and whether it is based largely on air-photo interpretation or has also been field checked.
(d) The mapping scale and final presentation scale should be stated. E.g. “Mapping was carried out on 1:25 000 aerial photographs and this map is published at 1:50 000”.
15.2.3 General Statement of Scope and Limitations This should appear on a page immediately following the title page.

• This report is based on an assessment of the physical characteristics of the land. Social or economic factors have not been considered.
• The scale of the assessment has necessitated some generalisation. Site – specific data will be required for detailed planning.
• The prevision with which boundaries are mapped is affected by the scale of the map. Subsequent enlargement of the map does not improve the precision and may be misleading.
• The boundaries on the maps usually represent readily seen changes in the land. However, where an important land characteristic changes generally, the boundary indicates approximately where there is a significant change in the effect on land use.
• No material may be extracted from the report for publication without the written permission of the Soil Conservation Authority.
15.3 PRESENTATION OF THE CAPABILITY CLASSES ON MAPS The colours listed below should be used to distinguish capability classes on maps. If it is not practicable to use colours, as would be the case where a large number of maps is to be reproduced, the stipple patterns and density screening should be used. These are available through the Authority’s draughting service. If it is not possible to illustrate capability classes by these means, the cross-hatching shown below can be used as a simple alternative. The thickness and spacing of the lines or cross-hatch in each, and the background detail on the map is not unduly obscured. Allow for the resultant change in density of the hatching of the maps are to be photo-reduced. Zipatone Code Capability Class 1 (dark green) Capability Class 2 (light green) 310 Capability Class 3 (yellow) 10% Capability Class 4 (orange) 40% Capability Class 5 (deep red) 60%
15.4 SYMBOLS FOR DIAGNOSTIC CRITERIA AND SUB-CLASSES AND THEIR USE Symbols from the following list are used after the land capability class to identify the nature of the limitations which determine the sub-classes.
57

58
SOIL CHARACTERISTICS
• Stones and/or gravel Ss • Unified soil group Su • Soil reaction Sa • Shrink-swell potential Sl • Dispersible clays Sd • Soluble salts Sn • Soil texture St • Organic matter So
DEPTH OF MATERIAL
• Depth to hard rock Dr • Overburden depth Do • Deposit thickness Dd • Soil depth Ds
WETNESS OR DRAINAGE
• Soil profile permeability Wp • Depth to watertable Wg • Site drainage Wd
SLOPE G LANDSLIP HAZARD L FLOODING
• Flash floods Ff • Inundation Fi
ROCKINESS
• Rock outcrop Ro • Boulders Rb
Different levels of detail can be presented using the Codes. At the broadest level, land capability classes can be used alone.
59
At the most detailed level, all appropriate sub-classes can be listed following the land capability class for the particular use or activity. In this way, 3GSsSt2Su tells us that for the land use being considered, capability is fair because of limitations due to slope (G), stones and gravel (Ss) and Soil texture (St) and that there is a minor limitation due to the Unified soil group (Su) in capability class 2. Land capability classes and sub-classes of this nature should accompany descriptions of capability map units in reports. In this form they allow identification of all limitations which may need to be overcome in using the land. The needs of a particular client, however, may be adequately met if information is provided which states that land in the above example has a capability of 3Gs. That is, it is fair capability due to slope and soils (unspecified) limitations. If further details are needed, they can be found in the appropriate capability map unit description. It can be seen that this system, while providing information that may be of vital importance, can become unwieldy and it is suggested that common sense be used when selecting the level of information appropriate to a particular application of the data. Knowing who will receive the data and for what purposes it will be used will obviously be of considerable help.
15.5 LAND CHARACTERISTICS USED IN LAND CAPABILITY ASSESSMENT The land characteristics used in capability rating systems can impose limitations to the use of land through their effects on productivity and management and in the production of hazards. This section explains why these land features are important in determining capability. A Horizon Texture : Texture of Deposit Soil texture is directly related to the proportions of various sizes of the solid particles which make up the soil, and is therefore a useful guide to the way in which the soil behaves. It provides an indication of whether the soil will become sticky when wet (clay) or unstable when dry (sand), which are important considerations for many uses. High dispersibility is a property of some clays and results in high erodibility whereas sandy soils generally lack coherence and are readily eroded, particularly by the wind. Texture influences the rate of water movement in the soil, the water retention capacity of a soil and the ability of the soil to supply the nutrients necessary for plant growth. This factor may operate to limit plant yield in agricultural uses on the one hand and the growth of lawns and gardens in urban areas on the other. Some of the limitations imposed by soil texture can be reduced or overcome by special treatments such as the addition of stabilising chemicals or organic matter, or simply by importing better quality topsoil.
60
Boulders and Rock Outcrops Boulders and rock outcrop provide physical obstacles to excavation, cultivation and plant growth, and so inhibit land uses involving these activities. In some cases it may be possible to reduce rock outcrop by blasting. For extensive uses, such as grazing, boulders and rock outcrop can be regarded as a permanent limitation as it is not economical to remove them. There may be additional costs involved in the increased management required as compared with rock and boulder free land. Depth to Hard Rock If bedrock is close to the surface, excavation will be costly and cultivation may be difficult or impossible. Plant growth and water penetration are adversely affected by shallow soils. The limitations to engineering activities may be overcome by blasting, but in low intensity uses, bedrock at shallow depth is regarded as a permanent limitation resulting in increased coasts of agricultural production through the difficulty of constructing farm dams, and reduced plant yield. Depth of Topsoil Because topsoil is not favoured as a constriction material (e.g. for earthen embankments, farm dams) the greater its thickness, the great the cost of removing and stockpiling it. For many situations the topsoil is required for re-spreading on construction sites to facilitate vegetation. Depth to Watertable (Seasonal, Perched, Permanent) For many uses the presence of a watertable close to the surface cases problems. Saturated soil has low strength so that for uses dependent on a sable foundation (e.g. house foundations, roads) even a watertable which only approaches the surface occasionally is detrimental. The presence of a watertable also restricts the drainage of added surface water such as rainfall or irrigation water, or septic effluent. In the former cases trafficability and plant growth may be adversely affected. In the latter, public health aspects may be of concern. A perched watertable which develops seasonally may be as serious a limitation as a ground watertable although it may be more easily overcome by artificial drainage. The presence of a permanent watertable may restrict the excavation depth of sand and gravel in quarries. Soils which are saturated periodically as a result of a fluctuating watertable are likely to have suffered leaching of the more mobile plant nutrients, and have poor aeration which prevents root growth in the zone of saturation. Dispersible Clays (see also Section 4.3.4) Dispersion and slaking are important for their influence on the erodibility of a soil. This is particularly important in construction activities where the B horizon, or sub-soil is exposed in cut batters or where the material is used in earth embankments. It can
61
also be important in other uses, such as paths and tracks, where the area has been denuded of vegetation and possibly some topsoil has been lost. Soils with a high degree of slaking or dispersion have a high erosion potential when exposed to running water. In a highly dispersible soil, soil pores may become blocked, thus reducing water infiltration and adversely affecting land uses requiring good drainage such as effluent disposal. The problem of a dispersible B horizon may be overcome by careful management such as ensuring that batters are well vegetated. Flooding A useful distinction may be made between fast flowing flood water (flash flood) and flooding caused by a rise in water levels with little flow (inundation). The type and severity of impact caused by these two forms of flooding differ and different management may be required to minimise the hazard. Flooding is an important factor in terms of human safety, damage to property and general inconvenience. Thus, flood prone land should not be used for capital intensive uses, but may be capable of supporting extensive land uses such as grazing. In some areas the problem may be overcome by the building of levee banks or retarding basins. Some modification of flooding characteristics may be possible by special management aimed at delaying surface runoff. However, when dealing with large catchments, the problem can be regarded as a long term hazard and is thus a permanent limitation. Infiltration The ability of soil to absorb applied water (rain or irrigation water) has an important effect on the production of surface runoff and may also affect the ability of soil to provide moisture for plant growth because of limitations to the amount of water entering the soil. Raindrop splash loosens soil particles and, along with surface wash, may cause the blocking of surface pores and reduce the amount of water penetrating the soil. The resultant increase in runoff effectively increases the erosion hazard. Soils differ in their resistance to surface sealing. Maintenance of an effective ground cover which prevents rain-drop splash or surface wash is an appropriate means of retains soil infiltration capacity. Slope Failure Hazard Slope failures includes all relatively rapid mass movements such as landslides (landslips), earth flows, mud flows and debris avalanches. Slope failures are important factors to consider with respect to their influence on human safety, damage to property and access. A high slope failure hazard can be a permanent limitation to some land uses because even where it may be technically possible to prevent any failure, the cost would be generally prohibitive. The existence of old slope failure in an area is usually a good indication that the land is unstable and has a slope failure hazard.
62
Organic Matter Where soil materials are to be used as road fill or for earthen dams, the presence of organic matter reduces soil quality for these purposes. Soils containing even moderate amounts of organic matter are significantly more compressible and less stable than inorganic soils. The presence of organic material in sand for concrete is also undesirable. When used as a medium for plant growth, however, a high level of organic matter produces better structure and chemical fertility, and the soils are good for intensive cropping. Low organic matter content may be overcome by management techniques such as the growing of green manure crops or the addition of fertilizers. Permeability (see Section 4.3.3 for field test) Soils of low permeability drain only poorly through the profile; on sloping land, lateral flow above an impervious layer may occur. Areas with such soils may become waterlogged above the impervious horizon, inhibiting plant growth, or producing conditions at certain times of the year that are too boggy for the use of agricultural machinery. The soils also cause problems when used for effluent disposal. However, low permeability is necessary in soils to be used for earthen dam construction since low permeability in the floor and the excavated parts of the walls of the dam are essential. Conversely, an extremely permeable soil may suffer from excessive leaching of plant nutrients or an inability to retain moisture for plant growth. Such a soil may also drain too rapidly to perform the purification function required for septic effluent disposal. pH of Material (see Soil Reaction and Section 4.3.5 for field test). Plasticity Index (see Glossary) The plasticity index is a measure of the range of moisture content over which the soil is in the plastic state. A soil is most easily worked or is most readily deformed when in that state. A low index indicates that the range is narrow, which is desirable where the stability of the material is important, such as in a road subgrade. But where the soil is to be cultivated, a larger plasticity index is desirable to enable working over a wider range of moisture contents. Shrink-swell Potential (see Section 4.3.2 for field test) Shrink-swell potential is a measure of how much the volume of a soil changes as it changes between wet and dry conditions. Shrink-swell potential influences the capability for land uses such as roads or buildings which require a stable substrate. Buildings and roads shift or crack in soils which undergo large changes in volume during periodic wetting and drying. Construction on soils with a high shrink-swell potential requires special techniques such as laying a deeper than usual road paving or using a concrete slab rather than strip footings for dwelling foundations.
63
Site Drainage Site drainage is influenced by rainfall, soil permeability, the steepness of slope, slope shape and the position of the site in relation to the rest of the slope. It is important for most land uses that water flows freely from the site, since poor site drainage may result in the land becoming waterlogged and boggy, inhibiting plant growth, damaging roads and buildings through subsidence, and reducing the capacity for efficient effluent disposal. Special practices or management to overcome poor site drainage will add to the cost of development and management. Slope As slope angle and length increase so erosion hazard increases because the erosivity of the runoff water increases due to increased volume and velocity of flow downslope. Lack of adequate ground cover such as occurs during construction activities on tracks and intensive use areas, at certain times under agricultural or forestry uses where cultivation is required, or as a result of overgrazing, accentuates the erosion hazard. An addition influence of slope on the capability for urban and similar uses is related to the increasing cost of providing engineering service as slope angle increases. The slope categories used in urban ratings have been chosen on the basis of relative per block costs of building and providing services, as described by Neil and Scales (1976). In agricultural and forestry activities, steeper slopes are more difficult and costly to use and impose limitations on the type of machinery which can be used. Seepage problems on certain soil types increase with slope and may increase the risk of mass movement such as slumping of the batters of excavations and road cuts or even of natural slopes. Problems with the absorption and retention of septic effluent below the soil surface increase as the slopes become steeper. Root Penetration The depth of rooting of plants may be restricted by such soil features as a heavy clay subsoil, or a hard pan. If this feature is close to the surface, root development, and therefore plant growth, will be restricted. Increased coasts are incurred in overcoming the problem by methods such as deep ripping. On shallow soils perennial plants such as trees in orchards or plantations may suffer growth restrictions or even permanent damage if unseasonably dry or wet condition occur. Moreover, trees are more prone to wind-throw on shallow soils. Soil Reaction (pH) (see Section 4.3.5 for field test) The pH of the soil is a measure of its acidity or alkalinity. Most plants have a limited pH range for optimum growth and thus a pH differing from the optimum for high plant yield will result in reduced crop production or may require costly treatment to bring the pH closer to the optimum.
64
Stones and Gravel Excavation of soils containing large amounts of stones and gravel requires special machinery. Furthermore, the sides of the construction trenches and pits in these soils are less stable. Stones in a soil reduce the proportion of that part of the soil which provides plant nutrients and moisture, and consequently reduce the productive potential. Soils with stones and gravel are difficult to cultivate and are far less suited to intensive cropping and gardens than are stone-free soils. Stones also cause problems with mechanical harvesting of root crops, notably potatoes. Soil micro-organisms are essential to the purification of septic effluent, but unfortunately stony or gravelly soils provide a less suitable environment for these organisms than stone and gravel-free soils. Furthermore, the effluent flows quickly through stony soils thus reducing the time available for purifying processes. For some land use activities, such as excavating in stony soils, limitations imposed by stones and gravel can be overcome by special management or technology, or, in areas where plant growth is necessary, the limitations can e overcome by importing topsoil. Stones and gravel in soils intended for intensive cropping can be regarded as a permanent limitation, causing lower yields and increased management problems unless the importation of topsoil is economically justified. The problems of septic effluent disposal by absorption in these soils are difficult to overcome and may be regarded as a permanent limitation to the commonly used tile-drain disposal systems. Texture of Deposit (refer to A Horizon Texture). Thickness of Deposit : Thickness of Overburden : Thickness of Construction Material These site characteristics are related to the practicability and economics of excavating the desired material. In extracting sand or gravel for road fill, a thicker deposit results in greater efficiency in working the site since establishment costs are distributed over a greater quantity of material. Conversely, the greater the amount of overburden the higher is the cost of obtaining the material. The proportion of overburden thickness to deposit thickness is a common form of expressing the importance of overburden thickness. Unified Soil Group The Unified Soil Classification is used by engineers to group soils which display similar engineering properties. Such properties include bearing capacity, drainage characteristics and the amount of shrinking and swelling a soil undergoes as the moisture content changes. Surface soils are generally considered inferior for engineering purposes and usually are stripped before construction commences. The subsoil or B horizon is thus the material most usually involved in construction activities.

65
The group symbols are:- Group Symbol Typical Names
GW Well graded gravel, gravel and sand mixtures, little or no fines
GP Poorly graded gravel, gravel and sand mixtures, little or no fines
GM Silty gravel, gravel and sand and silt mixture
GC Clayey gravel, gravel and sand and clay mixtures
SW Well graded sands, gravelly sands, little or no fines
SP Poorly graded sands, gravelly sands, little or no fines
SM Silty sands, sand and silt mixtures
SC Clayey sands, sand and clay mixtures
ML Inorganic silts and very fine sands, rock flour, silty or clayey fine sands, or clayey silts with slight plasticity
CH Inorganic clays of high plasticity, fat clays
OH Organic clays of medium to high plasticity, organic silts
Pt Peat and other highly organic soils
15.6 CONSERVATION MANAGEMENT PRACTICES
A. General recommendations for engineering activities Engineering activities will be cheaper, more efficient and less harmful to the environment if attention is given to erosion and sediment control in the planning and design phases of a project rather than only during construction. Basic principles in erosion and sediment control are:
i) Bare soils will erode more rapidly than vegetated, mulched or paved areas. ii) Erosion rates are influenced significantly by the amount of overland flow,
which in turn is affected by surface infiltration rates. iii) Sand and silt-sized material is removed easily from drainage waters, but it is
usually impractical to remove the finer particles that contribute to turbidity of drainage waters.
An erosion and sediment control programme is based on the following objectives:
i) Keep to a minimum the are of soil exposed. ii) Minimise the time the soil is exposed and, as far as possible, avoid having
the soil exposed during periods when high intensity or prolonged rain is prevalent.
iii) Carry out earthworks in a manner that takes into account the different erodibility and fertility of topsoils and subsoils.
66
iv) Control surface drainage. v) Trap eroded soil before it damages downslope land, structures or
waterways. Although the most suitable programme for a specific development is governed by local circumstances, the soil conservation programme will usually involve one or a combination of the practices outlined below. More detailed information about conservation practices applicable to construction sites (“Guidelines for Minimising Soil Erosion and Sedimentation from Construction Sites Victoria”) or further advice is available from the Soil Conservation Authority. Some general conservation management practices include:
i) Development should be programmed to minimise the area disturbed at any one time to allow rapid protection by vegetation, mulching or paving of the bared areas. This is particularly important on steep slopes, in areas where highly erodible soil horizons will be exposed, and if the area is to be bare during high intensity rains. It may be necessary to establish temporary vegetative or other protection on areas that would otherwise be bare but remain unworked for long periods during construction.
ii) When planning sites for road and general levelling operations for building sites, steep slopes should be avoided as much as possible so that the amount of cut and fill needed is reduced. Aligning roads just off the contour in steep areas assists with surface draining of the roads.
iii) Topsoil and subsoil should be handled separately and placed in separate stockpiles (if stockpiling is necessary). Stockpiles should not be established within flood zones or in drainage lines, and, if they are to remain unworked for long periods, they should be protected by establishing a vegetative or other cover.
iv) Adequate compaction of soil used for backfilling trenches, for fill batters and for general fill operations is necessary for short and long term stability. Allowance should be made for settlement of fill material where settlement could damage structures or interfere with surface drainage.
v) Where revegetation of bared areas is to be undertaken the following measures, as appropriate should be followed:
(a) The surface of the subsoil should be loosened and/or roughened (e.g. by
scarifying on board areas, or by sawtooth finish or cut batters) prior to topsoil spreading.
(b) Topsoil should be spread when moist (i.e. neither too wet nor dry); depths of about 5 to 10 cm are probably sufficient in most cases; deeper layers of topsoil may slump on steep slopes.
(c) The area should be sown with grasses and legumes. Specific recommendations for seed and fertilizer mixtures can be provided by SCA district offices. Autumn sowings are generally most successful for establishing vegetation with minimum management inputs such as follow-up watering or re-seeding.
67
(d) In critical cases such as batters, steep areas and drainage lines, early stability is assisted by chemical and/or organic mulches.
(e) Follow-up watering, fertilizers and mowing may be necessary to establish and maintain a persistent and dense vegetative cover.
vi) Construction traffic should be confined where possible, to existing or
proposed road alignments. Drainage line crossings which are to remain when construction activities have concluded should be established as early as possible. If it becomes necessary to cross drainage lines at sites other than where permanent crossings are to be established, temporary culverts or causeways should be established.
vii) Measures should be undertaken to prevent construction traffic depositing soil on roads outside the construction site.
viii) Roads, parking areas, footpaths and driveways should be paved as early as practicable.
ix) Control of drainage by either temporary, or preferably permanent works is necessary from the start of construction. It is desirable that interception banks and/or channels be used to divert upslope drainage away from bared areas. This is particularly important for but or fill batters. Cut-off drains to intercept ground-water flow may be required above cut batters. Berm drains will be required on high batters. Cross drains and/or channels and/or pipes should be established as necessary to prevent the uncontrolled concentration of surface drainage within the construction area.
x) It is essential that drains are designed to discharge in a manner that does not cause scouring and erosion. Pipes or paved or grassed channels may be needed to convey water down steep slopes and batters. Prevention of erosion from drain outlets may require level-spreaders and concrete or rip rap aprons.
xi) The increased flows that usually accompany development of an area and the possible need to stabilize natural waterways must be allowed for in planning and construction. The increased flows may be modified by using grassed waterways, sediment/retardation basins and overland flow rather than concrete pipes and channels.
xii) The larger sediment fraction in water draining from bared areas should be removed by passing the water through sediment basins, or over grass filter-strips, or by other means before it enters natural waterways or underground drains, or damages downslope land and structures. Sediment removal is generally easier if the time between installing pipes and completing drainage pits and inlets, and providing temporary inlet protection during construction, significantly reduces the sediment load leaving a construction site.
xiii) Construction tracks, borrow pits and other temporary works that involve land disturbance need similar drainage control, surface stabilization and sediment control measures to those used for permanent structures and works. Once they are no longer required for construction, the areas should be re-instated and stabilized. Careful planning and design can enable
68
temporary works to become a permanent feature – for example, a sediment basin could become a water trap in a golf course or a lake in an urban park.
15.7 GLOSSARY Most of the terms used in this manual are defined in Northcote (1974), however additional terms which are used are included in this glossary. Most of the latter are derived from the Soil Science Society of America (1971). Aeration, soil – the process by which air in the soil is replaced by air from the
atmosphere. In a soil that is well-aerated, air is very similar in composition to the atmosphere above the soil. Poorly aerated soils usually contain a much higher percentage of carbon dioxide and a correspondingly lower percentage of oxygen than the atmosphere above the soil. The rate of aeration depends largely on the volume and continuity of pores within the soil.
Atterberg Limits – these are based on the concept that depending on its water content
a fine grained soil can exist in any of three states. Thus, on the addition of water, a soil may change progressively from the solid state to the plastic and finally to the liquid states. The water content at the boundaries between adjacent states is terms the plastic limit and the liquid limit.
Thus:
Plastic Limit (PL) is the moisture content at which the soil passes from the solid to the plastic state Liquid Limit (LL) is the moisture content at which the soil passes from the plastic to the liquid state Plasticity Index (PI) is the difference between the plastic and the liquid limits. Toughness and dry strength are proportional to the plasticity index.
Available water – the portion of water in a soil that can be readily absorbed by plant
roots and usually considered to be that water held in the soil against a pressure of up to approximately 15 bars. See field capacity.
Batter – the sloping earthen surface produced when an excavation or embankment is
made, for example when a road is cut in a slope or where a depression is filled to carry a road across.
Bedrock – the soil rock underlying the soil and the regolith in depths ranging from zero,
where exposed at the surface to sometimes over 100 m. Bulk density, soil – the mass of soil dried to constant weight at 105oC per unit bulk
volume determined when the sample is at or close to field capacity. Cation - exchange capacity (CEC) – the sum total of exchangeable cations that a soil
can absorb, expressed in milliequivalents per 100 grams, or per gram of soil (or of other exchangers such as clay).
69
Clod – a compact, coherent mass of soil, ranging in size from 5 or 10 mm to as much as 200 to 250 mm; produced artificially, usually by such activities as plowing or digging, and especially when the soils are either too wet or too dry for normal tillage operations.
Colluvium – a deposit of rock fragments and soil material accumulated near the base
of slopes as a result of gravitation action. Concretion – a local concentration of a chemical compound, such as calcium
carbonate or iron oxide, in the form of a grain or nodule of varying size, shape, hardness, and colour.
Erodibility – a measure of the ease with which a soil is eroded. Erosivity – a measure of the ability of rainfall or runoff to cause erosion (wind also). Exchangeable cations – positively charged ions, including many which are essential
plant nutrients, which are held to colloidal material in the soil by electrostatic forces. They may be displaced by other cations or be removed from the colloid surface by plant roots.
Field capacity – the percentage, expressed on the basis of weight or volume, of water
remaining in a soil 2 or 3 days after having been saturated or be removed from the colloid surface by plant roots.
Impeded drainage – a condition which hinders the free gravitational movement of
water through soils. Infiltration – the downward entry of water into the soil. Infiltration rate (formerly, the infiltration capacity) – a soil characteristic describing the
maximum rate at which water can enter the soil under specified conditions, including the presence of an excess of water. It has the dimensions of velocity (i.e. cm3 cm-2 = cm sec-1).
Liquid limit – see under Atterberg Limits. Permeability, soil – the areas with which gases or liquid pas through a soil or a layer of
soil. Since different soil horizons vary in permeability, the particular horizon under question should be designated.
pH, soil – a measure of the acidity or alkalinity of the soil expressed as the negative
logarithm of the hydrogen-ion activity of a soil. A pH of 7.0 is neutral, higher values indicate increasing alkalinity and lower values indicate increasing acidity. The degree of acidity (or alkalinity) of a soil as determined by means of a glass, quinhydrone, or other suitable electrode or indicators at a specified moisture content or soil-water ratio, and expressed in terms of the pH scale. See also reaction, soil.

70
Plastic limit – see under Atterberg Limits. Plasticity index – see under Atterberg Limits. Pore-size distribution – the volume of the various sizes of pores in a soil, expressed as
percentages of the bulk volume (soil plus pore space). Reaction, soil – the degree of acidity or alkalinity of a soil, usually expressed as a pH
value. Descriptive terms commonly associated with certain ranges in pH are: extremely acid, <4.5; very strongly acid, 4.5-5.0; strongly acid, 5.1-5.5; moderate acid, 5.6-6.0; slightly acid, 6.1-6.5; neutral, 6.6-7.3; slightly alkaline, 7.4-7.8; moderately alkaline, 7.9-8.4; strongly alkaline, 8.5-9.0; and very strongly alkaline, >9.1.
Regolith – the unconsolidated mantle of weathered rock and soil material on the
earth’s surface; loose earth materials above bed-rock and approximately equivalent to the term “soil” as used by many engineers.
Self-mulching soil – a soil in which the surface layer becomes so well aggregated that
it does not crust and seal under the impact of rain, but instead serves as a surface mulch upon drying.
Sodic soil – a soil containing sufficient exchangeable sodium to interfere with the
growth of most crop plants, or a soil in which the sodium-absorption ratio of the saturation extract is 15 or more.
Tilth – the physical condition of soil as related to its ease of tillage, fitness as a
seedbed, and its hindrance to seedling emergence and root penetration. Tors – large rounded blocks of stone exposed on the surface, usually on higher parts
of the landscape. Commonly formed in rocks which are strongly jointed such as granite and ganodiorite.
Unified soil group – a classification of soils for engineering purposes (see also Section
14.4). Water-table – the upper surface of ground water or that level below which the soil is
saturated with water; locus of points in soil water at which the hydraulic pressure is equal to atmospheric pressure.
Water-table, perched – the water-table of a saturated layer of soil which is separated
from an underlying saturated layer by an unsaturated layer.
71
PART IV BIBLIOGRAPHY
References quoted in the Guidelines, useful general references and number of land study reports are listed. Alley, NF (1980) Air photo interpretation as an aid to land capability assessment. (Internal report). Soil Conservation Authority : Melbourne. Costello, RT (1978) Land capability assessment of the Glenmaggie Planning Scheme Area. (Internal report). Soil Conservation Authority : Melbourne. FAO (1973) Soil Survey Interpretations for Engineering Purposes. Soils Bulletin 19. Food and Agriculture Organization of the United Nations : Rome. FAO (1974) Approaches to Land Classification. Soil Bulletin 22. Food and Agriculture Organization of the United Nations : Rome. FAO (1976) A Framework for Land Evaluation. Soil Bulletin 31. Food and Agriculture Organization of the United Nations : Rome. Garden, FH & Feehan, PJ (1978) Soil conservation theory. (Course notes for Certificate of Applied Science). Soil Conservation Authority : Melbourne. Gibbons, FR (1976) A study of overseas land capability ratings – A report of visits to USSR, England, France, Netherlands, Canada and USA. Soil Conservation Authority : Melbourne. Goosen, D (1976) Aerial photo-interpretation in soil survey. Soils Bulletin 6. Food and Agriculture Organization of the United Nations : Rome. Howe, DT, Costello, RT & Russell, L (1979) Westernport Bay Catchment Project: Land Capability for Urban and Related Uses in the Berwick-Pakenham Area and the Shire of Hastings. Soil Conservation Authority : Melbourne. Ingles, OG & Metcalf, JB (1972) “Soil Stabilization” (Butterworths : Melbourne).
72
Israelsen, OW and Hansen VE (1962) “Irrigation Principles and Practices”, 3rd edition. John Wiley & Sons, Inc. p. 447. Jeffery, PJ, Costello, RT & King, P (1979) A study of land capability in the Shire of Bungaree. (Internal report). Soil Conservation Authority : Melbourne. Kessler, J and Oosterbaan, RB (1974) Determining hydraulic conductivity of soils. In: Drainage Principles and Applications, Publication 16, Vol. III, Ch. 24, pp 254-296. International Inst. for Land Reclamation and Improvement, Wageningen, The Netherlands. Neil, RC & Scales, PI (1976) Terrain evaluation, soil assessment and infra-structure coasting in the strategic planning of new cities. Institution of Engineers, Australia. Proceedings of the annual conference, Townsville 1976, pp. 46-50. Northcote, KH, Hubble, GC, Isbell, RF, Thomson, CH and Bettenay, E (1975) “A description of Australian Soils”, Wilke & Co. Ltd, Clayton, Vic. Northcote, KH (1979) “A Factual Key for the Recognition of Australian Soils” 4th Edn. Rellim Tech. Publ., Glenside, SA. Pitt, AJ, Howe DF & Jakimoff AW (1977) A study of the land and its capabilities in selected coastal areas (Internal report). Soil Conservation Authority : Melbourne. Ransom, MJ, Harris, A and White, B (1979) Mt Dandenong Foothills land capability study – Kilsyth Study Area. (Internal report). Soil Conservation Authority : Melbourne. Russell, LD (1979) Land Capability Assessment of the Creswick Water Supply Catchments. (Internal report). Soil Conservation Authority : Melbourne. Soil Survey Staff USDA (1966) Aerial photo-interpretation in classifying and mapping soils. Agriculture Handbook 294. USDA Soil Conservation Service : Washington, DC. Soil Science Society of America (1971) Glossary of Soil Science Terms. Soil Science Society of America : Madison, USA. Stace, HCT, Hubble, GC, Brewer, R, Northcote, KH, Sleeman, JE, Mulcahy, MJ and Hallsworth, EG (1968) “A Handbook of Australian Soils”, Rellim Tech. Publ., Glenside, SA
73
Talsma, T and Hallam, PM (1980) Hydraulic conductivity measure of forest catchments. Aust. J. Soil Res., Vol. 18, No. 2, pp 139-148. United States Department of Agriculture (1972) Soil Survey Interpretation. From SCS Soils 5. USDA Soil Conservation Service : Washington, DC. United Sates Department of Agriculture (1968) Soils Surveys for Recreation. Soils Memorandum 69. USDA Soil Conservation Service : Washington, DC.