guidelines eq.pdf
TRANSCRIPT

GOVERNMENT OF INDIA CENTRAL WATER COMMISSION
GUIDELINES FOR PREPARATION AND SUBMISSION OF
SITE SPECIFIC SEISMIC STUDY REPORT OF RIVER VALLEY PROJECT TO
NATIONAL COMMITTEE ON SEISMIC DESIGN PARAMETERS
Secretariat of National Committee on Seismic Design Parameters FE&SA Directorate, 712 (S), Sewa Bhawan, R.K. Puram
New Delhi 110605
(October 2011)
NCSDP Guidelines: 2011
Central Water Commission
NCSDP Guidelines: 2011
FOREWORD
Ministry of Water Resources had constituted a high level inter‐disciplinary official body, the “National Committee on Seismic Design Parameters (NCSDP) for River Valley Projects” in 1991 (formerly known as Standing Committee) to recommend the site specific design seismic parameters for design of dams and other appurtenant structures of the river valley projects. The site specific reports for determination of seismic parameters involve estimation of seismic parameters either using the deterministic seismic hazard analysis (DSHA) method or the probabilistic seismic hazard analysis (PSHA) method. Since both the approaches have their own strengths and weaknesses, they are required to be used in combination to arrive at the most appropriate engineering decisions. It may thus be advisable to provide the results from both the approaches and the Committee may take a view in every particular case. Therefore, an attempt has been made to formulate a document: “Guidelines for Preparation and Submission of Site Specific Seismic Study Report to National Committee on Seismic Design Parameters (NCSDP) for River Valley Projects”, to have in general, a uniform approach by different expert organizations for carrying out site specific seismic studies. As the input data on tectonic features, past seismicity and strong ground motion characteristics required for such studies are scanty in many cases, these guidelines shall go a long way to overcome these limitations till the required information becomes available in times to come.
I express my sincere thanks to all the present and Ex‐Members of NCSDP, officers from CWPRS, Pune, IIT, Roorkee and CWC for their invaluable contribution and cooperation in helping CWC to prepare these guidelines.
For this meticulous work, I express my gratitude for sincere and untiring efforts made by Dr I D Gupta, Director, CWPRS, Pune, Dr H R Wason, Prof & Head, DEE, IIT‐R, Dr M L Sharma, Prof IIT‐R, Shri Manish Shrikhande, Associate Prof, IIT‐R, Shri C S Mathur, Chief Engineer (DSO), CWC, Dr B R K Pillai, Director, CWC and Shri S S Bakshi, Director, CWC & Member Secretary NCSDP for formulation of these Guidelines. I am also happy to acknowledge the support and cooperation of officers and staff of FE&SA Directorate of Dam Safety Organization, Central Water Commission in preparation of this document.
I am sure that these Guidelines will be helpful for the designs of various river valley projects of the country.
New Delhi October, 2011

Central Water Commission
NCSDP Guidelines: 2011
Contents
Page No.
Abbreviations
1.0 Scope 1
2.0 General Concepts and Guiding Principles 2
3.0 Data Requirements 5
4.0 Methodology 7
5.0 Recommendations on Design Approach 17
6.0 Submission of Study Report for NCSDP Approval 19
7.0 Presentation of Study Report Before NCSDP 20
Annexure A Illustrative Example : DSHA Method for Developing Target Response Spectra
21
Annexure B Illustrative Example : PSHA Method for Developing Target Response Spectra
23
Annexure C Proforma for Submission of Study Report to NCSDP
27
Annexure D Bibliography
29

Central Water Commission
NCSDP Guidelines: 2011
ABBREVIATIONS
DBE Design Basis Earthquake
DSHA Deterministic Seismic Hazard Analysis
ICOLD International Committee on Large Dams
IS Indian Standard
LET Local Earthquake Tomography
MCE Maximum Credible Earthquake
MCM Million Cubic Meters
MPa Mega Pascal
MT Magnetotellurics
NCSDP National Committee on Seismic Design Parameters
NGA Next Generation Attenuation
OBE Operating Basis Earthquake
PGA Peak Ground Acceleration
PSHA Probabilistic Seismic Hazard Analysis
Sa Spectral acceleration
SEE Safety Evaluation Earthquake
SGM Strong Ground Motion
SSZ Seismic Source Zones

NCSDP Guidelines: 2011 Page 1
GUIDELINES FOR PREPARATION AND SUBMISSION OF SITE SPECIFIC SEISMIC STUDY REPORT OF RIVER VALLEY PROJECT TO
NATIONAL COMMITTEE ON SEISMIC DESIGN PARAMETERS
1.0 SCOPE
1.1
These guidelines deal with the preparation of site specific seismic study report of a river valley project and its submission to the National Committee on Seismic Design Parameters (NCSDP) for necessary approval. The guidelines will help in estimation of parameters to be used in seismic design, analysis and safety evaluation of new or existing dams and their appurtenant structures. It is also expected that the guidelines will bring uniformity in site specific seismic studies being carried out by different expert organizations.
1.2
The site specific seismic studies need to be carried out and submitted for the approval of NCSDP in respect of all such river valley project/dams that are classified under ‘high’ or ‘extreme’ hazard potential categories. However, the uniform hazard potential categorization criteria for dams in India are yet to be formulated and approved by the ‘National Committee on Dam Safety’. Till such time the hazard categorization criteria is not in place, it will be mandatory, for the large dams1 that fall in seismic zone III, IV or V to get the approval of NCSDP for site specific seismic studies for the assessment of design earthquake parameters. However, for the projects in seismic zone II, the approval of NCSDP for the site specific seismic studies will be mandatory for such dams that are more than 30 meters in height.
1.3
The basic provisions of the guidelines are applicable for the river valley projects and its appurtenants structures, and also for the powerhouse and such other structures located in the vicinity of dam whose failure can result in an uncontrolled release of water from the reservoir. The term ‘dam’ used here shall mean any artificial barrier meant to impound or divert water, and is inclusive of gravity dam, arch dam, embankment dam, barrage, weir, bund etc. However, the provisions of the guidelines need not be applied in case of project canals and canal structures, and also not in case of temporary structures such as coffer dams.
1.4 There is no intrinsic difference in the methodology of selecting earthquake parameters for design of new dams or safety evaluation of older dams. The rehabilitation of existing structures which are designed on the basis of standard earthquake principles may not call for fresh site specific seismic studies unless new seismic activity are reported in or around the project sites. However, rehabilitation cases involving dams that are not investigated or designed as per the modern engineering practices may require site specific seismic studies.
1.5
The site specific seismic studies which are not mandated as per above conditions need not be referred to NCSDP unless directed otherwise by a government or judicial authority. In all such exempt cases, the selection of seismic design parameters will continue to be governed by the Indian Standard 1893 (Part 1) – Criteria For Earthquake Resistant Design Of Structures2.
1 A large dam is one more than 15m high( above the deepest foundation level) or one between 10m and 15m high satisfying one of the following criteria: (a) more than 500m long; (b) reservoir capacity exceeding 1x10⁶ m3; (c)spillway capacity exceeding 2000 m3/sec
2 Pending finalization of Parts 2 to 5 of IS 1893, provisions of Part I will be read along with the relevant clauses of IS 1893: 1984 for structures other than buildings

Central Water Commission
NCSDP Guidelines: 2011 Page 2
1.6
For design criteria other than those related to seismic design parameters, reference may be made to the Indian Standard IS 1893 (Part 1)3.
2.0 GENERAL CONCEPTS AND GUIDING PRINCIPLES
The site specific seismic study for a river valley project requires an understanding of the seismic scenario with regard to dam site, which includes geological setting of the area, tectonic features and the history of earthquake occurrence in the region. The study enables evaluation of design ground motion based on identifiable seismic source zones and appropriate ground motion attenuation laws. The general concepts and principles used in such study are given below.
2.1 Seismic Source Zones
For the assessment of design earthquake source parameters, it is necessary to identify the probable Seismic Source Zones (SSZ) where catastrophic ruptures will generate earthquakes at a site in prevailing tectonic environment, and adopt a pragmatic approach to evaluate the likely maximum magnitude of the event which could occur in future.
The delineated SSZ has to be considered to represent a zone of structural (tectonic) features for occurrence of future earthquakes. The probable maximum seismic potential of the SSZ is generally controlled by the area under strain build‐up, governing the length and breadth of the seismic rupture, strength and deformation characteristics of the rock, stress drop, and failure mechanism. The seismic potential is rated in terms of the magnitude of the events, and the maximum magnitude thus corresponds to the probable maximum rupture parameters. If there are two, three or more seismogenic features which can influence the ground motion at the site, all these should be considered as potential sources for the purpose of analysis.
The damage due to earthquake is a measure of the earthquake intensity at any site, and it depends on the distance and energy released from the rupture within SSZ.
2.2 Design Earthquakes
2.2.1 The largest believable earthquake that can reasonably be expected to be generated by specific seismic sources (SSZ) in a given seismo‐tectonic framework is referred to as Maximum Credible Earthquake (MCE) for that SSZ. This is the largest event that could be expected to occur in the region under the presently known seismo‐tectonic environment; and the structural system, if designed on this basis, would prove to be highly uneconomical. Therefore a Design Basis Earthquake (DBE), which would have a reasonable chance of occurrence during the life time of the structure, is also evaluated keeping in mind the degree of safety required.
2.2.2 Maximum magnitude of the events which could occur in a SSZ is evaluated from data on earthquake occurrences. If data is available for sufficiently long duration, the highest magnitude of the known event of past with suitable increment is generally adopted as the maximum magnitude of MCE for that source. For regions with poor documentation of historical events, an appropriate increment is added to the highest magnitude of the known event for evaluation of MCE to account for the incompleteness of seismicity catalog The deterministic approach for determination of MCE practically ignores the return period of the
3 ibid 2

Central Water Commission
NCSDP Guidelines: 2011 Page 3
event. The MCE level of ground motion can also be evaluated using an appropriate approach similar to that given in ICOLD bulletin 89 (revised).
2.2.3 The DBE represents that level of ground motion at dam site at which only minor and easily repairable damage is acceptable. Since the consequences of exceeding the DBE are mainly economic, theoretically DBE shall be determined from an economic analysis. However, from practical considerations the DBE is chosen for a certain return period of the ground motion. For the occurrence of earthquake shaking not exceeding the DBE, the dam, appurtenant structures and equipment should remain functional and damages should be easily repairable.
2.2.4 In the recently adopted ICOLD guidelines (Selecting Seismic Parameters for Large Dams, 2009), the terminologies of Safety Evaluation Earthquake (SEE) and Operating Basis Earthquake (OBE) have been used in place of MCE and DBE. There is no intrinsic difference in the definition or usage of OBE vis‐à‐vis DBE. However, the usage of SEE has been characteristically different than MCE on account of application of a probabilistic approach wherein the choice of return period of event is linked with hazard potential categorization of dam. Change over from MCE‐DBE terminologies to SEE‐OBE terminologies is considered desirable; but, the same has been deferred till adoption of the uniform hazard potential categorization criteria for dams in India.
2.3 Seismic Evaluation Parameters
2.3.1
Ground motion at any site is influenced by source, transmission path and local site conditions. The factors responsible for ‘source effect’ include fault type, rupture dimensions, mechanism and direction, focal depth, stress drop and amount of energy released. The ‘transmission path effect’ relates to the geometric spreading and absorption of earthquake energy as the seismic wave travel away from the source; and the responsible factors include rock type, regional geological structures including surface faults and folding, crustal in‐homogeneities, deep alluvium, and directivity effects (direction of wave travel vs direction of fault rupture propagation). The ‘local site effect’ results from the topographic and soil conditions present at the site.
Ground motion can be characterized by peak values of expected acceleration, velocity, and/ or displacement. Ideally, all factors affecting ground motion should be considered for evaluation of these parameters; but this is not practical. Generally, one source factor (magnitude) and a single transmission path factor (distance) only are considered. The local site effects are often disregarded, or limited to simple distinction between rock and alluvial sites and possible consideration of near‐field effects. Empirical relations derived from available earthquake data (attenuation relations) relate ground motion parameters to distance from the source and to magnitude.
2.3.2
Attenuation relations: Attenuation relations are empirical relations developed from Strong Ground Motion (SGM) measurements, and are used for the prediction of expected ground motion and its intrinsic variability at the project site. Such predictions are generally performed using ground‐motion models that describe the distribution of expected ground motions as a function of a few independent parameters, such as magnitude, source‐to‐site distance and site classification. The distribution of expected ground motions described by any one ground‐motion model is given in terms of median spectral amplitudes and associated standard error/deviation usually referred to as aleatory uncertainty. The seismic hazard studies should

Central Water Commission
NCSDP Guidelines: 2011 Page 4
need to account for both these uncertainties in the relations.
Ideally, the attenuation relation to be used for a particular site should be developed using the recorded strong‐motion data in the region around the site of interest. However, due to paucity of strong motion data in India, such relations are not available for different parts of the country. In practical engineering applications, it thus becomes necessary to identify suitable relations from the published literature.
2.3.3 Duration of shaking: The strong motion duration is important from the point of view of response behavior of the structure being examined, and it largely depends on the earthquake magnitude and also on the distance and site condition to some extent. The strong‐motion duration is a function of the frequency and represents the sum total of the durations of all the strong motion segments contributing 90% of the energy of complete motion (Trifunac and Brady, 1975). Duration of strong shaking is an important parameter for dam safety because of its direct relation to damages, especially in case of embankments.
2.3.4 Response spectrum: The response spectrum represents the maximum response (in absolute acceleration and relative velocity or relative displacement) as a function of natural time period, for a given damping ratio, of a set of single‐degree‐of‐freedom (SDOF) systems subjected to a time dependent excitation.
It is customary to represent computed response of SDOF system to a particular ground motion in the form of elastic spectra. These spectra show the response quantity (e.g. absolute acceleration) against the natural periods of SDOF systems for different values of damping. Since there are peaks and valleys in the spectra thus computed, the vagaries are ironed out as far as possible by the smoothened spectra. Response spectrum characterizing the MCE or DBE has to be site specific.
The number of damping values for which response spectra should be specified to represent the MCE or DBE level of ground motion should encompass a range of values applicable to the type of dam and level of ground motion considered. Damping values for analysis of concrete and masonry dams may be taken as 5 and 7 percent respectively when the response is assumed to be predominantly elastic. Damping values for the analysis of embankment dams may be taken as 10 to 15 percent.
2.3.5 Acceleration time histories: The seismic parameters in terms of peak values and spectral characteristics are sufficient for analysis of many dams. However, in case of dams with high or extreme hazard potentials, and for use of non‐linear analysis techniques, the specification of earthquake motion in time domain (as acceleration time history records) is also required. Acceleration time histories may be specified for horizontal and/or vertical motion and should preferably be represented by real accelerograms obtained for site conditions similar to those present at the dam site under consideration. However, since strong ground motion data currently available do not cover the whole range of possible conditions, this is essentially an exercise in generation of random waveforms (keeping in view the duration of the ground motion and the general pattern of ground motion history) which are synthetic in nature. Several time histories could be generated to match the same target response spectrum, and all of these would be equally acceptable from the point of seismic considerations.

Central Water Commission
NCSDP Guidelines: 2011 Page 5
2.4 Deterministic and Probabilistic Analysis Approaches
The two general approaches for developing the site‐specific response spectra are the deterministic seismic hazard analysis (DSHA) and the probabilistic seismic hazard analysis (PSHA) methods. The basic inputs required for both the approaches are the same, which include data on past seismicity, knowledge of the tectonic features, geological and morphological setup, geophysical anomalies, information on site soil condition and the underlying geology of the surrounding area, and the attenuation characteristics of the strong‐motion parameter to be used for quantifying the hazard. The treatment of seismicity data for homogenization, completeness with respect to time and size, and de‐clustering are required before proceeding with any of the approaches.
2.4.1 In its most commonly used forms, the DSHA approach proposes design for the so‐called "scenario" earthquakes (MCE). The underlying philosophy is that "scenario" earthquake of the seismic source is scientifically reasonable and is expected to produce most severe strong ground motion at the dam site. One of the most important issues is the reliable estimation of the MCE, for each of the identified seismic source zones, on the basis of the available data on past earthquakes and the seismotectonic and geological features of a SSZ. However, the delineation of the SSZ, the estimation of MCE magnitudes, as well as the estimation of the corresponding ground motion at a certain distance from the earthquake source, are commonly associated with large uncertainties. The DBE level of deterministic ground motion is generally taken as an appropriate fraction (say 0.5) of the MCE level of motion.
2.4.2 The PSHA approach provides a structure in which uncertainties can be identified, quantified and combined in a rational approach to provide a combined effect of several alternate seismic sources on seismic hazard at a site. Thus, there are multiple scenarios and models for hazard analysis applicable at a given site. The PSHA carries out integration over the total expected seismicity to provide the estimate of a ground motion with a specified return period. The MCE level of ground motion is proposed to be defined with a return period of about 2500 years, whereas DBE level of ground motion is defined with a much lower return period of about 145 years.
3.0 DATA REQUIREMENTS
The primary data for identification of potential sources of earthquakes and evaluation of their characteristics pertain to the tectonic, geologic and seismic activity conditions at, and in the vicinity of, the dam site. The study should consider the regional aspects, and then focus on the local site conditions, so as to fully understand the overall geologic setting and seismic history of a particular site.
The below mentioned information need to be compiled by getting inputs from various organization or institute and published standard literature for the assessment of seismic design parameters.
3.1 Regional Geologic/ Seismotectonic Setting
• Seismotectonic map: A seismotectonic map of 1: 1000,000 or comparable scale, depicting geology, structures (with emphasis on nature and extent of major faults, shear zones etc) and seismicity (as detailed in para 6.2 & 7.1) for an area about 300 km radius from dam site should
Central Water Commission
NCSDP Guidelines: 2011 Page 6
be used ( i.e. about 60 latitude x 60 longitude with the dam site at the centre). Location and description of faults and shear zones and assessment of the capability of faults to generate earthquakes should be furnished. This should include documentation on the existence of or the lack of historical or pre‐historical activity (paleoseismicity) for each major fault.
• Seismotectonic section: At least one regional seismotectonic section through the dam and across the major tectonic trend (based on 6.1.1) of the region should be prepared. The section covering a minimum 50 km reach on either side of the dam should clearly show (if necessary, by vertical exaggeration) the subsurface disposition of the major faults and earthquake hypocenters.
3.2 Seismic History
• Earthquake catalogue: The earthquake catalogue should contain information about origin time (date/ time), location (latitude/ longitude/ depth), and size (magnitude / type of magnitude / intensity) of earthquake from the historical time to present time for an area of about 300 km radius from dam site. This data may be obtained from IMD and updated on the basis of other authentic sources. To the extent possible, information on focal mechanism, felt area, accompanying surface effects, known or estimated intensity of ground motion induced at the dam site, and the source of data and its reliability, should also be presented for all major events.
• Micro earthquake investigations: For dams exceeding the height of 100 m, the details of micro earthquake data recordings around the dam site within a radius of 50 km should be provided incorporating full catalogue information for a period of at least six months. Such data should be observed /collected by the project authorities.
3.3 Local Geologic Setting
• Geological map: For dams higher than 200m and located in seismic zone IV or V (as per IS 1893 Part 1 (2002) a geological map (based on photo‐geology/imagery studies and ground mapping) on 1:50,000 to 1:60,000 scales should be prepared for an area of 50 km radius from the dam site with special emphasis on gross lithological (or stratigraphical/tectono‐stratigraphic) domains, structural details like faults, folds, shear zones, master joints, structural trend lines and lineaments etc. Geomorphic and/or evidence from Quaternary Geology (if any) within the influence area indicating presence of active fault should be documented. Geological evidences wherever available on the nature of movement along the fault vis‐à‐vis the age of such movement should be indicated. A short descriptive account on the various litho‐stratigraphic units and structural elements should be included.
• Surface and subsurface exploration: The report of exploration should contain local geological map(s) of the dam site and other appurtenant structures on 1:1000 or larger scale along with topographic contours. The report should also include geological sections along and across dam axis The geological sections should be derived through drilling and other geo‐physical probing, and they should show depth to overburden, faults, shear zones etc. The compressional‐wave velocity (Vp) and shear‐wave velocity (Vs) of at least 30 m below the major structures (dam, power house etc.) should be provided.

Central Water Commission
NCSDP Guidelines: 2011 Page 7
• Additional inputs on subsurface configuration of major faults: For dams of height exceeding 200 m and located within seismic zone IV or V, additional inputs on the subsurface configuration of major faults within 50 km radius of the dam site should be provided based on Local Earthquake Tomography (LET) / Magnetotelluric (MT) studies or any suitable methodology may be adopted, details of which should also be furnished.
4.0 METHODOLOGY
The site specific seismic design parameters will depend on many variable factors. It is an extremely difficult task to determine the exact parameters in view of uncertainties related to: [a] choice of earthquake parameters (namely magnitude, distance, focal depth and mechanism) related to MCE and DBE; [b] choice of ground motion attenuation relationship for computing spectral accelerations and [c] the elastic modulus, shear modulus and damping characteristics of the material used in construction. In view of above, it is important to exercise a judicious balance in various steps involved in the study. The mentioned guidelines below are expected to facilitate this process for the meaningful, reliable and safe design of river valley projects in the given seismic environment.
4.1 Selection of Earthquakes for Analysis
All geological maps and data (as specified in section 6) should normally be studied to determine active seismic features.
A table giving the list of earthquakes with period wise break‐up (historical to 1900; 1901 to 1963; 1964 to present) should be prepared. For earthquake data subsequent to 1964, the type of magnitude (i.e. MW, Ms, mb, ML, MD etc) and focal depth should be given; the ‘a’ and ‘b’ values from Guttenberg‐Richter (G‐R) relation should be calculated through regression analysis, preferably using maximum likelihood method and the Mmax for a specified recurrence period should be indicated using ‘a’ and ‘b’ values for each identified seismic source zone as well as for the region as a whole.
The appropriate distance consistent with attenuation relationship from postulated scenario‐ earthquake from dam site should be tabulated. Efforts should be made to classify the corresponding faults based on its types of movement (i.e. normal, thrust, strike‐slip [dextral/ sinistral]) vis‐à‐vis the location of the structure (e.g., hanging wall, footwall, directivity in case of strike‐slip etc.). A floating earthquake approach should be adopted where seismogenic features in the vicinity of dam site are not known.
4.1.1 Magnitude of MCE: The MCE for a particular SSZ can be estimated from the catalogue of earthquakes in the area of 300 km radius around the dam site (i.e. about 60 latitude x 60 longitude with the dam site at the centre), using several different methodologies. The magnitude for MCE can be estimated using methods as under :
• incrementing the worst recorded earthquake, to account for incompleteness of catalog
• using ‘a’ and ‘b’ values of Guttenberg‐Richter relationship
• extreme value distribution using empirical relationship

Central Water Commission
NCSDP Guidelines: 2011 Page 8
• predicting magnitude of earthquake based on fault rupture dimensions4
The simplest method is to suitably enhance the worst recorded earthquake by an appropriate increment to account for incompleteness of data for arriving at MCE.
4.2 Selection of Attenuation Relations
Having chosen the design earthquake parameters of MCE or DBE shock in relation to project site, the next task is to obtain the ground motion characteristics at the site using empirical ground‐motion models (attenuation relations) which relate the response spectral amplitudes at different natural periods or frequencies of the structure to the governing parameter like earthquake magnitude, source to site distance and site geological conditions.
The selection of appropriate ground motion models for a particular target area from large number of published attenuation relations for other regions is not that easy. The selection process becomes complicated because there may be systematic differences in terms of seismic sources, wave propagation or site response between the target region and host region from where the data used to derive the model was obtained.
The goal is to identify the smallest set of independent models (out of the large number of models available in published literature) that capture the range of possible ground motions in the region under study. The criteria recommended for shortlisting the ground motion prediction model, arranged in the order of descending hierarchy, are as under:
• Model should be for a similar tectonic regime as it would clearly not be appropriate to use an equation derived for a subduction zone for hazard analysis in a region of crustal seismicity, and vice versa.
• Model is published in an international peer‐reviewed journal. The peer review process usually ensures that the models are clearly described and that basic tests (analysis of residuals, comparison with previous studies, etc.) have been performed. The models which have been extensively used and tested should be favoured.
• Documentation of model and its underlying dataset should be complete. The original dataset used in the study must be presented in the publication and the data processing must be described and the parameters used in regressions tabulated.
• Frequency range of the model should be appropriate for engineering applications. For some engineering applications where high frequencies (> 10 Hz) or low frequencies (< 0.3 Hz) are relevant, ground motion models derived from analog accelerograms may not provide reliable estimates, even if the authors of the model have presented regression coefficients for such frequencies.
• Model should be well constrained with dependence on all the governing parameters. The recently published models include a non‐linear magnitude scaling term to model magnitude saturation and also effect of possible non‐linear response of soil. Neglecting the non‐linearity in soil response may distort the shape of the attenuation function for soil sites.
4 Wells and Coppersmith 1994

Central Water Commission
NCSDP Guidelines: 2011 Page 9
Some typical attenuation relations being used are listed in Bibliography.
The choice of any particular attenuation relationship should be explained with complete references and narration of its merits. Further, the final selection should be based on the ranking criteria due to Scherbaum et al. (2004) using limited strong‐motion data, if available in the region of interest. For this purpose, it is proposed to divide the country into three regions for the identification of separate sets of attenuation relationships that are best suited for each region. The targeted three regions are (i) Himalayas, (ii) Ganga‐basin and (iii) Shield regions. Such an exercise will call for detailed examination of the geophysical criteria regarding the degree of similarity, or otherwise, between the host regions from where the candidate models have been derived and the three target regions.
Till the detailed study is carried out to identify the attenuation relations for the above mentioned three regions of India, the following information may be considered for the time being:
• The spectral acceleration values computed at various natural periods from different published attenuation relations when compared with the limited observed spectral amplitudes from a few Himalayan earthquakes, the relationships due to Abrahamson and Silva (1997) and Trifunac and Lee (1989) are seen to have the overall best matching with the observed data and may thus be considered suitable for the Himalayan region.
• Abrahamson and Silva have recently updated their relationship as a part of the Next Generation Attenuation (NGA) project using the PEER NGA database. The updated relationship has included the fault directivity and site effects more comprehensively, but it needs exact information about the fault rupture geometry, which is not available in most cases. The other NGA relations also need information on fault details to varying extent. Hence the NGA attenuation relations cannot be used without making some subjective assumptions leading to biased results. The earlier relation of Abrahamson and Silva may therefore have to be used for the Himalayan Region.
• Based on world wide data, Graizer and Kalkan (2009) have proposed an approach to obtain the response spectral shape considering the dependence on magnitude, distance, and site condition which can be scaled by the PGA. They have also developed an attenuation relation for PGA using the same database (Graizer and Kalkan, 2007). This approach is also considered suitable for the Himalayan region, because the PGA attenuation of Graizer and Kalkan (2007) is found to describe the available PGA data in Himalayan region quite well
• The relationship due to Trifunac and Lee (1989) has considered the dependence on the magnitude and distance in a physically realistic way in that the magnitude and distance saturation effects as well as the geometric spreading with distance are accounted for at each frequency. Also the influences of both the shallow local soil, as well as deep geological formations at the site, are included in this relationship. As no strong motion data is available for the Indo‐Gangetic plains, the relationship of Lee is proposed to be used for the region due to physically realistic dependence on various governing parameters.

Central Water Commission
NCSDP Guidelines: 2011 Page 10
4.3 Development of Target Response Spectra
For estimating the site‐specific design ground motion by deterministic as well as probabilistic approach, it is first necessary to obtain the response spectra of horizontal and vertical components of motion separately for a damping ratio of 5%. Such spectra are known as the target response spectra, and the ground motion acceleration time histories required for detailed dynamic response analysis are generated synthetically to be compatible with the target response spectra. Response spectra for other values of damping are then computed from these acceleration time histories. Target response spectra can be developed by the following three approaches:
(i) Scaling a standard spectral shape by PGA:
The response spectra of horizontal and vertical components of ground motion can be obtained conveniently by scaling a mean plus one standard deviation normalized spectral shape appropriate for the site of interest with the median peak ground acceleration. The standard spectral shape should be based on sufficiently large ensemble of strong motion records with magnitude and source‐to‐site distance close to the desired magnitude and distance of controlling MCE. The PGA can be estimated by deterministic or probabilistic approach.
(ii) Using spectral amplitude at selected periods (say 0.2 and 1.0 sec):
The response spectral amplitudes at natural periods of 0.2 sec and 1.0 sec along with PGA can be estimated using an appropriate attenuation relation from deterministic or probabilistic approach. Median or median plus one standard deviation values (depending upon the seismicity of the region) of all these parameters has to be used in the deterministic approach and with a return period of 2500 years in the probabilistic approach to get the MCE level of spectra.
The control period T2 which marks the beginning of the constant velocity range is then obtained as the ratio of the pseudo‐spectr ac ion at 1.0 and 0.2 sec as followsal celerat
T S 1.0sS 0.2s
5:
x 1s
The control period T1 which marks the beginning of constant acceleration range is obtained as a fraction of T2 depending on the soil classific tion s: a a
T12
to 15 x T
with the factor 1/2 corresponding to very soft soil and 1/5 corresponding to massive rocks. For most of the project sites the actual factor will be between these two extreme values (0.2‐0.5). The psuedo‐spectral acceleration is considered to increase linearly from PGA value at period T0= 0.03 sec to its maximum value at T1. The maximum value of the psuedo‐spectral acceleration obtained at Tn=0.2 sec is held constant from period T1 to T2. For periods less than
5 P K Malhotra- Return period design ground motions. Seismological Research Letters, 76(6):693-699,2005.

Central Water Commission
NCSDP Guidelines: 2011 Page 11
T0 the psuedo‐spectral acceleration is considered to be the same as the PGA.
The psuedo‐spectral velocity is held constant at S T S T x Tπ in the range from
periods T2 to T3. The constant velocity range is considered to extend upto T3 = (6 to 9) × T2 , with the factor 6 corresponding to massive rocks and 9 corresponding to very soft soil, after which the constant displacement (or linear psuedo‐spectral velocity with negative slope) range begins. For strong earthquakes, the constant displacement range of the response spectrum in the near field generally begins between 3sec and 4sec. The constant psuedo‐spectral displacement is obtained from the psuedo‐spectral velocity at T3 as
S T S T x T2π S T x
T2π
x T2π
The tripartite plot of response spectrum is shown in fig 1
Figure 1: Response spectrum—tripartite plot (log scale)
Central Water Commission
NCSDP Guidelines: 2011 Page 12
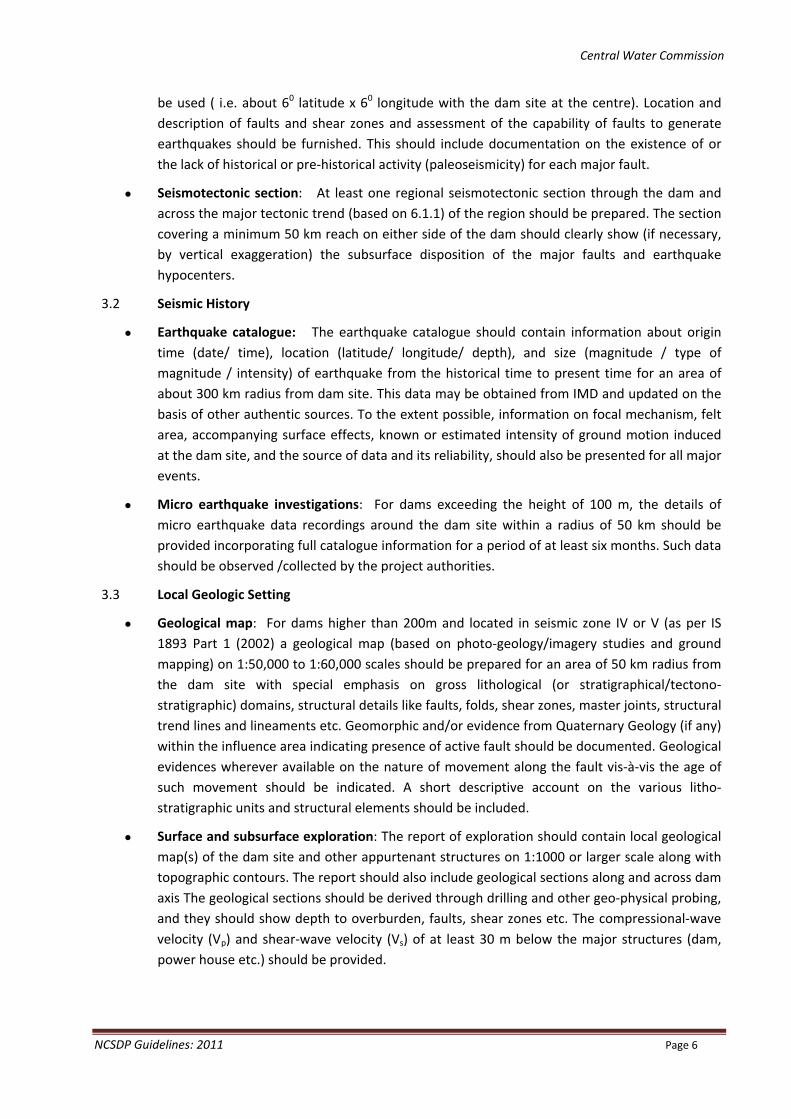
The tripartite format of design spectrum is not very convenient to use in practice and therefore, it is necessary to translate it into a linear plot of pseudo‐spectral acceleration (Spa) versus natural period (T ). For a response spectrum in tripartite format (as shown in Fig. 1), the pseudo‐spectral acceleration (S ) may be p as nction of the natural period (T ) as:
rescribed a fu
S T PGA x
1 ; T TT T⁄ ; T T T A ; T T TV T⁄ ; T T T
D T⁄ ; T T
The parameters α, A, V and D are described as below:
S T S T
T T 1;
A S TPGA
S TS T
;
V 2π x S TPGA
D 2π x T xS TPGA
;
The pseudo‐acceleration design spectrum specified by the above equation and coefficients is shown in Fig. 2. The positions of the control periods of the equation have been marked in these figures. It may be seen that while the pseudo‐acceleration spectrum plot in linear scale has different curves, the tripartite plot in logarithmic scales is well defined by a set of straight lines between different pairs of control periods. Therefore, the above equation of pseudo‐acceleration design spectrum is derived from the corresponding equations of straight lines of pseudo‐velocity spectrum on the tripartite plot.
Figure 2 : Pseudo‐spectral acceleration (linear scale)

Central Water Commission
NCSDP Guidelines: 2011 Page 13
(iii) Using frequency dependent attenuation relationships: The attenuation relations used for estimating the PGA or spectral amplitude at 0.2 and 1.0 sec in the above two methods are generally defined for a large number of natural periods covering the entire frequency range necessary to define the complete response spectrum. Thus, by estimating the spectral amplitude at all the natural periods for which the attenuation relation is defined, it is possible to obtain the complete response spectrum without making any assumptions. This can be done by using both deterministic as well as probabilistic methodologies.
4.3.1 DSHA Methodology for Developing Target Response Spectra
In commonly used deterministic approach for developing the response spectra for a dam site, one has to first assess the maximum possible earthquake magnitude for each of the seismic sources (important faults, shear zones, thrusts etc) in the project area of interest (generally about 60 latitude x 60 longitude with the dam site at the centre). Such an earthquake is commonly termed as Maximum Credible Earthquake (MCE), which is the largest earthquake that can be supported by each source under the site specific seismotectonic framework. The MCE for each seismic source is then presumed to occur at a location that places the focus at the minimum possible distance to the project dam site which the source geometry permits. The response spectra for each MCE can then be developed using an appropriate attenuation relation. The zero‐period spectral value is the peak ground acceleration, i.e., zero‐period spectral acceleration (ZPA) = PGA. The worst combination of the magnitude and distance of MCE is normally considered to get the MCE level of design ground motion. The target spectrum for MCE condition may be taken as at median plus one standard deviation level for project sites in regions of high seismicity (Seismic Zone IV and V as per IS:1893‐2002) because of relatively short return periods of large earthquakes and to account for the scatter in recorded earthquake data. For the low seismicity regions (Seismic Zones II and III as per IS:1893‐2002), the recurrence interval of MCE level earthquakes is very large and therefore the MCE target spectrum for project sites in these regions may be taken as median estimates. This is to maintain approximately uniform level of seismic risk across the entire country. The target response spectra for Design Basis Earthquake (DBE) condition may be taken as one standard deviation less than the corresponding MCE target spectra, or half of MCE target spectra, whichever give higher amplitude at natural period of interest. An illustrative example of the foregoing methodology is given in Annexure A
4.3.2 PSHA Methodology for Developing Target Response Spectra
The probabilistic seismic hazard analysis (PSHA) approach is based on an altogether different philosophy and concept compared to the deterministic seismic hazard analysis (DSHA) approach for arriving at site‐specific design earthquake ground motion for important engineered projects. The DSHA aims at estimating the possible maximum value of the ground motion amplitudes by considering a maximum magnitude of earthquake to occur at the shortest source‐to‐site distance, irrespective of the probability of such an occurrence, which

Central Water Commission
NCSDP Guidelines: 2011 Page 14
remains unknown and unquantified. The PSHA on the other hand aims at estimating the ground motion amplitudes having a desired annual probability (p) of exceedance due to any of the earthquakes expected to occur anywhere in the region around the project site. The return period Tr (years) is equal to reciprocal of the annual probability (p) of exceedance. Thus, a probability of exceedance equal to 0.001 represents a return period of 1000 years for the ground motion. The ICOLD guidelines (2010) specify the return periods of 10,000 years, 3,000 years and 1,000 years for the MCE level of ground motion for dams with three different risk levels to the downstream population. The PSHA approach can also be used to obtain the return period corresponding to the deterministic estimate of the ground motion for comparison with the return periods proposed by ICOLD guidelines and taking appropriate decisions about the suitability of the deterministic estimate.
Details on the currently used PSHA approach can be read from Cornell (1968), EPRI (1987), Reiter (1990), SSHAC (1997), USACE (1999), Gupta (2002), McGuire (2004), etc. The basic PSHA approach is based on computing the following annual probability of exceedance of a specified measure of the ground motion amplitude (e.g. the acceleration response spectrum amplitude SA(T) at natural period T):
Here, is the annual probability of exceeding a spectral amplitude SA(T) due to any of the earthquakes in any of the source zones, νn ( , ) is the annual occurrence rate of
earthquakes of magnitude at source‐to‐site distance in each of the seismic source zones
around the project site, and | , is the probability of exceeding the spectral
amplitude SA(T) due to magnitude and distance combination ( , ) in the nth source zone.
The plot of SA(T) vs is known as the ‘Hazard Curve’. By computing the hazard curves for all the natural periods T, the design response spectrum can be obtained with a desired annual probability of exceedance (or recurrence period) at all the periods. Such a spectrum is known as “Uniform Hazard Response Spectrum”.
1 | , . ,
The various steps involved in computing the hazard curves to implement the PSHA approach can be summarized as below:
Step‐1: Delineation of Seismic Source Zones
The first step in PSHA is to identify and delineate various seismic source zones (SSZ) within a
region of 6° lat × 6° long with the dam site at the center, where a SSZ represents the portion of earth’s crust with distinctly different characteristics of earthquake activity ( in terms of frequency & max potential) from those of the adjacent crust. Though fault specific seismic sources can be used in some cases, due to lack of close correlation of observed seismicity with known faults, extended area type of sources is used more commonly in practical applications. It may be noted that delineation of seismic sources cannot be considered free from some element of subjectivity.
Central Water Commission
NCSDP Guidelines: 2011 Page 15
Step‐2: Estimating Seismicity of a Source Zone
The Gutenberg and Richter’s (1944) recurrence relationship log , where N(M) represents the cumulative number of earthquakes per year with magnitude M or greater, is fitted to each seismic source in step 2 using available past earthquake data. The catalogue data may be treated for removal of foreshocks and aftershocks, homogenization of magnitude to either Mw or Ms and correction for incompleteness in size and time. This is then used to obtain the occurrence rate n( ) of earthquakes in magnitude interval ( – δ , + δ ) by
discretizing the complete magnitude range between a minimum threshold magnitude and the maximum upper bound magnitude. These numbers are finally distributed over the entire source zone by dividing it into a large number of small size elements to get the annual occurrence rate ν ( , ), where refers to the distance to the center of the ith source
element.
Step‐3: Estimation of Probability qn[SA(T) I , ]
An attenuation relationship suitable for the region of interest is selected in step 3, which describes the response spectral amplitudes in terms of earthquake magnitude, source‐to‐site distance, and site geologic condition. Such a relation is able to provide the least squares median estimate and the corresponding probability distribution of the residuals for specified earthquake magnitude and source‐to‐site distance , which can readily be used to
estimate the probability qn[SA(T) I M , R ]. A single attenuation relation may normally be
applicable to all the source zones, but different relations may also be used, if necessary.
Step‐4: Computation of Uniform Hazard Spectrum The fourth and the final step in the PSHA approach is to compute the hazard curves, i.e. probability distribution p[SA(T)], by carrying out the summations over all the magnitudes and distances in all the source zones. A uniform hazard response spectrum is obtained by computing the p[SA(T)] for all the natural periods of interest and estimating the corresponding spectral amplitudes with a desired annual probability of exceedance (or return period). An illustrative example of the foregoing methodology is given in Annexure B
4.4 Determination of Site‐specific Seismic Coefficients
With the knowledge of the natural period of the dam section, the response spectra can be used to obtain the site‐specific seismic coefficients. The type and preliminary section of the dam, the computational formula, and other assumption made in the computation of natural period should be furnished in the study.
4.4.1 Horizontal seismic coefficient: For the computed natural period of the dam section, find the spectral amplitude for DBE using the 5% damped spectrum for the concrete/masonry dam and
10 % damped spectrum for earthen and rockfill dams. The horizontal seismic coefficient αh
may be taken as a fraction (say 0.5) of the spectral amplitude obtained as above, however not less than that obtained as per IS‐1893 (1984).

Central Water Commission
NCSDP Guidelines: 2011 Page 16
4.4.2
Vertical seismic coefficient: Similar steps (as for αh) should be applied on the response spectrum for the vertical seismic component for the determination of vertical seismic
coefficient αv. The alternative approach (as per IS code) should also be applied wherein the
vertical seismic coefficient is taken as 2/3rds of the horizontal seismic coefficient (i.e. αv = 2/3
αh). The higher of the two values should be taken as the design coefficient.
4.5 Estimation of Duration of Shaking
The duration of strong shaking being an important seismic evaluation parameter, should be reflected explicitly in the study, alongwith the total duration. Both these durations can be estimated using the scaling relations (e.g. Novikova and Trifunac, 1994), which defines the strong motion duration at each frequency as a function of earthquake magnitude, source‐to‐site distance and site condition. For generation of design accelerograms, the strong motion duration may be taken as the average duration corresponding to the highest frequency band (18‐25 Hz) and the total duration can be taken as the average plus one standard deviation value corresponding to the lowest frequency band (0.10‐0.15 Hz) but not less than 20 seconds. Local conditions may also affect the expected duration of earthquake shaking and should be considered on a case by case basis.
4.6 Development of Acceleration Time Histories
The acceleration time histories should preferably be represented by real accelerograms obtained for site conditions similar to those present at the dam site under consideration. Since the strong ground motion data currently available do not cover the whole range of possible conditions, such records may be supplemented by synthetic motions representing any earthquake size and seismotectonic environment. Synthetic earthquakes can be developed by
superposition methods6.
It is recommended that several acceleration time histories be used to represent the ground motion as certain time histories have lower energy content at some frequencies and their use may result in an un‐conservative analysis. When detailed time history analysis is necessary it is proposed to use atleast three sets of uncorrelated time histories of horizontal & vertical motions and the maximum response to all the three sets be considered for design purposes.
Acceleration time histories should be specified separately for the horizontal and vertical
motions.
4.7 Factors to be considered while deciding the site specific Target Response Spectrum
Having obtained the target response spectrum from Deterministic as well as Probabilistic approach, the following considerations may be helpful in adopting the target response spectra in practical applications:
• For MCE condition : If the spectral amplitudes obtained by the two approaches differ by 25% or less, the envelope of both may be adopted as the design target spectra. In other cases a weighted average of both the spectra may be adopted as the target spectra, with weights
6 Gupta & Joshi (1993). On synthesizing response spectrum compatible accelerograms, Journal of European Earthquake Engineering, 2, 25‐33.

Central Water Commission
NCSDP Guidelines: 2011 Page 17
appropriately justified. If the difference in the spectral amplitude values obtained by two approaches happens to be very large (say more than 100%), then the possible technical reasons for such discrepancies shall be explained in the report.
• For DBE condition: In the seismic zones IV and V, if the spectral amplitudes obtained by the two approaches differ by 25% or less, at the periods of interest, the design target response spectrum shall be obtained as the envelope of DSHA and PSHA DBE estimate (as described in paras 4.3.1 & 4.3.2 ). In other cases a weighted average of both the spectra may be adopted as the target spectra, with weights appropriately justified. However, for seismic zones II & III, the design target response spectrum shall be obtained as the envelope of the DSHA and PSHA DBE estimates.
The above comparisons are to be restricted for natural periods upto 1.0 sec
5.0 RECOMMENDATIONS ON DESIGN APPROACH
The site specific seismic study report should mention the design approach to be adopted for checking the stability of the dam and should also contain recommendations regarding the permissible stresses and sliding factors to be adopted. The earthquake performance of gravity dams has to be evaluated on the basis of stresses, sliding factor, demand‐capacity ratios and the associated cumulative duration. The below mentioned points should be taken in to account while formulating recommendations.
5.1 Seismic analysis of concrete gravity dams can start with simplified methods using site‐specific seismic coefficient for sliding and overturning stability, and progress to a more refined analysis as needed. The pseudo‐static method of analysis may be used for computation of forces. Regarding permissible stresses, BIS code 6512: Criteria for design of Solid Gravity Dams may be made use of.
The DBE level of ground motion is used for the evaluation of the actual performance of gravity dams. Under DBE, the dam is required to be within linear elastic range with little or no damage. The spectra and time‐histories for DBE level of ground motion can be used to evaluate the dynamic response of gravity dams by linear elastic response‐spectrum method or the time history method. Under DBE condition, the demand‐capacity ratios (DCR) are required to be less than or equal to 1.0. The DCR is defined as the ratio of induced tensile stress to tensile strength of the concrete. For this purpose, the tensile strength or capacity of the plain concrete can be obtained from the uni‐axial splitting tension tests or from the static compressive strength, fc, using the relation due to Raphel (1984), ft = 1.7 fc
2/3 where fc is in psi or ft = 0.324 fc
2/3 where fc is in MPa, as recommended in USACE Manual EM 1110‐2‐6051.
Under MCE condition, dams should not experience a catastrophic loss of the reservoir. Under the rapid loading of MCE conditions, sliding may occur at the dam foundation interface or at upper elevations at lift joints. Dams subjected to large lateral forces produced by the MCE ground motion may tip and start rocking and the resulting driving force may become so large that the structure breaks contact with the foundation or cracks all the way through at the upper elevation.

Central Water Commission
NCSDP Guidelines: 2011 Page 18
The dynamic response under MCE condition may first be evaluated using linear‐elastic time‐history analysis. The level of nonlinear response or cracking is considered acceptable if DCR are less than 2.0, and limited to 15 percent of the dam cross‐section surface area, and the cumulative duration of stress excursions beyond the tensile strength of the concrete falls below the performance curve given in Figure 3. DCR of 2.0 corresponds to the apparent dynamic tensile strength of concrete (Raphel, 1984). The cumulative duration beyond a certain level of DCR is obtained by multiplying the number of stress values exceeding that level by the time‐step used in the time‐history analysis. When these performance conditions are not met, a nonlinear time‐history analysis is required to estimate the damage more accurately under MCE condition.
Fig.3: Performance curve for gravity dams
5.2 In case of earthen dams, the seismic slope stability analysis involves starting with a simpler analysis (Pseudo‐static) and moving on to Sliding Block analysis and Dynamic analysis, where complexity of analysis increases in each stage. In pseudo‐static slope stability analysis, earthquake forces are represented by the site specific seismic coefficient. Seismic inertial forces are estimated by multiplying weight of the potential sliding mass (W) with seismic coefficient as per IS 1893 (1984). Undrained shear strength of the soil is to be considered in the analysis. An index of stability, called factor of safety (FOS) is computed from the ratio of resisting moment to disturbing moment, for a potential sliding mass. A FOS of 1.0 or above is considered acceptable under earthquake condition. Seed’s simplified approach may be used to determine liquefaction potential of cohesionless soil strata. The liquefaction potential is ascertained from index properties as recommended by Seed (2003).
In sliding block analysis, permanent deformation in an earthen dam, due to an earthquake is
evaluated based on Newmark concept. In this method, a potential sliding mass is assumed as a

Central Water Commission
NCSDP Guidelines: 2011 Page 19
rigid body on a rigid base and contact between them as a rigid‐plastic. The analysis involves determination of Yield acceleration (Ky) from slope stability analysis, maximum crest acceleration (Umax) and average acceleration‐ time history [Kav(t)] of sliding mass and estimation of permanent crest displacement by double integration of acceleration difference [Kav(t)‐Ky]. If the crest displacement is within permissible limit (w.r.t Free Board) no further analysis is required. In case the sliding block analysis shows excessive deformation, the detailed dynamic analysis may be carried out.
Dynamic analysis is carried out for dams, failure of which may lead to high level of risk. The analysis involves determination of cyclic strength of soil from cyclic triaxial shear tests, induced shear stresses from dynamic finite element response analysis (equivalent linear or nonlinear) using site specific earthquake, evaluation of strain potential in each element by comparing induced shear stresses with shear strength of soils and then determination of overall deformation of dam from strain potential, which should be within permissible limit (w.r.t. Free Board provided).
The dynamic analysis procedure is followed to determine liquefaction potential of soil. In cyclic triaxial tests on undisturbed soil samples, the cyclic shear stress required to cause liquefaction is determined. The stresses that are likely to be induced in the ground are determined from dynamic response analysis. Comparing the “induced stresses” with “stress required to cause liquefaction” will indicate susceptibility for liquefaction.
6.0 SUBMISSION OF STUDY REPORT FOR NCSDP APPROVAL
The site specific studies for determination of design earthquake parameters shall have to be carried out by Deterministic as well as Probabilistic approach. However, where the available data on past seismicity is scanty, and even the data on tectonic features and geological processes are inadequate to have any meaningful application of probabilistic analysis, the deterministic analysis only shall be carried out by recording the proper justification for not adopting the probabilistic approach for analysis.
The report should also include a section/chapter giving the following information: • Comparison of target response spectra obtained from Deterministic as well as
Probabilistic approach for MCE and DBE conditions alongwith final target response spectra selected with justification
• Compatible acceleration time histories for MCE & DBE target response spectra
• Computed response spectra for different damping values ie 2%, 3%,5%,10% and 15% atleast
• Site specific horizontal and vertical Seismic coefficients
After completion of the site specific seismic study, the full study report should be compiled in a single dossier as per proforma given in Annexure C. The said proforma should also be filled‐up reflecting the status of compliances (along with reasons for non‐compliances) for different items of the study. This proforma, duly filled and signed, should be furnished as a check‐list in the beginning of the study report.

Central Water Commission
NCSDP Guidelines: 2011 Page 20
Fifteen (15) bound volumes and one soft copy of the study report should be submitted to the NCSDP secretariat (Foundation Engineering & Special Analysis Directorate, Central Water Commission, 712(S), Sewa Bhawan, R.K. Puram, New Delhi). In order to ensure consideration of study report in a particular meeting of the NCSDP, the study report should reach the secretariat at least two months ahead of that meeting. Only such study reports, which are found satisfactory (in terms of compliances of the guidelines) on preliminary inspection by the Secretariat, will be put up to the NCSDP for consideration and approval.
7.0 PRESENTATION OF STUDY REPORT BEFORE NCSDP
The date on which study report of a particular project will come up before NCSDP will be intimated by the Secretariat to the project authorities. It will be the responsibility of the project authorities to ensure presence of experts/ consultants connected with the study on the stipulated date and time. The project authorities will make a PowerPoint presentation of the study report before NCSDP, and answer to the queries of the members of the Committee.
The presentation should cover: (i) details of the project; (ii) regional geological & seismo‐tectonic setting; (iii) seismic history; (iv) local geological setting; (v) study methodology and deviation, if any, from the recommended approach; (vi) evaluated parameters of the site specific seismic study; and (vii) recommendations on design approach.

Central Water Commission
NCSDP Guidelines: 2011 Page 21
Annexure A
Illustrative Example : DSHA method for developing target response spectra
Considering a scenario earthquake of magnitude 7.5 with closest distance from the site to zone of energy release as 14 km and with local geological conditions indicating massive rock, the following is estimated from a ground motion prediction equation for 5% damped horizontal acceleration spectrum: Peak Ground Acceleration (at mean plus one standard deviation level) = 3.934 m/s2 7Ps s accel at wo periods ie 0.2 sec and 1.0sec uedo‐ pectral er ion value for t S 0.2s 8.63 m/s2; S 1.0s 5.782 m/s2 Thus the control period (T2) for start of constant velocity r ut to 0.67 sec. ange works o
T S .S .
x 1s ; T ..
x 1s 0.67s
The control period for the beginn o t acceleration (T1) is obtained as a fraction of ing of c nstanT2 as :
= 0.134 sec
The pseudo‐spectral acceleration is considered to be same as the peak ground acceleration at
control period T0= 0.03 s.
The control period for constant displacement (T3) (generally between 3 sec to 4 sec for strong earthquakes in near field conditions) obtained scaling the constant velocity control period (T2) as
is by
= 6.25 × = 4.2 sec
Thus we have:
PGA T .934 m s⁄ S T =8.63 m s⁄ S T
S 3 ;
The corresponding pseudo‐spectral v it eloc ies may be obtained as:
S T S T x T2π
0.0188 m/s
S T S T x T2π
0.1868 m/s
S T S T xT2π
0.9315 m/s
S T S T xT2π
0.9315 m/s
7 Boore-Atknison -Ground motion Prediction equations for the average horizontal component of PGA, PGV and 5%-damped PSA at spectral
periods between 0.01s and 10.0s, Earthquake Spectra, 24(1):99-138,23008

Central Water Commission
NCSDP Guidelines: 2011 Page 22
From these numerical values of pseudo‐spectral velocity and the control periods, the parameters of the smooth acceleration design spectrum may be obtained as
S T S T
T T 1 0.534;
A S TPGA
S TS T
2.194;
V 2π x S TPGA
88; 1.4
D 2π x T xS TPGA
6.248
Target Response spectrum for Horizontal Acceleration ( 5% damping Level)
Central Water Commission
NCSDP Guidelines: 2011 Page 23
77 78 79 80 81 82 83
Longitude, E
27
28
29
30
31
32
33
Latit
ude,
N
Lineaments Faults Sub-surface fault
Thrust Gravity fault Suture zone
Gartok (Tibet)
Delhi
Haridwar
Deharadun Project Site
Chamoli
Uttarkashi
Nainital
Pithoragarh
Manali
4.0 M < 4.8 4.8 M < 5.6 5.6 M < 6.4 M ≥ 7.26.4 M < 7.2
Annexure B
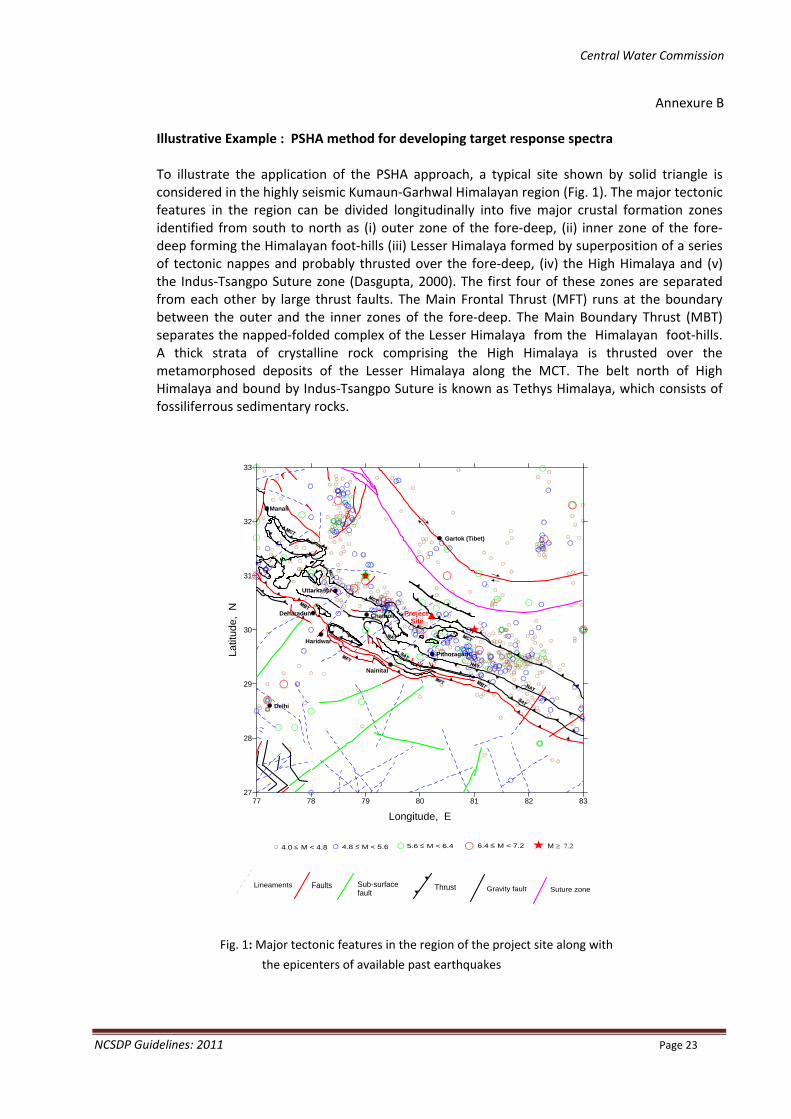
Illustrative Example : PSHA method for developing target response spectra
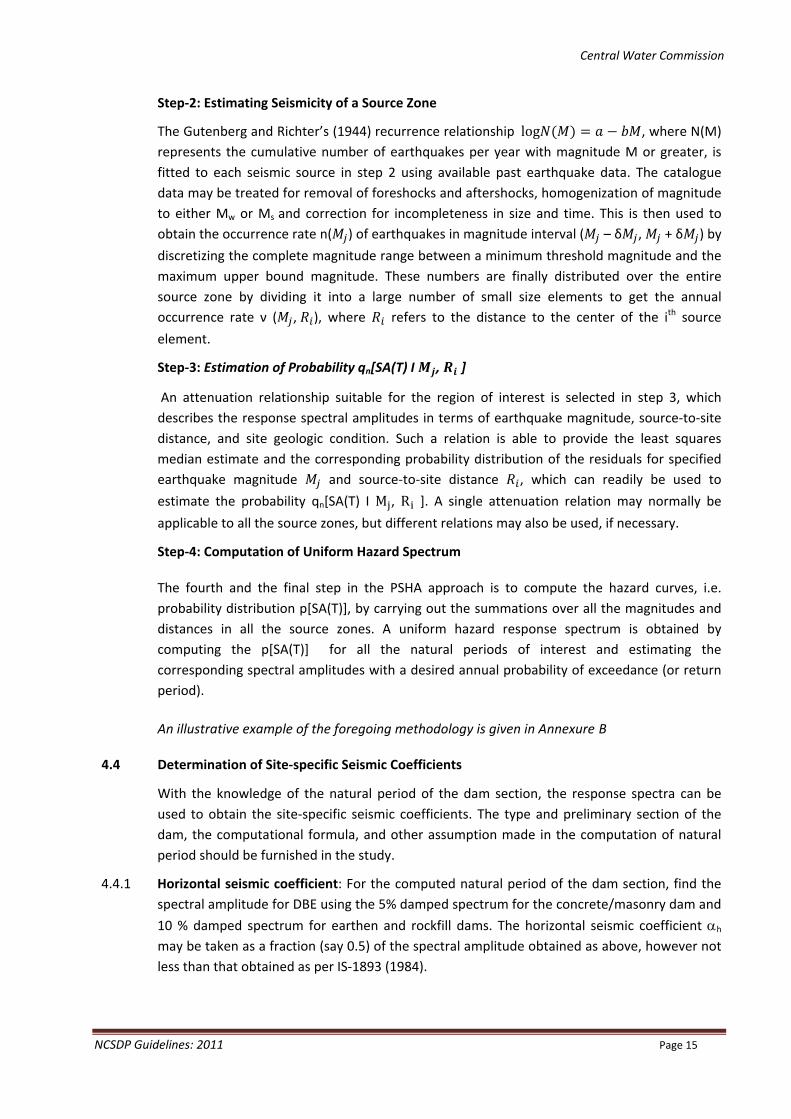
To illustrate the application of the PSHA approach, a typical site shown by solid triangle is considered in the highly seismic Kumaun‐Garhwal Himalayan region (Fig. 1). The major tectonic features in the region can be divided longitudinally into five major crustal formation zones identified from south to north as (i) outer zone of the fore‐deep, (ii) inner zone of the fore‐deep forming the Himalayan foot‐hills (iii) Lesser Himalaya formed by superposition of a series of tectonic nappes and probably thrusted over the fore‐deep, (iv) the High Himalaya and (v) the Indus‐Tsangpo Suture zone (Dasgupta, 2000). The first four of these zones are separated from each other by large thrust faults. The Main Frontal Thrust (MFT) runs at the boundary between the outer and the inner zones of the fore‐deep. The Main Boundary Thrust (MBT) separates the napped‐folded complex of the Lesser Himalaya from the Himalayan foot‐hills. A thick strata of crystalline rock comprising the High Himalaya is thrusted over the metamorphosed deposits of the Lesser Himalaya along the MCT. The belt north of High Himalaya and bound by Indus‐Tsangpo Suture is known as Tethys Himalaya, which consists of fossiliferrous sedimentary rocks.
Fig. 1: Major tectonic features in the region of the project site along with
the epicenters of available past earthquakes
Central Water Commission
NCSDP Guidelines: 2011 Page 24
77 78 79 80 81 82 83
Longitude, E
27
28
29
30
31
32
33
Latit
ude,
N
Project site
Source - 1
Source - 3
Source - 2
Sub-Source - 3
Source - 4
Source -5
Source - 3
4.0 M < 4.8 4.8 M < 5.6 5.6 M < 6.4 M ≥ 7.26.4 M < 7.2
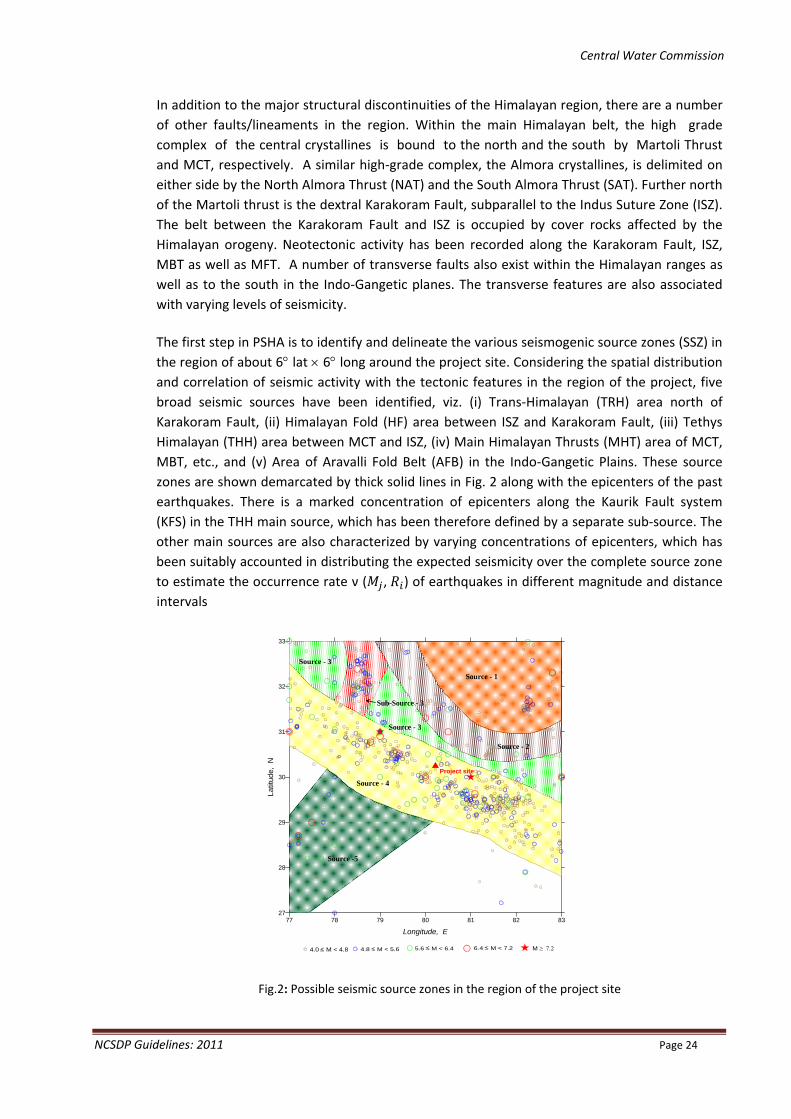
In addition to the major structural discontinuities of the Himalayan region, there are a number of other faults/lineaments in the region. Within the main Himalayan belt, the high grade complex of the central crystallines is bound to the north and the south by Martoli Thrust and MCT, respectively. A similar high‐grade complex, the Almora crystallines, is delimited on either side by the North Almora Thrust (NAT) and the South Almora Thrust (SAT). Further north of the Martoli thrust is the dextral Karakoram Fault, subparallel to the Indus Suture Zone (ISZ). The belt between the Karakoram Fault and ISZ is occupied by cover rocks affected by the Himalayan orogeny. Neotectonic activity has been recorded along the Karakoram Fault, ISZ, MBT as well as MFT. A number of transverse faults also exist within the Himalayan ranges as well as to the south in the Indo‐Gangetic planes. The transverse features are also associated with varying levels of seismicity.
The first step in PSHA is to identify and delineate the various seismogenic source zones (SSZ) in the region of about 6° lat × 6° long around the project site. Considering the spatial distribution and correlation of seismic activity with the tectonic features in the region of the project, five broad seismic sources have been identified, viz. (i) Trans‐Himalayan (TRH) area north of Karakoram Fault, (ii) Himalayan Fold (HF) area between ISZ and Karakoram Fault, (iii) Tethys Himalayan (THH) area between MCT and ISZ, (iv) Main Himalayan Thrusts (MHT) area of MCT, MBT, etc., and (v) Area of Aravalli Fold Belt (AFB) in the Indo‐Gangetic Plains. These source zones are shown demarcated by thick solid lines in Fig. 2 along with the epicenters of the past earthquakes. There is a marked concentration of epicenters along the Kaurik Fault system (KFS) in the THH main source, which has been therefore defined by a separate sub‐source. The other main sources are also characterized by varying concentrations of epicenters, which has been suitably accounted in distributing the expected seismicity over the complete source zone to estimate the occurrence rate ν ( , ) of earthquakes in different magnitude and distance intervals
Fig.2: Possible seismic source zones in the region of the project site

Central Water Commission
NCSDP Guidelines: 2011 Page 25
The second step is to obtain ( )ij RM ,υ for each source zone. For this purpose, first the Gutenberg‐Richter’s earthquake recurrence relationship is defined for each source zone, by estimating the constants a and b using maximum likelihood method (Weichert, 1980). The N(M) is obtained using available past earthquake data in the source zone by homogenization of the magnitude (Scordilis, 2006), declustering the catalog by removing fore‐ and after‐shocks (Gardner and Knopoff, 1974), and accounting for the incompleteness of earthquakes in different magnitude ranges (Stepp, 1973). The recurrence relation is then suitably modified to consider an upperbound magnitude Mmax (Chinnery and North, 1975). Typical recurrence relationship thus obtained for source zone 4 is shown in Fig. 3
bMaMN −=)(log
Fig.3: Recurrence relation for source zone 4
From the recurrence relationship for a source zone with an upper bound magnitude, the occurrence rate of earthquakes within a small magnitude range ),( jjjj MδMMδM +− around central magnitude can be obtained as jM
)()()( jjjjj MMNMMNMn δδ +−−=
These numbers are distributed appropriately using spatial smoothening of past seismicity over the entire source zone, to get the required number ( )ij RM ,υ within a small source‐to‐site distance range ),( iiii RRRR δδ +− .
In step three, the probability, ( )ij RMTSAq ,)( , of exceeding a response amplitude SA(T) at natural period T due to magnitude at source‐to‐site distance is obtained by assuming the to follow a Gaussian probability distribution as:
jM iR)(ln TSA
[ ] ∫∞− ⎪⎭
⎪⎬⎫
⎪⎩
⎪⎨⎧
⎟⎟⎠
⎞⎜⎜⎝
⎛ −−=
)(ln 2
)()(ln
21exp
)(21)(
TSA
dxT
TSAxT
TSAFσσπ
In this expression )(ln TSA is the least squares estimate and )(Tσ is the associated standard deviation of , which have been obtained from the empirical attenuation relation due to Abrahamson and Silva (1997), defined at 28 natural periods between 0.01 sec and 5.0 sec. The complementary of the probability
)(ln TSA
[ ])(TSAp gives the required probability, ( )ij RMTSAq ,)( .
From knowledge of ( )ij R, and the nuMTSAq )( mber ( )ijn R,Mυ obtained as above for all
Central Water Commission
NCSDP Guidelines: 2011 Page 26
ted
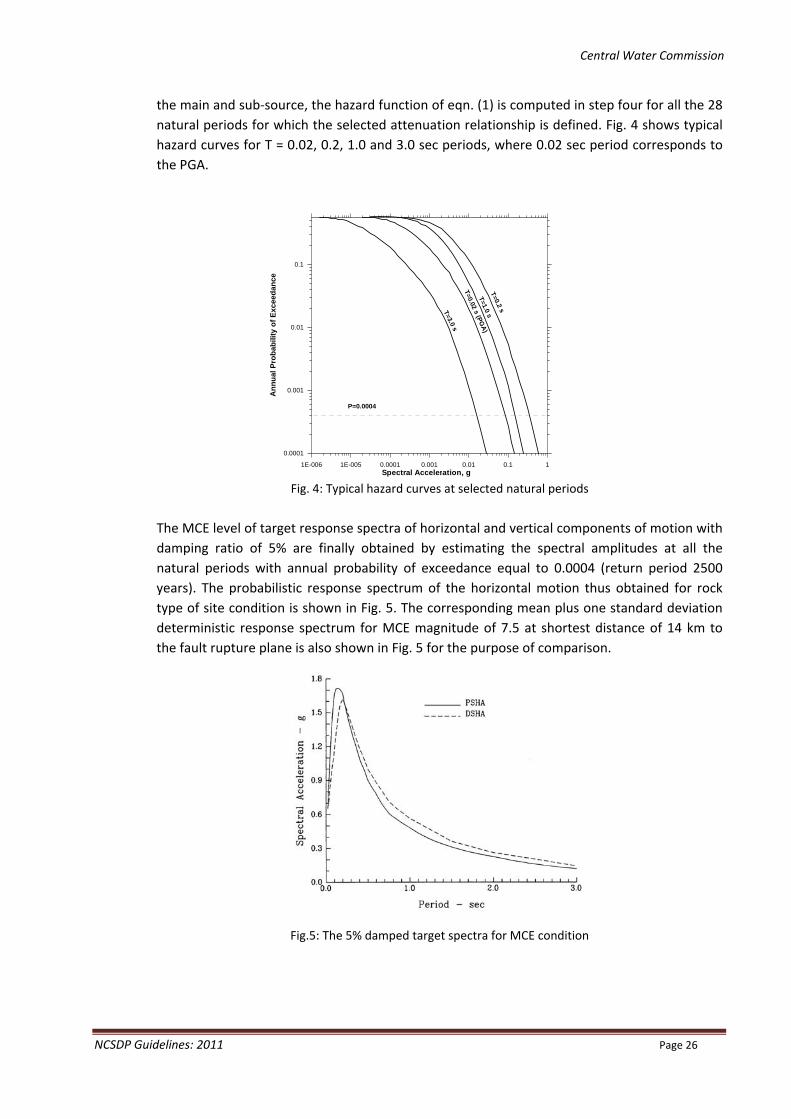
Fig. 4: Typical hazard curves at selected natural riods
The MCE level of target response spectra of horizontal and vertical components of motion with
Fig.5: The 5% damped target spectra for MCE condition
the main and sub‐sourc ction of eqn. (1) is in step four for all the 28 natural periods for which the selected attenuation relationship is defined. Fig. 4 shows typical hazard curves for T = 0.02, 0.2, 1.0 and 3.0 sec periods, where 0.02 sec period corresponds to the PGA.
e, the hazard fun compu
pe
damping ratio of 5% are finally obtained by estimating the spectral amplitudes at all the natural periods with annual probability of exceedance equal to 0.0004 (return period 2500 years). The probabilistic response spectrum of the horizontal motion thus obtained for rock type of site condition is shown in Fig. 5. The corresponding mean plus one standard deviation deterministic response spectrum for MCE magnitude of 7.5 at shortest distance of 14 km to the fault rupture plane is also shown in Fig. 5 for the purpose of comparison.
0.0001
0.001Ann
ual P
0.01
0.1ro
babi
lity
of E
xcee
danc
e
P=0.0004
1E-006 1E-005 0.0001 0.001 0.01 0.1 1Spectral Acceleration, g
T=0.02 s (PGA)
T=0.2 s
T=1.0 sT=3.0 s

Annexure C
PROFORMA FOR SUBMISSION OF STUDY REPORT TO NCSDP
The study report should be compiled in a single dossier as per proforma given below. The proforma, duly filled and signed, should be furnished as a check‐list in the beginning of the study report.
Sl No.
Description Compliance (Yes/No) w.r.t. Guidelines & Reasons for Non‐
compliance
1 Project Details (a) Name of the Project (b) Name of the River over which the project is proposed (c) Brief Description of the Project Components (d) Location of the Project:
State, District, Longitude & Latitude and Toposheet no. of each of the Project component (e.g. Dam/Barrage/Power House etc.) for which design seismic coefficient is required. Information to be given in tabular format.
(e) Type of Project: Multipurpose or irrigation Storage (area/ volume of reservoir) or Run of the River Scheme or Hydro Power Project (surface/ subsurface, Installed Capacity, number of units etc.)
(f) Details of other projects in the vicinity(within 100 km):Name of project, Type of hydraulic structures, and seismic parameters (expected PGA for MCE) for projects constructed/ under construction.
(g) Present Status of Investigation: DPR submitted/ approved; Salient comments/ observations on DPR for ground exploration, relevant to Seismic design; status on environment clearance; pre‐construction/ construction stage etc.
(h) Nature of Foundation Material: Nature of foundation material (including geotechnical properties of rock/ soil etc.) below different segments of dam and other project components.
(i) Name and address of the Project Authority and Consultants/ Advisors:Complete postal address with telephone/fax/e‐mail of Project Authority and Consultants/ Advisor engaged by the Project Authority for various types of inputs [geological, geophysical, geotechnical, seismotectonics, seismic design etc] shall be given.
2 Regional Geological and Seismo‐Tectonic Evaluation(Refer Section 3.0 of the guidelines for details)
(a) Tectonic Map:
(b) Seismo‐tectonic section:
(c) Interpretation of regional tectonic mechanism and other details:
(d) Earthquake catalogue:
(e) Micro earthquake investigations:
NCSDP Guidelines: 2011 Page 27

Central Water Commission
NCSDP Guidelines: 2011 Page 28
3 Local Geologic Setting (Refer Section 3.0 of the guidelines for details)
(a) Geological map:
(b) Surface & subsurface exploration:
(c) Additional inputs on subsurface configuration of major faults:
4 Evaluation of site specific seismic parameters
(a) Methodology of the study: The adopted study methodology, confirming to section 4.0 of the guidelines, should be briefly described. Any deviation from the recommended approach should be pointed out with adequate justifications.
(b) Evaluated site specific seismic parameters:The study should furnish the identified MCE (deterministic); recommended response spectra for the MCE and DBE conditions; recommended horizontal and vertical seismic coefficients along with computed natural period of the dam; estimated duration of shaking; and acceleration time histories for both horizontal and vertical motions.
5 Recommendations on design approach(Refer Section 5.0 of the guidelines for details)
6 Submission of study report for NCSDP approval(Refer Section 6.0 of the guidelines for details)
Date:
Signature & Seal of authorized representative
of Project Authority
Central Water Commission
NCSDP Guidelines: 2011 Page 29
Annexure D
Bibliography
Basic Engineering Seismology
1. Scordilis, EM (2006). Emperical global relations converting Ms amd mb to moment magnitude. Journal of Seismology,10,225‐236.
Design Criteria
2. “FEMA Users Manual for Risk Prioritisation Tool for Dams.” (2008).3. Raphael, J.M.,1984., “Tensile strength of concrete.,” Jour. of Am. Concrete Inst., 81(2), 158‐165.4. USACE 2003. Time‐History Dynamic Analysis of Concrete Hydraulic Structures, US Army Corps of
Engineers, Manual No. EM 1110‐2‐6051 5. USACE 2007. Earthquake Design and Evaluation of Concrete Hydraulic Structures, US Army Corps of
Engineers, Manual No. EM 1110‐2‐6053 6. Wieland, M., 2006., “Earthquake Safety of Existing Dams, First European Conference on Earthquake
Engineering and Seismology”.
Generation of Spectrum Compatible Accelograms
7. Gupta, I.D., Joshi, R.G., (1993). On synthesizing response spectrum compatible accelerograms, Journal of European Earthquake Engineering, 2, 25‐33
8. Novikova, E.I. and Trifunac.M.D., 1994., “Duration of strong ground motion. Scaling in terms of earthquake magnitude, epicentral distance and geological and local soil conditions.” Earthquake Engineering & Structural Dynamics, 23(6), 1023‐1043
9. Shrikhande, M and Gupta, V.K., 1996., “On generating ensembles of design spectrum compatible accelerograms.” European Earthquake Engineering, X(3):49–56.
10. Trifunac, M.D. and Brady, A.G., 1975., “A study on the duration of strong earthquake ground motion.” Bull. Seism. Soc. Am., 65, 581‐626.”
Ground Motion Prediction Equations
11 Abrahamson, N.A. and Silva, W.J., 1997. “Empirical response spectral attenuation relations for shallow crustal earthquakes.” Seismological Research Letters, 68(1):94‐127.
12. Boore, D.M. and Atkinson, G.M., 2008., “Ground‐motion prediction equations for the average horizontal component of PGA, PGV, and 5%‐damped PSA at spectral periods between 0.01 s and 10.0 s.” Earthquake Spectra, 24(1):99‐138.
13. Cotton, F., Scherbaum, F., Bommer, J.J. and Bungum, H., 2006., “Criteria for selecting and adjusting ground‐motion models for specific target regions: Application to Central Europe and rock sites.” Journal of Seismology, 10(2):137‐156.
14. Graizer, V. and Kalkan.E,2007., “Ground motion attenuation model for peak horizontal acceleration from shallow crustal earthquakes.” Earthquake Spectra, 23(3):585‐613.
15. Graizer, V. and Kalkan.E,2009., “Prediction of spectral acceleration response ordinates based on PGA attenuation.” Earthquake Spectra, 25(1):39‐69.
16. Scherbaum, F., Cotton.F., and Smit.P.,2004., “On the use of response spectral reference data for the selection and ranking of ground motion models for seismic hazard analysis in regions of moderate seismicity: the case of rock motion.” Bulletin of the Seismological Society of America, 94(6):2164‐2185.
17. Trifunac, M. D. and Lee, V.W. 1989., “Empirical models for scaling pseudo relative velocity spectra of strong earthquake accelerations in terms of magnitude, distance, site intensity and recording site conditions.”
Central Water Commission
NCSDP Guidelines: 2011 Page 30
Methodology of Hazard Assessment
18. Anderson, J.G., 1997, “Benefits of scenario ground motion maps, Engineering Geology,” 48 (1), pp. 43‐57. 19. Anderson, J.G., Brune, J.N., Anooshehpoor, R., Ni, S., 2000, “New ground motion data and concepts in
seismic hazard analysis,” Current Science, 79(9), pp. 1278‐1290. 20. EPRI.,1987. “Seismic hazard methodology for the Central and Eastern United States” – Volume 1, Part 1,
Theory, and Part 2, methodology, Report NP‐4726, Electric Power Research Institute, Palo Alto, CA 21. Gupta, I.D. ,2002., “State of the art in seismic hazard analysis,” ISET J. Earthquake Engineering, 39(4),
311‐346 22. ICOLD , 2010., “Selecting seismic parameters for large dams,” Bulletin 72, International Committee on
Large Dams. 23. Malhotra,P.K. 2005., “Return period of design ground motions.” Seismological Research
Letters,76(6):693–699. 24. McGuire, R.K. 2004., “Seismic hazard and risk analysis.” Monograph MNO‐10, Earthquake Engineering
Research Institute, Oakland, California. 25. Reiter, L., 1990., “Earthquake Hazard Analysis. Issues and Insights,” Columbia University Press, New York,
254 p. 26. SSHAC .,1997., “Recommendations for probabilistic seismic hazard analysis: Guidance on uncertainty and
use of experts, Report NUREG/CR‐6372, Senior Seismic Hazard Analysis Committee, US Nuclear Regulatory Commission, Washington DC.”
27. Stepp, J.C., 1973. “Analysis of completeness of the earthquake sample in the Puget sound area, in `Seismic Zoning (edited by S.T. Harding)”, NOAA Tech. Report ERL 267‐ESL30, Boulder, Colorado, USA
US Army Corps of Engineers., 1999., “Response spectra and seismic analysis for concrete hydraulic structures”, Engineer Manual, No. EM 1110‐2‐6050, Washington DC