guidelines, criteria, and rules of thumb for evaluating
TRANSCRIPT

Psychological Assessment1994, VoU, No. 4, 284-290 Copyright 1994 by the American Psychological Association Inc.
1040-3590/94/53.00
Guidelines, Criteria, and Rules of Thumb for Evaluating Normed andStandardized Assessment Instruments in Psychology
Domenic V. Cicchetti
In the context of the development of prototypic assessment instruments in the areas of cognition,personality, and adaptive functioning, the issues of standardization, norming procedures, and theimportant psychometrics of test reliability and validity are evaluated critically. Criteria, guidelines,and simple rules of thumb are provided to assist the clinician faced with the challenge of choosingan appropriate test instrument for a given psychological assessment.
Clinicians are often faced with the critical challenge of choos-ing the most appropriate available test instrument for a givenpsychological assessment of a child, adolescent, or adult of aparticular age, gender, and class of disability. It is the purpose ofthis report to provide some criteria, guidelines, or simple rulesof thumb to aid in this complex scientific decision. As such,it draws upon my experience with issues of test development,standardization, norming procedures, and important psycho-metrics, namely, test reliability and validity. As I and my col-leagues noted in an earlier publication, the major areas of psy-chological functioning, in the normal development of infants,children, adolescents, adults, and elderly people, include cogni-tive, academic, personality, and adaptive behaviors (Sparrow,Fletcher, & Cicchetti, 1985). As such, the major examples orapplications discussed in this article derive primarily, althoughnot exclusively, from these several areas of human functioning.
Standardization Procedures
Although numerous assessment instruments used in the be-havioral (and medical) sciences are not standardized appropri-ately on relevant demographic variables, the importance of thiscritical process cannot be underestimated. The standardizationof any test of intelligence needs to be based on systematic strat-ification on the following variables: age; gender; education, oc-cupation, or both; geographic region; and urban versus ruralplace of residence. In this sense, the Wechsler Adult IntelligenceScale—Revised (WAIS-R; Wechsler, 1981) "represents the ulti-mate in adult norming of a Wechsler battery" (Kaufman, 1990,p. 76). The same procedure was also used successfully in thedevelopment of the survey and expanded editions of the revisedVineland Adaptive Behavior Scales (hereinafter the revisedVineland; Sparrow, Balla, & Cicchetti, 1984a, 1984b), in theKaufman Assessment Battery for Children (K-ABC; Kaufman& Kaufman, 1983), and, most recently, in the development ofthe Kaufman Adolescent and Adult Intelligence Test (KAIT;Kaufman & Kaufman, 1993).
Correspondence concerning this article should be addressed toDomenic V. Cicchetti, Veterans Affairs Medical Center and Yale Univer-sity, West Haven, Connecticut 06516.
Norming Procedures
The appropriate standardization of a given assessment instru-ment, as just described, renders it possible to develop nationalnorms for the valid interpretation of the meaning of a givenperson's scores on the standardized test. Applying appropriatemethods, raw test scores are converted into several primary de-rived scores: standard scores, national percentile ranks, and ageequivalents. In addition to providing the resulting primarynorms, some standardized tests provide a number of supple-mentary norms based on special groups for which the test in-strument may also be useful, such as emotionally disturbed,mentally retarded, visually challenged, and hearing-impairedsamples (Sparrow, Balla, & Cicchetti, 1984a). In distinguishingbetween standardization and norming procedures, it must bestressed that a norm refers to the average score (or, more gener-ally, the performance) of a standardization sample, however thelatter is defined.
Another important feature of the standardization and norm-ing process of some recently developed assessment instrumentsis the use of overlap samples to provide comparative informa-tion for a given subject on one or more tests that might either beused to supplement the information derived from the instru-ment of focus or (as discussed later) to provide specific informa-tion on certain components of test validity. For example, it isoften important for a clinical examiner, teacher, or parent tounderstand the extent to which the same child may compare interms of both cognitive and adaptive levels of functioning. Thisdirect comparison cannot be made in the usual circumstance ifthe cognitive and adaptive behavior instruments used to evalu-ate the child have been normed on different standardizationsamples. To obviate this problem, the Vineland standardizationprogram included two overlap samples. The first consisted of719 children randomly selected from the national standardiza-tion sample for the K-ABC (Kaufman & Kaufman, 1983). Theage range was between 2 years, 6 months and 12 years, 11months. This overlap sample was administered both the revisedVineland and the K-ABC. A second group of 2,018 children,aged between 2 years, 6 months and 18 years, 11 months, wasdrawn randomly from the revised Vineland standardizationsample and administered both the Vineland and the revisedPeabody Picture Vocabulary Test (PPVT-R; Dunn & Dunn,1981).
284
This
doc
umen
t is c
opyr
ight
ed b
y th
e A
mer
ican
Psy
chol
ogic
al A
ssoc
iatio
n or
one
of i
ts a
llied
pub
lishe
rs.
This
arti
cle
is in
tend
ed so
lely
for t
he p
erso
nal u
se o
f the
indi
vidu
al u
ser a
nd is
not
to b
e di
ssem
inat
ed b
road
ly.

SPECIAL SECTION: EVALUATING ASSESSMENT INSTRUMENTS 285
Such overlapping standardization samples result in compar-ative norms that are very useful to clinicians, teachers, parents,and administrators. For a more comprehensive treatment ofthis topic, specifically of how information deriving from cogni-tive and adaptive behavior tests that were normed and standard-ized on the same overlap sample can facilitate the developmentof specific remedial programs, see Cicchetti and Sparrow(1990); Cicchetti, Sparrow, and Rourke (1991); and Sparrowand Cicchetti (1985,1987,1989).
Perhaps the single most valuable derived score, based on suc-cessful test standardization and norming procedures, is the de-velopment of a series of standard scores that can then be used todetermine the level of functioning of a given individual of agiven age in comparison with her or his standardization peers,in terms of a percentile rank. The usual procedure, althoughthere are exceptions, is to express a given standard score on anormative sample mean of 100, with a standard deviation of±15. Because standard scores are normally (or Gaussian) dis-tributed, a score of 100 is at the 50th percentile, a score of 85 isat the 16th percentile, and a score of 130 is beyond the 95thpercentile of functioning. This test information derives fromwell-standardized and well-normed assessment instrumentsand is always applicable at the level of total or overall indicesof functioning, such as an adaptive behavior composite score(Sparrow, Balla, & Cicchetti, 1984a; Sparrow & Cicchetti,1989); a Full Scale IQ (e.g., Kaufman & Kaufman, 1993; Wech-sler, 1981); or the K-ABC Mental Processing Composite (Kauf-man & Kaufman, 1983). One notable exception to the 100 ± astandard deviation of 15 pertains to the fourth edition of theStanford-Binet Intelligence Scale (Thorndike, Hagen, & Sattler,1986), which was normed on a mean of 100 and a standarddeviation of 16.
Although specific Vineland domains (e.g., Communication,Daily Living Skills, Socialization, and Motor Skills) are alsonormed on standardization samples with means of 100 andstandard deviations of ± 15, the typical subtest score for intelli-gence or IQ tests is often based on a mean of 10 and a standarddeviation of ±3. Thus, on the KAIT, one can expect that 99%of a normal sample would produce standard scores on a givensubtest (e.g., auditory comprehension) between a range of 1 and19 (Kaufman & Kaufman, 1993).
Before leaving the topic of standard scores, it is important tomention briefly the concept of confidence intervals, sometimesreferred to as bands of error. A given standard score can bebanded with a range of confidence intervals that have been con-structed to take into account the standard error of measure-ment of the test instrument. The standard error of measure-ment defines that amount of test-retest variability that is ex-pected to occur on the basis of the inherent imprecision of theassessment instrument itself. Typical bands of error, for a givenwell-normed standardized test, are usually reported at one ormore of the following confidence intervals: 68%, 85%, 90%,95%, and 99% (e.g., Kaufman & Kaufman, 1993, p. 77; Spar-row, Balla, & Cicchetti, 1984a, p. 21).
Additional ways of interpreting scores deriving from well-standardized tests often include age equivalents and descriptivecategories. The specific procedure for producing age equivalentscores is first to plot mean raw scores for each age group in thestandardization sample on arithmetic graph paper. The age
equivalent score for any given raw score value is read from asmoothed curve that has been fitted through the plotted points.Such scores are available for the revised Vineland domain andsubdomain scores, the various subscales of the WAIS-R, andboth the K-ABC and the KAIT. Age equivalents have the dis-tinct advantage that they are easily understood by persons unfa-miliar with statistics.
However, when raw score distributions are very uneven orskewed, as tends to be true when they are based on age equiva-lents, they do not provide the type of representation that Kauf-man and Kaufman (1993) referred to as "the full scale contin-uum, as is necessary for deriving scaled scores" (p. 76). Thisprovides the rationale for developing descriptive categories. Forexample, maladaptive levels can be derived to denote the fre-quency of a given individual's maladaptive behavior in compar-ison with that of peers of the same age in a national standard-ization sample. The maladaptive levels (i.e., descriptive catego-ries) and the corresponding percentile ranks used to classify agiven raw score, as reported by Sparrow, Balla, & Cicchetti(1984a), are as follows: nonsignificant (50th percentile and be-low), intermediate (51st-84th), and significant (85th percentileor higher). In a somewhat analogous fashion, Kaufman andKaufman (1993) provided, for the aforementioned KAIT, rawscore; percentile equivalent; and descriptive categories of aver-age, below average, lower extreme, mild deficit, moderate defi-cit, and severe deficit. These are given for specific age groupings,ranging between 11 years and 85 years and over.
Because it is possible for a test to be adequately normed andstandardized and yet have undesirable psychometric properties(e.g., poor reliability and validity), it becomes important to dis-cuss these issues as they relate to assessment instruments.
Test Reliability
Reliability can take many forms. These often include a mea-sure of internal consistency that defines the extent to whichitems in a given test, domain, subdomain, or subtest hang to-gether. It is measured by application of the familiar coefficientalpha or, when items are scored dichotomously, by the Kuder-Richardson (KR-20) formula (Cronbach, 1970). Other formsof reliability include the familiar test-retest and interexaminerreliability. Finally, the stability of a trait or behavior over timeis measured in terms of a temporal reliability coefficient (e.g.,Cicchetti & Tyrer, 1988; Tyrer, Strauss, & Cicchetti, 1983). De-pending on the scale of measurement for a given item, appro-priate reliability coefficients would include kappa (i.e., nomi-nally scaled data), weighted kappa (i.e., ordinally scaled data),or the intraclass correlation coefficient (i.e., dimensionallyscaled data; e.g., Fleiss, 1981). Mathematical relationships and,under certain specified conditions, the mathematical equivalen-cies between the kappa or weighted kappa statistic on the onehand and the intraclass correlation statistic on the other, havebeen shown (a) in the dichotomous case (by Fleiss, 1975) and(b) in the ordinal case (by Fleiss & Cohen, 1973). Concerningcoefficient alpha (or KR-20 in the dichotomous case), two com-ments need to be made, the first conceptual, the secondbiostatistical.
Although some biostatisticians would regard interexaminerreliability as the most important type of reliability assessment,
This
doc
umen
t is c
opyr
ight
ed b
y th
e A
mer
ican
Psy
chol
ogic
al A
ssoc
iatio
n or
one
of i
ts a
llied
pub
lishe
rs.
This
arti
cle
is in
tend
ed so
lely
for t
he p
erso
nal u
se o
f the
indi
vidu
al u
ser a
nd is
not
to b
e di
ssem
inat
ed b
road
ly.

286 DOMENIC V. CICCHETTI
one noted statistician held the contrasting view that coefficientalpha is to be preferred over both test-retest and interexaminerreliability. Specifically, Nunnally (1978) noted that, "if coeffi-cient alpha is low for a test, a relatively high correlation betweenretests should not be taken as an indication of high reliability"(p. 234).
How valid is this argument, however? The internal consis-tency of items in a test can be very low even though the itemsdo, in fact, hang together perfectly. Thus, items with low or highceilings can produce identical scores (e.g., for odd versus evenitems within a given subtest or domain), but, of course, will cor-relate zero.
Alternatively, there is the cogent argument that very high lev-els of internal consistency merely inform that items hang to-gether well at a particular point in time. That is to say, the samelevel of internal consistency for the same subjects some weekslater may be based on completely different responses on thesame test items at the two different times. Providing that theordering of responses (e.g., between odd and even items) re-mains the same at each testing, coefficient alpha will be high,but test-retest reliability will be low. Similarly, if subjects wereevaluated independently by two examiners at the same pointin time (separated by a time interval large enough to rule outmemory effects), then it is possible for coefficient alpha to behigh for each examiner's evaluation, despite a low level of inter-examiner agreement. It is this type of reasoning that wouldforce most biostatisticians to disagree with the arguments ofNunnally and to focus on measures of internal consistencywithin the broader context of test-retest and interexaminer re-liability. One might legitimately ask where indeed the entirefield of diagnostic assessment in the behavioral sciences wouldbe if scientists used measures of internal consistency as the pri-mary index of the reliability of major nosologic systems ratherthan appropriate measures of interexaminer agreement. It is thetraining of independent examiners, using well-defined, non-overlapping criteria (e.g., from the third edition of the Diagnos-tic and Statistical Manual of Mental Disorders; DSM-IH;American Psychiatric Association, 1980) that has producedhigh levels of agreement that have revolutionized the field ofneuropsychologic and neuropsychiatric diagnosis (e.g., seeGrove, Andreasen, McDonald-Scott, Keller, & Shapiro, 1981).
Whether the reliability of a given assessment instrument isexpressed in terms of a coefficient alpha, test-retest, interexam-iner, or temporal reliability coefficient, it is useful to developguidelines to distinguish levels that are clinically meaningfulfrom those that may not be. Taking into account the caveatsconcerning item ceiling and floor effects and the need to con-sider coefficient alphas in the broader context of other types ofreliability assessments (e.g., interexaminer), the followingguidelines were suggested by Cicchetti and Sparrow (1990):When the size of the coefficient alpha or other measure of in-ternal consistency is below .70, the level of clinical significanceis unacceptable; when it is between .70 and .79, the level of clin-ical significance is fair; when it is between .80 and .89, the levelof clinical significance is good; and when it is .90 and above, thelevel of clinical significance is excellent. Cicchetti and Sparrow(1990) went on to state that
correlations of .70 or higher are usually considered acceptable lev-eJs of internal consistency of items. For both our target age range
(infancy through age 5 years), as well as for all age groups in theVineland standardization sample (through 18 years 11 months),this criterion was always met, with results consistently at the upperend of the acceptable range (.85 or higher). Results for infancythrough the preschool years were as follows: coefficient alphasranged between .89 and .94 for Communication; between .86 and.92 for Daily Living Skills; between .82 and .94 for Socialization;between .74 and .95 for Motor Skills, and between .96 and .98 forthe Vineland Adaptive Behavior Composite (ABC). We would thusconclude that Vineland items meet adequately the criterion of ac-ceptable levels of internal consistency both at a domain and anABC level, (pp. 178-179)
With respect to evaluating levels of kappa, weighted kappa,or the intraclass correlation statistic used for measuring intra-and interexaminer levels of agreement, a number of biostatisti-cians have developed guidelines for determining levels of prac-tical, substantive, or clinical significance (e.g., Cicchetti & Spar-row, 1981; Fleiss, 1981; Landis & Koch, 1977). The guidelinesdeveloped by Cicchetti and Sparrow (1981) resemble closelythose developed by Fleiss (1981) and also represented a simpli-fied version of those introduced earlier by Landis and Koch(1977). The guidelines state that, when the reliability coefficientis below .40, the level of clinical significance is poor; when it isbetween .40 and .59, the level of clinical significance is fair;when it is between .60 and .74, the level of clinical significanceis good; and when it is between .75 and 1.00, the level of clinicalsignificance is excellent.
Before leaving the topic, it is important to mention that anumber of reliability measurements of major assessment in-struments in the field of intelligence testing (as well as in otherfields) have been based on the standard Pearson product-mo-ment correlation (r) rather than on the statistic of choice men-tioned here, namely, the intraclass correlation coefficient (r,).The problem with the product-moment correlation is that itmeasures similarity in the orderings of test scores made by in-dependent evaluators. Thus, two independent examiners mightbe very far apart in the total IQ they attribute to the same groupof adolescents. However, to the extent that their IQ rankingscovary in the same order, the resulting correlation can rangebetween very high and perfect. As noted by Kazdin (1982),"The correlation merely assesses the extent to which scores gotogether and not whether they are close to each other in absoluteterms" (p. 58).
The aforementioned intraclass correlation coefficient, in con-trast to the product-moment correlation, has the following de-sirable properties: (a) It can distinguish those paired assess-ments made by the same set of examiners from those made bydifferent sets of examiners; (b) it distinguishes those sets ofscores that are merely ranked in the same order from test toretest from those that are not only ranked in the same order butare in low, moderate, or complete agreement with each other;and (c) it corrects for the extent of test-retest (or interexaminer)agreement expected on the basis of chance alone (e.g., Bartko,1966, 1974; Bartko & Carpenter, 1976; Cicchetti & Sparrow,1981,1990; Fleiss, 1981).
The question is, however, under what circumstances do theintraclass correlation coefficient and the product-moment cor-relation produce similar, dissimilar, or the same values? Thisquestion is easily answered. The product-moment correlationplaces the maximum limit on what the intraclass correlation
This
doc
umen
t is c
opyr
ight
ed b
y th
e A
mer
ican
Psy
chol
ogic
al A
ssoc
iatio
n or
one
of i
ts a
llied
pub
lishe
rs.
This
arti
cle
is in
tend
ed so
lely
for t
he p
erso
nal u
se o
f the
indi
vidu
al u
ser a
nd is
not
to b
e di
ssem
inat
ed b
road
ly.
SPECIAL SECTION: EVALUATING ASSESSMENT INSTRUMENTS 287
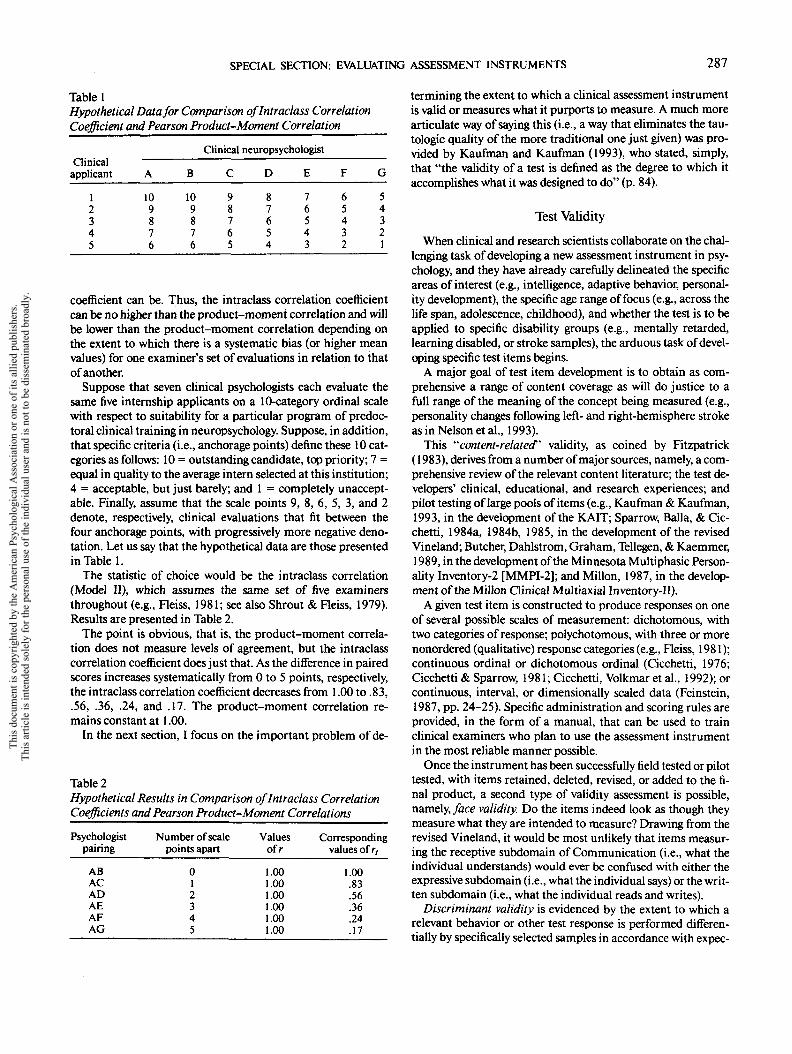
Table 1Hypothetical Data for Comparison oflntradass CorrelationCoefficient and Pearson Product-Moment Correlation
Clinicalapplicant
12345
Clinical neuropsychologist
A
109876
8
109876
C
98765
D
87654
E
76543
F
65432
G
54321
coefficient can be. Thus, the intraclass correlation coefficientcan be no higher than the product-moment correlation and willbe lower than the product-moment correlation depending onthe extent to which there is a systematic bias (or higher meanvalues) for one examiner's set of evaluations in relation to thatof another.
Suppose that seven clinical psychologists each evaluate thesame five internship applicants on a 10-category ordinal scalewith respect to suitability for a particular program of predoc-toral clinical training in neuropsychology. Suppose, in addition,that specific criteria (i.e., anchorage points) define these 10 cat-egories as follows: 10 = outstanding candidate, top priority; 7 =equal in quality to the average intern selected at this institution;4 = acceptable, but just barely; and 1 = completely unaccept-able. Finally, assume that the scale points 9, 8, 6, 5, 3, and 2denote, respectively, clinical evaluations that fit between thefour anchorage points, with progressively more negative deno-tation. Let us say that the hypothetical data are those presentedin Table 1.
The statistic of choice would be the intraclass correlation(Model II), which assumes the same set of five examinersthroughout (e.g., Fleiss, 1981; see also Shrout & Fleiss, 1979).Results are presented in Table 2.
The point is obvious, that is, the product-moment correla-tion does not measure levels of agreement, but the intraclasscorrelation coefficient does just that. As the difference in pairedscores increases systematically from 0 to 5 points, respectively,the intraclass correlation coefficient decreases from 1.00 to .83,.56, .36, .24, and .17. The product-moment correlation re-mains constant at 1.00.
In the next section, I focus on the important problem of de-
Table 2Hypothetical Results in Comparison of Intraclass CorrelationCoefficients and Pearson Product-Moment Correlations
Psychologistpairing
ABACADAEAFAG
Number of scale Valuespoints apart ofr
0 .0012345
.00
.00
.00
.00
.00
Correspondingvalues of r,
1.00.83.56.36.24.17
termining the extent to which a clinical assessment instrumentis valid or measures what it purports to measure. A much morearticulate way of saying this (i.e., a way that eliminates the tau-tologic quality of the more traditional one just given) was pro-vided by Kaufman and Kaufman (1993), who stated, simply,that "the validity of a test is denned as the degree to which itaccomplishes what it was designed to do" (p. 84).
Test Validity
When clinical and research scientists collaborate on the chal-lenging task of developing a new assessment instrument in psy-chology, and they have already carefully delineated the specificareas of interest (e.g., intelligence, adaptive behavior, personal-ity development), the specific age range of focus (e.g., across thelife span, adolescence, childhood), and whether the test is to beapplied to specific disability groups (e.g., mentally retarded,learning disabled, or stroke samples), the arduous task of devel-oping specific test items begins.
A major goal of test item development is to obtain as com-prehensive a range of content coverage as will do justice to afull range of the meaning of the concept being measured (e.g.,personality changes following left- and right-hemisphere strokeas in Nelson et al., 1993).
This "''content-related" validity, as coined by Fitzpatrick(1983), derives from a number of major sources, namely, a com-prehensive review of the relevant content literature; the test de-velopers' clinical, educational, and research experiences; andpilot testing of large pools of items (e.g., Kaufman & Kaufman,1993, in the development of the KAIT; Sparrow, Balla, & Cic-chetti, 1984a, 1984b, 1985, in the development of the revisedVineland; Butcher, Dahlstrom, Graham, Tellegen, & Kaemmer,1989, in the development of the Minnesota Multiphasic Person-ality Inventory-2 [MMPI-2]; and Millon, 1987, in the develop-ment of the Millon Clinical Multiaxial Inventory-II).
A given test item is constructed to produce responses on oneof several possible scales of measurement: dichotomous, withtwo categories of response; polychotomous, with three or morenonordered (qualitative) response categories (e.g., Fleiss, 1981);continuous ordinal or dichotomous ordinal (Cicchetti, 1976;Cicchetti & Sparrow, 1981; Cicchetti, Volkmar et al., 1992); orcontinuous, interval, or dimensionally scaled data (Feinstein,1987, pp. 24-25). Specific administration and scoring rules areprovided, in the form of a manual, that can be used to trainclinical examiners who plan to use the assessment instrumentin the most reliable manner possible.
Once the instrument has been successfully field tested or pilottested, with items retained, deleted, revised, or added to the fi-nal product, a second type of validity assessment is possible,namely, face validity. Do the items indeed look as though theymeasure what they are intended to measure? Drawing from therevised Vineland, it would be most unlikely that items measur-ing the receptive subdomain of Communication (i.e., what theindividual understands) would ever be confused with either theexpressive subdomain (i.e., what the individual says) or the writ-ten subdomain (i.e., what the individual reads and writes).
Discriminant validity is evidenced by the extent to which arelevant behavior or other test response is performed differen-tially by specifically selected samples in accordance with expec-
This
doc
umen
t is c
opyr
ight
ed b
y th
e A
mer
ican
Psy
chol
ogic
al A
ssoc
iatio
n or
one
of i
ts a
llied
pub
lishe
rs.
This
arti
cle
is in
tend
ed so
lely
for t
he p
erso
nal u
se o
f the
indi
vidu
al u
ser a
nd is
not
to b
e di
ssem
inat
ed b
road
ly.

288 DOMENIC V. CICCHETTI
tations or hypothesized relationships among the selectedgroups. Several examples of this type of validity measurementwere obtained using the aforementioned Vineland supplemen-tary norm groups, namely, visually handicapped, hearing-im-paired, and emotionally disturbed residential children.
As hypothesized, (a) emotionally disturbed children (i.e., byDSM-IH criteria) showed their most serious deficits in theVineland Socialization domain and manifested significantlymore maladaptive behaviors than was true of their nonhandi-capped peers in the standardization program, (b) visually hand-icapped children showed the most extensive deficits of any ofthe supplementary norm groups in overall adaptive behavior,and (c) hearing-impaired children evidenced their greatestdeficits on the Vineland Communication domain (Cicchetti &Sparrow, 1990).
Kaufman and Kaufman (1993) used information from KAITsupplementary norms with a different objective in mind,namely, to provide what they refer to as clinical validity sam-ples. By matching these clinical samples to controls on the de-mographic variables of age, gender, race or ethnicity, and edu-cational status, the authors were able to provide some convinc-ing preliminary evidence of the potential applicability of theKAIT "for assessing a variety of clinical and neurological prob-lems" (p. 107). The clinical validity samples included peoplewho were neurologically impaired (i.e., right-hemisphere im-pairment), clinically depressed, and reading disabled; as well aspeople with dementia of the Alzheimer's type. The authors areto be commended for expressing caution until the results of ap-propriate cross-validation samples are available. In a broadersense, the example presented illustrates the manner in whichstudies can be designed appropriately for testing the extent towhich major cognitive assessment instruments may providespecific diagnostic information, in the form of normative data,that might be useful for applying the test to samples other thanthose on which it was originally nationally normed andstandardized.
Concurrent validity refers to the extent to which a new assess-ment instrument correlates with an earlier instrument measur-ing the same or, more likely, a similar construct. In this particu-lar area, it is not possible to generate useful rules of thumb con-cerning an ideal or minimally or maximally useful correlationvalue, as so much depends on what the new test purports tomeasure in relation to the old one. We know for sure that wewould hope for a correlation of neither 1.00 nor 0. In the firstcase, the new test could be considered a veritable clone of theone with which it is being compared. In the second case, theconstruct validity of the very concept being measured would becalled into question. Another important factor is the extent towhich societal and cultural changes since the development of anew test may have necessitated major item changes, as in thecase of what was considered adaptive behavior more than threedecades ago (e.g., the Vineland Social Maturity Scale; Doll,1935,1965) in comparison with today. For example, it was con-sidered adaptively appropriate for children to roam their neigh-borhoods unattended during Doll's era, but in many neighbor-hoods today this may be viewed as maladaptive (or potentiallylife threatening). Another factor is the extent to which earlierinstruments may have been inappropriately standardized ornormed, for example, the original Vineland Social Maturity
Scale, normed on an unrepresentative sample from Vineland,New Jersey; or the original version of the MMPI (Hathaway &McKinley, 1940), normed on a sample based in Minnesota, incomparison with the more broad-based norms produced for theMMPI-2 (Butcher et al., 1989). Examples of concurrent valid-ity of nationally normed adaptive behavior and IQ tests can befound in Sparrow and Cicchetti (1989) and in Kaufman andKaufman (1993).
In terms of factorial validity, as noted by Sparrow, Balla, andCicchetti (1984a, pp. 43-44) and Sparrow and Cicchetti (1989),two types of factor analyses were undertaken (principal compo-nent, principal factor) on the Vineland nationally normed andstandardized sample of nonhandicapped U.S. subjects. In gen-eral, subdomains and their respective items loaded appropri-ately on their intended domains, that is to say, in general, the fitof subdomains (e.g., receptive, expressive, written language)into their intended domains (i.e., Communication) was quitesuccessful. For example, for children 2-3 years of age, the writ-ten subdomain, as expected, did not correlate significantly withthe factor labeled Communication. Consistent with this result,for children 8-9 years of age, the receptive domain did not fitinto the Communication domain to any significant degree. Thisis also to be expected. Moreover, for both younger (aged 2 to 3years) and older (aged 8 to 9 years) children, the fit of subdo-mains into their respective domains was highly significant. Forexample, the three subdomains interpersonal relationships,play and leisure time, and coping skills were the most highlycorrelated with the Socialization factor, "which is comprisedprecisely of these three subdomains" (Sparrow & Cicchetti,1989, p. 212).
Kaufman and Kaufman (1993) argue convincingly that "fac-tor structure is probably the most important evidence of a the-ory-based, multiscale test's construct validity" (pp. 90-95). Us-ing both exploratory and confirmatory factor analyses on theirKAIT data, Kaufman and Kaufman provided impressive re-sults indicating that the two subtests defining the KAIT emergeconsistently across age groups. Specifically, the two factors co-incide very closely with the division of subtests into the two de-fined scales of the KAIT, namely, Fluid and Crystallized Scalesof Adult Intelligence.
Before leaving this important section, one needs to focus ona special application of validity assessment that has been usedwith some well-known assessment instruments in psychologybut derives originally from the field of medical diagnosis. In anumber of (but not all) areas of medicine, it is possible to doconfirmatory laboratory examinations that serve as the goldstandard for the presence or absence of certain diseases. Suchconfirmatory evidence defines what might be referred to as cri-terion validity. Using this paradigm, one can compare the phys-ician's test result (e.g., a diagnosis of bacteremia) with the re-sults of a confirmatory result. The usual fourfold contingencytable that is thereby generated is illustrated in Table 3. The fourcells can then be identified, in terms of the examination's sensi-tivity, specificity, positive predictive value, and negative predic-tive value, as follows: Sensitivity, defined as a/(a + c), refers tothe extent to which the cases confirmed as positive by the labo-ratory test positive by the clinician (also referred to as true pos-itive cases). Specificity, defined as d/(b 4- d), refers to the extentto which the cases confirmed as negative by the laboratory test
This
doc
umen
t is c
opyr
ight
ed b
y th
e A
mer
ican
Psy
chol
ogic
al A
ssoc
iatio
n or
one
of i
ts a
llied
pub
lishe
rs.
This
arti
cle
is in
tend
ed so
lely
for t
he p
erso
nal u
se o
f the
indi
vidu
al u
ser a
nd is
not
to b
e di
ssem
inat
ed b
road
ly.

SPECIAL SECTION: EVALUATING ASSESSMENT INSTRUMENTS 289
Table 3Hypothetical Fourfold Contingency Table
Confirmatory lab resultPhysician
exam result Positive
Positive (+) (+ +) (a)Negative (— ) ( — 1-) (c)
Total (a + c)
Negative Total
(+-)(b) (a + b)(- -) (d) (c + d)
(b + d) N
negative by the physician (also referred to as true negativecases). Overall accuracy, denned as (a + d)/N, refers to the ex-tent to which all tested cases (true positive plus true negative)produce the correct diagnosis. Positive predictive value, dennedas a/(a + b), refers to the extent to which the test positive cases ofthe physician are confirmed positive by the laboratory. Negativepredictive value, denned as d/(c + d), refers to the extent towhich the test negative cases of the physician are confirmed neg-ative by the laboratory. The false positive cases are defined bythe (+ -) or the b cell, and the false negative cases are definedby(- +) or the c cell.
Although it is not yet possible to develop laboratory con-firmed diagnoses of personality or mental disorders in the be-havioral sciences, in recent years, some behavioral scientistshave used the "best clinician diagnosis" (i.e., positive or nega-tive) as a criterion, or gold standard, against which to comparethe results of a normed and standardized test (i.e., positive ornegative). Recent examples follow. Using a combined score of10 or higher on the Beck Depression Inventory (Beck, Ward,Mendelson, Mock, & Erbaugh, 1961) and a simultaneous andindependent DSM-III diagnosis of clinical depression, as thecriterion, and established MMPI standard score cutoff pointsdefining depression, we were able to show in a sample of outpa-tients the following: an MMPI (a) sensitivity of 78%, (b) speci-ficity of 75%, (c) overall diagnostic accuracy of 77%, (d) positivepredictive value of 93%, and (e) negative predictive value of 43%(Nelson & Cicchetti, 1991).
For a much more comprehensive approach to this problem,see the theory-driven work of Millon (1987), who succinctlysummarized the need for such an approach:
Diagnostic instruments are more useful when they are linked sys-tematically to a comprehensive clinical theory. Unfortunately, asmany have noted (Butcher, 1972), assessment techniques and per-sonality theorizing have developed almost independently. As a re-sult, few diagnostic measures have either been based on or haveevolved from clinical theory. The MCMI-II is different. Each of its22 clinical scales was constructed as an operational measure of asyndrome derived from a theory of personality and psychopathol-ogy (Millon, 1969, 1981). As such, the scales and profile of theMCMI-II measure theory-derived variables directly and quantifi-ably. Since these variables are anchored to a broad-based and sys-tematic theory, they suggest specific patient diagnoses and clinicaldynamics, as well as testable hypotheses about social history andcurrent behaviors. (Millon, 1987, p. 3)
Summary
In summary, this article represents an attempt to highlightthe need for well-normed and standardized test instruments in
psychology in particular and in the behavioral sciences in gen-eral. As appropriate, guidelines, criteria, and rules of thumbhave been provided to help clinicians arrive at a decision as towhich among a myriad of available test instruments might bemost appropriate for a given psychological assessment. It is notintended to be a comprehensive survey of the entire literatureof appropriately normed and standardized assessment instru-ments, a colossal endeavor that is far beyond the stated objec-tives. Rather, I chose to focus mainly on known test instrumentsthat have clearly defined and desirable psychometric propertiesand have very desirable norms that are based on appropriatestandardization procedures. For comprehensive reviews ofthese basic issues in the field of intelligence testing, the inter-ested reader is referred to Kaufman's (1990) scholarly, compre-hensive, and insightful book Assessing Adolescent and Adult In-telligence and, more recently, to Kaufman and Kaufman's 1993test manual for the KAIT. For a comprehensive review of otheradaptive behavior scales, see Reschly (1987), Salvia and Yssel-dyke (1988), and Sattler (1987).
References
American Psychiatric Association. (1980). Diagnostic and statisticalmanual of mental disorders (3rd ed.). Washington, DC: Author.
Bartko, J. J. (1966). The intraclass correlation coefficient as a measureof reliability. Psychological Reports, 19, 3-11.
Bartko, J. J. (1974). Corrective note to: "The intraclass correlation co-efficient as a measure of reliability." Psychological Reports, 34, 418.
Bartko, J. J., & Carpenter, W. T. (1976). On the methods and theory ofreliability. Journal of Nervous and Mental Disease, 163, 307-317.
Beck, A., Ward, C., Mendelson, M., Mock, J., & Erbaugh, J. (1961). Aninventory for measuring depression. Archives for Psychiatry, 4, 561-571.
Butcher, J. N. (Ed.). (1972). Objective personality assessment. NewYork: Academic Press.
Butcher, J., Dahlstrom, W, Graham, J., Tellegen, A., & Kaemmer, B.(1989). Minnesota Multiphasic Personality Inventory-2 (MMPI-2):Manual for administration and scoring. Minneapolis: University ofMinnesota Press.
Cicchetti, D. V. (1976). Assessing inter-rater reliability for rating scales:Resolving some basic issues. British Journal of Psychiatry, 129, 452-456.
Cicchetti, D. V., & Sparrow, S. S. (1981). Developing criteria for estab-lishing interrater reliability of specific items: Applications to assess-ment of adaptive behavior. American Journal of Mental Deficiency,86, 127-137.
Cicchetti, D. V., & Sparrow, S. S. (1990). Assessment of adaptive behav-ior in young children. In J. J. Johnson and J. Goldman (Eds.), Devel-opmental assessment in clinical child psychology: A handbook (pp.173-196). New York: Pergamon Press.
Cicchetti, D. V., Sparrow, S. S., & Rourke, B. P. (1991). Adaptive behav-ior profiles of psychologically disturbed and developmentally disabledpersons. In J. L. Matson and J. Mulich (Eds.), Handbook of mentalretardation (pp. 222-239). New York: Pergamon Press.
Cicchetti, D. V., & Tyrer, P. (1988). Reliability and validity of personal-ity assessment. In P. J. Tyrer (Ed.), Personality disorders: Diagnosis,management and course (pp. 63-73). London: ButterworthScientific.
Cicchetti, D. V, Volkmar, F, Sparrow, S. S., Cohen, D., Fermanian, J.,& Rourke, B. P. (1992). Assessing the reliability of clinical scales whenthe data have both nominal and ordinal features: Proposed guidelinesfor neuropsychological assessments. Journal of Clinical and Experi-mental Neuropsychology, 14, 673-686.
This
doc
umen
t is c
opyr
ight
ed b
y th
e A
mer
ican
Psy
chol
ogic
al A
ssoc
iatio
n or
one
of i
ts a
llied
pub
lishe
rs.
This
arti
cle
is in
tend
ed so
lely
for t
he p
erso
nal u
se o
f the
indi
vidu
al u
ser a
nd is
not
to b
e di
ssem
inat
ed b
road
ly.

290 DOMENIC V. CICCHETTI
Cronbach, L. J. (1970). Essentials of psychological testing (3rd ed.).New York: Harper & Row.
Doll, E. A. (1935). A genetic scale of social maturity. The AmericanJournal of Orthopsychiatry, 5, 180-188.
Doll, E. A. (1965). The Vineland Social Maturity Scale. Circle Pines,MN: American Guidance Service.
Dunn, L. M, & Dunn, L. (1981). Manual for the Peabody Picture Vo-cabulary Test—Revised (PPVT-R). Circle Pines, MN: AmericanGuidance Service.
Feinstein, A. R. (1987). Clinimetrics. New Haven, CT: Yale University.Fitzpatrick, A. R. (1983). The meaning of content validity. Applied Psy-
chological Measurement, 7, 3-13.Fleiss, J. L. (1975). Measuring agreement between two judges on the
presence or absence of a trait. Biometrics, 31, 651-659.Fleiss, J. L. (1981). Statistical methods for rates and proportions (2nd
ed.). New York: Wiley.Fleiss, J. L., & Cohen, J. (1973). The equivalence of weighted kappa
and the intraclass correlation coefficient as measures of reliability.Educational and Psychological Measurement, 33, 613-619.
Grove, W. M., Andreasen, N. C, McDonald-Scott, P., Keller, M. B., &Shapiro, R. W. (1981). Reliability studies of psychiatric diagnosis:Theory and practice. Archives of General Psychiatry, 38, 408-413.
Hathaway, S. R., & McKinley, J. C. (1940). A multiphasic personalityschedule (Minnesota): I. Construction of the schedule. Journal ofPsychology, 10, 249-254.
Kamphaus, R. W. (1993). Clinical assessment of children's intelligence.Boston: Allyn & Bacon.
Kaufman, A. S. (1990). Assessing adolescent and adult intelligence.Boston: Allyn & Bacon.
Kaufman, A. S., & Kaufman, N. L. (1983). Kaufman Assessment Bat-tery for Children (K-ABC) administration and scoring manual. CirclePines, MN: American Guidance Service.
Kaufman, A. S., & Kaufman, N. L. (1993). Kaufman Adolescent andAdult Intelligence Test (KAIT) manual. Circle Pines, MN: AmericanGuidance Service.
Kazdin, A. E. (1982). Single-case research designs: Methods for clinicaland applied settings. New York: Oxford University Press.
Landis, J. R., & Koch, G. G. (1977). The measurement of observeragreement for categorical data. Biometrics, 33, 159-174.
Millon, T. (1969). Modern psychopathology. Philadelphia: W. B.Saunders.
Millon, T. (1981). Disorders of personality: DSM-IH, Axis II. NewYork: Wiley.
Millon, T. (1987). Millon Clinical Multiaxial Inventory-H: Manual forthe MCMI-H. Minneapolis: National Computer Systems, Inc.
Nelson, L. D., & Cicchetti, D. (1991). Validity of the MMPI Depressionscale for outpatients. Psychological Assessment: A Journal of Consult-ing and Clinical Psychology, 3, 55-59.
Nelson, L., Cicchetti, D. V., Satz, P., Stern, S., Sowa, M., Metrushina,
M., & Van Gorp, W. (1993). Emotional sequelae of stroke. Neuropsy-chology, 7, 553-560.
Nunnally, J. C. (1978). Psychometric theory (2nd ed.). New York:McGraw-Hill.
Reschly, D. J. (1987). Adaptive behavior in classification and program-ming with students who are handicapped (Monograph). Minneapolis,MN: Department of Education.
Salvia, J., & Ysseldyke, J. (1988). Assessment in special and remedialeducation (4th ed.). Boston: Houghton Mifflin.
Saltier, J. M. (1987). Assessment of children's abilities (3rd ed.). SanDiego, CA: Author.
Shrout, P. E., & Fleiss, J. L. (1979). Intraclass correlations: Uses in as-sessing rater reliability. Psychological Bulletin, 86, 420-428.
Sparrow, S. S., Balla, D. A., & Cicchetti, D. V. (1984a). The VinelandAdaptive Behavior Scales: A revision of the Vineland Social MaturityScale by Edgar A. Doll. I. Survey form. Circle Pines, MN: AmericanGuidance Service.
Sparrow, S. S., Balla, D. A., & Cicchetti, D. V. (1984b). The VinelandAdaptive Behavior Scales: A revision of the Vineland Social MaturityScale by Edgar A. Doll. II. Expanded form. Circle Pines, MN: Amer-ican Guidance Service.
Sparrow, S. S., Balla, D. A., & Cicchetti, D. V. (1985). The VinelandAdaptive Behavior Scales: A revision of the Vineland Social MaturityScale by Edgar A. Doll. III. Classroom edition. Circle Pines, MN:American Guidance Service.
Sparrow, S. S., & Cicchetti, D. V. (1985). Diagnostic uses of the Vine-land Adaptive Behavior Scales. Journal ofPediatric Psychology, 10,215-225.
Sparrow, S. S., & Cicchetti, D. V. (1987). Adaptive behavior and thepsychologically disturbed child. Journal of Special Education, 21,89-100.
Sparrow, S. S., & Cicchetti, D. V. (1989). The Vineland Adaptive Behav-ior Scales. In C. S. Newmark (Ed.), Major psychological assessmentinstruments (pp. 199-231). Boston: Allyn & Bacon.
Sparrow, S. S., Fletcher, J. M., & Cicchetti, D. V. (1985). Psychologicalassessment of children. In R. Michels, J. O. Cavenar, H. K. H. Brodie,A. M. Cooper, S. B. Guze, L. L. Judd, G. L. Klerman, & A. J. Solnit(Eds.), Psychiatry (Vol. 2, pp. 1-12). Philadelphia: Lippincott.
Thorndike, R. L., Hagen, E. P., & Saltier, J. M. (1986). Stanford-BinetIntelligence Scale (4lh ed.). Chicago: Riverside.
Tyrer, P., Slrauss, J., & Cicchetti, D. V. (1983). Temporal reliability ofpersonality in psychiatric patients. Psychological Medicine, 13, 393-398.
Wechsler, D. (1981). Manual for the Wechsler Adult Intelligence Scale-Revised (WAIS-R). New York: Psychological Corporation.
Received January 5,1994Revision received May 16, 1994
Accepted May 18,1994 •
This
doc
umen
t is c
opyr
ight
ed b
y th
e A
mer
ican
Psy
chol
ogic
al A
ssoc
iatio
n or
one
of i
ts a
llied
pub
lishe
rs.
This
arti
cle
is in
tend
ed so
lely
for t
he p
erso
nal u
se o
f the
indi
vidu
al u
ser a
nd is
not
to b
e di
ssem
inat
ed b
road
ly.