guide to the president’s budget
TRANSCRIPT

guide to the president’s budget Research & Development FY 2017
A M E R I C A N A S S O C I A T I O N F O R T H E A D V A N C E M E N T O F S C I E N C E

1 GUIDE TO THE PRESIDENT’S BUDGET | RESEARCH & DEVELOPMENT FY 2017
▲ BACK TO TABLE OF CONTENTS
guide to the president’s budget Research & Development FY 2017
Matt Hourihan and David ParkesAAAS R&D Budget and Policy Program
This version is up to date as of September 20, 2016. Please visit http://www.aaas.org/program/rd-budget-and-policy-program for updates and revisions. The AAAS Board of Directors, in accordance with Association policy, has approved publication of this report as a contribution to the understanding of an important process. The interpretations and conclusions are those of the authors and do not purport to represent the views of the Board or the Council of the Association.
Copyright © 2016 by the American Association for the Advancement of Science 1200 New York Avenue NW, Washington, DC 20005

2 GUIDE TO THE PRESIDENT’S BUDGET | RESEARCH & DEVELOPMENT FY 2017
▲ BACK TO TABLE OF CONTENTS
CONTENTS
PREFACE ................................................................................................................................................................................ 3
INTRODUCTION AND OVERVIEW ......................................................................................................................... 4
DEPARTMENT OF DEFENSE (DOD) ........................................................................................................................ 13
NATIONAL INSTITUTES OF HEALTH (NIH) ...................................................................................................... 20
DEPARTMENT OF ENERGY (DOE) .......................................................................................................................... 28
NATIONAL AERONAUTICS AND SPACE ADMINISTRATION (NASA) ..................................................... 37
NATIONAL SCIENCE FOUNDATION (NSF) ........................................................................................................ 46
UNITED STATES DEPARTMENT OF AGRICULTURE (USDA) ....................................................................... 53
DEPARTMENT OF COMMERCE (DOC) ................................................................................................................. 57
DEPARTMENT OF TRANSPORTATION (DOT) ...................................................................................................61
DEPARTMENT OF HOMELAND SECURITY (DHS) ...........................................................................................63
DEPARTMENT OF VETERANS AFFAIRS (VA) .......................................................................................................66
DEPARTMENT OF THE INTERIOR (DOI) .............................................................................................................68
ENVIRONMENTAL PROTECTION AGENCY (EPA) ...........................................................................................71
INTERAGENCY R&D INITIATIVES ........................................................................................................................74
APPENDIX 1 OVERVIEW TABLES .............................................................................................................................82
APPENDIX 2 THE FEDERAL BUDGET PROCESS ................................................................................................97
APPENDIX 3 DISCIPLINES AT FEDERAL AGENCIES .....................................................................................100
APPENDIX 4 METHODOLOGY AND DATA SOURCES ..................................................................................105
APPENDIX 5 AAAS COMMITTEE ON SCIENCE, ENGINEERING AND PUBLIC POLICY ...............107
TABLE OF CONTENTS

3 GUIDE TO THE PRESIDENT’S BUDGET | RESEARCH & DEVELOPMENT FY 2017
▲ BACK TO TABLE OF CONTENTS
PREFACE
Welcome to the 41st edition of AAAS’s annual report on research and development (R&D) in the President’s proposed budget. Since 1976, AAAS has published this series to provide timely, accurate information and analysis to policymakers and the scientific and engineering communities. The report was originally created under the auspices of the AAAS Committee on Science, Engineering and Public Policy (see Appendix 5).
The organization of this report is straightforward. We begin with an overview of spending levels and priorities in the President’s FY 2017 budget, issued on February 9, 2016. We then present brief summaries of R&D budget submissions for the twelve largest R&D departments and agencies, from the Department of Defense to the Environmental Protection Agency. Tables and charts can be found throughout. The report concludes with appendices on the federal budget process, methodology, and definitions, along with additional data tables.
As is explained in more detail in the first chapter, this year’s budget includes an unusual number of proposals for R&D funded via mandatory spending. We make an effort throughout the report and accompanying tables to make the distinction between mandatory and discretionary spending.
Lastly, this report was prepared under intense deadline pressure. We ask the reader’s forgiveness for any omissions on our part. This report will be updated with corrections and data revisions as necessary.
Readers familiar with past editions of this report may notice things look a bit different this year. After many years as a collaborative effort with the Intersociety Working Group – a AAAS-convened, evolving group of more than two dozen scientific, engineering, and industrial associations and institutions of higher education – we have decided this year to streamline the contents, update the design, and publish the complete report on a faster timeline as a fully in-house AAAS product. The reader should note that the set of tables found in this report is essentially the same as that in prior editions.
AAAS and the Intersociety Working Group intend to undertake a new report later this year that focuses on appropriations, key issues, and the overarching Congressional context for budget decisions. These two reports – on the President’s budget request and on appropriations context – should be seen as companion pieces, covering different aspects of the budget cycle at different times of the year. Together we hope these two products will provide a more complete analysis of federal science and technology funding.
Lastly, we are very grateful to individuals in the White House Office of Management and Budget and the Office of Science and Technology Policy, in agency budget offices, on congressional staffs, and elsewhere who aided us in collecting the information and advised us on its interpretation.
Matt Hourihan March 2016

WWW.AAAS.ORG/PROGRAM/RD-BUDGET-AND-POLICY-PROGRAM 4
▲ BACK TO TABLE OF CONTENTS
1 For a summary of the budget deal, see http://www.aaas.org/news/two-year-budget-deal-means-room-rd-growth. 2 See CBO’s Budget and Economic Outlook, 2016 to 2026, https://www.cbo.gov/publication/51129
INTRODUCTION AND OVERVIEW
THE SPENDING AND POLITICAL CONTEXT FOR FY 2017
After a delayed appropriations cycle, the October budget deal and the December FY 2016 omnibus allowed science agency budgets to continue their recent recovery from sequestration-level spending. In fact, thanks to relatively positive funding outcomes in two out of the past three omnibus bills, most major R&D agencies are now at or near their pre-sequestration spending levels in FY 2016, even adjusting for inflation (more on that below).
But the story threatens to be a bit different now at the start of the FY 2017 appropriations cycle. The aforementioned October budget deal – specifically, the Bipartisan Budget Act of 2015 – lifted the spending caps by $80 billion or 3.9 percent over two years, but that spending increase was front-loaded.1 In the first year, the discretionary spending cap increased by 5.2 percent in FY 2016, enabling some striking funding jumps – including a $2 billion boost for NIH and a 7.1 percent boost for NASA. But the caps are scheduled to remain basically flat from FY 2016 to FY 2017 before inflation, even with the budget deal’s nominal increase above sequestration levels (see Figure 1). The discretionary budget contains virtually all R&D and represents a “center of gravity” around which science agency budgets tend to cluster, so constrained discretionary spending means limited room for science spending growth.
The situation coming into the FY 2017 cycle is a reasonable facsimile of the situation two years ago. Then, the second year of a two-year budget deal (the first Bipartisan Budget Act) also meant limited funding changes for FY 2015. And like the situation two years ago, an upcoming election provides an added wrinkle, with appropriations likely to grind to a halt as electoral activities heat up. This year, the success of anti-establishment candidates is helping to propel Congressional arguments from the right on the need to trim spending further. Those arguments have also been bolstered by the recurrence of a rising deficit, for the first
time in several years. According to long-term projections from the Congressional Budget Office (CBO), the federal deficit is expected to rise by $105 billion in FY 2016, and continual deficits mean national debt could reach 86 percent of GDP by 2026.2 This trend is primarily due to long-term growth in entitlement spending though that hasn’t kept discretionary spending – already on the decline – out of the budget-cutting debate.
Lastly, it’s worth noting that GOP leadership hopes to achieve an aggressive, productive timetable with appropriations; House Speaker Paul Ryan (R-WI) has said he’d like to see all appropriations passed through the House in July. But with continued conflict among the Congressional majority, the threat of “poison pill” policy riders, and the looming election, it’s not clear this Congress will have any more luck than prior Congresses in returning to regular order – that magical place in which budget resolutions and appropriations bills are drafted and approved on time, before the end of the fiscal year, and with minimal fuss.
Bipartisan Budget Act of 2015
Actual Base Budget Authority
BCA: Initial Pre-Sequestration Baseline
BCA: Sequestration Baseline
Current Law Beyond FY17
$0
$950
$1,200
$1,250
$1,050
$1,100
$1,150
2010
2011
2012
2013
2014
2015
2016
2017
2018
2019
2020
2021
Figure 1: Discretionary Spending Caps Through FY 2021(billions of constant 2016 dollars)
Based on past budget resolutions, the Budget Control Act, and subsequent legislation and OMB budgets. Adjusted for inflation using deflators from the FY17 request. © AAAS 2016

5 GUIDE TO THE PRESIDENT’S BUDGET | RESEARCH & DEVELOPMENT FY 2017
▲ BACK TO TABLE OF CONTENTS
THE FY 2017 BUDGET: THE BASICS
Into this context, the Obama Administration introduced its final budget. The budget does abide by the agreed-upon discretionary cap of $1.07 trillion in FY 2017, but adds on top of that base budget an unorthodox tweak for R&D: a package of proposals to be financed through new mandatory spending, which would not be subject to the spending caps. This mandatory package represents an alternative strategy for an administration unhappy with current spending levels. Again, there are echoes of the FY 2015 cycle of two years ago. Then, the Administration proposed a multibillion-dollar Opportunity, Growth, and Security Initiative of extra, supra-cap spending. That proposal was largely ignored; it remains to be seen what will come of this mandatory package, which will be discussed more fully below.
In all, the President’s FY 2017 budget proposes $4.1 trillion in outlays and a deficit of $503 billion, according to the Office of Management and Budget (OMB).3 Mandatory spending would reach 62.9 percent of the budget – a slight decline from FY 2016, but in line with the historical shift from discretionary to mandatory spending (see Figure 2). Mandatory outlays would increase by 4.8 percent, while discretionary outlays would increase by 0.8 percent. Net interest payments would jump by 26.1 percent.
MANDATORY AND DISCRETIONARY R&D
Understanding R&D in the President’s budget this year is made somewhat more complicated by the extensive use of new mandatory spending: of the proposed $6.2 billion increase for R&D, $4.2 billion is funded via mandatory dollars (see below for details). Again, remember that most R&D is typically contained in the discretionary budget, which is the part of the budget that Congress adjusts and allocates every year through the appropriations process. Those few mandatory R&D programs that have become law are small, or for particular activities like diabetes research. This year’s approach is atypical in that the Administration would use mandatory spending for a wide array of research activities across multiple agencies.
Before diving into the numbers, there are important differences between mandatory and discretionary spending worth understanding for those unfamiliar with the distinctions. Mandatory spending – also known as direct spending – refers to any spending written into, and required by, laws other than appropriations bills. Getting a mandatory funding stream established requires
new legislation, and that legislation would have to come from the authorizing committees rather than the appropriations committees. For instance, the President’s FY 2017 proposal for an increase in competitive agricultural research would be achieved partly through the regular Agriculture appropriations bill and partly through new (hypothetical) legislation by the Committees on Agriculture to establish the mandatory component.
One reason mandatory spending is an attractive alternative for the Administration is that it is not subject to the discretionary spending caps. But it does come with some challenges. For one, appropriators don’t always favor mandatory spending, as it takes the power to allocate federal dollars out of their hands. In addition, new mandatory spending is subject to PAYGO rules, which means it must be deficit-neutral and offset by revenue increases or spending cuts elsewhere. The Administration has identified one such revenue stream through the 21st Century Clean Transportation Plan, which would levy a fee on oil companies to pay for infrastructure investments.4 See Appendix Tables I-2 and I-3.
Part of this plan would include R&D funding for the Departments of Transportation and Energy, and for NASA (see Table 2), accounting for $800 million of the $4.2 billion for mandatory
3 See Appendix Tables I-2 and I-3.4 See White House fact sheet, https://www.whitehouse.gov/the-press-office/2016/02/04/fact-sheet-president-obamas-21st-century-clean-transportation-system
[DEFENSE R&D) $78.917
[NONDEFENSE R&D] $67.761
MEDICAID $385.582
OTHER MANDATORY
$655.827
NET INTEREST
$302.7DEFENSE
DISCRETIONARY$528.683
NONDEFENSEDISCRETIONARY
$557.139
SOCIAL SECURITY
$966.8
MEDICARE$598.191
Figure 2: Composition of the Proposed FY 2017 BudgetTotal Outlays = $4.1 trillion(outlays in billions of dollars)
*Approximately $4 billion for R&D is financed through mandatory spending. Figures are estimates.Source: Budget of the United States Government FY 2017. © 2016 AAAS

WWW.AAAS.ORG/PROGRAM/RD-BUDGET-AND-POLICY-PROGRAM 6
▲ BACK TO TABLE OF CONTENTS
R&D. Particular mechanisms for the remaining mandatory funding have not been specified, though the Administration has also issued a menu of savings in other parts of the budget that Congress could draw upon as offsets, if they are so inclined.
Because of this mandatory spending distinction, the tables contained in this report are more complicated than usual. For consistency, and to best reflect what appropriators will actually be working with, most tables and graphs in this report primarily display the base budget, which includes discretionary spending plus any previously-approved mandatory spending. However, data on new mandatory spending is also frequently included alongside the base budget in most aggregate and agency tables (as seen, for instance, at the bottom of Table 1). In practice, this means that there are effectively two different sets of budget numbers: those with mandatory spending included, and those with it excluded. This certainly complicates things, but the authors believe this approach most accurately and fairly captures the contours of the budget in an apples-to-apples fashion.
R&D IN THE FY 2017 BUDGET
According to AAAS estimates based on OMB and agency data, R&D in the base budget would rise to $150.1 billion in FY 2017, an increase of 1.2 percent above FY 2016 levels. With the additional R&D funded through mandatory spending, total R&D would reach $154.3 billion, a 4.0 percent increase. Table 1 and Figure 3 show the spending breakdown by agency, while Table 2 breaks out R&D funded through mandatory spending.
The top-line R&D figure can be divided in two ways: between defense and nondefense R&D, and by character. The defense and nondefense division is fairly straightforward. Defense only includes the Department of Defense (DOD) and defense-related R&D funded through the Department of Energy, mainly the National Nuclear Security Administration (NNSA). Nondefense R&D is everything else.
In the President’s base budget, defense R&D would increase by $2.9 billion or 3.7 percent, while nondefense R&D would decline by $1.0 billion or 1.5 percent (Table 1). The nondefense decline is entirely driven by sizable base-budget cuts at NIH at NASA coupled with only modest gains in other agencies. Also note that the $4.2 billion in new mandatory R&D is entirely on the nondefense side. If Congress were to provide all of this additional funding, nondefense R&D would exceed the defense increase at $3.1 billion, or 4.5 percent.
ALL OTHER; $6.0
NSF; $6.2
USDA; $2.6
COMMERCE; $1.9
TOTAL R&D=$150.1 BILLION
DOD; $73.7
NASA;$12.2
HHS (NIH);$30.9
DOE;$16.6
Figure 3: Base Budget R&D by Agency, FY 2017(budget authority in billions of dollars)
Source: OMB R&D data, agency budget justifications, and other agency documents and data. R&D includes conduct of R&D and R&D facilities. © 2016 AAAS
$0
$10
$20
$30
$40
$50
$60
$70
$80
$90
DEFENSE NONDEFENSE Facilities & Equipment
Development
Applied
Basic
Figure 4: FY 2017 Base Budget R&D by Character(budget authority in billions)
Source: OMB and agency R&D data. © 2016 AAAS

7 GUIDE TO THE PRESIDENT’S BUDGET | RESEARCH & DEVELOPMENT FY 2017
▲ BACK TO TABLE OF CONTENTS
The character division is slightly more complex. There are five classes: basic research, applied research, development, facilities construction, and R&D equipment. Further, basic plus applied research yields “total research,” while facilities plus equipment equals “R&D facilities” or “R&D plant.”5 Defense and nondefense R&D have very different characters, as shown in Figure 4. Most defense R&D consists of technology development activities at DOD. On the other hand, nondefense R&D is very much focused on basic and applied research.
As shown in Figure 5, funding for different classes of R&D would fare very differently in the President’s base budget. In particular, basic research would decline by 2.1 percent per AAAS estimates, while applied research would drop by 0.7 percent. Total research – including both basic and applied – would thus see a 1.4 percent decrease. Factoring in new mandatory proposals, which are mostly devoted to basic and applied research, makes the picture look very different, as shown; total research funding would rise by 3.5 percent to $73.8 billion in this scenario. See the appendix tables for complete breakdowns of R&D by agency and by character.
Total
Transportation
Justice (DHS)
General Science (NSF, DOE SC)
Environment Agencies
Space
Commerce (NIST)
Health NIH
Agriculture
Defense Activities
Applied Energy Programs
25%
-0.5%
20%15%10%5%0%-5%-10%-15%
19.8%
3.7%
3.2%
2.3%
1.2%
-2.3%
-2.7%
-2.7%
-8.8%
-1.9%
Figure 6: FY 2017 R&D in the Base Budget by Function(percent change from FY 2016, nominal dollars)
Source: OMB R&D data, agency budget justifications, and agency budget documents. © 2016 AAAS
5 See appendix for definitions.6 See White House fact sheet: https://www.whitehouse.gov/the-press-office/2016/02/09/fact-sheet-cybersecurity-national-action-plan 7 See White House fact sheet: https://www.whitehouse.gov/the-press-office/2016/01/30/fact-sheet-president-obama-announces-computer-science-all-initiative-0
-2%
-3%
1%
2%
-1%
0%
3%
4%
5%
Basic Research Applied Research Development R&D Facilities
Base Budget Base Plus Mandatory
Inflation is 1.8 percent. © 2016 AAAS
Figure 5: Proposed Changes to R&D by Character (percent change from FY 2016, nominal dollars)

WWW.AAAS.ORG/PROGRAM/RD-BUDGET-AND-POLICY-PROGRAM 8
▲ BACK TO TABLE OF CONTENTS
PRIORITIES AND REDUCTIONS
When identifying overarching priorities, it can be useful to arrange R&D spending by budget function, which are the 20 classifications used by OMB to divide up federal outlays. Figure 6 shows this data for the base budget, and major agencies within certain functions are identified (note General Science and Space are in a single function, but AAAS breaks these out into their subfunctions).
One major priority clearly jumps out: applied energy R&D. In particular, the Administration again proposes major increases for the Office of Energy Efficiency and Renewable Energy, the Office of Electricity Delivery and Energy Reliability, and the Advanced Research Projects Agency-Energy, or ARPA-E. This is not surprising, as low-carbon energy technology has arguably been the Obama Administration’s biggest R&D priority. Though harder to pick out, the energy priority is also present in the General Science function, as the Department of Energy’s Office of Science accounts for the bulk of the increase there. Investments would increase in several core research areas, including computing. See the Energy Department section of this report for more detail.
Also a priority in the base budget is Defense technology, specifically downstream development activities at DOD. The National Nuclear Security Administration also reports a large increase for R&D.
Environment and Natural Resources R&D also gets some attention, though more modest. The increase there is mostly driven by the U.S. Geological Survey and the National Oceanic and Atmospheric Administration (NOAA).
Additional priorities emerge on the mandatory side, including cancer research, grants for competitive agricultural research, and National Science Foundation research. The Administration also again proposes nearly $2 billion for the National Network for Manufacturing Innovation, and a slate of activities related to low-carbon transportation and infrastructure (see Table 2). Other new initiatives include a new national cybersecurity modernization effort 6 and the multiagency Computer Science for All program.7
The base budget provides more reductions than increases at the functional level, however. Most notably, NASA faces a steep cut, and the NASA budget would actually still be reduced even with the injection of new mandatory spending. These cuts mostly focus on the Science Mission Directorate and exploration development activities, as in years past.
NIH also faces a billion-dollar cut to its base budget, and the agency would entirely rely on mandatory spending to make up the difference.
Defense science and technology would also be reduced by over $500 million, including another proposed steep cut for Department of Defense basic research.
Once again, domestic fusion energy research would be cut at the Department of Energy, by over 15 percent.
The reader should note that while agricultural R&D shows a reduction in Figure 6, this is mostly due to a smaller request for facilities modernization following a large appropriation in FY 2016. Also, the Commerce reduction is actually driven by a smaller request for Census Bureau R&D, which tends to fluctuate, while NIST would receive a discretionary funding increase.
THE FY 2017 BUDGET IN HISTORICAL CONTEXT
Lastly, a few notes to place the budget in context. In historical terms, base budget funding would drop federal R&D to 0.75 percent of GDP, its lowest point since the Space Race (see Figure 7). This is mostly due to the nondefense R&D decline. Factoring in mandatory new R&D, however, would keep federal
NondefenseDefenseTotal
0.0%
0.4%
0.8%
1.2%
1.4%
0.2%
0.6%
1.0%
1976
1980
1984
1988
1992
1996
2000
2004
2012
2016
2008
Figure 7: Federal R&D as a percent of GDP(base budget R&D only in FY 2017)
Source: AAAS analyses of historical budget and agency data and the FY 2017 request. GDP figures from OMB. R&D includes conduct and facilities. © AAAS

9 GUIDE TO THE PRESIDENT’S BUDGET | RESEARCH & DEVELOPMENT FY 2017
▲ BACK TO TABLE OF CONTENTS
R&D steady from FY 2016 levels at 0.78 percent of GDP, according to AAAS estimates.
Finally, the President’s base budget would roll back the recent budget recovery for multiple agencies and programs. Figure 8 plots out changes in the budgets for several science and technology agencies, and base discretionary spending, since FY 2010. As can be seen, changes in the discretionary budget have had ripple effects on science agency budgets, with a decline and recovery pattern emerging over the past five years. Without new mandatory spending, NIH, NASA, USDA R&D, and DOD science and technology funding would all drop markedly under the request, erasing many of the fiscal gains since FY 2013. See those report sections for additional details.
-30%
-25%
-5%
-10%
5%
0%
-15%
-20%
2010
2011
2012
2013
2014
2015
2016
2017
Re
ques
t
DOE Science
NIH
NASA
USDA & R&D
DOD S&T
Base Discretionary Caps
DOE Applied Programs*
NSF
Figure 8: Federal Spending Since FY 2010(percent change from FY 2010 levels, constant dollars)
*Includes EERE, OE, Fossil, Nuclear; excludes ARPA-E (regular appropriations began in FY 2011). Based on AAAS analyses of historical OMB , agency, and appropriations data and the President’s FY 2017 request. © 2016 AAAS

WWW.AAAS.ORG/PROGRAM/RD-BUDGET-AND-POLICY-PROGRAM 10
▲ BACK TO TABLE OF CONTENTSOVERVIEW TABLES
Table 1. R&D in the FY 2017 Budget by Agency(budget authority in millions of dollars, base budgets only)
FY 2015Actual
FY 2016Estimate
FY 2017Budget
Change FY 16-17
Amount Percent
Total R&D (Conduct of R&D and R&D Facilities)
Dept. of Defense 1/ 66,524 72,237 73,743 1,506 2.1%
S&T (6.1-6.3) 12,024 13,037 12,501 -536 -4.1%
All Other DOD 54,500 59,201 61,242 2,041 3.4%
Health and Human Services 30,177 31,917 30,914 -1,003 -3.1%
National Institutes of Health 28,750 30,618 29,592 -1,026 -3.4%
All Other HHS 1,427 1,299 1,322 23 1.8%
Energy 14,385 14,387 16,634 2,247 15.6%
Atomic Energy Defense 6,197 5,726 7,082 1,356 23.7%
Office of Science 5,099 5,305 5,523 217 4.1%
Energy Programs 3,089 3,356 4,029 673 20.1%
NASA 11,413 13,273 12,170 -1,103 -8.3%
National Science Foundation 5,990 6,117 6,160 44 0.7%
Agriculture 2,454 2,674 2,598 -77 -2.9%
Commerce 1,527 1,904 1,879 -26 -1.3%
NOAA 692 805 810 4 0.6%
NIST 669 773 806 33 4.3%
Transportation 887 924 866 -58 -6.2%
Homeland Security 919 579 585 6 1.0%
Veterans Affairs 1,178 1,220 1,252 32 2.6%
Interior 864 974 1,076 102 10.5%
US Geological Survey 666 676 781 105 15.5%
Environ Protection Agency 521 513 512 -1 -0.3%
Education 279 242 248 6 2.5%
Smithsonian 246 250 270 20 8.0%
Intl Assistance Programs 250 275 287 12 4.4%
Patient-Centered Outcomes Res 396 472 530 58 12.3%
(continued)

11 GUIDE TO THE PRESIDENT’S BUDGET | RESEARCH & DEVELOPMENT FY 2017
▲ BACK TO TABLE OF CONTENTS
Table 1 (continued). R&D in the FY 2017 Budget by Agency(budget authority in millions of dollars, base budgets only)
FY 2015Actual
FY 2016Estimate
FY 2017Budget
Change FY 16-17
Justice 62 69 65 -4 -5.8%
Nuclear Reg Comm 69 86 90 4 4.7%
State 40 40 40 0 0.0%
Housing and Urban Dev 50 60 98 38 63.3%
Social Security 48 51 58 7 13.7%
Tennessee Valley Authority 12 10 17 7 70.0%
Postal Service 28 19 19 0 0.0%
Corps of Engineers 9 9 11 2 22.2%
Cnsmer Prod Safety Comm 2 2 4 2 100.0%
Total R&D 138,328 148,305 150,126 1,821 1.2%
New Mandatory R&D 4,156
Total R&D (incl. new mandatory) 154,282 5,977 4.0%
Defense R&D 1/ 72,721 77,963 80,825 2,862 3.7%
Nondefense R&D 65,607 70,343 69,302 -1,041 -1.5%
New Mandatory R&D 4,156
Total Nondefense R&D (incl. new mandatory) 73,458 3,115 4.4%
Basic Research 31,909 33,510 32,791 -719 -2.1%
New Mandatory 1,718
Total Basic (incl. new mandatory) 34,509 999 3.0%
Applied Research 36,101 37,794 37,511 -283 -0.7%
New Mandatory 1,777
Total Applied (incl. new mandatory) 39,288 1,494 4.0%
1/ DOD R&D figure includes DOD RDT&E prior-year budget authority adjustments. “Defense R&D” includes DOD and DOE Atomic Defense (including NNSA).Source: OMB R&D data, agency budget justifications, and agency budget documents.Note: The projected GDP inflation rate between FY 2016 and FY 2017 is 1.8 percent.All figures are rounded to the nearest million. Changes calculated from unrounded figures.
OVERVIEW TABLES
WWW.AAAS.ORG/PROGRAM/RD-BUDGET-AND-POLICY-PROGRAM 12
▲ BACK TO TABLE OF CONTENTSOVERVIEW TABLES
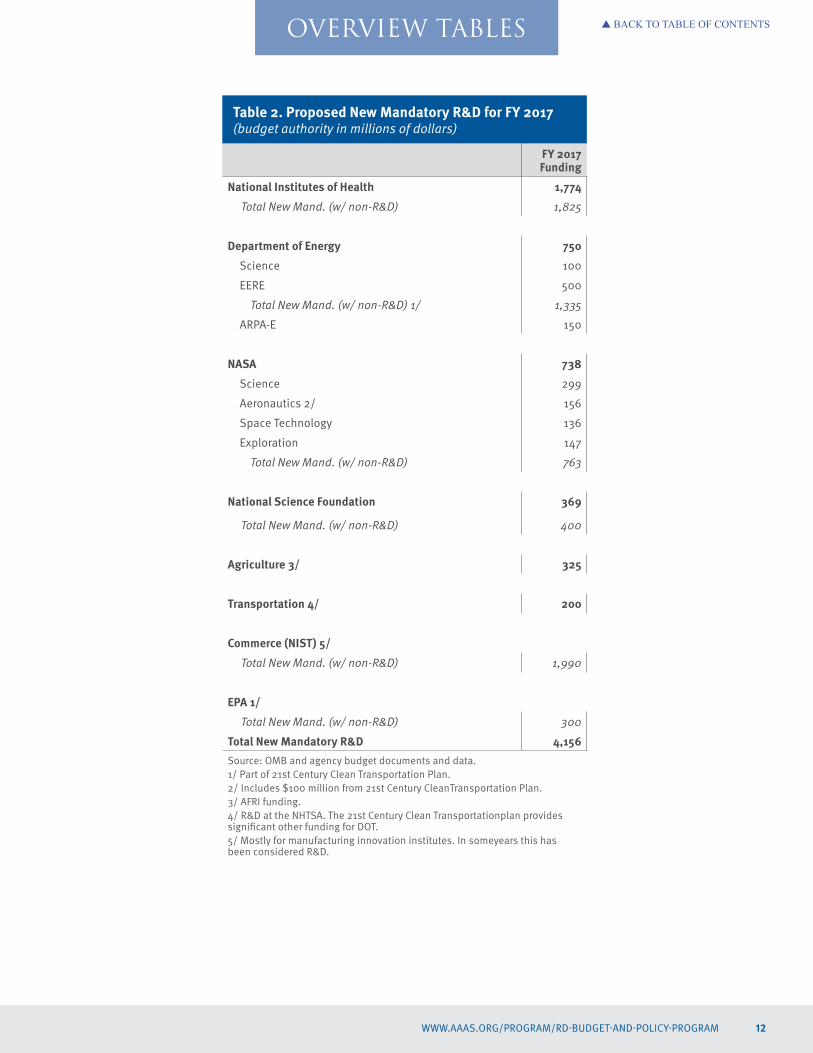
Table 2. Proposed New Mandatory R&D for FY 2017(budget authority in millions of dollars)
FY 2017Funding
National Institutes of Health 1,774
Total New Mand. (w/ non-R&D) 1,825
Department of Energy 750
Science 100
EERE 500
Total New Mand. (w/ non-R&D) 1/ 1,335
ARPA-E 150
NASA 738
Science 299
Aeronautics 2/ 156
Space Technology 136
Exploration 147
Total New Mand. (w/ non-R&D) 763
National Science Foundation 369
Total New Mand. (w/ non-R&D) 400
Agriculture 3/ 325
Transportation 4/ 200
Commerce (NIST) 5/
Total New Mand. (w/ non-R&D) 1,990
EPA 1/
Total New Mand. (w/ non-R&D) 300
Total New Mandatory R&D 4,156Source: OMB and agency budget documents and data.1/ Part of 21st Century Clean Transportation Plan.2/ Includes $100 million from 21st Century CleanTransportation Plan.3/ AFRI funding.4/ R&D at the NHTSA. The 21st Century Clean Transportationplan provides significant other funding for DOT.5/ Mostly for manufacturing innovation institutes. In someyears this has been considered R&D.

13 GUIDE TO THE PRESIDENT’S BUDGET | RESEARCH & DEVELOPMENT FY 2017
▲ BACK TO TABLE OF CONTENTS
1 This year DOD R&D accounts for approximately 49 percent of federal R&D in the base budget request. See Appendix Table I-1.2 For a discussion of the first offset strategy in the 1970s and 1980s, see this AAAS Q&A from January: http://www.aaas.org/news/driving-legacy-sector-innovation-qa 3 See December 2015 report in Defense News: http://www.defensenews.com/story/defense/innovation/2015/12/14/work-third-offset-tech-development-pentagon-russia/77283732/
DEPARTMENT OF DEFENSE (DOD)
CONTEXT AND RECENT HISTORY
The Department of Defense (DOD) typically accounts for roughly one-half of the federal R&D budget.1 Over the past 16 years, the size of the DOD R&D budget has risen and fallen with national security concerns and overseas military activities. Following the September 11 attacks, with the War on Terror and invasions of Iraq and Afghanistan, the DOD R&D budget increased by 59.2 percent through FY 2007. The budget subsequently declined by 25.4 percent between FY 2010 and FY 2014, in conjunction with the Iraq drawdown. However, much of this change has been in funding for downstream development activities, labeled accounts 6.4 through 6.7 in the DOD Research, Development, Test, and Evaluation (RDT&E) nomenclature, as shown in Table 5 below. These activities focus on moving new technologies from prototypes through production and into operational status in the hands of the warfighter. Basic research activities, at the other end of the spectrum, have been generally immune to these fluctuations, and instead have seen fairly steady growth.
In recent years, one major focus for DOD has been its so-called third offset strategy, formally announced in late 2014 by then-Secretary Chuck Hagel, and officially unveiled in this budget. An effort to maintain technological superiority, the strategy focuses on activities like human-machine learning, robotics, undersea warfare, hypersonics, and semi-autonomous weapons, among others.2 Last December, Deputy Secretary of Defense Bob Work, who is overseeing the effort, said the next year would be an important one in laying the groundwork for the strategy.3
DOD is also an active partner in the Administration’s manufacturing efforts via the National Network for Manufacturing Innovation (NNMI). To date, DOD has established six public-private institutes in collaboration with industry, focused on an array of advanced topics like additive manufacturing, photonics, and digital design.
OVERVIEW
According to DOD figures, total RDT&E spending would increase to $72.1 billion in FY 2017, a 4.1 percent increase (Table 1). This increase is entirely via the downstream development activities, while science and technology (S&T) spending – composed of basic and applied research and advanced technology development, or 6.1 through 6.3 in the DOD nomenclature (Table 5) – would be dealt an array of cuts across military department and agencies. S&T will be discussed below.
An additional sum for DOD R&D comes from outside the RDT&E title for Defense Health Program medical research, destruction of chemical agents, and select other activities (displayed in Table 1 and Table 2). Adding in these other accounts yields total DOD R&D, amounting to $73.7 billion in FY 2017, a 2.1 percent increase.
Also of note is that while almost all DOD R&D is contained in the base budget, “small” sums are also usually included in the war budget, dubbed the Overseas Contingency Operations or OCO budget, which is not subject to the current discretionary spending caps. Typically OCO RDT&E is for downstream development activities or classified programs, with little-to-none funding S&T. In previous years some lawmakers have seen this extra funding as a potential avenue for boosting defense spending without violating the caps. The Bipartisan Budget Act of October 2015 allowed for just under $74 billion in OCO funding for FY 2016 and FY 2017; the President’s request for OCO abides by this agreement. According to DOD documents, $374.2 million of the OCO budget is for RDT&E, mostly for classified activities.
Reports indicate $3.6 billion in this year’s request is devoted to activities around the offset strategy, with $18 billion planned as part of the Future Year Defense Program over the following four years,4 though DOD officials and others have pointed out that determining exactly what program elements should or should not be considered part of the offset strategy may be somewhat imprecise. Only $35 million of this is contained in the Science and Technology accounts, with the rest devoted to downstream development activities. The budget also provides $902 million for the Strategic Capabilities Office, a key player in the offset strategy and an active long-term developer of several advanced technologies, vehicles, aircraft, and weapons.

WWW.AAAS.ORG/PROGRAM/RD-BUDGET-AND-POLICY-PROGRAM 14
▲ BACK TO TABLE OF CONTENTS
4 http://www.defensenews.com/story/defense/policy-budget/budget/2016/02/09/third-offset-fy17-budget-pentagon-budget/80072048/
The budget provides $45 million for two offices in the relatively new Defense Innovation Unit-Experimental (DIU-X) program, intended to serve as a bridge between industry partners in technology clusters and DOD; the first facility, established in 2015, is located in Silicon Valley. DOD would also provide $40 million to In-Q-Tel, an independent venture capital firm that supports technology of interest to CIA and other intelligence agencies. And the budget reports a 13.4 percent increase in cyberspace operations to $6.7 billion.
SCIENCE AND TECHNOLOGY (S&T)
For the third year in a row, DOD’s basic research programs would be subject to a sizable reduction (9.0 percent this year, as shown in Table 3), but in contrast with last year’s budget, applied research and advanced technology development would also be cut, resulting in an overall decline of 4.1 percent in S&T funding (see Tables 1 and 4).
Within Army research activities, in spite of the apparent cut to basic research, most projects in the Defense Research Sciences element would see limited changes. Larger cuts come on the applied research front, however, including funding for work on advanced materials, sensor technology, and tactical vehicles. Several of these elements received plus-ups from Congress in the FY 2016 omnibus.
Navy, on the other hand, faces steeper cuts. Among basic research activities, university programs would face large cuts, including the Defense University Research Instrumentation Program (DURIP) and the Multidisciplinary University Research Initiative, both of which would see the numbers of awards reduced. Oceanographic research funding was also reduced. There were also several reductions on the applied research front, though many of these projects were boosted by Congress in the omnibus.
Air Force fares best among the military branches in terms of research funding. Many Air Force basic research projects – which run the gamut of fields and disciplines – received only minor adjustments in the budget request. On the applied research front, there were boosts for certain aerospace and spacecraft technology programs; advanced guidance technology for munitions, a priority area in the offset strategy; and directed energy technology in a joint project with the Defense Advanced Research Projects Agency (DARPA).
With a 3.7 percent increase, DARPA would continue to support an array of activities, with particular increases in the information and communications technology, aerospace and space technology, and electronics realms, in accord with larger DOD priorities. DARPA will also start a new project in FY 2017 on quantum materials, and boost funding for other materials research.
The Office of the Secretary of Defense (OSD) would boost support of the National Defense Education Program by 27.6 percent to $69.3 million, mostly due to an expansion of the Science, Mathematics, and Research for Transformation (SMART) scholarship program. However, other basic research and support activities would be trimmed, including the Minerva Initiative, the National Security Science and Engineering Faculty Fellowship, and support for minority institutions. OSD provides $137.1 million for NNMI activities and another $23.1 million for the Manufacturing S&T Program, both modest increases. DOD plans to establish two more manufacturing institutes in FY 2017, while continuing to support the six existing institutes.
$0
$2
$4
$6
$8
$10
$12
$14
$16
$18
1990
1993
1996
1999
2002
2005
2008
2011
2014
2017
$20
ARRA
Medical Research
Applied (6.2)
Basic (6.1)
Adv Tech (6.3)
Figure 1: DOD S&T Funding(in billions of constant FY 2016 dollars)
Source: DOD R-1 in FY 2017, and historical data. Medical Research is appropriated outside RDT&E title. © 2016 AAAS

15 GUIDE TO THE PRESIDENT’S BUDGET | RESEARCH & DEVELOPMENT FY 2017
▲ BACK TO TABLE OF CONTENTS
Typically, the Pentagon’s request for the Defense Health Research program shows a major cut each year, as it is standard practice for DOD to not include a funding request for the Congressionally Directed Medical Research Program. These activities focus on peer-reviewed medical research across a wide array of areas including cancers, Alzheimer’s disease, post-traumatic stress disorder, spinal cord injury, and many other topics. Congress typically adds this funding during appropriations each year, and the total sum can approach $1 billion depending on availability of funds and needs elsewhere. The amount requested covers extensive research activities, mostly intramural, throughout the armed services’ research ecosystem.
IN HISTORICAL CONTEXT
In historical terms, DOD S&T funding in the President’s request would end up 4.4 percent below pre-sequestration levels, though still well above sequestration-level funding in FY 2013. Basic research, while subject to a large reduction and thus below recent-year funding levels, would nevertheless remain elevated in historical terms. It was only until FY 2010 that DOD basic research funding consistently surpassed $2.0 billion per year in inflation-adjusted dollars, and basic research would remain above that level in FY 2017 (see Figure 1).

WWW.AAAS.ORG/PROGRAM/RD-BUDGET-AND-POLICY-PROGRAM 16
▲ BACK TO TABLE OF CONTENTSOVERVIEW TABLESDOD TABLES
Table 1. Department of Defense R&D(budget authority in millions of dollars)
FY 2015Actual
FY 2016Estimate
FY 2017Budget
Change FY 16-17
Amount Percent
Research, Development, Test, and Evaluation (RDT&E)
Basic Research (“6.1”) 2,213 2,309 2,102 -207 -9.0%
Applied Research (“6.2”) 4,578 4,996 4,815 -181 -3.6%
Total Research 6,791 7,305 6,917 -388 -5.3%
Adv Tech Development (“6.3”) 5,233 5,731 5,584 -148 -2.6%
Total Science & Technology 12,024 13,037 12,501 -536 -4.1%
Adv. Component Dev (“6.4”) 12,252 14,290 15,032 742 5.2%
System Dev And Demon (“6.5”) 10,853 12,789 13,079 290 2.3%
Management Support (“6.6”) 5,419 4,417 4,312 -105 -2.4%
Operational Sys Dev (“6.7”) 7,999 8,251 10,024 1,773 21.5%
Classified Programs (“999”) 15,540 17,184 16,818 -366 -2.1%
BA Adjustment -216 -693 362
Total RDT&E 63,872 69,275 72,128 2,853 4.1%
Medical Research 1/ 1,699 2,121 823 -1,299 -61.2%
Other Appropriations 2/ 953 841 792 -49 -5.8%
Total DOD R&D 66,524 72,237 73,743 1,506 2.1%
DOD R&D by Character
Conduct of R&D 66,624 72,918 73,190 272 0.4%
R&D Facilities and Equipment 116 13 191 178 1,369.2%
Source: OMB R&D data, Budget of the U.S. Government, Fiscal Year 2017, and DOD “RDT&E Programs” (R-1).Includes Overseas Contingency Operation funding.All figures rounded to the nearest million. Changes calculated from unrounded figures.Character of work (“6.x”) categories are expressed in total obligational authority (TOA).BA Adjustment converts TOA into budget authority. 1/ Medical research is appropriated in Defense Health Programs, not RDT&E.2/ R&D support in military personnel, construction, chemical agents and munitions destruction, and other programs.
17 GUIDE TO THE PRESIDENT’S BUDGET | RESEARCH & DEVELOPMENT FY 2017
▲ BACK TO TABLE OF CONTENTSOVERVIEW TABLESDOD TABLES
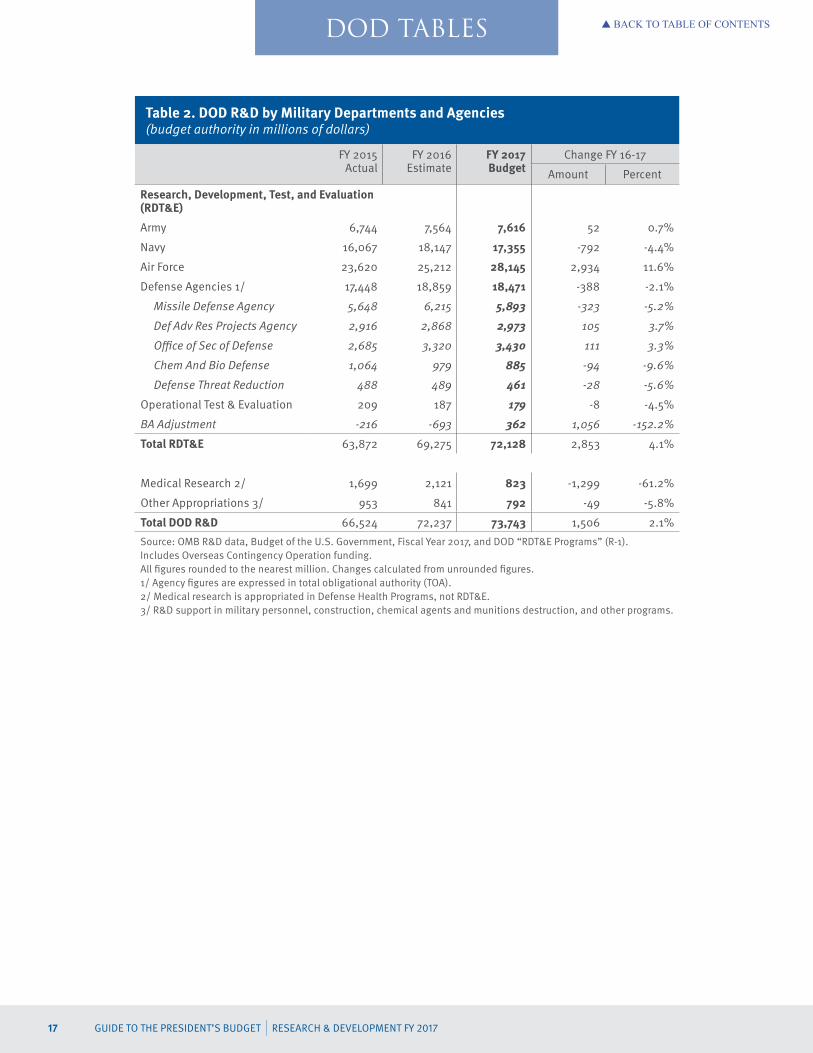
Table 2. DOD R&D by Military Departments and Agencies(budget authority in millions of dollars)
FY 2015Actual
FY 2016Estimate
FY 2017Budget
Change FY 16-17
Amount Percent
Research, Development, Test, and Evaluation (RDT&E)
Army 6,744 7,564 7,616 52 0.7%
Navy 16,067 18,147 17,355 -792 -4.4%
Air Force 23,620 25,212 28,145 2,934 11.6%
Defense Agencies 1/ 17,448 18,859 18,471 -388 -2.1%
Missile Defense Agency 5,648 6,215 5,893 -323 -5.2%
Def Adv Res Projects Agency 2,916 2,868 2,973 105 3.7%
Office of Sec of Defense 2,685 3,320 3,430 111 3.3%
Chem And Bio Defense 1,064 979 885 -94 -9.6%
Defense Threat Reduction 488 489 461 -28 -5.6%
Operational Test & Evaluation 209 187 179 -8 -4.5%
BA Adjustment -216 -693 362 1,056 -152.2%
Total RDT&E 63,872 69,275 72,128 2,853 4.1%
Medical Research 2/ 1,699 2,121 823 -1,299 -61.2%
Other Appropriations 3/ 953 841 792 -49 -5.8%
Total DOD R&D 66,524 72,237 73,743 1,506 2.1%
Source: OMB R&D data, Budget of the U.S. Government, Fiscal Year 2017, and DOD “RDT&E Programs” (R-1).Includes Overseas Contingency Operation funding.All figures rounded to the nearest million. Changes calculated from unrounded figures.1/ Agency figures are expressed in total obligational authority (TOA).2/ Medical research is appropriated in Defense Health Programs, not RDT&E.3/ R&D support in military personnel, construction, chemical agents and munitions destruction, and other programs.

WWW.AAAS.ORG/PROGRAM/RD-BUDGET-AND-POLICY-PROGRAM 18
▲ BACK TO TABLE OF CONTENTSOVERVIEW TABLESDOD TABLES
Table 3. Department of Defense Basic Research (“6.1”)(TOA in millions of dollars)
FY 2015Actual
FY 2016Estimate
FY 2017Budget
Change FY 16-17
Amount Percent
Army
In-House Lab Indep Research 13 13 12 -1 -4.9%
Defense Research Science 250 279 253 -26 -9.3%
Univ Research Initiatives 79 73 69 -3 -4.7%
Univ and Ind Res Centers 106 104 94 -10 -9.6%
Total Army 448 469 429 -40 -8.6%
Navy
In-House Lab Indep Research 19 19 19 -1 -3.2%
Defense Research Science 486 507 423 -84 -16.5%
Univ Research Initiatives 129 146 102 -44 -30.4%
Total Navy 634 672 543 -129 -19.2%
Air Force
Defense Research Science 382 375 341 -34 -9.0%
Univ Research Initiatives 143 142 145 3 2.3%
High Energy Laser Res Init 14 14 14 0 2.8%
Total Air Force 539 530 500 -30 -5.7%
Defense Agencies
DTRA Basic Research Initiative 37 38 35 -3 -7.8%
Defense Research Sciences 322 333 362 29 8.8%
Basic Research Initiatives 41 72 37 -35 -49.0%
Gov/Industry Univ Research 33 36 24 -12 -34.2%
Basic Oper Medical Research Sci 59 57 58 1 2.2%
Nat Def Edu Program 55 54 69 15 27.6%
Chem and Bio Def Program 46 48 45 -3 -6.2%
Total Defense Agencies 593 638 630 -8 -1.3%
DOD Totals
In-House Lab Indep Research 32 32 31 -1 -3.9%
Defense Research Sciences 1440 1494 1379 -115 -7.7%
Univ Research Initiatives 351 361 316 -45 -12.4%
All Other 390 423 376 -47 -11.1%
Total DOD Basic Research 2213 2309 2102 -207 -9.0%
Source: DOD “RDT&E Programs” (R-1).All figures rounded to the nearest million. Changes calculated from unrounded figures.

19 GUIDE TO THE PRESIDENT’S BUDGET | RESEARCH & DEVELOPMENT FY 2017
▲ BACK TO TABLE OF CONTENTSDOD TABLES
Table 4. Department of Defense S&T (“6.1”-”6.3”)(TOA in millions of dollars)
FY 2015Actual
FY 2016Estimate
FY 2017Budget
Change FY 16-17
Amount Percent
Science and Technology (“6.1” through “6.3” plus medical research)
Army 2,501 2,689 2,267 -423 -15.7%
Basic Research (“6.1”) 448 469 429 -40 -8.6%
Applied Research (“6.2”) 964 1,093 908 -185 -17.0%
Advanced Tech. Dev. (“6.3”) 1,089 1,127 930 -197 -17.5%
Navy 2,116 2,334 2,141 -193 -8.3%
Basic Research (“6.1”) 634 672 543 -129 -19.2%
Applied Research (“6.2”) 856 966 861 -105 -10.8%
Advanced Tech. Dev. (“6.3”) 626 696 737 41 5.9%
Air Force 2,235 2,481 2,486 5 0.2%
Basic Research (“6.1”) 539 530 500 -30 -5.7%
Applied Research (“6.2”) 1,090 1,240 1,260 20 1.6%
Advanced Tech. Dev. (“6.3”) 606 710 726 15 2.2%
Defense Agencies 5,172 5,533 5,607 75 1.3%
Basic Research (“6.1”) 593 638 630 -8 -1.3%
Applied Research (“6.2”) 1,668 1,697 1,787 89 5.3%
Advanced Tech. Dev. (“6.3”) 2,911 3,197 3,191 -7 -0.2%
Total “6.1” through “6.3” 12,024 13,037 12,501 -536 -4.1%
Medical research 1/ 1,699 2,121 823 -1,299 -61.2%
Source: DOD “RDT&E Programs” (R-1) and Budget of the U.S. Government, Fiscal Year 2017.All figures rounded to the nearest million. Changes calculated from unrounded figures.1/ Medical research is appropriated in Defense Health Program, not RDT&E.
Table 5. Department of Defense R&D
Classification Description
Science and Technology Activities
Basic Research (“6.1”) Scientific study for greater understanding of phenomena without specif-ic applications in mind. Farsighted, potentially high-payoff research.
Applied Research (“6.2”) Expansion and application of knowledge to understand the means to meet a specific need. Development of useful materials, devices, sys-tems or methods.
Adv Tech Development (“6.3”) Development and integration of subsystems and components into model prototypes for field experiments and/or tests in a simulated envi-ronment. Proof-of-concept testing.
Weapons Development Activities
Advanced Component Development and Prototypes (6.4)
Evaluation of integrated technologies or prototypes in realistic operat-ing environments. Technology transitions from laboratory to operational use.
System Development and Demonstra-tion (6.5)
Development of mature systems in preparation for actual production. Prototype performance established at or near planned operational system levels, including live fire testing.
RDT&E Management Support (6.6) Funds to sustain or modernize installations or operations for the perfor-mance of general RDT&E, including test ranges, military construction, and maintenance for laboratories and test vehicles.
Operational System Development (6.7) Efforts to upgrade systems that have been fielded or have received approval for full production in the near term.
Adapted from DOD Financial Management Regulation 7000.14-R, Volume 2B

WWW.AAAS.ORG/PROGRAM/RD-BUDGET-AND-POLICY-PROGRAM 20
▲ BACK TO TABLE OF CONTENTS
1 See https://nexus.od.nih.gov/all/2015/03/25/age-of-investigator/ 2 See http://www.aaas.org/news/omnibus-sets-major-boosts-several-science-agencies 3 Modern Healthcare, “House overwhelmingly passes 21st Century Cures Act,” http://www.modernhealthcare.com/article/20150710/NEWS/150719998
NATIONAL INSTITUTES OF HEALTH (NIH)
CONTEXT AND RECENT HISTORY
The National Institutes of Health (NIH) budget doubled from FY 1998 to FY 2003, as part of a bipartisan Congressional effort, but appropriations since the end of that doubling have been less kind. While NIH remains the largest nondefense R&D agency by a good margin, its purchasing power adjusted for the higher rate of biomedical inflation declined by 22.5 percent between FY 2003, the last year of the doubling, and FY 2015 (see Figure 1). This funding erosion coupled with the aftereffects of said doubling meant that NIH’s success rate for new grant awards has also declined over that time, from above 30 percent at the start of the doubling to below 20 percent today (see Figure 2 on next page). The average age of NIH-funded researchers and first-time awardees has also been on the rise,1 and the agency remains interested in remedying these trends.
The funding tables began to perhaps turn last year in the FY 2016 omnibus, however, when NIH received a $2 billion boost. The increase was the largest in any single year over a decade, at 6.6 percent. The National Institute on Aging received a fifth of this increase, or $400 million, to boost its budget by 33.4 percent, mostly for Alzheimer’s research funding. Other institutes mostly received increases in the four to five percent range.2
OVERALL NUMBERS
As in other agencies, NIH relies on new mandatory funding for a portion of its FY 2017 request. The NIH mandatory proposal stands at $1.825 billion; including or excluding this portion completely changes the complexion of NIH’s request for FY 2017 (see Table 1). NIH’s total budget, including all funding from all sources, would rise by $825 million in FY 2017, good for a 2.6 percent increase. But NIH’s base budget, including only discretionary spending and previously-approved mandatory spending, would actually face a cut of $1.0 billion or 3.1 percent. It’s a similar story for the R&D budget. Note that there are no specific offsets or payment mechanisms tied to the NIH mandatory request, though the request did provide a long list of potential savings mechanisms
in other parts of the budget that could serve as offsets should Congress choose. The 21st Century Cures Act, which is through the House but faces uncertain odds in the Senate at the time of this writing, would provide a mandatory FY 2017 funding stream of a similar magnitude to that proposed by the Administration by, in part, tapping the Strategic Petroleum Reserve.3
As shown in Table 1, the cut to the base budget would have different effects on different institutes. Some, like the National Institute of Allergy and Infectious Diseases (NIAID), the National Human Genome Research Institute (NHGRI), and the National Library of Medicine would see reductions of less than 1 percent. Others would be cut by more – perhaps most notably the National Institute on Aging, which would receive a 20.8 percent cut to its base budget; this is partly a reflection of the large appropriation it received in the omnibus to elevate its FY 2016 budget, as mentioned above.
$0
$5
$10
$15
$20
$25
$30
$35
$40
$451998
2000
2002
2004
2006
2008
2010
2012
2014
2016
$50
All Other
Mental Health
NIDDK
Heart Lung Blood
NIAID
Cancer
General Med Sci
ARRA Funding
New Mandatory (FY 17)
Figure 1: NIH Budget, FY 1998 - 2017(budget authority in billions of constant FY 2016 dollars)
Source: Agency budget data and the FY 2017 request. Adjusted for biomedical R&D inflation rate (BRDPI). Excludes supplemental Zika proposal and FY 2015 Ebola funding. © 2016 AAAS
21 GUIDE TO THE PRESIDENT’S BUDGET | RESEARCH & DEVELOPMENT FY 2017
▲ BACK TO TABLE OF CONTENTS
The new mandatory package, as shown in Table 1, is dominated by cancer research funding. The President’s National Cancer Moonshot accounts for $680 million of the $1.825 billion, for research related to prevention, detection, vaccines, and the genomics of cancer, among other areas (the Food and Drug Administration will also receive an additional $75 million in mandatory funding for its own work related to the moonshot, and investments will come from the departments of Defense and Veterans Affairs).4 The National Cancer Institute (NCI) would receive an additional $116.2 million in mandatory spending for other purposes; altogether, then, NCI funding accounts for over 43 percent of the mandatory package, and would be in line for a major boost should the Administration obtain it.
Another $45 million of the mandatory package would go towards the Brain Research through Advancing Innovative Neurotechnologies (BRAIN) Initiative, allowing it to reach $195 million in total NIH support. And $100 million is for the second year of the Precision Medicine Initiative, which would continue building a national research cohort of one million volunteers, while also pursuing related oncology research. Put the mandatory funding for these three priorities together – BRAIN, Precision Medicine, and cancer moonshot – and they account for the entirety of the NIH funding increase for FY 2017, divided between NCI and the Office of the Director, which houses trans-NIH initiatives. The remaining $1 billion in new mandatory funds would be used to fill the billion-dollar cut proposed in the base budget, thereby keeping all other institutes flat.
It should also be noted that this new package would not be the only mandatory funding for NIH in FY 2017. NIH also maintains the Special Type I Diabetes Research Program at $150 million a year, reauthorized in 2015 via the Medicare Access and CHIP Reauthorization Act. Additional funding comes via a discretionary transfer from the Department of the Interior to the National Institute of Environmental Health Sciences (NIEHS), for the Superfund Research Program.
Lastly, as part of the request, the Administration is requesting $130 million for NIH research related to Zika and chikungunya vaccines. House appropriators have said the Administration should utilize unobligated and readily available balances of Ebola funding instead, at least for now.5
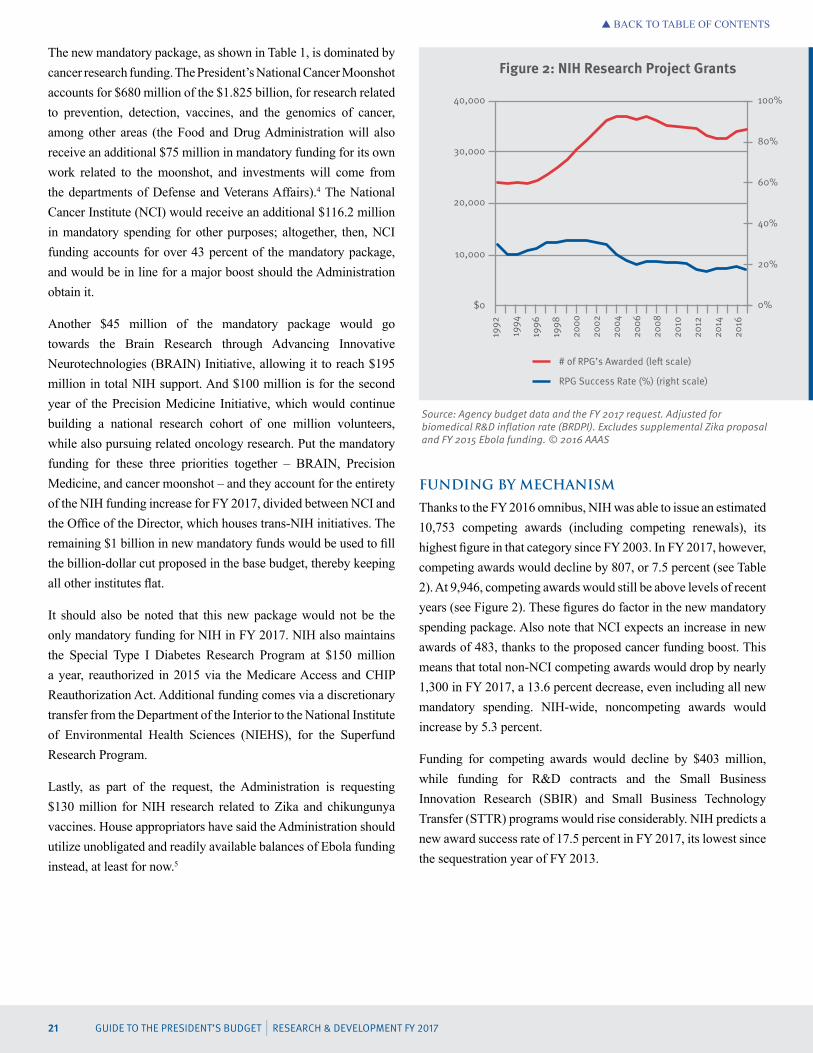
FUNDING BY MECHANISM
Thanks to the FY 2016 omnibus, NIH was able to issue an estimated 10,753 competing awards (including competing renewals), its highest figure in that category since FY 2003. In FY 2017, however, competing awards would decline by 807, or 7.5 percent (see Table 2). At 9,946, competing awards would still be above levels of recent years (see Figure 2). These figures do factor in the new mandatory spending package. Also note that NCI expects an increase in new awards of 483, thanks to the proposed cancer funding boost. This means that total non-NCI competing awards would drop by nearly 1,300 in FY 2017, a 13.6 percent decrease, even including all new mandatory spending. NIH-wide, noncompeting awards would increase by 5.3 percent.
Funding for competing awards would decline by $403 million, while funding for R&D contracts and the Small Business Innovation Research (SBIR) and Small Business Technology Transfer (STTR) programs would rise considerably. NIH predicts a new award success rate of 17.5 percent in FY 2017, its lowest since the sequestration year of FY 2013.
# of RPG’s Awarded (le� scale)
$0
10,000
30,000
40,000
20,000
20%
80%
60%
100%
40%
0%
1992
1994
1996
1998
2000
2002
2004
2006
2008
2010
2012
2014
2016
RPG Success Rate (%) (right scale)
Figure 2: NIH Research Project Grants
Source: Agency budget data and the FY 2017 request. Adjusted for biomedical R&D inflation rate (BRDPI). Excludes supplemental Zika proposal and FY 2015 Ebola funding. © 2016 AAAS

WWW.AAAS.ORG/PROGRAM/RD-BUDGET-AND-POLICY-PROGRAM 22
▲ BACK TO TABLE OF CONTENTS
OTHER PRIORITIES, INITIATIVES, AND INSTITUTE NOTES
NIH-identified themes and priorities this year include big data, imaging technology, mobile health, the Human Placenta Project, and biomedical workforce diversity. A full accounting of all NIH activities for FY 2017 is not possible here, but thumbnail sketches for some of the larger institutes are below. Recall, again, that all award figures and activities described by the NIH budget documents assume the $1.8 billion mandatory package will be available.
As mentioned above, competing awards (including those funded via mandatory spending) at the National Cancer Institute (NCI) would rise by 483 or 39.0 percent, reflecting the major prioritization of cancer research this year through both the moonshot and the Precision Medicine Initiative. As one might expect given this hoped-for funding influx, a great array of activities in support of NCI’s goals, from understanding causes and mechanisms to improving treatment and prevention, would see significant increases. Additional NCI priorities for FY 2017 will include immunotherapy research, cancer health disparities, and cloud computing for the analysis of cancer genomics. On the latter front, NCI hopes to expand its pilot projects and the Genomic Data Commons, an interactive platform for data storage and analysis operated by the University of Chicago. The NCI Cancer Centers Program would see an increase of 13.4 percent to $600.3 million.
The National Institute of Allergy and Infectious Diseases (NIAID) would reduce competing awards by 375, or 23.7 percent, while noncompeting awards would increase by 16.3 percent. HIV/AIDS research would be flat-funded overall, with continued focus on therapeutics, vaccine discovery, and co-infections. NIAID’s biodefense and emerging disease research arm and its immunological disease research arm would each by trimmed by less than one-half of one percent, to allow for a $9 million increase in support funding via the Technology Transfer and Intellectual Property Office. NIAID will continue work on flu vaccines, malaria, tuberculosis, the role of the microbiome in disease, and radiation exposure and illness. NIAID would likely also receive a portion of the aforementioned Zika supplemental, should it be appropriated.
Competing awards at the National Heart, Lung, and Blood Institute (NHLBI) would increase by 39, or 4.0 percent, according to the NHLBI request. Funding for NHLBI’s three major extramural research areas – heart and vascular disease, lung disease, and blood disease – would all be trimmed slightly, by 0.2
percent each, to achieve small increases in intramural research and research management. Support for the recently-created Trans-Omics for Precision Medicine program will continue, and NHLBI will develop a web-based data commons, GenPort. The institute will also initiate a small $3 million program on care paradigms for asthma among disadvantaged and minority youth.
The National Institute of General Medical Sciences (NIGMS) would reduce competing awards by 273 in FY 2017, a 23.0 percent reduction, while noncompeting awards would rise by 306, an 11.7 percent increase. Intramural research would be reduced by 13.4 percent or $548,000, and extramural research reduced by $611,000 (a vanishingly small percentage of NIGMS’s $2.4 billion extramural budget). On the intramural side, the savings are achieved via the planned shift in timing for the Postdoctoral Research Associate (PRAT) training program. The Institutional Development Award (IDeA) program, NIH’s version of EPSCoR,6 would be flat-funded at $320.8 million.
Competing awards at the National Institute of Diabetes, Digestive, and Kidney Disease (NIDDK) would be cut by 53, a 7.6 percent reduction, while noncompeting awards would increase by 153 or 8.8 percent. As at other institutes, extramural research funding would be trimmed by less than one percent overall. Small initiatives with new or increased funding include multicenter studies on pediatric chronic kidney disease treatments and African American kidney donors and recipients; an effort to build a pancreatic islet; and a study of circadian rhythms and metabolism. As mentioned above, previously-authorized mandatory funding for type 1 diabetes research will continue in FY 2017 at $150 million.
As mentioned above and shown in Table 1, the Office of the Director (OD) is the only other institute besides NCI that would see an increase should NIH secure the new mandatory spending package. This is entirely due to the increases for the BRAIN Initiative and Precision Medicine, which is housed in the Common Fund. Apart from the Precision Medicine increase, the Common Fund budget would remain flat overall, but there would be some changes with that flat budget. The Big Data to Knowledge (BD2K) initiative would receive a 9.8 percent increase. Funding for the Genotype-Tissue Expression, Druggable Genome, Metabolomics, and Single Cell Analysis programs would wind down or end with program completion. Increases are slated for the Science of Behavior Change and Stimulating Peripheral Activity to Relieve Conditions (SPARC) programs.
Figure 2: NIH Research Project Grants
4 See White House memo: https://www.whitehouse.gov/the-press-office/2016/01/28/memorandum-white-house-cancer-moonshot-task-force 5 See House Appropriations Committee statement: http://appropriations.house.gov/news/documentsingle.aspx?DocumentID=394401 6 Experimental Program to Stimulate Competitive Research. Both federal programs seek to broaden the distribution of research funding throughout the states.

23 GUIDE TO THE PRESIDENT’S BUDGET | RESEARCH & DEVELOPMENT FY 2017
▲ BACK TO TABLE OF CONTENTS
IN HISTORICAL CONTEXT
The FY 2017 base budget – excluding new mandatory funding – would actually drop by 2.4 percent below FY 2013 sequestration levels and 23.6 percent below FY 2003 funding levels, adjusted for inflation (see Figure 1). Adding in the mandatory funding would keep the NIH FY 2017 budget about midway between pre- and post-sequestration funding levels (in FY 2012 and FY 2013, respectively), and still about 19.2 percent below FY 2003 levels. The base budget would drop to 0.16 percent of GDP, about where it was when the budget doubling began.

WWW.AAAS.ORG/PROGRAM/RD-BUDGET-AND-POLICY-PROGRAM 24
▲ BACK TO TABLE OF CONTENTS
Table 1: National Institutes of Health by Institute(budget authority in millions of dollars)
FY 2015Actual
FY 2016Estimate
FY 2017Budget
Change FY 16-17
Amount Percent
Total by Institute (includes non-R&D components)
Cancer 4,953 5,214 5,097 -116 -2.2%
New Mandatory (proposed) 796
Total (incl. new mandatory) 5,894 680 13.0%
Allergy and Infect Diseases 4,418 4,716 4,701 -15 -0.3%
New Mandatory (proposed) 15
Total (incl. new mandatory) 4,716 0 0.0%
Heart, Lung, and Blood 2,996 3,114 3,070 -44 -1.4%
New Mandatory (proposed) 44
Total (incl. new mandatory) 3,114 0 0.0%
General Medical Sciences 2,372 2,512 2,434 -78 -3.1%
New Mandatory (proposed) 78
Total (incl. new mandatory) 2,512 0 0.0%
Diabetes, Digest, and Kidney 1/ 1,899 1,966 1,936 -30 -1.5%
New Mandatory (proposed) 30
Total (incl. new mandatory) 1,966 0 0.0%
Neurological Disorders 1,605 1,695 1,659 -36 -2.1%
New Mandatory (proposed) 36
Total (incl. new mandatory) 1,695 0 0.0%
Mental Health 1,434 1,519 1,460 -59 -3.9%
New Mandatory (proposed) 59
Total (incl. new mandatory) 1,519 0 0.0%
Child Health & Human Dev 1,287 1,338 1,317 -22 -1.6%
New Mandatory (proposed) 22
Total (incl. new mandatory) 1,338 0 0.0%
Nat Ctr for Adv Translational Sci 633 685 660 -25 -3.7%
New Mandatory (proposed) 25
Total (incl. new mandatory) 685 0 0.0%
Office of the Director 2/ 1,414 1,571 1,445 -126 -8.0%
New Mandatory (proposed) 271
Total (incl. new mandatory) 1,716 145 9.2%
(continued)
OVERVIEW TABLESNIH TABLES

25 GUIDE TO THE PRESIDENT’S BUDGET | RESEARCH & DEVELOPMENT FY 2017
▲ BACK TO TABLE OF CONTENTS
Table 1 (continued): National Institutes of Health by Institute(budget authority in millions of dollars)
FY 2015Actual
FY 2016Estimate
FY 2017Budget
Change FY 16-17
Amount Percent
Aging 1,198 1,598 1,265 -333 -20.8%
New Mandatory (proposed) 333
Total (incl. new mandatory) 1,598 0 0.0%
Drug Abuse 1,016 1,051 1,020 -30 -2.9%
New Mandatory (proposed) 30
Total (incl. new mandatory) 1,051 0 0.0%
Environmental Health Scis 667 694 682 -12 -1.7%
New Mandatory (proposed) 12
Total (incl. new mandatory) 694 0 0.0%
Superfund 3/ 77 77 77 0 0.0%
NIEHS Grand Total 745 771 771 0 0.0%
Eye 677 708 687 -21 -2.9%
New Mandatory (proposed) 21
Total (incl. new mandatory) 708 0 0.0%
Arthritis / Musculoskeletal 522 542 533 -9 -1.6%
New Mandatory (proposed) 9
Total (incl. new mandatory) 542 0 0.0%
Human Genome 499 513 510 -4 -0.7%
New Mandatory (proposed) 4
Total (incl. new mandatory) 513 0 0.0%
Alcohol Abuse and Alcoholism 447 467 460 -8 -1.7%
New Mandatory (proposed) 8
Total (incl. new mandatory) 467 0 0.0%
Deafness and Communication 405 423 416 -7 -1.6%
New Mandatory (proposed) 7
Total (incl. new mandatory) 423 0 0.0%
Dental Research 398 413 405 -9 -2.1%
New Mandatory (proposed) 9
Total (incl. new mandatory) 413 0 0.0%
(continued)
OVERVIEW TABLESNIH TABLES

WWW.AAAS.ORG/PROGRAM/RD-BUDGET-AND-POLICY-PROGRAM 26
▲ BACK TO TABLE OF CONTENTS
Table 1 (continued): National Institutes of Health by Institute(budget authority in millions of dollars)
FY 2015Actual
FY 2016Estimate
FY 2017Budget
Change FY 16-17
Amount Percent
National Library of Medicine 337 396 395 -1 -0.1%
New Mandatory (proposed) 1
Total (incl. new mandatory) 396 0 0.0%
Biomed / Bioengineering 327 344 334 -9 -2.8%
New Mandatory (proposed) 9
Total (incl. new mandatory) 344 0 0.0%
Minority Health / Disparities 271 281 280 -0.4%
New Mandatory (proposed) 1
Total (incl. new mandatory) 281 0 0.0%
Nursing Research 141 146 144 -2 -1.4%
New Mandatory (proposed) 2
Total (incl. new mandatory) 146 0 0.0%
Complementary and Int Health 124 130 127 -3 -2.5%
New Mandatory (proposed) 3
Total (incl. new mandatory) 130 0 0.0%
Buildings and Facilities 129 129 129 0 0.0%
Fogarty International Center 68 70 69 -1 -1.3%
New Mandatory (proposed) 1
Total (incl. new mandatory) 70 0 0.0%
Total NIH Programs 30,311 32,311 31,311 -1,000 -3.1%
New Mandatory (proposed) 1,825
Total (incl. new mandatory) 33,136 825 2.6%
Training & Overhead -1,561 -1,693 -1,719
Total NIH R&D 28,750 30,618 29,592 -1,026 -3.4%
Conduct of R&D 28,613 30,474 29,424 -1,049 -3.4%
R&D Facilities & Equipment 137 145 168 23 15.9%
New Mandatory R&D 1,774
Total R&D (incl. new mand) 31,366 748 2.4%
Source: OMB R&D data, agency budget justification, and agency budget documents. All figures rounded to the nearest million. Changes calculated from unrounded figures.All new mandatory funds are legislative proposals for FY 2017.Excludes Ebola funding in FY 2015 and proposed Zika supplemental.1/ Includes $150 million each year in mandatory diabetes research funds.2/ Trans-NIH initiatives are consolidated in OD.3/ Transfers from the Dept. of the Interior.
OVERVIEW TABLESNIH TABLES

27 GUIDE TO THE PRESIDENT’S BUDGET | RESEARCH & DEVELOPMENT FY 2017
▲ BACK TO TABLE OF CONTENTSOVERVIEW TABLESNIH TABLES
Table 2: National Institutes of Health by Funding Mechanism(budget authority in millions of dollars unless otherwise noted)
FY 2015Actual
FY 2016Estimate
FY 2017Budget
Change FY 16-17
Amount Percent
Total by Mechanism (includes non-R&D components)
Research Project Grants 15,724 17,016 17,344 328 1.9%
Noncompeting 11,220 11,770 12,531 760 6.5%
Administrative supplements 194 183 154 -30 -16.1%
Competing 4,311 5,063 4,660 -403 -8.0%
{Total # of Research Grants} 32,801 34,120 34,554 434 1.3%
{# Non-Competing Grants} 23,261 23,367 24,608 1,241 5.3%
{# Competing Grants} 9,540 10,753 9,946 -807 -7.5%
SBIR / STTR Grants 1/ 718 804 863 58 7.2%
{# of SBIR / STTR Grants} 1,578 1,720 1,886 166 9.7%
Research Centers 2,663 2,645 2,589 -56 -2.1%
Other Research 1,803 2,011 2,084 73 3.6%
Research Training 758 830 849 18 2.2%
R&D Contracts 2,828 2,915 3,173 258 8.9%
Intramural Research 3,410 3,582 3,615 33 0.9%
Research Management & Support 1,620 1,685 1,719 34 2.0%
Office of the Director 573 600 645 45 7.5%
The Common Fund /2 546 676 776 100 14.8%
Buildings and Facilities 137 145 179 34 23.5%
Superfund Research (NIEHS) 77 77 77 0 0.0%
Total NIH Budget 30,311 32,311 33,136 825 2.6%
Source: NIH budget justification. All figures rounded to the nearest million. Changes calculated from unrounded figures.Includes $1.8 billion in new mandatory funding proposed for FY 2017 and $150 millionin previously-approved mandatory funds for diabetes research in NIDDK.1/ Small Business Innovation Research / Small Business Technology Transfer.2/ Distributed throughout above mechanisms.

WWW.AAAS.ORG/PROGRAM/RD-BUDGET-AND-POLICY-PROGRAM 28
▲ BACK TO TABLE OF CONTENTS
DEPARTMENT OF ENERGY (DOE)
CONTEXT AND RECENT HISTORY
Applied technology programs within the Department of Energy (DOE) have arguably been the number one priority for the Obama Administration for many years, though a source of division during appropriations. Partisan division has generally been less of an issue for DOE’s Office of Science (SC). As one of the three agencies tabbed for budget doubling in the original America COMPETES Act of 2007, SC saw its budget increase by 24.2 percent between 2007 and 2010, adjusted for inflation – not quite the doubling envisioned, but still clear prioritization by appropriators.
DOE in the Obama years has shown an interest in new institutional models for science and innovation, including the Energy Frontier Research Centers and the Innovation Hubs, as well as an embrace of the Advanced Research Projects Agency-Energy (ARPA-E), which was created by the first America COMPETES Act of 2007 passed during President Bush’s second term but was not included in regular appropriations until 2010. DOE has also been a center for the Administration’s National Network for Manufacturing Innovation (NNMI). Congress has generally supported these initiatives, though that support has historically been slow to build in some cases.
In the FY 2017 budget, several DOE components are centerpieces in the so-called “Mission Innovation” initiative, a multilateral endeavor to double clean energy research and development budgets over the next five years. DOE is responsible for $4.8 billion out of the $6.4 billion in total covered by the initiative. It was first announced at the Paris climate talks in November 2015, in parallel to related fundraising efforts by industry leaders like Mark Zuckerberg and Bill Gates.
OVERALL NUMBERS
As at other science agencies, DOE relies partially on mandatory spending in its FY 2017 request. Specifically, the Office of Science, the Office of Energy Efficiency and Renewable Energy, and ARPA-E would all receive portions of their FY 2017 budgets via mandatory expenditures, which would require new legislation and funding streams beyond normal appropriations. This spending is displayed in Tables 1, 2, and 3; see below for additional detail.
DOE’s overall R&D budget for FY 2017 changes depending on whether this new mandatory spending is included or excluded, as show in Table 1. The base R&D budget, including only discretionary spending, would reach $16.6 billion, a 15.6 percent increase and an all-time high in inflation-adjusted dollars (even accounting for a change in DOE’s R&D tabulation methodology, which adds roughly $2 to $3 billion per year; see Figure 2). Adding the Administration’s new mandatory spending would increase the budget to $17.4 billion, a 20.8 percent increase from FY 2016 levels.
OFFICE OF SCIENCE (SC)
Mandatory spending is less critical to SC’s budget than other agencies in the FY 2017 request. Slated for $100 million, the mandatory proposal would provide additional competitive grants to university researchers across the spectrum of SC’s support areas, via merit review. Excluding this extra mandatory funding, SC would receive a 4.2 percent increase; including it would yield a 6.1 percent increase (see Table 2, and Figure 1 for historical trends).
Advanced Scientific Computing Research (ASCR): The major change is establishment of a new office responsible for SC’s exascale computing effort. The move comes in support of the new National Strategic Computing Initiative, announced last July, of which DOE is a co-lead. Related activities were previously
Nuclear Phys
Basic Energy Sci
High-Energy Phys
Fusion EnergyBio Env Res
Adv Sci Comp
$0
$400
$800
$1,200
$1,600
$2,000
$200
$600
$1,000
$1,400
$1,800
2000
2002
2004
2006
2008
2010
2012
2016
2014
Figure 1: DOE Office of Science Budgets(budget Authority in millions of constant FY 2016 dollars)
Source: Historical DOE budget data and FY17 request. © 2016 AAAS

29 GUIDE TO THE PRESIDENT’S BUDGET | RESEARCH & DEVELOPMENT FY 2017
▲ BACK TO TABLE OF CONTENTS
housed under the other research accounts in ASCR. Note the total SC investment in exascale computing would rise to $190 million, a more than 20 percent increase from the FY 2016 appropriation, with $26 million from the Basic Energy Sciences program and $10 million from Biological and Environmental Research program.
Elsewhere, ASCR will initiate an array of activities to explore next-generation semiconductor technology, and the Scientific Discovery through Advanced Computing (SciDAC) program will be re-competed. The office will commence preparation for the next National Energy Research Scientific Computing Center supercomputer (NERSC-9), and efforts to upgrade the Argonne and Oak Ridge computing facilities will continue.
Basic Energy Sciences (BES): The largest relative increases for BES are directed to several core research activities, and BES will serve as the lead in subsurface technology and advanced materials, two SC priority areas for FY 2017. BES would also have a hand in supporting the office’s exascale computing activities, through an effort to develop computational chemistry codes compatible with exascale architecture. The Energy Frontier Research Centers program would reach $142.6 million, a 29.6 percent increase; in
addition to continued support for 32 existing centers, up to five new centers would be established. The Joint Center for Energy Storage Research – SC’s innovation hub at Argonne lab – would reach its fifth and final year of funding in FY 2017, continued at $24.1 million. The Joint Center for Artificial Photosynthesis hub, headquartered at Caltech, would continue at $15 million, in the second year of its new five-year renewal. The Advanced Photon Source upgrade would continue, as would construction of the Linac Coherent Light Source-II.
Biological and Environmental Research (BER). In recent years, the Administration has proposed large increases for climate modeling within BER; this year, the large increase is reserved for BER’s fundamental genomic science program, with a new effort underway in microbiome research. In addition, funding for the three Bioenergy Research Centers (BRCs) would jump by 19.4 percent to $89.6 million in the fifth and final year of their award, to accelerate technology transfer to industry. There would be limited change on the climate science side of BER with some increases for modeling activities to understand interactions around the energy-water nexus during weather extremes.
ARPA-E
Nuclear Energy
E�ciency and Renewables
Fossil Energy
O�ce of Science R&D
All Other
ARRA
Atomic Defense (NNSA)
$0
$2
$4
$6
$8
$10
$12
$14
$16
$18
2017
2016
2015
2014
2013
2012
2011
2010
2009
2008
2007
2006
2005
2004
2003
2002
2001
2000
Figure 2: Trends in DOE R&D, FY 2000-2017 (in billions of constant FY 2016 dollars)
Source: Past AAAS R&D reports and FY 2017 request documents. Note DOE has adjusted its R&D accounting methodology this year, resulting in a $2 to $3 billion boost in total spending figures above prior years. R&D includes conduct of R&D and R&D facilities. © 2016 AAAS

WWW.AAAS.ORG/PROGRAM/RD-BUDGET-AND-POLICY-PROGRAM 30
▲ BACK TO TABLE OF CONTENTS
Fusion Energy Sciences (FES). Following the pattern of prior years, domestic research activities would be cut – by 15.5 percent this year – while U.S. contributions to ITER, the international fusion energy project, would be increased. No funding is provided for the Alcator C-Mod at MIT, and the facility is expected to shut down in FY 2016. MIT research personnel are expected to instead collaborate with two other U.S. facilities: General Atomics’s DIII-D, and the Princeton Plasma Physics Lab’s NSTX-U. Both of these are expected to see some reduction in operating weeks due to tight funding. Other domestic efforts and U.S. participation in international activities aside from ITER – including projects with China, Korea, and Germany – would generally be reduced. While U.S. contributions to ITER would increase, the FY 2016 omnibus required Secretary of Energy Ernest Moniz to make a recommendation by May 2 on whether the U.S. should continue participation.
High Energy Physics (HEP). The FY 2017 request continues to take cues from the recommendations in the HEP Advisory Panel’s 2014 priorities report, dubbed the P5 report (for Particle Physics Project Prioritization Panel).1 There would generally be limited changes and tweaks in program funding under this year’s request, with construction accounting for most of the increase. The decline in the Intensity Frontier Experimental Physics subprogram, as seen in Table 2, is due to the planned ramp-down in funding for the Muon g-2 project at Fermilab. The bulk of the construction increase is for the newly-renamed Long Baseline Neutrino Facility/Deep Underground Neutrino Experiment (LBNF/DUNE), now a partly international project.
Nuclear Physics (NP). Funding would be increased for operation of the newly-upgraded CEBAF at Thomas Jefferson National Accelerator Facility to launch the 12 GeV experimental program. Relativistic Heavy Ion Collider (RHIC) operation at Brookhaven Lab would also be increased by 550 hours to reach 74 percent utilization. Funding is provided to initiate a new Gamma-Ray Energy Tracking Array (GRETA) detector to be used at the Facility for Rare Isotope Beams (FRIB). That facility, at Michigan State, is in its peak years of construction funding; the decline in construction seen in Table 2 is due to completion of the aforementioned CEBAF upgrade. NP would also increase competitive funding at universities and labs for isotope production-related activities and infrastructure.
ENERGY PROGRAMS
Unsurprisingly, as shown in Table 3, the largest base-budget increases on the applied technology front are in the areas of renewables and efficiency, grid-related research, and for ARPA-E, similar to the contours of prior years. In addition, nearly $1.5 billion would be provided via mandatory funding for the Office of Energy Efficiency and Renewable Energy (EERE) and ARPA-E. The EERE portion would come via the Administration’s 21st Century Clean Transportation plan, with funding raised via a $10 per barrel fee on oil. That $1.3 billion would be divided among several transportation-related priorities, including electric vehicles, biofuels, intelligent transportation systems, and fueling infrastructure. The ARPA-E mandatory portion, $150 million in FY 2017, represents the first year in a plan to ramp up funding for the innovation agency by $1.85 billion over five years, culminating in $650 million in FY 2021. This is in addition to the discretionary increase also proposed for ARPA-E in FY 2017.
Within EERE, the Vehicle Technologies program would create a new consortia initiative to focus on system-scale efficiency, and funding would also increase for autonomous vehicles research. On the bioenergy front, EERE’s collaborative Synthetic Biology Foundry project, involving multiple national labs and industry partners, would see a large ramp-up in funding in FY 2017. The Wind Energy program is set to launch a competitive Offshore Wind R&D Consortium and a high-altitude wind turbine solicitation. On the efficiency side, the Building Technologies program would support new solicitations on advanced cooling R&D and advanced sensors. The Advanced Manufacturing Office (AMO) would receive a bit more modest increase this year compared to years past. The program would establish one new manufacturing innovation institute while continuing to support five existing institutes, all part of NNMI. AMO would also fund the Critical Materials Hub at $20 million, representing the first year of its second and final five-year award, and launch a new Energy-Water Desalination Hub at $25 million.
Lastly, in the base budget, EERE would fund a new Crosscutting Innovation Initiatives program at $215 million. The new program would contain multiple components, including a set of ten competitively-awarded Regional Clean Energy Innovation Partnerships, support of “off-roadmap” energy technologies of interest to EERE, and other collaborative activities with small businesses and national labs.
1 See http://www.usparticlephysics.org/p5/

31 GUIDE TO THE PRESIDENT’S BUDGET | RESEARCH & DEVELOPMENT FY 2017
▲ BACK TO TABLE OF CONTENTS
The Office of Electricity Delivery and Energy Reliability (OE) would more than double its grid-scale energy storage work, and would establish a new Grid Manufacturing Institute as part of NNMI at $14 million in the first year.
The Nuclear Energy Office would see two major funding upticks at the program level for Small Modular Reactor (SMR) Licensing Support and for Fuel Cycle R&D. The former provides design certification and licensing activities in collaboration with industry partners. So far, there are two major partnerships in place: one with NuScale and the Utah Associated Municipal Power Systems (UAMPS) for a potential design and site in the western United States and one with the Tennessee Valley Authority, which is seeking to build an SMR at its Clinch River Site.
The Fuel Cycle R&D program focuses on used nuclear fuel, waste, and disposal issues, with an eye towards improved efficiency, safety, and security in light water reactors. The major increase in FY 2017 is for continued development of interim storage sites and repositories for nuclear waste, and associated transportation challenges. Elsewhere in the Nuclear Energy office, development funding would decline for assorted advanced reactor technologies and components and for nuclear science user facilities. The office would also provide $24.3 million for the Consortium for Advanced Simulation of Light Water Reactors led by Oak Ridge; the innovation hub is in the third year of its second five-year term.
While the Fossil Energy Research and Development program shows a major cut in net budget authority for FY 2017 (in a restructured budget), it should be noted that Fossil Energy would also be applying $240 million in previously-approved budget authority from prior years; gross budget authority, including old and new, would thus decline by $32 million or 5.1 percent. The Administration proposes a 30.0 percent increase for carbon capture and compression technologies, mostly due to the inclusion of a new $30 million to construct a natural gas pilot facility. Funding for carbon storage activities would be reduced as certain projects transition from carbon injection to monitoring. Elsewhere, the Administration would cut funding for solid oxide fuel cells R&D and coal gasification technology. Some of the unconventional fossil technology R&D work would transition to the new Fuel Supply Impact Mitigation program, which is focused particularly on environmental impacts of fossil fuels.
The Administration would boost the National Energy Technology Lab (NETL) infrastructure budget to upgrade the lab’s supercomputer in preparation for exascale capabilities, but would zero out NETL’s research on extracting rare earth elements from coal and coal byproducts.
NATIONAL NUCLEAR SECURITY ADMINISTRATION (NNSA)
At NNSA, the Research, Development, Test, and Evaluation (RDT&E) campaigns would mostly see moderate broad-based increases across the board; programs in nuclear survivability and advanced computing hardware (in preparation for exascale capabilities) would particularly increase. The Inertial Confinement Fusion Ignition and High Yield program supports activities at DOE’s three major high energy density facilities, including the National Ignition Facility (NIF) at Livermore; the Z Facility at Sandia; and the Omega Laser Facility at the University of Rochester. NIF reports an 85 percent increase in the number of shots in FY 2015, and an additional increase is expected in FY 2016. Arms control and detonation detection activities in the Defense Nuclear Nonproliferation account would be trimmed somewhat.

WWW.AAAS.ORG/PROGRAM/RD-BUDGET-AND-POLICY-PROGRAM 32
▲ BACK TO TABLE OF CONTENTS
Table 1. Department of Energy R&D and Program Totals(budget authority in millions of dollars)
FY 2015Actual
FY 2016Estimate
FY 2017Budget
Change FY 16-17
Amount Percent
Total DOE R&D 14,385 14,387 16,634 2,247 15.6%
Conduct of R&D 13,391 13,274 15,503 2,229 16.8%
R&D Facilities 993 1,113 1,131 17 1.6%
New mandatory R&D 1/ 750
Total R&D (incl. new mandatory) 14,385 14,387 17,384 2,997 20.8%
DOE R&D by Function
Defense 6,197 5,726 7,082 1,356 23.7%
General Science 5,099 5,305 5,523 217 4.1%
Energy 3,089 3,356 4,029 673 20.1%
Select Discretionary Budgets
Office of Science 5,068 5,347 5,572 225 4.2%
Energy Efficiency & Renew Energy 1,841 2,069 2,898 829 40.1%
Elect Delivery & Energy Reliability 144 206 262 56 27.3%
Nuclear Energy 822 986 994 8 0.8%
Fossil Energy 2/ 549 632 360 -272 -43.0%
ARPA-E 280 291 350 59 20.3%
NNSA 11,397 12,527 12,884 357 2.9%
1/ Legislative proposals for FY 2017.2/ Request includes use of $240 million prior-year balance.Source: OMB R&D data, agency budget justification, and agency budget documents. All figures rounded to the nearest million. Changes calculated from unrounded figures.
DOE TABLES

33 GUIDE TO THE PRESIDENT’S BUDGET | RESEARCH & DEVELOPMENT FY 2017
▲ BACK TO TABLE OF CONTENTSOVERVIEW TABLESDOE TABLES
Table 2. Office of Science Budgets(budget authority in millions of dollars)
FY 2015Actual
FY 2016Estimate
FY 2017Budget
Change FY 16-17
Amount Percent
Adv Sci Computing Res 1/
Math and Comp Sci Res 168 179 151 -28 -15.8%
High Perf Comp and Net 356 442 358 -83 -18.9%
Exascale Computing - - - - 154 - - - -
Total ASCR 523 621 663 42 6.8%
Basic Energy Sciences (BES)
Mat Sci and Engineering 352 370 396 26 7.0%
Chem Sci, Geosci, & Biosci 303 312 387 75 24.1%
Sci User Facilities 889 967 964 -3 -0.3%
Construction 139 200 190 -10 -5.1%
Total BES 1,683 1,849 1,937 88 4.7%
Biological and Environmental Research (BER)
Biological Systems Sci 290 294 339 45 15.2%
Climate and Environ Scis 283 315 323 8 2.6%
Total BER 573 609 662 53 8.7%
Fusion Energy Sciences (FES)
Burning Plasma Foundations 217 215 196 -19 -8.9%
Burning Plasma Long Pulse 39 41 31 -10 -23.6%
Discovery Plasma 51 67 46 -21 -31.4%
Construction (ITER) 150 115 125 10 8.7%
Total FES 457 438 398 -40 -9.1%
(continued)

WWW.AAAS.ORG/PROGRAM/RD-BUDGET-AND-POLICY-PROGRAM 34
▲ BACK TO TABLE OF CONTENTS
Table 2 (continued). Office of Science Budgets (budget authority in millions of dollars)
FY 2015Actual
FY 2016Estimate
FY 2017Budget
Change FY 16-17
Amount Percent
High-Energy Physics (HEP)
Energy Frontier 146 151 151 0 0.2%
Intensity Frontier 260 243 234 -9 -3.7%
Cosmic Frontier 107 131 130 -1 -0.4%
Theoretical and Comp Physics 62 59 60 1 1.0%
Advanced Tech R&D 124 115 118 3 2.4%
Accel Stewardship 10 9 14 5 52.7%
SBIR 0 21 23 2 8.1%
Construction 37 66 89 22 33.9%
Total HEP 745 795 818 23 2.9%
Nuclear Physics
Medium Energy Phys 134 156 164 8 5.1%
Heavy Ion Phys 199 208 216 8 4.0%
Low Energy 78 79 80 1 1.4%
Nuclear Theory 43 46 46 1 1.5%
Isotopes 20 21 29 8 37.6%
Construction 107 108 100 -8 -7.0%
Total Nuclear Physics 581 617 636 19 3.0%
Science Labs Infrastructure 80 114 130 16 14.4%
Other 429 308 328 21 6.8%
Adjustments -3 -3 0
Total Science 5,068 5,347 5,572 225 4.2%
New mandatory 2/ 100
Total Science (incl. mandatory) 5,068 5,347 5,672 325 6.1%
1/ New account structure for FY 2017.2/ Legislative proposal for FY 2017.Source: OMB R&D data, agency budget justification, and agency budget documents. All figures rounded to the nearest million. Changes calculated from unrounded figures.
DOE TABLES

35 GUIDE TO THE PRESIDENT’S BUDGET | RESEARCH & DEVELOPMENT FY 2017
▲ BACK TO TABLE OF CONTENTS
Table 3. Energy Technology Program Budgets(budget authority in millions of dollars)
FY 2015Actual
FY 2016Estimate
FY 2017Budget
Change FY 16-17
Amount Percent
Energy Efficiency & Renew Energy
1,841 2,069 2,898 829 40.1%
Hydrogen & Fuel Cell Tech 95 101 106 5 4.5%
Bioenergy Technologies 176 225 279 54 24.0%
Solar Energy 231 242 285 44 18.0%
Wind Energy 106 95 156 61 63.4%
Geothermal Technology 54 71 100 29 40.1%
Water Power 60 70 80 10 14.3%
Vehicle Technologies 273 310 469 159 51.1%
Building Technologies 168 201 289 89 44.1%
Advanced Manufacturing 194 229 261 33 14.2%
Crosscutting Innov Initiatives - - - - 215 - - - -
New Mandatory 1/ 1,335
Total EERE (incl. new mandatory) 1,841 2,069 4,233 2,164 104.6%
Elect Deliv & Energy Reliability 144 206 262 56 27.3%
Research & Dev Progs 105 162 179 18 11.0%
Nuclear Energy 822 986 994 8 0.8%
Reactor Concepts RD&D 129 142 109 -33 -23.3%
Nuc Energy Enabling Tech 98 112 90 -22 -19.8%
Fuel Cycle R&D 191 204 250 46 22.6%
SMR Licensing Support 55 63 90 27 43.4%
Fossil Energy R&D 2/ 549 632 360 -272 -43.0%
CCS and Advanced Power Syst 340 378 368 -9 -2.5%
Fuel Supply Impact Mitigation 24 43 27 -17 -38.4%
Unconventional Technologies 4 20 0 -20 -100.0%
ARPA-E 280 291 350 59 20.3%
New Mandatory 3/ 150
Total ARPA-E (incl. mandatory) 280 291 500 209 71.8%
Uranium Enrichment D&D 625 674 674 0 0.0%
Energy Information Admin 117 122 131 9 7.5%
Non-Defense Environ Cleanup 246 255 218 -37 -14.4%
1/ Mandatory funding via the President’s 21st Century Clean Transportation Plan.2/ New account structure for FY 2017; request includes use of $240 million prior-year balance.3/ Legislative proposal for FY 2017.Source: OMB R&D data, agency budget justification, and agency budget documents. All figures rounded to the nearest million. Changes calculated from unrounded figures.
OVERVIEW TABLESDOE TABLES
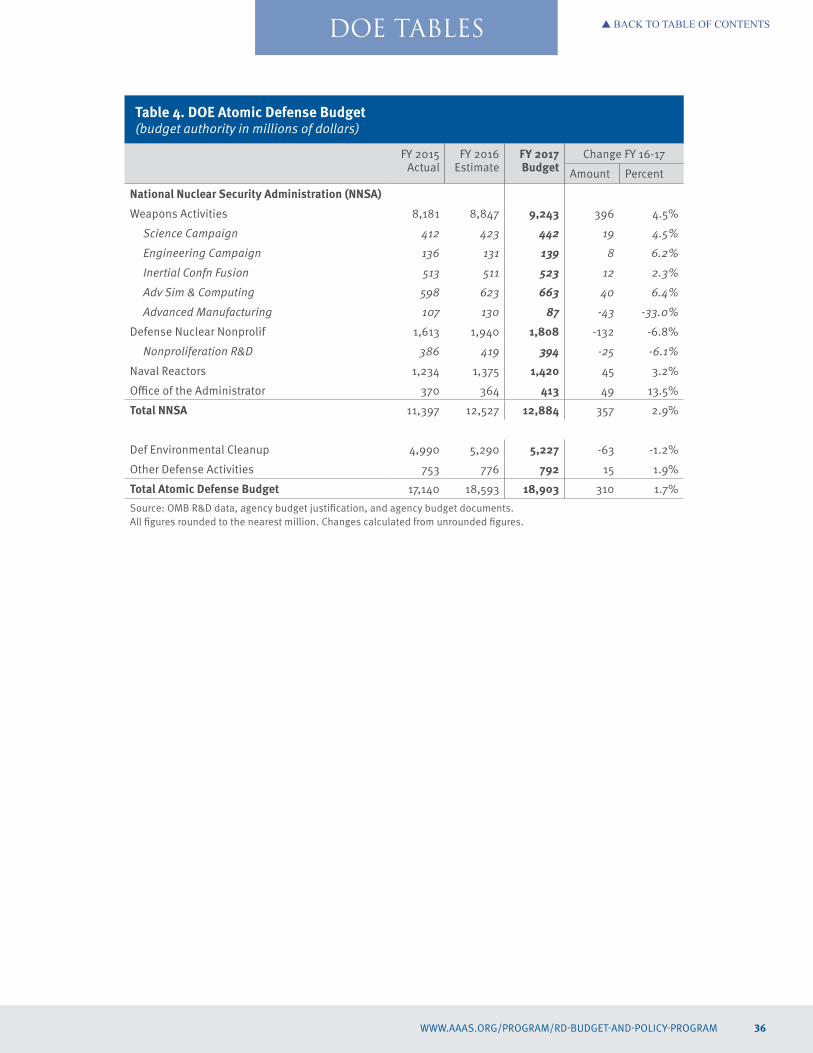
WWW.AAAS.ORG/PROGRAM/RD-BUDGET-AND-POLICY-PROGRAM 36
▲ BACK TO TABLE OF CONTENTS
Table 4. DOE Atomic Defense Budget(budget authority in millions of dollars)
FY 2015Actual
FY 2016Estimate
FY 2017Budget
Change FY 16-17
Amount Percent
National Nuclear Security Administration (NNSA)
Weapons Activities 8,181 8,847 9,243 396 4.5%
Science Campaign 412 423 442 19 4.5%
Engineering Campaign 136 131 139 8 6.2%
Inertial Confn Fusion 513 511 523 12 2.3%
Adv Sim & Computing 598 623 663 40 6.4%
Advanced Manufacturing 107 130 87 -43 -33.0%
Defense Nuclear Nonprolif 1,613 1,940 1,808 -132 -6.8%
Nonproliferation R&D 386 419 394 -25 -6.1%
Naval Reactors 1,234 1,375 1,420 45 3.2%
Office of the Administrator 370 364 413 49 13.5%
Total NNSA 11,397 12,527 12,884 357 2.9%
Def Environmental Cleanup 4,990 5,290 5,227 -63 -1.2%
Other Defense Activities 753 776 792 15 1.9%
Total Atomic Defense Budget 17,140 18,593 18,903 310 1.7%
Source: OMB R&D data, agency budget justification, and agency budget documents. All figures rounded to the nearest million. Changes calculated from unrounded figures.
DOE TABLES

37 GUIDE TO THE PRESIDENT’S BUDGET | RESEARCH & DEVELOPMENT FY 2017
▲ BACK TO TABLE OF CONTENTS
NATIONAL AERONAUTICS AND SPACE ADMINISTRATION (NASA)
CONTEXT AND RECENT HISTORY
As at other agencies, recent overall levels of investment for the space agency are down, though the past three appropriations cycles indicate a steady, if incomplete, recovery. Following its recent FY 2010 peak (which itself was $2 billion below inflation-adjusted funding of the early 1990s, excluding one-time funding in the American Recovery and Reinvestment Act), NASA’s total budget fell by $3.1 billion or 14.8 percent through FY 2013. But a particularly strong showing in the FY 2016 omnibus means the current NASA budget now exceeds pre-sequestration funding levels, and it is now about halfway back to FY 2010, as compared to the FY 2013 low (see Figure 1).
The FY 2017 budget is poised to kick off familiar debates about NASA’s priorities – whether to spend the next dollar on the universe, the solar system, or the Earth, and whether robots or humans should rack up the mileage. The Administration would make large cuts to Exploration programs including the Space Launch System (SLS) and the Orion Crew Vehicle, while supporting the Commercial Crew Program, as it has in years past. The budget is again less generous with planetary science missions, including a potential future mission to Jupiter’s moon Europa, a big priority for House appropriators. NASA’s request would also continue support for demonstration of a proposed Asteroid Redirect Mission, yet another source of disagreement between the House and Administration.
Another major flash point has been the Administration’s prioritization of the agency’s Earth Science program. Between FY 2010 and FY 2015, Earth Science funding grew by 13.8 percent in inflation-adjusted dollars, by far the largest increase out of the four SMD divisions (excluding the James Webb Space Telescope development account, which was separated from Astrophysics in FY 2012). In the FY 2016 omnibus, appropriators again gave Earth Science funding a sizable boost, though the increase for the Planetary Science program was even larger (see Figure 2).
OVERALL NUMBERS
As at other agencies, the Administration partially relies on mandatory funding for NASA in the FY 2017 request; but unlike other agencies, the NASA budget would decline even with that mandatory package supplementing the base budget. Overall funding would decline by $260 million or 1.3 percent under the President’s request from all sources, including $763 in mandatory spending. This mandatory sum includes $100 million for aeronautics research via the Administration’s 21st Century Clean Transportation Plan, which relies on a fee on oil companies to fund an array of transportation-related investments.1 Excluding this mandatory proposal, NASA’s discretionary budget would drop by a full $1 billion, 5.3 percent below last year’s enacted funding. Estimated R&D in NASA’s discretionary budget totals $12.2 billion, a considerable 8.3 percent cut below FY 2016 (see Table 1).
SCIENCE MISSION DIRECTORATE (SMD)
The Science budget is essentially flat-funded at $5.6 billion, including $298 in mandatory funding spread across specific projects in each of the Earth Science, Planetary Science, Astrophysics, and Heliophysics programs. Without the mandatory funding, SMD’s budget would decrease by 5.1 percent (see Table 2).
Earth Science: As mentioned above, NASA is requesting another increase for its Earth Science program. The base budget would increase by 2.7 percent or $51 million over the FY 2016 appropriation. Support is continued for the Landsat 9 project, the successor mission to Landsat 8; the Landsat series of satellites have continuously observed Earth’s land surfaces since 1972. NASA and USGS established their joint Landsat 9 project activities in 2015, with an anticipated launch in 2021.
Additionally, $60 million in proposed mandatory funding would be split evenly between two areas: $30 million would go towards the Earth Science Research and Analysis program, while the other $30 million would fund a new Small Satellite Constellations Initiative that would help foster commercial launch services dedicated to transporting small payloads into orbit.
Planetary Science: Planetary Science would see a big reduction in the FY 2017 budget, with a discretionary spending cut of $240 million or 14.7 percent below FY 2016 appropriated levels. The majority of this reduction is targeted at a major priority for House
1 See White House fact sheet: https://www.whitehouse.gov/the-press-office/2016/02/04/fact-sheet-president-obamas-21st-century-clean-transportation-system

WWW.AAAS.ORG/PROGRAM/RD-BUDGET-AND-POLICY-PROGRAM 38
▲ BACK TO TABLE OF CONTENTS
appropriators: a mission to Jupiter’s moon Europa, which would be funded at $50 million in FY 2017, $125 million below last year’s appropriation. NASA’s FY 2017 budget proposes a launch date in the late 2020s, and recommends against the earlier 2022 launch date preferred by appropriators. The Administration does include an additional $33 million in mandatory funding for the Europa mission.
On the other hand, NASA’s Mars Exploration activities would fare quite well in the request. Included is a total of $378 million for the Mars 2020 rover, up from $250 million in FY 2016 appropriations to keep development on track. Also included is mandatory funding of $13.7 million for the extended missions of the Mars Exploration Rover 2003/Opportunity exploring the surface of Mars, and $12.7 million for Mars Odyssey 2001 to continue studies of the Martian climate. Mars Express would be supported by $2.6 million in mandatory funding to continue the U.S. contribution to the European Space Agency-led mission that addresses the climatic and geological evolution of Mars as well as the potential for life on the planet. An additional $40 million in mandatory funds for the New Frontiers program would extend two operating missions, New Horizons and Juno.
Astrophysics: The Astrophysics Division (APD) budget includes $85 million in mandatory spending, $76 million of which would support the Wide Field Infrared Survey Telescope (WFIRST), set to launch in 2025. The total request for WFIRST is $90 million, the same as FY 2016. Within the Cosmic Origins program, the Hubble Space Telescope and the Stratospheric Observatory for Infrared Astronomy (SOFIA) would both hover around last year’s request and appropriated levels. Astrophysics Research was granted a small $3 million mandatory supplement, while the Physics of the Cosmos (PCOS) program received another $6 million in mandatory funds to prepare for future PCOS missions and continue discussions with ESA on a partnership on their large 2 (Athena) and Large 3 (Gravitational Waves) missions. Funding for STEM education activities, which is distributed across SMD but administered by APD, would otherwise be reduced by $12 million below the FY 2016 appropriation.
Heliophysics: NASA Heliophysics would receive a $24 million increase in discretionary funding for FY 2017, while a further $25 million in mandatory funding would allow the program to grow by a total of 7.5 percent. The budget supports ongoing development of the Solar Probe Plus mission and provides a large $31 million increase for the ESA-led Solar Orbiter Collaboration, expected
to launch in 2018. The Living with a Star program also includes $10 million in mandatory funding to accelerate efforts in support of the Administration’s multi-agency Space Weather Action Plan.
James Webb Space Telescope (JWST): Funding for JWST would remain on the previously agreed-upon baseline, decreasing by $52 million or 8.2 percent compared to FY 2016; development and testing of the telescope remains on track for scheduled (and congressionally-mandated) launch in 2018. JWST would be entirely funded through the base budget.
AERONAUTICS
The Aeronautics Directorate proposes a major new initiative called New Aviation Horizons (NAH), a series of transformative experimental aircraft and systems demonstrations. In FY 2017, NASA will initiate a Subsonic Demonstrator project to design and build subsonic transport X-planes to achieve a 50 percent reduction in fuel use. NAH would receive $100 million in mandatory funding as part of the Administration’s 21st Century
$0
$5
$10
$15
$20
2017
2016
2015
2014
2013
2012
2011
2010
2009
2008
2007
Science
Aeronautics
Space Technology
New Mandatory
Space Operations
Exploration Systems
Other
ARRA
Figure 1: NASA Budgets, FY 2007 - 2017(billions of constant 2016 dollars)
“Other” includes support, construction, OIG, and education programs. © 2016 AAAS

39 GUIDE TO THE PRESIDENT’S BUDGET | RESEARCH & DEVELOPMENT FY 2017
▲ BACK TO TABLE OF CONTENTS
Clean Transportation Plan; Aeronautics would be slated to receive $3.7 billion over 10 years under this plan. With an additional $56 million in mandatory funds, NASA will initiate an NAH-Low Boom Flight Demonstrator project to demonstrate quieter supersonic flight. Without this proposed $156 million in mandatory funding, the Aeronautics budget would fall slightly below FY 2016 levels (see Table 3).
EXPLORATION AND SPACE OPERATIONS
NASA’s Exploration account contains two high-profile programs, Orion and the Space Launch System (SLS), which have been at the center of debate between Congress and the Administration. SLS, which will carry humans and equipment into deep space, was cut by $770 million in the President’s base budget, a 38.5 percent reduction from FY 2016 enacted levels. The Orion Crew Vehicle, which will be launched by SLS to carry astronauts beyond low Earth orbit, is slated for a $217 million or 17.1 percent cut in discretionary funding (see Table 4). Both SLS and Orion contain additional mandatory funding in the request totaling $80 million and $66 million, respectively, which would partially offset the base budget cuts. For several years, Congress has restored and increased funding for these programs following proposed cuts by the Administration.
Criticism has also been levied by Congress on the Administration’s proposed Asteroid Redirect Mission (ARM), which would identify and capture a target asteroid, redirecting it into orbit around the moon for sampling by astronauts. The Administration’s final budget request makes another attempt to secure funding for ARM, providing $67 million within the Advanced Exploration Systems account. Additionally, funding uncertainties surround the Commercial Crew Program, which aims to build private sector commercial systems capable of carrying humans to and from the International Space Station and reduce reliance on foreign providers for access to low Earth orbit. Although the Administration is not asking for another increase for Commercial Crew (as seen in Table 4), Congress has been hostile towards the program in the past: FY 2016 marked the first year that Congress appropriated its full request amount.
SPACE TECHNOLOGY
In the FY 2016 omnibus, the Congress transferred management of the Restore-L mission from the Exploration and Space Operations Directorate to the Space Technology Directorate. The mission aims to demonstrate the servicing of a U.S. government satellite in low Earth orbit. Nearly half of the $130 million for Restore-L is classified as mandatory in FY 2017. The Space Technology Research and
0%
50%
60%
70%
80%
10%
20%
30%
40%
100%
90%
110%
120%
130%
140%
2010
2011
2012
2013
2014
2015
2016
2017
Earth Science Planetary Science Astrophysics James Webb SpaceTelescope
Heliophysics
Figure 2: NASA Science Program Funding, FY 2010 - FY 2017(estimated funding as a percent of FY 2010, in constant dollars)
Source: Historical agency budget documents and the FY 2017 budget request. FY 2017 excludes new mandatory proposals. © 2016 AAAS

WWW.AAAS.ORG/PROGRAM/RD-BUDGET-AND-POLICY-PROGRAM 40
▲ BACK TO TABLE OF CONTENTS
Development (STRD) program will also continue development of high-powered solar electric propulsion technologies that will be incorporated in a robotic segment of the Asteroid Redirect Mission (ARM). While legislators have scrutinized ARM, there remains support in Congress for this particular portion of the mission. STRD was given additional mandatory funding of $27 million for Game Changing Developments, which focus on rapidly advancing disruptive space technologies, and $44 million for various technology demonstration missions (see Table 5).
EDUCATION
The FY 2017 request for NASA’s Education Directorate is $100 million, a $15 million decrease from FY 2016 enacted levels. As in past years, funding would be cut for both the National Space Grant College and Fellowship Program and the Experimental Program to Stimulate Competitive Research (EPSCoR). However, funding would be maintained for the Minority University Research Education Project and STEM Education and Accountability Projects.

41 GUIDE TO THE PRESIDENT’S BUDGET | RESEARCH & DEVELOPMENT FY 2017
▲ BACK TO TABLE OF CONTENTS
Table 1: National Aeronautics and Space Administration R&D and Total Budget(budget authority in millions of dollars)
FY 2015Actual
FY 2016Estimate
FY 2017Budget
Change FY 16-17
Amount Percent
Space Operations 1,421 2,700 2,630 -70 -2.6%
Science 4,692 5,532 5,263 -269 -4.9%
Exploration 3,967 3,600 2,761 -839 -23.3%
Aeronautics 485 462 524 62 13.5%
Safety, Security, Mission Svcs 267 272 265 -6 -2.4%
Const, Env Compl, and Remediation 52 22 37 16 71.1%
Space Technology 529 686 691 4 0.6%
Total NASA R&D 11,413 13,273 12,170 -1,103 -8.3%
Total NASA Budget 18,010 19,285 18,262 -1,023 -5.3%
New mandatory 763
Total NASA Budget (incl. new mandatory) 18,010 19,285 19,025 -260 -1.3%
Source: OMB R&D data and agency budget justification. All figures rounded to the nearest million.
OVERVIEW TABLESNASA TABLES

WWW.AAAS.ORG/PROGRAM/RD-BUDGET-AND-POLICY-PROGRAM 42
▲ BACK TO TABLE OF CONTENTS
Table 2: Science Mission Directorate Funding(budget authority in millions of dollars)
FY 2015Actual
FY 2016Estimate*
FY 2017Budget
Change FY 16-17
Amount Percent
Earth Science
Earth Science Research 453 - - 472 - - - -
Applied Sciences 40 - - 48 - - - -
Earth Sci Multi-Mission Ops 180 - - 192 - - - -
Earth Systematic Missions 827 - - 933 - - - -
Earth System Sci Pathfinder 224 - - 266 - - - -
Earth Science Technology 60 - - 61 - - - -
Total Earth Science 1,784 1921 1,972 51 2.7%
New mandatory 60
Total Earth Science (incl. new mandatory) 1,784 1921 2,032 111 5.8%
Heliophysics
Heliophysics Research 192 - - 165 - - - -
Living with a Star 264 - - 364 - - - -
Solar Terrestrial Probes 71 - - 40 - - - -
Heliophysics Explorer Prog 110 - - 105 - - - -
Total Heliophysics 636 650 674 24 3.7%
New mandatory 25
Total Heliophysics (incl. new mandatory) 636 650 699 49 7.5%
Planetary Science
Mars Exploration 305 - - 556 - - - -
Discovery 260 189 203 14 7.1%
New Frontiers 286 - - 104 - - - -
Technology 159 - - 156 - - - -
Planetary Science Research 253 - - 269 - - - -
Outer Planets 184 261 104 -157 -60.0%
Total Planetary Science 1,447 1631 1,391 -240 -14.7%
New mandatory 128
Total Planetary Science (incl. new mandatory) 1,447 1631 1,519 -112 -6.9%
(continued)
NASA TABLES

43 GUIDE TO THE PRESIDENT’S BUDGET | RESEARCH & DEVELOPMENT FY 2017
▲ BACK TO TABLE OF CONTENTS
Table 2 (continued): Science Mission Directorate Funding(budget authority in millions of dollars)
FY 2015Actual
FY 2016Estimate*
FY 2017Budget
Change FY 16-17
Amount Percent
Astrophysics
Astrophysics Research 202 - - 223 - - - -
Cosmic Origins 201 - - 199 - - - -
SOFIA 1/ 70 85 84 -1 -1.6%
Hubble Space Telescope 99 - - 97 - - - -
Physics of the Cosmos 104 - - 88 - - - -
Exoplanet Exploration 101 - - 58 - - - -
Astrophysics Explorer 123 - - 129 - - - -
Total Astrophysics 731 768 697 -71 -9.3%
New mandatory 85
Total Astrophysics (incl. new mandatory) 731 768 782 14 1.8%
James Webb Space Telescope 645 620 569 -51 -8.2%
Total Science 5,243 5,589 5,303 -287 -5.1%
New mandatory 298
Total Science (incl. new mandatory) 5,243 5,589 5,601 11 0.2%
* At press time, NASA had yet to issue complete estimates. Data for FY 2016 is appropriated amount.Source: OMB R&D data and agency budget justification. All figures rounded to the nearest million.1/ Stratospheric Observatory for Infrared Astronomy.
Table 3: Aeronautics Funding(budget authority in millions of dollars)
FY 2015Actual
FY 2016Estimate*
FY 2017Budget
Change FY 16-17
Amount Percent
Airspace Ops and Safety 154 - - 141 - - - -
Advanced Air Vehicles 241 - - 269 - - - -
Integrated Aviation Systems 150 - - 117 - - - -
Transformative Concepts 97 - - 107 - - - -
Total Aeronautics 642 640 634 -6 -0.9%
New mandatory 156
Total Aeronautics (incl. new mandatory) 642 640 790 150 23.5%
* At press time, NASA had yet to issue complete estimates.Source: OMB R&D data and agency budget justification. All figures rounded to the nearest million.
OVERVIEW TABLESNASA TABLES

WWW.AAAS.ORG/PROGRAM/RD-BUDGET-AND-POLICY-PROGRAM 44
▲ BACK TO TABLE OF CONTENTS
Table 4: Human Exploration and Operations Funding(budget authority in millions of dollars)
FY 2015Actual
FY 2016Estimate*
FY 2017Budget
Change FY 16-17
Amount Percent
Space Operations
International Space Station 2,982 - - 3,004 - - - -
Space and Flight Support 839 - - 887 - - - -
Commercial Crew 1/ 805 1,244 1,185 -59 -4.7%
Total Space Operations 4,626 5,029 5,076 47 0.9%
Exploration
Exploration Systems Development 3,212 3,680 2,687 -994 -27.0%
Orion Program 1,190 1,270 1,053 -217 -17.1%
Space Launch Systems (SLS) 1,679 2,000 1,230 -770 -38.5%
Ground Systems 343 410 403 -7 -1.7%
Exploration R&D 331 350 477 127 36.4%
Human Research Program 142 - - 153 - - - -
Adv Exploration Systems 189 - - 324 - - - -
Total Exploration 3,543 4,030 3,164 -866 -21.5%
New mandatory 173
Total Exploration (incl. new mandatory) 3,543 4,030 3,337 -693 -17.2%
* At press time, NASA had yet to issue complete estimates. 1/ Data for Commercial Crew in FY 2016 is appropriated amount in omnibus legislation.Source: OMB R&D data and agency budget justification. All figures rounded to the nearest million.
NASA TABLES

45 GUIDE TO THE PRESIDENT’S BUDGET | RESEARCH & DEVELOPMENT FY 2017
▲ BACK TO TABLE OF CONTENTS
Table 5: Space Technology and Other Funding(budget authority in millions of dollars)
FY 2015Actual
FY 2016Estimate*
FY 2017Budget
Change FY 16-17
Amount Percent
Space Technology
SBIR / STTR 191 - - 213 - - - -
Agency Technology & Innovation 31 - - 34 - - - -
Space Tech Research & Dev 378 - - 443 - - - -
Total Space Technology 600 687 691 4 0.6%
New mandatory 136
Total Space Tech (incl. new mandatory) 600 687 827 140 20.4%
Safety, Security, Mission Svcs
Center Management & Ops 2,024 - - 2,018 - - - -
Agency Management & Ops 731 - - 819 - - - -
Total Safety, Security, Mission Svcs 2,755 2,769 2,837 68 2.5%
Const and Environ Compliance
Construction of Facilities 374 - - 328 - - - -
Environ Compl and Restoration 72 - - 92 - - - -
Total Const and Environ Compl 446 389 420 31 7.9%
Education 119 115 100 -15 -13.0%
Inspector General 37 37 38 1 1.9%
* At press time, NASA had yet to issue complete estimates.Source: OMB R&D data and agency budget justification. All figures rounded to the nearest million.
OVERVIEW TABLESNASA TABLES

WWW.AAAS.ORG/PROGRAM/RD-BUDGET-AND-POLICY-PROGRAM 46
▲ BACK TO TABLE OF CONTENTS
NATIONAL SCIENCE FOUNDATION (NSF)
CONTEXT AND RECENT HISTORY
As one of three agencies slated for a budget doubling in the original America COMPETES Act of 2007, NSF’s fiscal fortunes over the past several years have tended to be a bit better than other science agencies, even as the doubling effort fell short. As of FY 2010, the total NSF budget stood 13.4 percent above FY 2006 levels and 43.5 percent above FY 2000 levels. And NSF also saw a smaller drop in the sequester year, FY 2013, thanks to an added boost in final appropriations.1
Things have changed of late, however. Appropriations for NSF in the FY 2016 omnibus were slightly below inflation, while the debate over NSF’s geoscience and social science funding has persisted in recent years. House Republicans have made multiple attempts to pass a new America COMPETES bill that authorizes NSF appropriations at the directorate level (as opposed to the current authorization, which only allows a lump-sum appropriation for NSF research activities as a whole), thereby allowing deep cuts to the social science and geoscience directorates while boosting the other four directorates. Similar attempts have also been made to constrain appropriations directly for both disciplines. Most recently, during FY 2016 appropriations, the House approved report language that would have levied deep cuts on both directorates while boosting computing, engineering, math and physical sciences, and biology, though that language didn’t make it into the final omnibus; social sciences was ultimately flat funded while geosciences was allowed to grow. It remains to be seen whether these disciplinary battles will continue into FY 2017.
Another recent development in NSF funding is the downscaling of the National Ecological Observatories Network (NEON), a platform of dozens of ecological stations across the United States that will allow researchers to better understand large-scale dynamics affecting ecosystems. After it was discovered that NEON was approximately $80 million over budget, NSF officials decided to reduce the scope of the project and seek a new managing organization to oversee its construction and initial
operations. FY 2016 was the final year of construction funding for the six-year project, with an estimated $433.7 million price tag. NSF’s Biological Sciences Directorate will now assume full operations and maintenance funding responsibility for NEON.
NSF’s FY 2017 budget includes a major emphasis on clean energy R&D. At the UN Conference on Climate Change in November, President Obama joined business and world leaders to announce a new global coalition to spur research and development in clean energy. Dubbed “Mission Innovation,” the emerging initiative involves 20 governments seeking to double public investments in clean energy research over the next five years. NSF’s budget includes $512.2 million for clean energy-related R&D, a 38.0 percent increase over last fiscal year.
OVERALL NUMBERS
As shown in Tables 1 and 3, the proposed total budget for NSF is $8.0 billion, a 6.7 percent boost over FY 2016. However, $400 million of the agency’s $501 million requested increase would come via mandatory funding through a new legislative proposal. That one-year mandatory funding package would allow for an estimated 800 additional research grants, bringing NSF’s FY 2017 funding rate to an estimated 23 percent. Excluding this extra funding, which would require new legislation, NSF’s base discretionary budget would rise only by $101 million or 1.3 percent, less than the rate of inflation.
In FY 2017, NSF expects to evaluate over 52,000 competitive proposals and make over 12,000 new awards. NSF’s annual budget provides about a quarter of the total federal budget for basic research conducted at U.S. colleges and universities. Over 90 percent of NSF’s projects are funded using grants or cooperative agreements, of which three-fourths go to academic institutions.
For cross-foundation investments, there is a planned reduction of $5.3 million or 3.6 percent in cognitive and neuroscience research associated with Understanding the Brain, which includes agency contributions to the Administration’s Brain Research through Advancing Innovation and Neurotechnologies (BRAIN) Initiative. Risk and Resilience investments, promoting the study of extreme natural and man-made events, would be increased by $2 million or 4.9 percent. A large $13.5 million or 27.7 percent increase is requested for Innovations at the Nexus of Food, Energy and Water Systems (INFEWS), a new activity initiated in FY 2016 that aims to understand, design, and model
1 See, for instance, http://www.aaas.org/news/following-omnibus-most-science-agencies-are-or-near-pre-sequestration-funding

47 GUIDE TO THE PRESIDENT’S BUDGET | RESEARCH & DEVELOPMENT FY 2017
▲ BACK TO TABLE OF CONTENTS
the interconnected food, energy, and water system through an interdisciplinary research effort throughout NSF. Funding for the Cyberinfrastructure Framework for 21st Century Science, Engineering, and Education (CIF21) activity would decline by 24.4 percent, with the activity sunsetting by the end of FY 2017, while cybersecurity funding would rise by 15.4 percent, in accord with Administration prioritization of this area.
RESEARCH AND RELATED ACTIVITIES (R&RA)
NSF’s main Research & Related Activities (R&RA) account would see a $391.8 million or 6.5 percent increase in total, but only a 0.8 percent increase in base discretionary levels (see Table 2). Among the directorates, only Engineering would see a meaningful increase in the base budget, a gain of 3.3 percent. The other five directorates would all see increases of less than 0.5 percent each, before inflation.
Biological Sciences (BIO): All of the $45 million in new mandatory funding for BIO would go towards the Division of Emerging Frontiers, which promotes research across scientific disciplines and advances the conceptual foundations of biology. A new “Rules of Life” program within BIO is funded at $13 million for research including the study of microbiomes, synthetic biology, and origins of life. Elsewhere, BIO clean energy technology research – focused on bioenergy topics – would receive a large $31 million or 63.7 percent increase, building on the Administration’s push for greater investments in this area.
As noted above, BIO will assume full operations and maintenance funding responsibility for the National Ecological Observatory Network (NEON) beginning in FY 2017. It should be noted that, due to NEON, BIO infrastructure funding would amount to $65.5 million in FY 2017, a $21.0 million increase; this funding is entirely in the base budget, while the new mandatory spending would go towards BIO research activities. Given a flat base budget for BIO overall, if NSF is unable to obtain its proposed mandatory funding stream, that additional infrastructure funding may have to come from the directorate’s research activities.
Computer and Information Science and Engineering (CISE): CISE’s Advanced Cyberinfrastructure (ACI) program will play a significant role in the National Strategic Computing Initiative (NSCI), created by executive order last summer. Together with the Mathematical and Physical Sciences (MPS) directorate, ACI will co-lead NSF’s NSCI activity, and will represent NSF in the multiagency effort to develop supercomputers able to sustain
exaflop-level performance. CISE would continue to serve as the principal federal funder of basic research at academic institutions in the computer sciences, accounting for 82 percent of such funding. The base CISE budget would remain largely unchanged, while the additional $56.4 million in mandatory funding would be put towards research across the CISE divisions. CISE’s clean energy technology investments would double.
Engineering (ENG): ENG is the only research directorate that would see a clear increase in the base budget, due in large part to an increase for the Small Business Innovation and Research (SBIR) and Small Business Technology Transfer Activities (STTR) programs, as shown in Table 2. ENG would continue to lead the NSF-wide I-Corps program, which was flat-funded in the budget. ENG also acts as a co-lead for INFEWS, contributing $13.0 million or a 30.0 percent increase from FY 2016. The Engineering Research Centers program funding would increase by $4.5 million, or 8.0 percent, to $61.0 million. ENG’s portion of NSF’s mandatory spending would be devoted to research across the divisions.
$0
$200
$400
$1,200
$1,000
$1,600
$1,400
$800
$600
2000
2002
2004
2006
2008
2010
2012
2014
2016
SBE
CISE
BIO
ENG
GEO
MPS
Figure 1: NSF Directorate Budgets(budget authority in millions of constant FY 2016 dollars)
AAAS estimates based on NSF data and the FY 2017 request. GEO and CISE have been adjusted for comparability. © 2016 AAAS

WWW.AAAS.ORG/PROGRAM/RD-BUDGET-AND-POLICY-PROGRAM 48
▲ BACK TO TABLE OF CONTENTS
Geosciences (GEO): GEO’s base budget for FY 2017 would essentially remain unchanged, while mandatory spending would be spread across the divisions; the latter would account for almost the entirety of the increase for GEO. GEO serves as the main U.S. supporter of fundamental research in polar regions. U.S. Antarctic facilities and Arctic research support and logistics would receive a plus-up in the GEO facilities account of 4.1 percent and 7.6 percent, respectively. GEO’s request also emphasizes support for INFEWS activities, doubling the FY 2017 amount to $10 million. Investments would include increased funding for technologies that achieve high-resolution observations of hazardous earth and space weather (through mandatory funding), and instrument upgrades for the Geodesy Advancing Geosciences and EarthScope (GAGE) and Seismological Facilities for the Advancement of Geosciences and EarthScope (SAGE) facilities (again through mandatory funding). It’s not clear how these priorities would be handled should a mandatory funding stream not be obtained.
Mathematical and Physical Sciences (MPS): MPS supports a wide range of disciplinary and multidisciplinary programs in astronomical sciences, chemistry, materials research, mathematical sciences, and physics; all five of these programs receive roughly 6 percent increases with mandatory funding, but virtually no increase without it. Within MPS core programs, clean energy technology is slated for a $52 million or 36.3 percent increase. The MPS budget supports several facilities, including the Atacama Large Millimeter Array, the Laser-Interferometer Gravitational Wave Observatory, the National Radio Astronomy Observatories, and the National High Magnetic Field Laboratory. Many of these would receive funding boosts of varying scales in the base budget, which could create a squeeze on research should mandatory funding not be available to make up for the gap.
Social, Behavioral, and Economic Sciences (SBE): SBE’s base budget would be flat-funded, while mandatory spending would be spread across three of the four divisions (all but the National Center for Science and Engineering Statistics). SBE’s Science of Science and Innovation Policy (SciSIP) program would be held flat at $11.05 million. The directorate’s contributions to most agency-wide initiatives would also be held flat.
EDUCATION & HUMAN RESOURCES (EHR)
The FY 2017 budget grants EHR a large $73 million or 8.3 percent increase, though $54 million is mandatory. The discretionary total would still rise by 2.1 percent, a generous sum in a year of
flat base budgets at NSF. The budget provides $20 million for a new Computer Science for All initiative for states to increase access to K-12 computer science education. An additional $20 million, a 40 percent increase, is directed towards the CyberCorps Scholarship for Service program, which supports cybersecurity education and research at higher education institutions as well as workforce development. The STEM Professional Workforce activity would be flat-funded in the Undergraduate Education and Human Resource divisions, while it would grow in the Graduate Education division. The latter would also receive the lion’s share of EHR’s proposed mandatory funding stream.
MAJOR RESEARCH EQUIPMENT AND FACILITIES CONSTRUCTION (MREFC)
In FY 2017, NSF requests $106 million in new funding for the Regional Class Research Vessel project, representing the first year of a three-year proposal to build two ships. Additionally, NSF maintains the FY 2016 funding level of $20 million for continued construction of the Daniel K. Inouye Solar Telescope (DKIST), which will be the world’s most powerful solar observatory when completed in 2019. Meanwhile, funding for the top ground-based facility prioritized in the recent astronomy decadal survey, the Large Synoptic Survey Telescope (LSST), is reduced by a third or $33 million, as construction continues towards its FY 2022 completion date. FY 2016 was the final year of construction funding for the six-year NEON project, as noted previously, and no funds are requested.
AGENCY OPERATIONS AND AWARD MANAGEMENT
NSF is requesting $43 million to prepare for the planned NSF headquarters move from Arlington, VA to Alexandria, VA in 2017. Last year, the Administration proposed $30 million for the relocation, which was declined by appropriators.
IN HISTORICAL CONTEXT
In FY 2017, NSF’s base budget would remain 1.8 percent below pre-sequestration levels (as of FY 2012). NSF’s budget would also drop to 0.038 percent of GDP, somewhat below where it was a decade ago. Figure 1 shows the recent funding history for individual directorates.

49 GUIDE TO THE PRESIDENT’S BUDGET | RESEARCH & DEVELOPMENT FY 2017
▲ BACK TO TABLE OF CONTENTSNSF TABLES
Table 1: National Science Foundation R&D and Total Budget(budget authority in millions of dollars)
FY 2015Actual
FY 2016Estimate
FY 2017Budget
Change FY 16-17
Amount Percent
Total NSF R&D 5,990 6,117 6,160 44 0.7%
New mandatory R&D 369
Total R&D (incl. mandatory) 5,990 6,117 6,530 413 6.8%
NSF R&D by Character
Conduct of R&D 5,670 5,692 5,708 15 0.3%
New mandatory R&D 363
Total Conduct (incl. mandatory) 5,670 5,692 6,071 378 6.6%
R&D Facilities 320 424 452 28 6.6%
New mandatory R&D 7
Total Facils (incl. mandatory) 320 424 459 35 8.2%
Total NSF Budget 7,398 7,464 7,564 101 1.3%
Biological Sciences 736 744 746 2 0.2%
Comp and Info Sci and Eng 933 936 938 3 0.3%
Engineering 924 916 946 30 3.3%
Geosciences 1,319 1,319 1,320 1 0.1%
Math and Physical Sci 1,376 1,349 1,355 6 0.4%
Social, Behav and Econ Sci 276 272 272 0 0.1%
New mandatory funding 400
Total NSF (incl. mandatory) 7,398 7,464 7,964 501 6.7%
All new mandatory funding is via legislative proposal for FY 2017.Source: OMB R&D data, agency budget justification and Quantitative Data Tables.All figures rounded to the nearest million. Changes calculated from unrounded figures.

WWW.AAAS.ORG/PROGRAM/RD-BUDGET-AND-POLICY-PROGRAM 50
▲ BACK TO TABLE OF CONTENTSNSF TABLES
Table 2: Research and Related Activities Discretionary Budget(budget authority in millions of dollars)
FY 2015Actual
FY 2016Estimate
FY 2017Budget
Change FY 16-17
Amount Percent
Biological Sciences (BIO)
Molecular and Cellular Bioscis 135 136 137 1 0.9%
Integrative Organismal Sys 215 214 215 1 0.5%
Environmental Biology 144 144 145 1 0.8%
Biological Infrastructure 144 145 136 -9 -6.2%
Emerging Frontiers 98 106 113 7 6.7%
Total BIO 736 744 746 2 0.2%
New mandatory 45
Total BIO (incl. new mandatory) 736 744 791 46 6.2%
Computer and Information Science and Engineering (CISE)
Advanced Cyberinfrastructure 219 222 223 1 0.3%
Computing & Communic Foun 196 194 195 1 0.3%
Computer & Network Sys 231 231 232 1 0.3%
Info & Intelligent Sys 195 195 195 1 0.3%
Information Tech Research 92 93 94 0 0.3%
Total CISE 933 936 938 3 0.3%
New mandatory 56
Total CISE (incl. new mandatory) 933 936 995 59 6.3%
Engineering (ENG)
Chem, Bioeng, Env & Trans 180 184 187 3 1.8%
Civil, Mech & Manuf Innov 226 216 221 4 2.0%
Electl Commun & Cyber Sys 119 114 116 2 1.6%
Industrial Innov Prtnrshp 227 240 254 14 5.9%
SBIR/ STTR 177 189 202 13 7.0%
Engineering Edu & Centers 118 108 114 6 5.5%
Emerging Front in Res Innov 53 54 55 1 1.1%
Total ENG 924 916 946 30 3.3%
New mandatory 56
Total ENG (incl. new mandatory) 924 916 1,003 87 9.4%
Geosciences (GEO)
Atmospheric and Geospace Sci 252 254 254 0 0.0%
Earth Sciences 178 179 179 0 0.0%
Integrative & Collab Edu & Res 84 84 85 1 1.2%
Ocean Sciences 361 360 360 0 0.0%
Polar Programs 443 442 442 -0 -0.0%
Total GEO 1,319 1,319 1,320 1 0.1%
New mandatory 79
Total GEO (incl. new mandatory) 1,319 1,319 1,399 80 6.1%
(continued)

51 GUIDE TO THE PRESIDENT’S BUDGET | RESEARCH & DEVELOPMENT FY 2017
▲ BACK TO TABLE OF CONTENTSNSF TABLES
Table 2 (continued): Research and Related Activities Discretionary Budget(budget authority in millions of dollars)
FY 2015Actual
FY 2016Estimate
FY 2017Budget
Change FY 16-17
Amount Percent
Mathematical and Physical Sciences (MPS)
Astronomical Sciences 245 247 248 1 0.4%
Chemistry 246 246 247 1 0.4%
Materials Research 338 310 311 1 0.3%
Mathematical Sciences 235 234 235 1 0.4%
Physics 276 277 279 2 0.5%
Multidisciplinary Activities 36 35 35 0 1.2%
Total MPS 1,376 1,349 1,355 6 0.4%
New Mandatory 81
Total MPS (incl. new mandatory) 1,376 1,349 1,436 87 6.5%
Social, Behavioral, and Economic Sciences (SBE)
Social & Economic Scis 98 98 98 0 0.0%
Behavioral & Cognitive Scis 97 95 95 0 0.0%
Natl Ctr for Sci and Eng Stats 51 51 52 1 2.0%
Office of Multidiscip Act 30 28 27 -1 -2.8%
Total SBE 276 272 272 0 0.1%
New mandatory 16
Total SBE (incl. new mandatory) 276 272 289 17 6.1%
International & Integrative Activities 427 447 451 4 0.9%
EPSCoR 165 160 162 2 1.3%
EPSCoR mandatory funding 9
Major Res Instrument (MRI) 74 76 90 14 18.9%
Ofc of Internatl Sci and Engineering 48 49 49 0 0.0%
OISE mandatory funding 3
Arctic Research Commission 1 1 1 0 0.0%
Total R&RA 6,042 6,034 6,079 46 0.8%
New mandatory 346
Total R&RA (incl. new mandatory) 6,042 6,034 6,425 392 6.5%
All new mandatory funding is via legislative proposal for FY 2017.Source: OMB R&D data, agency budget justification and Quantitative Data Tables.All figures rounded to the nearest million. Changes calculated from unrounded figures.
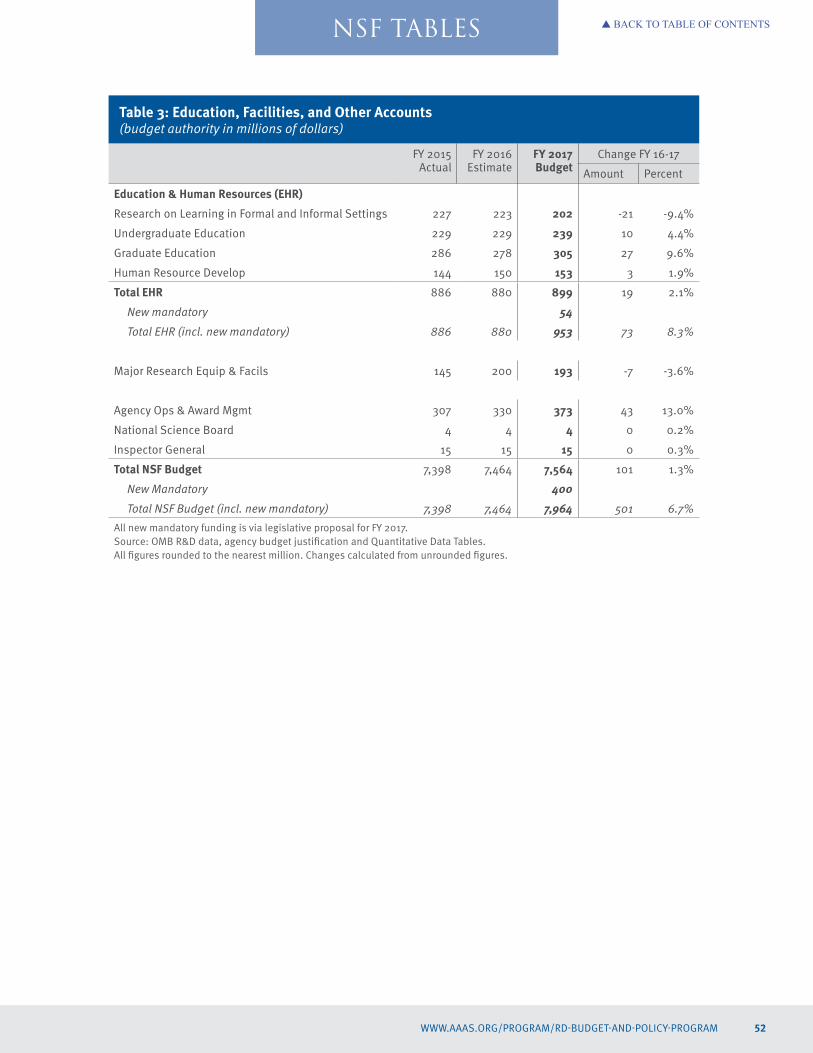
WWW.AAAS.ORG/PROGRAM/RD-BUDGET-AND-POLICY-PROGRAM 52
▲ BACK TO TABLE OF CONTENTSNSF TABLES
Table 3: Education, Facilities, and Other Accounts(budget authority in millions of dollars)
FY 2015Actual
FY 2016Estimate
FY 2017Budget
Change FY 16-17
Amount Percent
Education & Human Resources (EHR)
Research on Learning in Formal and Informal Settings 227 223 202 -21 -9.4%
Undergraduate Education 229 229 239 10 4.4%
Graduate Education 286 278 305 27 9.6%
Human Resource Develop 144 150 153 3 1.9%
Total EHR 886 880 899 19 2.1%
New mandatory 54
Total EHR (incl. new mandatory) 886 880 953 73 8.3%
Major Research Equip & Facils 145 200 193 -7 -3.6%
Agency Ops & Award Mgmt 307 330 373 43 13.0%
National Science Board 4 4 4 0 0.2%
Inspector General 15 15 15 0 0.3%
Total NSF Budget 7,398 7,464 7,564 101 1.3%
New Mandatory 400
Total NSF Budget (incl. new mandatory) 7,398 7,464 7,964 501 6.7%
All new mandatory funding is via legislative proposal for FY 2017.Source: OMB R&D data, agency budget justification and Quantitative Data Tables.All figures rounded to the nearest million. Changes calculated from unrounded figures.

53 GUIDE TO THE PRESIDENT’S BUDGET | RESEARCH & DEVELOPMENT FY 2017
▲ BACK TO TABLE OF CONTENTS
UNITED STATES DEPARTMENT OF AGRICULTURE (USDA)
CONTEXT AND RECENT HISTORY
The past two decades have seen major budget-boosting initiatives targeted at federal science agencies like the National Institutes of Health and the National Science Foundation, but these efforts have left out the Department of Agriculture (USDA), to the chagrin of the agricultural science community. Over the past decade, USDA R&D funding has declined by 7.4 percent, even factoring in a reasonable funding recovery post-sequestration in the past few years (see Figure 1). Given these declines, there is increasing interest among advocates in elevating the profile for USDA R&D programs before policymakers and the public.
OVERALL NUMBERS
As at other agencies, USDA’s FY 2017 request relies partially on a mandatory funding stream, specifically for the competitive, extramural Agriculture and Food Research Initiative grants program (see below for additional detail). Including or excluding this mandatory funding radically changes the complexion of the USDA R&D budget. Including it yields total requested R&D of $2.9 billion in FY 2016, a significant 9.3 percent increase in comparison to FY 2016. Excluding it, the USDA R&D budget would decline by 2.9 percent to $2.6 billion (see Table 1).
USDA’s main research arms are the intramural Agricultural Research Service and the extramural National Institute of Food and Agriculture. The latter of these would receive the entirety of USDA’s proposal for mandatory funding this year. Otherwise there are limited changes in overall funding levels for both, but some highlights are noted below.
AGRICULTURAL RESEARCH SERVICE (ARS)
There are four major cross-cutting initiatives within ARS this year, all of which would receive major funding increases through the discretionary budget. ARS requests a $22.3 million increase for antimicrobial resistance research to $52.4 million, a boost of 74.2 percent above the prior year’s levels, in accord with the White House’s 2015 National Action Plan for Combating
Antibiotic-Resistant Bacteria;1 several other USDA agencies are also involved in this effort. On the sustainability front, ARS requests $25.3 million for research on climate resilient crops, an $11 million or 77.2 percent increase, and an additional 84.2 percent increase (to $17.5 million) for vulnerability assessment. Lastly, research on sustainable water use in agriculture would more than double, reaching $27.0 million from $12.0 million. It should be noted that overall funding for ARS’ major research programs would see minimal change, which means the increases for these initiatives would come at the expense of many other ongoing projects across the ARS research spectrum.
Outside of these priority areas, funding would more than double for avian influenza research (to $5.6 million) and animal disease biodefense (to $11.6 million).
ARS also seeks a reduced request for facilities construction and modernization, primarily because Congress completed appropriations in the FY 2016 omnibus for construction of a new Southeast Poultry Research Lab in Athens, GA. That facility, with a price tag of nearly $160 million, has been first priority in the ARS capital investment strategy. Demolition will commence in FY 2017, and construction is expected to be completed by FY 2023. This year’s facilities funding request, at $94.5 million, includes funding for construction of Phase I of the Agricultural Research Technology Center in Salinas, CA, and for construction of the Foreign Disease-Weed Science Research Lab at Ft. Detrick, MD.
NATIONAL INSTITUTE OF FOOD AND AGRICULTURE (NIFA)
The overall discretionary budget for NIFA would see limited change overall, with the Administration scrapping past attempts to establish public-private innovation institutes (likely due in part to lack of Congressional interest).
The largest change is certainly the increase for the Agriculture and Food Research Initiative (AFRI), USDA’s growing competitive grants program. The Administration would like to see the program’s budget double to its authorized level of $700 million. However, the Administration would utilize mandatory funding to achieve most of the funding boost here. In the case of AFRI, the discretionary budget would rise by 7.1 percent to $375 million, with mandatory funding accounting for the remainder. In the discretionary budget, $21 million – accounting for the bulk of the increase – is slated for new education and training grants for
1 For more see https://www.whitehouse.gov/the-press-office/2015/03/27/fact-sheet-obama-administration-releases-national-action-plan-combat-ant.

WWW.AAAS.ORG/PROGRAM/RD-BUDGET-AND-POLICY-PROGRAM 54
▲ BACK TO TABLE OF CONTENTS
students. Other new AFRI awards funding includes $48 million for water use research, $8.9 million for antimicrobial resistance, $13.3 million for childhood obesity, $10.7 million for climate resilience, $10 million on pollinator health, and $32.5 million on bioenergy. The supplemental mandatory component would be used toward transdisciplinary research on an array of topics. NIFA reports the current funding rate for new awards is only 12 percent.
Formula funds would mostly remain flat, with an increase of $3.8 million for 1890 institutions – historically black colleges – to, in part, support research on health issues in minority communities. An additional $10 million would be provided to establish a trio of capacity centers at 1890 institutions, to improve collaboration between universities and the USDA and to bring additional minority students into the STEM pipeline. Elsewhere, in an interest to avoid duplication, several STEM education programs at USDA would be zeroed out and consolidated with education programs in the National Science Foundation and the Department of Education.
ECONOMIC RESEARCH SERVICE (ERS)
Of the $5.9 million increase for ERS, $4.0 million would be used for a second round of the National Household Food Purchase and Acquisition Survey, last fielded in 2012. The remainder would
be used to explore drought resilience by American farmers and demographics of the farming and ranching workforce.
NATIONAL AGRICULTURAL STATISTICS SERVICE (NASS)
The funding increase would be directed towards several initiatives in the Agricultural Estimates Program, including data collection on beginning farmers, satellite-based monitoring, and data collection related to antimicrobial resistance. The Census of Agriculture remains flat at $42.2 million in FY 2017, in its final year of preparation before the next census in 2018.
FOREST SERVICE
The Forest and Rangeland Research account would remain essentially flat, but all research programs – on fire and fuels, invasive species, resource management, and other topics – would be subject to a two percent reduction in FY 2017 to make room for support of the Joint Science Fire program, at $3 million. That program, an extramural activity in collaboration with the Department of the Interior, is currently funded through the Service’s Wildland Fire Management program, with an FY 2016 budget of $6.9 million. The Forest Service’s Wildland Fire Research and Development program would also remain flat.
Econ Res Service
Agr Res Service
Nat’l Inst Food Agr
Other
ARRA
Forest Service
$0
$.5
$1.0
$1.5
$2.0
$2.5
$3.0
$3.5
2017
2016
2015
2014
2013
2012
2011
2010
2009
2008
2007
2006
2005
2004
2003
2002
2001
2000
Figure 1: USDA R&D, FY 2000 - 2017 (in billions of constant FY 2016 dollars)
Source: AAAS R&D reports and FY 2017 agency budget documents. © 2016 AAAS

55 GUIDE TO THE PRESIDENT’S BUDGET | RESEARCH & DEVELOPMENT FY 2017
▲ BACK TO TABLE OF CONTENTS
IN HISTORICAL CONTEXT
As mentioned above, USDA’s research budget has declined over the past several years, but there has been the start of a turnaround since the sequestration of FY 2013. Of the above agencies, all minus the Forest Service would be at least 2.5 percent above pre-sequestration funding levels in FY 2017 (compared against FY 2012 funding, the last year before sequestration). Forest and Rangeland Research would fall 8.7 percent below FY 2012 levels, and in fact slightly below sequestration-level funding in FY 2013. In FY 2017, AFRI’s base budget request (excluding the additional mandatory spending) would represent a 63.4 percent increase above funding at its initial creation in FY 2009, signifying its steady growth in recent years. Still, USDA R&D would only amount to 0.013 percent of GDP, continuing the decline from the past decade-plus on that metric.

WWW.AAAS.ORG/PROGRAM/RD-BUDGET-AND-POLICY-PROGRAM 56
▲ BACK TO TABLE OF CONTENTS
Table 1. U.S. Department of Agriculture R&D (budget authority in millions of dollars)
FY 2015Actual
FY 2016Estimate
FY 2017Budget
Change FY 16-17
Amount Percent
Agricultural Research Service (ARS)
Salaries and Expenses 1,133 1,144 1,161 17 1.5%
Trust Funds 30 30 30 0 0.0%
Buildings and Facilities 45 212 95 -118 -55.4%
Total ARS R&D
1,208 1,386 1,286 -101 -7.3%
National Institute of Food and Agriculture (NIFA)
Biomass R&D 1/ 3 3 3 0 0.0%
All Other 806 835 876 41 4.9%
Agri Food Res Init (AFRI) 325 350 375 25 7.1%
New mandatory funding 2/ 325
AFRI total (incl. mandatory) 325 350 700 350 100.0%
Total NIFA R&D 809 838 879 41 4.9%
Economic Research Service 85 85 91 6 6.9%
Forest Service 302 315 292 -23 -7.3%
Foreign Agricultural Service 1 1 1 0 0.0%
Nat Agricultural Stats Service 9 9 9 0 0.0%
Animal & Plant Inspection Srv 40 40 40 0 0.0%
Total USDA R&D 2,454 2,674 2,598 -77 -2.9%
New mandatory funding 325
Total USDA R&D (incl. mand.) 2,923 248 9.3%
Select Discretionary Budgets (include non-R&D components)
Forest Service 5,073 6,381 4,894 -1,487 -23.3%
Forest and Rangeland Research 296 291 292 1 0.3%
Wildland Fire R&D 20 20 20 0 0.0%
Joint Fire Science Program 3/ 7 7 0 -7 -100.0%
Research, Edu, and Economics 2,729 2,941 2,903 -38 -1.3%
Agri Research Service (ARS) 1,176 1,356 1,256 -100 -7.4%
Nat Inst Food Agri (NIFA) 1,295 1,331 1,379 48 3.6%
Hatch Act 244 244 244 0 1 0.0%
1890 Research and Extension 52 54 58 4 7.0%
Cooperative Forestry 34 34 34 0 0.0%
Economic Research Service 85 85 91 6 6.9%
Nat Agriculture Stats Serv 172 168 177 8 4.9%
Source: OMB R&D data, agency budget justification, and agency budget documents. All figures rounded to the nearest million. Changes calculated from unrounded figures. 1/ Mandatory program authorized in Farm Bill. 2/ Legislative proposal for FY 2017. 3/ Support shifts to Forest and Rangeland Research appropriation beginning in FY 2017
USDA TABLE

57 GUIDE TO THE PRESIDENT’S BUDGET | RESEARCH & DEVELOPMENT FY 2017
▲ BACK TO TABLE OF CONTENTS
DEPARTMENT OF COMMERCE (DOC)
NATIONAL INSTITUTE OF STANDARDS AND TECHNOLOGY (NIST)
The original America COMPETES Act of 2007 tabbed NIST laboratories for a budget doubling – along with the National Science Foundation and the Office of Science in the Department of Energy – and established the Under Secretary of Commerce for Standards and Technology. While appropriations for all three physical science agencies have fallen short of that ambitious doubling goal, the NIST budget still grew by 42 percent between FY 2007 and FY 2015, after adjusting for inflation. In fact, following the FY 2016 omnibus, NIST is one of the only major science and technology agencies that has seen its budget completely recover from the government-wide funding decline that began in FY 2011. Total NIST funding is now over 10 percent above FY 2010 levels, mostly due to lab funding growth.
The FY 2017 budget request would continue that growth by providing an increase of $51 million or 5.2 percent above last year’s levels to reach $1 billion in total discretionary spending. In addition, as in years past, the Administration again includes a $1.9 billion mandatory spending proposal to expand the National Network for Manufacturing Innovation, as well as $100 million in additional new mandatory funding to renovate and modernize NIST facilities through authorization legislation that will be proposed (see Table 1).
NIST’s Scientific and Technical Research and Services (STRS) account covers NIST’s seven research labs, which focus on material and physical measurements, cybersecurity, nanoscale science, communications technology, and other basic research areas. The STRS budget would fund seven program increases in all, perhaps most notably a $13.6 million increase for future computing technologies – more than double the FY 2016 amount – to build ultra-fast superconducting computers. This activity supports the recent National Strategic Computing Initiative (NSCI), a government-wide effort to maximize the benefits of high performance computing announced in 2015.
Other notable increases within STRS include the Advanced Sensing for Manufacturing initiative, with a $2 million increase to reach $7 million total in FY 2017, to support the manufacture of advanced electronics and nanoengineered devices. NIST’s activities to develop measurement tools for advanced biomanufacturing would also increase by $2 million, to $19.5 million total. Yet another $2 million increase is slated for the Advanced Communications initiative, to fund new efforts in FY 2017 to improve public safety communications and advance next-generation 5G wireless networks. This initiative would reach $14.8 million in FY 2017. Additional funding is requested to acquire fuel for Center for Neutron Research reactor operations.
Elsewhere, NIST’s Industrial Technology Services (ITS) account supports national manufacturing infrastructure through the National Network for Manufacturing Innovation (NNMI) and the Hollings Manufacturing Extension Partnership (MEP). As of January 2016, the Advanced Manufacturing Technology Consortia (AMTech) program, which provides grants for high-priority manufacturing research challenges, and the NNMI have been merged; the operational implications of this merger have yet to be formalized and announced by NIST.
The multiagency NNMI, which was authorized for the first time in late 2014, would receive $47 million in discretionary funding, an increase of $22 million. This funding would be used to establish two new institutes, as well as to coordinate activities of all institutes in the network. Other discretionary funding at other agencies would further expand the network, complementing the thirteen existing institutes in partnership with DOD and DOE. As mentioned above, the Administration is also proposing $1.9 billion in mandatory funding to ultimately build out a full network of up to 45 institutes by FY 2025. NNMI’s overall objective is to foster collaboration among industry, government, and universities through linked institutes developing new manufacturing technologies and processes. These institutes are modeled on the Fraunhofer Institutes, a German research organization of over 60 institutes focusing on different fields of applied science, including manufacturing.
MEP would receive a $12 million or 9.2 percent increase to reach a total of $142.0 million for FY 2017. The program consists of 58 centers that work with local manufacturers to provide access to technologies, resources, and industry experts via federal-state-industry partnerships.

WWW.AAAS.ORG/PROGRAM/RD-BUDGET-AND-POLICY-PROGRAM 58
▲ BACK TO TABLE OF CONTENTS
NIST’s construction account, which includes maintenance, repair, modernization, and major renovation of facilities, would decrease by $24 million in FY 2017, though NIST also proposes $100 million in mandatory funds for construction, as mentioned above. The base budget cut includes a $20 million reduction for the Radiation Physics Building 245 in Gaithersburg, MD, following completion of initial efforts to improve the condition of the building; this would be offset by $20 million in mandatory funding to execute the next phases of construction requirements. The remaining $80 million in mandatory spending would go towards renovation of the agency’s Boulder, CO, laboratory for physical sciences and precision measurement.
NATIONAL OCEANIC AND ATMOSPHERIC ADMINISTRATION (NOAA)
The Administration’s FY 2017 budget requests $5.9 billion in total discretionary spending at NOAA, a slight increase of 1.3 percent over FY 2016. The President’s budget once again proposes large increases for climate research programs, while the agency’s key environmental satellite programs would see a decrease in funding given the transition from development to operations.
Estimated R&D at NOAA amounts to $810 million in the President’s budget, a small 0.6 percent overall increase above FY 2016 levels. Over half of all NOAA R&D funding is contained in the Office of Oceanic and Atmospheric Research (OAR), which would see a large 9.3 percent increase to $483 million in FY 2017. The agency is requesting a $3 million increase to sustain observation and research at NOAA’s six Atmospheric Baseline Observatories, which document trends on global climate, ozone depletion, and changes in air quality. Another $3 million funding boost would help expand NOAA’s network of climate sensors and modelling of carbon dioxide emissions and greenhouse gases across North America. Additional funds would bolster research related to Arctic Ocean changes and resilience activities in support of the U.S. Global Change Research Program.
Ocean, Coastal, and Great Lakes Research would decline by $5 million or 14.4 percent in FY 2017. The program’s laboratories and cooperative institutes as well as the National Sea Grant College Program would all see decreases, while the ocean acidification observing network would receive a large $12 million increase to a total of $22 million, more than double the FY 2016 enacted level. The budget also establishes a new Research Transition
Acceleration Program, in the amount of $10 million, to promote commercialization of NOAA-funded research projects. High Performance Computing Initiatives are flat-funded.
The National Environmental Satellite, Data, and Information Service (NESDIS) budget would decline by $46 million or 1.9 percent to $2.3 billion. The budget requests a planned decrease of $119 million or 13.7 percent for the Geostationary Operational Environmental Satellite R-Series (GOES-R), set to launch later this year with the goal of improving forecasting, tracking, and monitoring of severe weather. A decrease of $22 million or 2.7 percent would take total funding down to $787 million for NOAA’s Joint Polar Satellite System (JPSS) program, which will provide data continuity for weather prediction models. JPSS-1 is approaching its launch date in FY 2017, while the succeeding JPSS-2 currently has a launch readiness date at the end of FY 2021. NOAA’s request includes a $23 million increase for a Polar Follow On to continue polar weather satellite observations after JPSS-2.
The National Weather Service (NWS) would essentially stay flat with a small 0.4 percent decrease to $1.1 billion, though the budget contains proposals to modernize observation and information technology within the NWS portfolio. Among the proposed increases are implementation of the Next Generation Weather Radar (NEXRAD) infrastructure for improving severe weather forecast and warning services during high-impact events like tornadoes, as well as improvement modeling and forecast products at the National Water Center.
Funding for new vessel construction would see a decrease of $51 million in FY 2017, as NOAA plans to use remaining funds from the prior year to complete a regional survey vessel as part of a multi-year fleet ship recapitalization initiative.
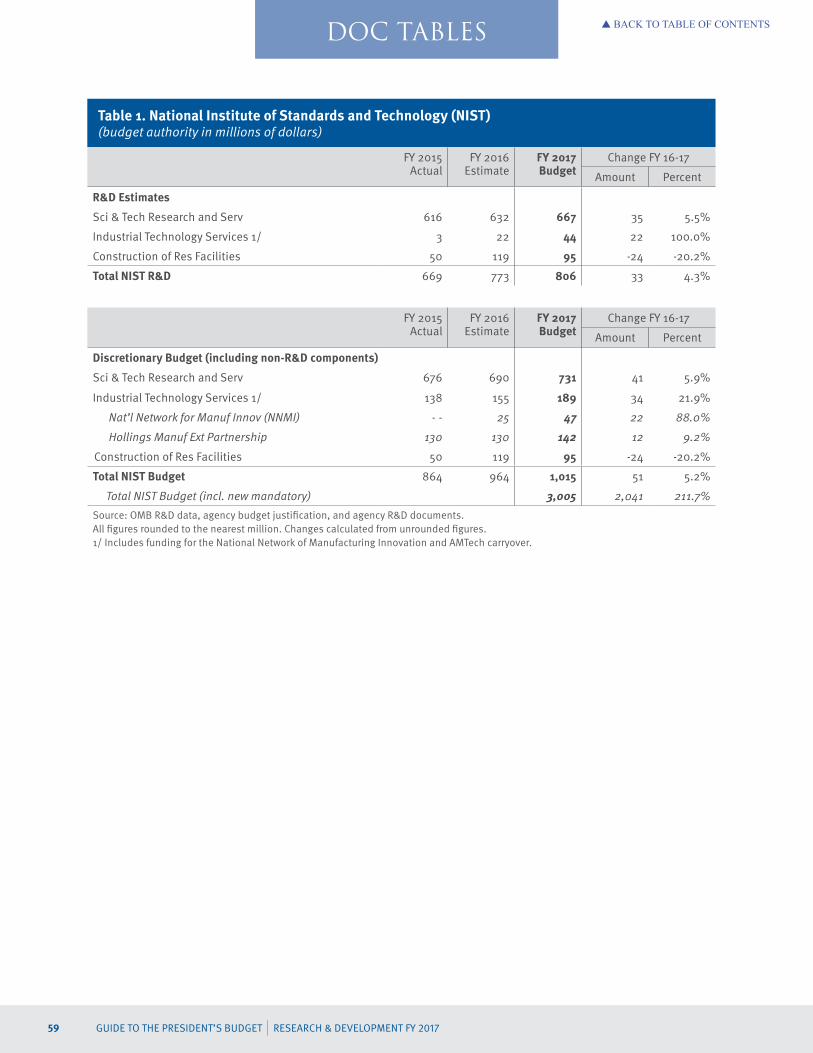
59 GUIDE TO THE PRESIDENT’S BUDGET | RESEARCH & DEVELOPMENT FY 2017
▲ BACK TO TABLE OF CONTENTSOVERVIEW TABLES
Table 1. National Institute of Standards and Technology (NIST) (budget authority in millions of dollars)
FY 2015Actual
FY 2016Estimate
FY 2017Budget
Change FY 16-17
Amount Percent
R&D Estimates
Sci & Tech Research and Serv 616 632 667 35 5.5%
Industrial Technology Services 1/ 3 22 44 22 100.0%
Construction of Res Facilities 50 119 95 -24 -20.2%
Total NIST R&D 669 773 806 33 4.3%
FY 2015Actual
FY 2016Estimate
FY 2017Budget
Change FY 16-17
Amount Percent
Discretionary Budget (including non-R&D components)
Sci & Tech Research and Serv 676 690 731 41 5.9%
Industrial Technology Services 1/ 138 155 189 34 21.9%
Nat’l Network for Manuf Innov (NNMI) - - 25 47 22 88.0%
Hollings Manuf Ext Partnership 130 130 142 12 9.2%
Construction of Res Facilities 50 119 95 -24 -20.2%
Total NIST Budget 864 964 1,015 51 5.2%
Total NIST Budget (incl. new mandatory) 3,005 2,041 211.7%
Source: OMB R&D data, agency budget justification, and agency R&D documents.All figures rounded to the nearest million. Changes calculated from unrounded figures.1/ Includes funding for the National Network of Manufacturing Innovation and AMTech carryover.
DOC TABLES

WWW.AAAS.ORG/PROGRAM/RD-BUDGET-AND-POLICY-PROGRAM 60
▲ BACK TO TABLE OF CONTENTSOVERVIEW TABLES
Table 2. National Oceanic and Atmospheric Administration (NOAA) (budget authority in millions of dollars)
FY 2015Actual
FY 2016Estimate
FY 2017Budget
Change FY 16-17
Amount Percent
R&D Estimates
Natl Ocean Service 71 74 79 5 6.7%
Natl Marine Fisheries Service 89 71 75 4 5.5%
Oceanic and Atmos Res 412 441 483 41 9.3%
Natl Weather Service 17 26 23 -3 -11.9%
NESDIS 1/ 24 26 33 7 28.5%
Off of Marine and Aviat Ops 80 167 117 -50 -29.8%
Total NOAA R&D 692 805 810 4 0.6%
FY 2015Actual
FY 2016Estimate
FY 2017Budget
Change FY 16-17
Amount Percent
Discretionary Budget (including non-R&D components)
Natl Ocean Service* 485 504 532 28 5.6%
Natl Marine Fisheries Service* 822 849 905 55 6.5%
Oceanic and Atmos Res* 446 482 520 38 7.8%
Climate Research 158 158 190 32 20.2%
Weather and Air Chemistry Research 91 103 102 -1 -1.2%
Ocean, Coastal, Great Lakes Research 27 32 27 -5 -14.4%
Natl Weather Service* 1,087 1,124 1,119 -5 -0.4%
NESDIS* 1/ 2,223 2,349 2,304 -46 -1.9%
GOES-R 981 872 753 -119 -13.7%
JPSS 916 809 787 -22 -2.7%
Off of Marine and Aviat Ops* 213 303 258 -45 -14.8%
Total NOAA 5,449 5,774 5,851 77 1.3%
Source: OMB R&D data, agency budget justification, and agency R&D documents.*ORF and PAC fundingAll figures rounded to the nearest million. Changes calculated from unrounded figures.1/ National Environmental Satellite, Data, and Information Service.
DOC TABLES

61 GUIDE TO THE PRESIDENT’S BUDGET | RESEARCH & DEVELOPMENT FY 2017
▲ BACK TO TABLE OF CONTENTS
DEPARTMENT OF TRANSPORTATION (DOT)
Last December saw passage of the FAST Act (for “Fixing America’s Surface Transportation” Act), a five-year surface transportation reauthorization and the first such long-term multiyear reauthorization in a decade. On the science and technology front, that bill generally fell short of Administration funding aims for Department of Transportation (DOT) R&D. As shown in Table 1, it did achieve a $10 million per year increase for the Federal Highway Administration (FHWA) Highway R&D program – which deals with safety, infrastructure, environment, and some high-risk exploratory research, and also provides funding for DOT’s Turner-Fairbank Highway Research Center – but keeps it flat throughout the five-year term. The University Transportation Centers program also secured modest FAST Act increases in FY 2017 and FY 2019, with a competition for a new set of centers taking place this year. The Intelligent Transportation System program, which deals with connected and autonomous vehicles, and associated data and technology needs, was kept flat from the prior authorization over all five years.
To build on the FAST Act, the Administration is proposing the 21st Century Clean Transportation Investment Plan. This plan, paid for by a fee on oil companies of $10 per barrel, would increase infrastructure and related spending by nearly $20 billion per year over the next ten years, according to the Administration. An array of activities would be funded to cut carbon emissions, expand transit, and modernize national infrastructure, with some specified for particular technology R&D endeavors. For instance, the National Highway Traffic Safety Administration (NHTSA) would receive $200 million for R&D on autonomous vehicle activities in FY 2017, and nearly $4 billion total over the next decade. FHWA would receive $109.5 billion over the next decade, for assorted grant and formula programs. Most spending in this package is not R&D and thus outside the scope of this report; and in reality, the size of the desired expenditures and the method of financing means this package will likely remain a proposal.
Including or excluding this extra mandatory spending for NHTSA makes the DOT R&D budget look very different. Including it means a 15.4 percent increase, as seen in Table 1. Leaving aside this mandatory spending, DOT’s R&D funding would decline by an estimated 6.2 percent.
Elsewhere, the Federal Railroad Administration would receive a $14.4 million plus-up for its Railroad R&D Program in FY 2017 to address safer transportation of crude oil and natural gas, while other core programs would remain flat. The FAST Act also provided funding for high performance rail networks and technology.
A major goal for Congress this year is Federal Aviation Administration (FAA) reauthorization. At the time of this writing, the current authorization expires at the end of March, and a bill is making its way through the House. In the President’s request, FAA R&D program funding levels would receive minimal change. The NextGen modernization initiative would rise to $1 billion.

WWW.AAAS.ORG/PROGRAM/RD-BUDGET-AND-POLICY-PROGRAM 62
▲ BACK TO TABLE OF CONTENTSOVERVIEW TABLESDOT TABLE
Table 1. Department of Transportation R&D(budget authority in millions of dollars)
FY 2015Actual
FY 2016Estimate
FY 2017Budget
Change FY 16-17
Amount Percent
Dept. of Transportation R&D
Federal Highway Administration 365 322 330 7 2.3%
Federal Aviation Administration 325 425 414 -12 -2.7%
Research, Engineer, & Devel 157 166 168 2 0.9%
Facilities and Equipment 114 203 189 -14 -6.7%
Federal Transit Administration 33 0 0 0 - -
Federal Railroad Administration 43 43 58 15 34.9%
Natl Highway Traffic & Safety 79 88 8 -80 -90.9%
New Mandatory R&D 200
Office of the Secretary 11 14 22 9 61.5%
Pipeline and Hazardous Mats 21 21 24 2 10.4%
Fed Motor Carrier Safety Admin 9 10 11 1 8.8%
Total DOT R&D 887 924 866 -58 -6.2%
Total R&D (incl. new mand.) 1,066 142 15.4%
FY 2015Actual
FY 2016Estimate
FY 2017Budget
Change FY 16-17
Amount Percent
Select Dept. of Transportation Agency Budgets (includes non-R&D components)
Federal Highway Administration 40,995 43,100 44,005 905 2.1%
Research, Tech, and Ed Program 400 415 418 3 0.7%
Highway R&D 115 125 125 0 0.0%
Intelligent Transportation Sys 100 100 100 0 0.0%
State Planning and Research 186 195 200 5 2.4%
University Transp Centers 73 73 75 3 3.4%
21st Century Transp Plan 1/ 7,500
Federal Aviation Administration
Res, Eng, and Dev 157 166 168 2 0.9%
NextGen 857 980 1,000 20 2.0%
Federal Railroad Administration
Railroad R&D 39 39 54 14 36.8%
Natl Highway Traffic Safety Admin 830 869 981 112 12.9%
Operations and Research 269 296 396 100 33.9%
21st Century Transportation Plan 1/ 200
Office of the Secretary
Planning, Res, Development 6 9 17 9 100.5%
Asst. Sec, Research & Tech 13 13 18 5 38.5%
Source: OMB R&D data and DOT budget justification.All figures rounded to nearest million. Changes calculated from unrounded figures.1/ New mandatory spending proposal in FY 2017.

63 GUIDE TO THE PRESIDENT’S BUDGET | RESEARCH & DEVELOPMENT FY 2017
▲ BACK TO TABLE OF CONTENTS
DEPARTMENT OF HOMELAND SECURITY (DHS)
CONTEXT AND RECENT HISTORY
R&D funding at the Department of Homeland Security (DHS) has had an erratic history since the Department’s establishment in 2002, owing in part to overarching concerns about DHS operational and financial management, coordination, and ability to successfully carry out its mission. Over a decade ago, the Government Accountability Office (GAO) designated DHS implementation as a high-risk endeavor due to the challenges associated with creating a new department from 22 separate agencies and programs, as DHS has been tasked to do, and GAO has since watched the agency closely. In a February 2015 update, GAO did find that DHS leadership has made significant progress towards improved operation, but the task is ongoing.1
These concerns extend into the DHS science and technology space. Specifically, GAO in 2012 found that the department did not know how much it actually spent on R&D and lacked “a department-wide policy defining R&D or guidance directing components how to report R&D activities.” GAO also found DHS R&D activities to be uncoordinated, fragmented, and potentially duplicative, and the department’s technology products received mixed reviews. As of 2014, DHS had taken some steps to remedy the situation but, as in other areas, progress remained.2
In addition to these performance challenges, Congress has for years been critical of the quality, organization, and complexity of the department’s budget requests. That complexity is another side effect of the multiagency consolidation DHS represents, as many individual DHS components have kept their traditional budget and appropriations structures in place. In the FY 2016 omnibus, to remedy the situation, appropriators did insert a clause to give DHS the power to streamline and simplify its budget. In the FY 2017 request, DHS is exercising that power and adopting a Common Appropriations Structure (CAS) across the entire department excepting the Coast Guard. The CAS is composed of four accounts: operations and support; procurement, construction, and improvements; research and development; and federal assistance.3 The hope is that this common structure will ensure consistency and alignment of resources, and allow for improved transparency and oversight. These categories are visible in Table 1.
Another significant change for FY 2017 is DHS’s proposal to consolidate the Domestic Nuclear Detection Office with several other DHS offices and programs to establish a new Chemical, Biological, Radiological, Nuclear, and Explosives (CBRNE) Office. DHS capabilities in those areas have been fragmented across multiple offices and programs, and the new office puts them all under one roof, which may help DHS’s ability to partner with state, local, federal, and international law enforcement. DHS does not yet have statutory authority to make the change, but a bill to establish the office (H.R.3875, “The Department of Homeland Security CBRNE Defense Act”) was approved by the House of Representatives in December 2015, and awaits action in the Senate at the time of this writing.4
OVERALL NUMBERS
As seen in Table 1, DHS would receive only a small R&D increase in FY 2017. DHS does play a prominent role in the Administration’s recent Cybersecurity Action Plan, unveiled in February with the budget.5 Among many other things, the strategy proposes an increase in the number of DHS federal cyber defense teams and other cybersecurity personnel, and would establish a National Center for Cybersecurity Resilience jointly with DHS and the Departments of Energy and Defense. The FY 2017 request provides $274.8 million for the Continuous Diagnostics and Mitigation program and $471.1 million for EINSTEIN, the oft-criticized government-wide cybersecurity system.6
Also note that during GAO’s investigation of the department’s R&D enterprise referenced above, investigators had found that some DHS components had incurred obligations for R&D activities without reporting budget authority data to the White House Office of Management and Budget, the office responsible for collecting and tabulating official federal R&D budget figures. There is some indication that this situation is evolving in the FY 2017 request, as multiple, small R&D sums are now turning up in agency reporting for the U.S. Secret Service and other DHS components (contained in the “Other” category in Table 1).
SCIENCE AND TECHNOLOGY DIRECTORATE (S&T)
As seen in Table 1, S&T requests a discretionary spending reduction of $18 million or 2.3 percent below FY 2016 levels, with an equivalent relative decline in R&D funding. Some of this reduction is due to the transfer of select activities from S&T to the new CBRNE Office.

WWW.AAAS.ORG/PROGRAM/RD-BUDGET-AND-POLICY-PROGRAM 64
▲ BACK TO TABLE OF CONTENTS
FY 2017 funding changes in S&T’s major thrust areas can also be seen in Table 1. Within the multidisciplinary Apex thrust, funding would increase from $4 million in FY 2016 to $12.6 million in FY 2017 for the Apex Screening at Speed program, which seeks to increase the rate of passenger processing at aviation checkpoints, and is developing technology to reduce the need for passengers to remove liquids and electronics from carry-ons. The Border Security thrust proposes funding increases across multiple areas, including cargo screenings, land border security, and surveillance technology for tunnels, ports, and coasts. S&T would also make small amounts of new funding available for small vessel detection, arctic communications, and port resilience. The proposed boost for Cybersecurity is unsurprising given the Administration’s action plan; projects slated for funding upticks include the Defense Technology Experimental Research (DETER) Testbed, which provides a virtual platform for cybersecurity experimentation. A new $1 million would also be provided for R&D on securing the Internet of Things, and $4.5 million for Internet modeling and measurement.
In spite of the 25.7 percent funding decrease, CBE Defense would provide new or additional funding for improved bioassays and certain screening technologies. The larger reductions in the Counterterrorist thrust include bioagent detection technology funding, and select technology for secure GPS systems would also transition to critical infrastructure owners and operators. A handful of projects have also reached completion in the Disaster Resilience thrust.
The University Programs account funds the DHS Centers of Excellence program, which in turn funds a network of research institutes based at universities throughout the United States. Of eleven existing centers, four will end their terms before the end of FY 2016, and DHS would compete three new topic areas in FY 2017.
S&T also requests initial operations funding for the National Bio and Agro-defense Facility (NBAF), a new biocontainment level 4 facility to study zoonotic diseases, and a successor to the Plum Island Animal Disease Center on Long Island. NBAF received its full construction funding allotment in FY 2014 and FY 2015
appropriations, and is under construction on a federal site adjacent to Kansas State University (construction and operations funding figures are on separate lines in Table 1). Full NBAF operation is planned for FY 2023. Relatedly, FY 2017 will also mark the start of long-term planning for the eventual closure of the Plum Island site.
CHEMICAL, BIOLOGICAL, RADIOLOGICAL, NUCLEAR, AND EXPLOSIVES OFFICE (CBRNE)
As mentioned above, the new CBRNE Office would incorporate the former Domestic Nuclear Detection Office, the DHS Office of Health Affairs and its BioWatch program, the National Protection and Programs Directorate’s Office for Bombing Prevention, and select components of the S&T Directorate and certain other DHS policy offices.
Major program areas in the new CBRNE budget structure (shown in Table 1) include the Chemical, Biological, and Emerging Infectious Diseases Capability (CBC) and the Rad/Nuc Detection, Forensics and Prevention Capability. CBC includes funding for BioWatch, the National Biosurveillance Integration Center, Medical First Responder Coordination programs, and other biological and chemical terrorism assets and risk assessments. Rad/Nuc is the lead federal program responsible for development and implementation of the Global Nuclear Detection Architecture (GNDA), while radiological and nuclear detection equipment acquisition is funded separately through the Procurement and Construction budget account. The four programs contained in the new Research and Development account are also in support of CBRNE’s rad/nuc and GNDA activities. Transformational R&D continues to fund exploratory and academic research initiatives.
Programmatic funding changes in the above accounts are generally minimal in the FY 2017 request.
COAST GUARD R&D
The U.S. Coast Guard maintains its old appropriations structure, with R&D activities funded through its Research, Development, Test and Evaluation (RDT&E) line item. The Coast Guard would see a small uptick in cybersecurity activities in accord with Administration priorities, along with limited other changes.
1 GAO Report GAO-15-388T: http://www.gao.gov/products/GAO-15-388T 2 GAO Report GAO-14-865T: http://www.gao.gov/products/GAO-14-865T 3 See OMB appendix for DHS: https://www.whitehouse.gov/sites/default/files/omb/budget/fy2017/assets/dhs.pdf 4 Bill text: https://www.congress.gov/bill/114th-congress/house-bill/3875/ 5 See White House fact sheet: https://www.whitehouse.gov/the-press-office/2016/02/09/fact-sheet-cybersecurity-national-action-plan 6 For instance, see recent coverage in The Hill: http://thehill.com/policy/cybersecurity/267749-dhs-head-defends-cyber-defenses-after-critical-watchdog-report

65 GUIDE TO THE PRESIDENT’S BUDGET | RESEARCH & DEVELOPMENT FY 2017
▲ BACK TO TABLE OF CONTENTS
Table 1: Department of Homeland Security R&D(budget authority in millions of dollars)
FY 2015Actual
FY 2016Estimate
FY 2017Budget
Change FY 16-17
Amount Percent
CBRNE Office 1/ 82 78 80 2 2.6%
Science and Technology 818 481 470 -11 -2.3%
Coast Guard 2/ 19 20 20 0 0.0%
Other 3/ 0 0 15 15 --
Total DHS R&D 919 579 585 6 1.0%
FY 2015Actual
FY 2016Estimate
FY 2017Budget
Change FY 16-17
Amount Percent
Discretionary Budget (including non-R&D components)
Coast Guard
RDT&E 18 18 18 18 1.7%
Science & Technology 1,088 777 759 -18 -2.3%
Ops and Support 261 272 279 6 2.3%
Mgmt and Admin 91 92 89 -3 -3.6%
Lab Facilities 120 125 134 9 6.8%
Natl Bio and Agro-def Facil (NBAF) 4/ -- -- 5 -- --
Acq and Ops Analysis 50 55 56 1 1.9%
Procurement and Construction 323 18 10 -8 -43.5%
Natl Bio and Agro-def Facil (NBAF) 4/ 300 2 -- -- --
Research and Development 521 497 470 -27 -5.4%
Res, Dev, and Innov 480 455 437 -18 -4.0%
Apex R&D -- 78 79 1 1.0%
Border Security -- 33 56 23 71.3%
Chem/Bio/Expl -- 79 58 -20 -25.7%
Counterterrorist R&D -- 83 66 -17 -20.5%
Cybersecurity -- 65 71 6 9.0%
Disaster Resilience -- 102 87 -15 -14.7%
University Programs 42 42 33 -9 -20.7%
CBRNE Office 1/ 437 472 501 29 6.1%
Ops and Support 176 172 180 8 4.4%
Chem, Bio, Disease Capability 115 112 118 6 5.4%
Rad/Nuc Detection, Forensics 21 21 21 -1 -3.5%
Procurement and Construction 54 91 104 13 14.3%
Research and Dev 159 157 152 -5 -3.4%
Nuclear Forensics 22 21 21 -0 -1.7%
Transformational R&D 70 68 65 -3 -4.7%
Detection Assessment 45 45 45 -0 -1.1%
Detection Development 22 23 22 -1 -5.6%
Federal Assistance 49 52 66 14 26.1%
Source: OMB R&D data and agency budget justification. All figures rounded to the nearest million. Changes calculated from unrounded figures. Note DHS has established a new appropriations structure for FY 2017.1/ Chemical, Biological, Radiological, Nuclear, and Explosives Office. New office in FY 20172/ Includes contributions from the Oil Spill Liability Trust Fund.3/ Includes small amounts from Secret Service, TSA, and other DHS offices.4/ NBAF construction funding is complete, and operations funding begins to ramp up in FY 2017.
DHS TABLE

WWW.AAAS.ORG/PROGRAM/RD-BUDGET-AND-POLICY-PROGRAM 66
▲ BACK TO TABLE OF CONTENTS
DEPARTMENT OF VETERANS AFFAIRS (VA)
CONTEXT AND RECENT HISTORY
Support for research funding at the VA remains strong on both sides of the aisle even as the department has come under fire in other areas. Last year, the House and Senate matched the President’s request for VA R&D, continuing appropriators’ recent practice of making only minor, if any, adjustments to the VA research budget request. That budget has remained above $1 billion for the past seven years.
VA continues to focus on developing a Learning Health Care System, a new initiative introduced last year which aims to scale up evidence-based decision-making that facilitates improved research outcomes and cost management. To this end, VA began in FY 2016 to support five interlocking research streams: measurement science, operations research, point of care research, studies of provider behavior, and randomized implementation.
VA also carries out the Administration’s National Research Action Plan, which directed the VA and DOD in 2013 to create two joint research consortia for traumatic brain injury and post-traumatic stress disorder (PTSD), at a combined investment of $107 million over five years.1
In FY 2017, VA is reprioritizing its research portfolio towards precision medicine to advance the President’s Precision Medicine Initiative (PMI), which aims to develop approaches to disease treatment and prevention based on the complex variables affecting individual patients, including genetics and behavior. This new emphasis on PMI builds on VA’s Million Veteran Program (MVP), a national research effort which aims to create one of the world’s largest medical databases by collecting health information from one million veteran volunteers.2 The FY 2017 budget includes $50 million to sequence the genome of up to 100,000 MVP veterans to better understand illnesses including PTSD, depression, and substance abuse. Additionally, $15 million would directly fund PMI efforts, specifically to investigate genomically-informed medication selection for improving the treatment of pain and other conditions.
OVERALL NUMBERS
The VA’s direct appropriations request for its Medical and Prosthetics Research account in FY 2017 is $663 million, a $33 million or 5.2 percent increase over the FY 2016 enacted level. With additional funds requested from the VA Medical Care program in support of research, and estimated services and grants from other federal and private sources totaling $1.3 billion, the combined total estimated resources for FY 2017 VA research and development programs would exceed $1.9 billion (see Table 1).
The agency estimates that VA research and development will support 2,234 projects during FY 2017. This is a slight decrease from last year as a result of rebalancing the portfolio to expand the genomics database in support of future research in precision medicine.
MEDICAL AND PROSTHETIC RESEARCH
The VA research account is an intramural program organized into four main divisions: biomedical laboratory science, rehabilitation, health services, and clinical science. Note the figures in Table 1 represent total obligations, rather than budget authority.
Biomedical Laboratory Science: The request would flat fund the Biomedical Laboratory Science program, which conducts preclinical research at the molecular, genomic, and physiological levels to better understand how diseases affect veterans. Biomedical Laboratory R&D supports tissue banking and the development of substantial medical databases through the Million Veteran Program described above.
Rehabilitation: A small 2.1 percent increase is slated for rehabilitation research and development in FY 2017. The Rehabilitation R&D program develops new approaches to treating amputees and those with central nervous system injuries and other physical and cognitive impairments.
Health Services: VA’s Health Services R&D Program would receive a substantial $10 million or 9.0 percent increase for its wide portfolio of activities, ranging from healthcare informatics to mobility to women’s health. The program also funds nineteen Centers of Innovation which include one or more focused areas of research including chronic diseases, rural healthcare, and pain management.
Clinical Science: The FY 2017 budget provides a significant 11.8 percent boost for the VA Clinical Science R&D program to carry out human subject research investigations, ranging from small, single-site studies to large, multisite trials through the Cooperative Studies Program (CSP).
1 See: https://www.whitehouse.gov/sites/default/files/uploads/nrap_for_eo_on_mental_health_august_2013.pdf2 http://www.research.va.gov/mvp/

67 GUIDE TO THE PRESIDENT’S BUDGET | RESEARCH & DEVELOPMENT FY 2017
▲ BACK TO TABLE OF CONTENTS
Table I. Department of Veterans Affairs(budget authority in millions of dollars)
FY 2015Actual
FY 2016Estimate
FY 2017Budget
Change FY 16-17
Amount Percent
Medical and Prosthetic Research 1/
Biomedical Laboratory Science 215 271 271 0 0.0%
Rehabilitation 115 96 98 2 2.1%
Health Services 110 111 121 10 9.0%
Clinical Science 187 153 171 18 11.8%
Reimbursements 33 40 40 0 0.0%
BA Adjustment -71 -40 -38 3 -6.5%
Total Medical and Prosthetic Res 589 631 663 33 5.2%
Research support 2/ 589 589 589 0 0.0%
Total VA R&D 1,178 1,220 1,252 33 2.7%
Fed grants and non-federal resources 3/ 563 685 685 0 0.0%
Total VA-Performed R&D 1,741 1,905 1,937 33 1.7%
Source: OMB R&D data, Budget of the United States Government FY 2017, and agency budget justification. All figures rounded to the nearest million. Changes calculated from unrounded figures.BA adjustment converts obligations to budget authority.1/ Subaccounts reflect obligations. 2/ Includes funding for laboratory facilities, support services, and some investigator salaries from other VA accounts under Medical Services.3/ Funding for VA investigators originating from other agencies (NIH, DOD, etc) and non-government sources (foundations, etc). Agency funds are included in the R&D totals for the sponsoring agencies.
VA TABLE
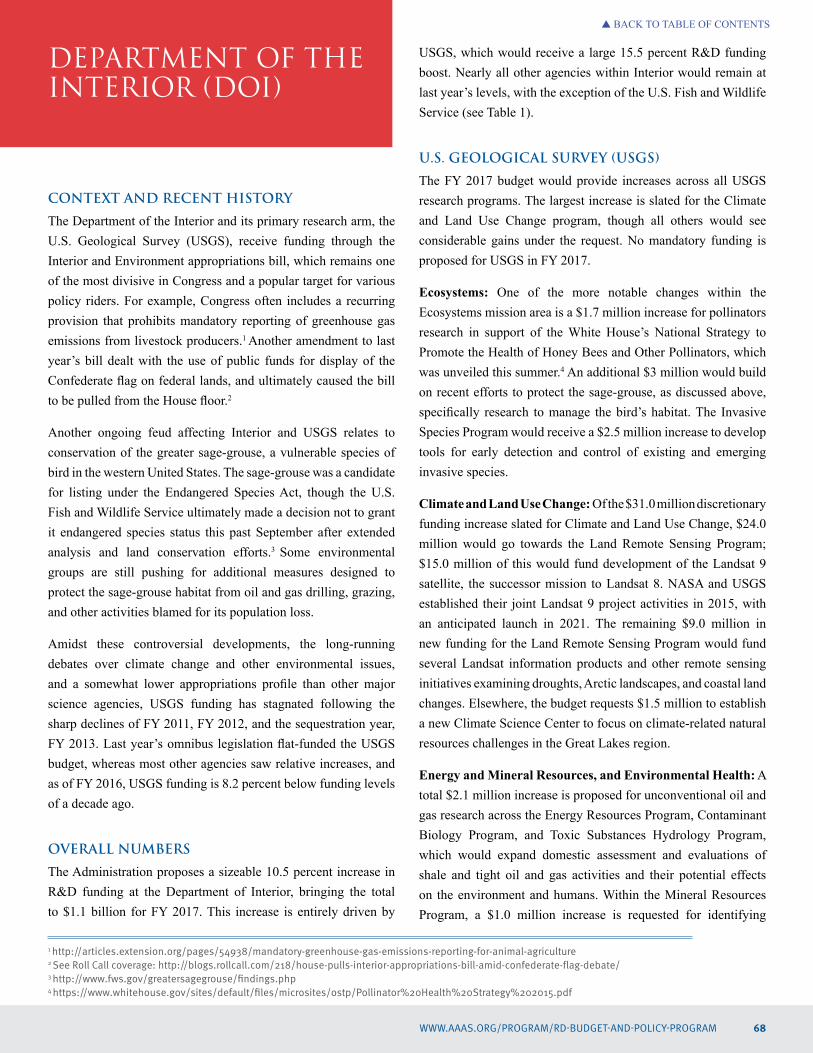
WWW.AAAS.ORG/PROGRAM/RD-BUDGET-AND-POLICY-PROGRAM 68
▲ BACK TO TABLE OF CONTENTS
DEPARTMENT OF THE INTERIOR (DOI)
CONTEXT AND RECENT HISTORY
The Department of the Interior and its primary research arm, the U.S. Geological Survey (USGS), receive funding through the Interior and Environment appropriations bill, which remains one of the most divisive in Congress and a popular target for various policy riders. For example, Congress often includes a recurring provision that prohibits mandatory reporting of greenhouse gas emissions from livestock producers.1 Another amendment to last year’s bill dealt with the use of public funds for display of the Confederate flag on federal lands, and ultimately caused the bill to be pulled from the House floor.2
Another ongoing feud affecting Interior and USGS relates to conservation of the greater sage-grouse, a vulnerable species of bird in the western United States. The sage-grouse was a candidate for listing under the Endangered Species Act, though the U.S. Fish and Wildlife Service ultimately made a decision not to grant it endangered species status this past September after extended analysis and land conservation efforts.3 Some environmental groups are still pushing for additional measures designed to protect the sage-grouse habitat from oil and gas drilling, grazing, and other activities blamed for its population loss.
Amidst these controversial developments, the long-running debates over climate change and other environmental issues, and a somewhat lower appropriations profile than other major science agencies, USGS funding has stagnated following the sharp declines of FY 2011, FY 2012, and the sequestration year, FY 2013. Last year’s omnibus legislation flat-funded the USGS budget, whereas most other agencies saw relative increases, and as of FY 2016, USGS funding is 8.2 percent below funding levels of a decade ago.
OVERALL NUMBERS
The Administration proposes a sizeable 10.5 percent increase in R&D funding at the Department of Interior, bringing the total to $1.1 billion for FY 2017. This increase is entirely driven by
USGS, which would receive a large 15.5 percent R&D funding boost. Nearly all other agencies within Interior would remain at last year’s levels, with the exception of the U.S. Fish and Wildlife Service (see Table 1).
U.S. GEOLOGICAL SURVEY (USGS)
The FY 2017 budget would provide increases across all USGS research programs. The largest increase is slated for the Climate and Land Use Change program, though all others would see considerable gains under the request. No mandatory funding is proposed for USGS in FY 2017.
Ecosystems: One of the more notable changes within the Ecosystems mission area is a $1.7 million increase for pollinators research in support of the White House’s National Strategy to Promote the Health of Honey Bees and Other Pollinators, which was unveiled this summer.4 An additional $3 million would build on recent efforts to protect the sage-grouse, as discussed above, specifically research to manage the bird’s habitat. The Invasive Species Program would receive a $2.5 million increase to develop tools for early detection and control of existing and emerging invasive species.
Climate and Land Use Change: Of the $31.0 million discretionary funding increase slated for Climate and Land Use Change, $24.0 million would go towards the Land Remote Sensing Program; $15.0 million of this would fund development of the Landsat 9 satellite, the successor mission to Landsat 8. NASA and USGS established their joint Landsat 9 project activities in 2015, with an anticipated launch in 2021. The remaining $9.0 million in new funding for the Land Remote Sensing Program would fund several Landsat information products and other remote sensing initiatives examining droughts, Arctic landscapes, and coastal land changes. Elsewhere, the budget requests $1.5 million to establish a new Climate Science Center to focus on climate-related natural resources challenges in the Great Lakes region.
Energy and Mineral Resources, and Environmental Health: A total $2.1 million increase is proposed for unconventional oil and gas research across the Energy Resources Program, Contaminant Biology Program, and Toxic Substances Hydrology Program, which would expand domestic assessment and evaluations of shale and tight oil and gas activities and their potential effects on the environment and humans. Within the Mineral Resources Program, a $1.0 million increase is requested for identifying
1 http://articles.extension.org/pages/54938/mandatory-greenhouse-gas-emissions-reporting-for-animal-agriculture2 See Roll Call coverage: http://blogs.rollcall.com/218/house-pulls-interior-appropriations-bill-amid-confederate-flag-debate/ 3 http://www.fws.gov/greatersagegrouse/findings.php4 https://www.whitehouse.gov/sites/default/files/microsites/ostp/Pollinator%20Health%20Strategy%202015.pdf

69 GUIDE TO THE PRESIDENT’S BUDGET | RESEARCH & DEVELOPMENT FY 2017
▲ BACK TO TABLE OF CONTENTS
5 https://www.whitehouse.gov/sites/default/files/microsites/ostp/final_nationalspaceweatherstrategy_20151028.pdf
and evaluating new sources of critical minerals, offset by a $1.5 million decrease for geophysical and remote sensing activities.
Natural Hazards: The Administration requests $1.7 million in new funding for the Geomagnetism Program to support activities integral to the implantation of the White House’s recently unveiled National Space Weather Strategy.5 A significant $3.5 million boost in FY 2017 would allow the USGS to shift research staff to work in the Arctic and selected Pacific islands to investigate the impacts of sea level rise, severe storms, and melting permafrost on coastal communities and their economies. The Earthquake Hazards Program is also slated for a $1.7 million increase, split between efforts to improve earthquake monitoring in the Central and Eastern United States, and research on the risk of induced earthquakes from unconventional oil and gas production.
Water Resources: A substantial $12.0 million increase in the Water Availability and Use Program would entirely go towards activities associated with WaterSMART, an agency-wide program that aims to improve water conservation and help water regulators across the United States make better decisions about water use. Among the funding proposals included in the request is $4.0 million to assess real-time data on water use during drought periods, $3.0 million to integrate water information among multiple agencies into a national water data framework, and $1.0 million for research into new methods that use remote sensing and spatial datasets in water use estimation.
Core Science Systems: Nearly all of the $6.8 million increase in the FY 2017 budget would be directed to the National Geospatial Program, which produces geospatial data and map products characterizing the nation’s topography, natural landscape, and built environment. The request provides a $1.5 million increase for the mapping of Alaska, where weather conditions greatly impact aircraft navigation. Another $2.4 million increase would accelerate national coverage of lidar surveying technology used to create landscape-scale 3-D maps. Under the WaterSMART program, $1.0 million is requested to create a national hydrography database, which would contain high-resolution coverage of the conterminous 48 States, Hawaii, and Puerto Rico.
Science Support: The FY 2017 budget requests a $5.0 million increase for the Science Support function, which provides administration and management for all USGS science activities. This also includes STEM education and outreach programs to youth in underserved communities, which would see increases under the request.
U.S. FISH AND WILDLIFE SERVICE (FWS)
The principal FWS operation account, Resource Management, is up by $71.1 million or 5.7 percent in the President’s budget. Ecological Services, Habitat Conservation, and Fish and Aquatic Conservation would all receive funding increases in FY 2017. The National Wildlife Refuge System was also given a large $25.2 million or 5.2 percent boost above the FY 2016 level for continued operation and maintenance. The Science Support program totals $20.6 million in the FY 2017 budget, an increase of $3.6 million for habitat conservation strategy development and tools for on-the-ground resource managers.

WWW.AAAS.ORG/PROGRAM/RD-BUDGET-AND-POLICY-PROGRAM 70
▲ BACK TO TABLE OF CONTENTS
Table I. Department of the Interior R&D(budget authority in millions of dollars)
FY 2015Actual
FY 2016Estimate
FY 2017Budget
Change FY 16-17
Amount Percent
R&D Estimates
US Geological Survey (USGS)
Ecosystems 157 158 174 16 10.1%
Climate and Land Use Change 100 102 165 63 62.3%
Energy, Minerals, & Enviro Health 92 95 99 5 5.3%
Natural Hazards 111 113 121 8 7.15
Water Resources 122 123 131 8 6.7%
Core Science Systems 83 86 90 4 5.1%
Science Support 1/ 0 0 0 0 13.3%
US Geological Survey (USGS) 666 676 781 105 15.5%
Bur of Ocean Energy Mgmt 50 70 70 0 0.0%
Bur of Safety and Env Enforce 27 27 27 0 0.0%
National Park Service 27 27 29 2 7.4%
Bureau of Reclamation 13 87 92 5 5.7%
Bureau of Land Management 33 22 22 0 0.0%
U.S. Fish and Wildlife Service 32 50 39 -11 -22.0%
Wildland Fire Mgmt 8 6 6 0 0.0%
Bureau of Indian Affairs 5 5 5 0 0.0%
Ofc of Surf Mining 3 4 5 1 25.0%
Total Interior R&D 864 974 1,076 102 10.5%
Conduct of R&D 828 972 1,074 102 10.5
R&D Facilities 36 2 2 0 0.0%
FY 2015Actual
FY 2016Estimate
FY 2017Budget
Change FY 16-17
Amount Percent
Discretionary Budgets (including non-R&D)
Bureau of Land Management 1,139 1,253 1,259 6 0.5%
Bur of Ocean Energy Mgmt 72 74 80 6 8.0%
Bur of Safety and Env Enforce 93 88 96 8 8.9%
Office of Surface Mining 152 241 158 -83 -34.4%
Bureau of Reclamation 1,123 1,265 1,106 -159 -12.6
US Geological Survey 1,045 1,062 1,169 107 10.1%
Ecosystems 157 160 174 14 8.6%
Climate and Land Use Change 136 140 171 31 22.5%
Energy, Minerals, & Enviro Health 92 95 99 5 5.3%
Natural Hazards 134 139 150 11 7.7%
Water Resources 211 211 228 17 8.2%
Core Science Systems 107 112 118 7 6.1%
Science Support 106 106 111 5 4.7%
Facilities 100 100 117 17 16.8%
US Fish and Wildlife Service 1,457 1,514 1,568 55 3.6%
National Park Service 2,643 2,879 3,131 252 8.8%
Bureau of Indian Affairs 2,601 2,796 2,934 138 4.9%
Source: OMB R&D data, agency budget justification, and agency budget documents. 1/ R&D is less than $500,000. All figures rounded to the nearest million. Changes calculated from unrounded figures.
DOI TABLES

71 GUIDE TO THE PRESIDENT’S BUDGET | RESEARCH & DEVELOPMENT FY 2017
▲ BACK TO TABLE OF CONTENTS
1 See White House fact sheet: https://www.whitehouse.gov/the-press-office/2013/06/25/fact-sheet-president-obama-s-climate-action-plan2 http://www.epa.gov/cleanpowerplan/clean-power-plan-existing-power-plants3 http://www.epa.gov/hfstudy
ENVIRONMENTAL PROTECTION AGENCY (EPA)
CONTEXT AND RECENT HISTORY
Disputes over the Administration’s priorities on climate change and the environment have made EPA a target for spending reductions in Congress. Last year, the House levied a significant 10.0 percent cut to EPA’s total discretionary budget, and reduced the agency’s science and technology research accounts. Ultimately, the final omnibus legislation provided flat funding for EPA and its S&T activities in a year when many other science agencies saw significant budget gains.
The main issue vexing Congress has been EPA’s role in carrying out the President’s Climate Action Plan, a 2013 strategy that directs EPA to establish carbon pollution standards for both new and existing power plants.1 Last summer, EPA finalized its Clean Power Plan, which aims to reduce carbon dioxide emissions by 32 percent from 2005 levels by 2030.2 The plan sets emission standards and guidelines for states to follow, though it does allow states some flexibility to decide how to comply with the standards; EPA intends to work with states to craft and finalize their individual plans. Meanwhile, congressional Republicans have fiercely opposed the new regulations, and the Supreme Court recently put a hold on implementation of the Clean Power Plan until an appeals court rules on whether the plan exceeds EPA’s authority to regulate emissions at the state level.
OVERALL NUMBERS
The Administration is asking for a small 1.6 percent increase in EPA’s discretionary budget for FY 2017, nearly enough to keep pace with inflation. The request also establishes a Climate Infrastructure Fund totaling $300 million in mandatory funding, focused on cleaner vehicle fleets, specifically school bus upgrades. The new account would provide $1.65 billion over ten years as part of the President’s 21st Century Clean Transportation Plan.
SCIENCE AND TECHNOLOGY (S&T)
EPA’s core Science & Technology accounts received varying increases and decreases in the President’s request. Most notably, Clean Air and Climate was given an $11.6 million or 10.1 percent boost above FY 2016 levels, reflecting the Administration’s push for greater investment in this area.
Homeland Security: EPA’s Homeland Security Research Program (HSRP) examines ways to better detect and respond to incidents involving chemical, biological, or radiological agents. HSRP was given a tiny increase for FY 2017, and will continue to emphasize research on response and recovery from attacks involving radiological and nuclear agents as well as biothreat agents such as anthrax.
Human Health Risk Assessment: The Human Health Risk Assessment was given a 4.4 percent funding increase to conduct research on the potential risk to human health from exposure to environmental contaminants, including air pollutants.
Air, Climate, and Energy: The Air, Climate and Energy (ACE) research program was slated for a large 10.1 percent increase, roughly the same rate as proposed last year. ACE promotes three major research objectives: (1) assess impacts of air pollutants and climate change; (2) prevent and reduce emissions of pollutants through data and analytical tools; and (3) prepare for and respond to changes in climate and air quality by modeling and monitoring the environment. In FY 2017, ACE will focus research on the potential impacts of unconventional gas and oil activities on air quality. Significant changes include a $3 million increase for research to study the environmental and resource conservation impacts of clean fuels use. An additional $2 million would in part provide research support to universities developing long-term emissions inventories related to human activities.
Safe and Sustainable Water Resources: EPA’s Safe and Sustainable Water Resources program would see a slight decline in funding, chiefly directed towards drinking water systems research. However, the Administration once again proposes an increase of $2.2 million for studying the potential impacts of hydraulic fracturing on water quality and ecosystems; last year Congress argued that enough funding had already been given for this activity and provided no additional amounts. Last summer, EPA released its Assessment of the Potential Impacts of Hydraulic Fracturing for Oil and Gas on Drinking Water Resources.3

WWW.AAAS.ORG/PROGRAM/RD-BUDGET-AND-POLICY-PROGRAM 72
▲ BACK TO TABLE OF CONTENTS
Sustainable and Healthy Communities: The Sustainable and Healthy Communities program would see a cut of $3.4 million in resources for examining environmental stress on communities and investigating sustainability factors related to aging populations. Another $1.7 million reduction would affect the program’s research associated with materials management and solid waste.
Chemical Safety and Sustainability: Research on chemical safety and sustainability would receive a relatively large increase of 6.3 percent overall, with $5.2 million to evaluate the risk of chemical exposures and ecological impacts.
HISTORICAL CONTEXT
Amidst the debates over administrative actions on climate change and the environment, as previously discussed, EPA has seen its budget drop considerably in the past decade. Between FY 2005 and FY 2016, EPA R&D funding fell by 34.5 percent in inflation-adjusted dollars. A flat R&D budget in FY 2017 coupled with the eroding effects of inflation on purchasing power means this decline would continue.

73 GUIDE TO THE PRESIDENT’S BUDGET | RESEARCH & DEVELOPMENT FY 2017
▲ BACK TO TABLE OF CONTENTS
Table 1. Environmental Protection Agency(budget authority in millions of dollars)
FY 2015Actual
FY 2016Estimate
FY 2017Budget
Change FY 16-17
Amount Percent
Environmental Protection Agency R&D 1/
Science and Technology 501 494 496 2 0.4%
Homeland Security 38 37 37 0 0.2%
Human Health Risk Assessment 39 38 39 2 4.4%
Air, Climate and Energy 84 92 101 9 10.1%
Safe and Sustainable Water 102 107 106 -1 -1.1%
Sustainable Communities 138 140 134 -6 -4.0%
Chemical Safety 91 89 95 6 6.3%
Superfund 19 19 16 -3 -18.0%
Homeland Security 41 36 33 -4 -10.3%
Chemical Safety 3 3 3 -0 -0.7%
Sustainable Communities 15 14 11 -3 -18.3%
Oil Spill Response 1 1 1 -0 -16.7%
Sustainable Communities 1 1 1 -0 -19.6%
Leaking Undergrd Storage Tanks 2/ 0 0 0 0 14.1%
Total EPA R&D 521 513 512 -1 -0.3%
FY 2015Actual
FY 2016Estimate
FY 2017Budget
Change FY 16-17
Amount Percent
EPA Discretionary Budget (includes non-R&D components)
Science and Technology 729 735 754 20 2.7%
Environmental Progs and Mngmt 2,631 2,635 2,853 218 8.3%
Superfund 1,176 1,094 1,129 35 3.2%
State and Tribal Assistance Grants 3,573 3,518 3,280 -238 -6.8%
Clean Water State Fund 1,449 1,394 980 -414 -29.7%
Drinking Water State Fund
907 863 1,021 157 18.2%
Buildings and Facilities 41 42 52 10 23.1%
Leaking Undergrd Storage Tanks 93 92 94 2 2.5%
Oil Spill Response 18 18 25 7 39.5%
Inspector General 43 41 52 10 24.2%
E-Waste Manifest 1 4 7 4 102.3%
Total Discretionary Budget 8,306 8,140 8,267 127 1.6%
New Mandatory Spending 3/ 300
Total (incl. new mandatory) 8,306 8,140 8,567 427 5.2%
Source: OMB R&D data, agency budget justification, and agency budget documents.All figures rounded to the nearest million. Changes calculated from unrounded figures.1/ Research programs may include non-R&D.2/ R&D is less than $500,000.3/ FY 2017 proposal for clean vehicle fleet funding as part of 21st Century Clean Transportation Plan.
EPA TABLE

WWW.AAAS.ORG/PROGRAM/RD-BUDGET-AND-POLICY-PROGRAM 74
▲ BACK TO TABLE OF CONTENTS
INTERAGENCY R&D INITIATIVES
INTRODUCTION
While agency budgets remain the primary unit of analysis for interpreting the President’s budget, most science and technology agencies also participate in interagency initiatives cutting across departments and programs. Initiatives focus on different aspects of science and technology of overlapping relevance to agency missions, and are typically coordinated under the direction of the White House Office of Science and Technology Policy (OSTP) and the National Science and Technology Council (NSTC). Proposed FY 2017 interagency investments align with the Administration’s recently updated Strategy for American Innovation, which highlights nine areas of activity, including advanced manufacturing, precision medicine, BRAIN Initiative, clean energy, and advanced computing.1
There are larger initiatives that precede the current Administration, including the National Nanotechnology Initiative, the Global Change Research Program, and the Networking and Information Technology R&D program. These programs typically publish their own budgets as supplements to the FY 2017 request. However, as of summer 2016, the Global Change program has not yet published its annual supplement, and so will not be included in this review. Brief recaps of proposed budgets and directions for other interagency initiatives are below, and funding tables for each follow.
BRAIN INITIATIVE
The BRAIN Initiative, announced at the start of the Administration’s second term, seeks to develop new technologies to map and understand the workings of the human brain. A second wave of grant awards totaling $85 million was announced2
last October for what NIH envisions as a ten-year project.3
Earlier this year, NSF revealed plans to create a National Brain
Observatory to facilitate large-scale collaborative research efforts in neuroscience, followed by a Dear Colleague Letter seeking proposals on computational infrastructure for enabling large-scale investigations of the brain and nervous system.4
NSF’s Understanding the Brain activity, which draws together and consolidates the agency’s ongoing activities in cognitive science and neuroscience and the BRAIN Initiative, would see an overall reduction in FY 2017, almost entirely within the Directorate for Computer and Information Science and Engineering. The Biological Sciences Directorate would receive a slight increase to fund a new solicitation for Neuro-Tech Hubs in response to the need for a brain observatory, as noted above.
NIH funding for the BRAIN Initiative would remain flat in the agency’s discretionary budget request. However, the Administration grants the program a $45 million increase through new mandatory spending, which requires separate authorizing legislation outside the normal appropriations process to enact. This new mandatory amount would allow NIH to expand BRAIN-related research and projects to a total $195 million in FY 2017.
DARPA plans to invest an estimated $118 million to support the BRAIN Initiative in FY 2017, with most neuroscience funding contained in the Biomedical Technology Program.
DOE also joins the BRAIN Initiative beginning in FY 2017, with a projected contribution of $9 million to develop high-resolution tools to measure and analyze data on the brain and nervous system.
PRECISION MEDICINE INITIATIVE
First announced by the President as part of last year’s budget, the Precision Medicine Initiative (PMI) aims to develop approaches to disease treatment and prevention based on the complex variables affecting individual patients, including genetics and lifestyle. The NIH recently released a guiding framework and is building the infrastructure so that participants can begin enrolling in a national research cohort in 2016, with a goal of enrolling at least one million participants in three to four years. Additionally, the White House Office of Science and Technology issued the Privacy and Trust Principles that will guide activities within PMI.6 The first set of research funding opportunities has also been published.7
1 See: https://www.whitehouse.gov/sites/default/files/strategy_for_american_innovation_october_2015.pdf2 See funding announcement: http://www.ninds.nih.gov/news_and_events/news_articles/NIH-invests-$85-million-for-BRAIN-Initiative-Research.htm3 http://www.braininitiative.nih.gov/2025/index.htm4 See letter: http://www.nsf.gov/pubs/2016/nsf16076/nsf16076.jsp5 https://www.nih.gov/news-events/news-releases/nih-framework-points-way-forward-building-national-large-scale-research-cohort-key-component-presidents-precision-medicine-initiative6 https://www.whitehouse.gov/blog/2015/11/09/releasing-privacy-and-trust-principles-precision-medicine-initiative7 https://www.nih.gov/precision-medicine-initiative-cohort-program/funding-opportunities

75 GUIDE TO THE PRESIDENT’S BUDGET | RESEARCH & DEVELOPMENT FY 2017
▲ BACK TO TABLE OF CONTENTS
The FY 2017 budget expands NIH’s contribution to PMI by $100 million, funded entirely through new mandatory spending. This amount would support a major scale up of the million-person research cohort as noted above, and allow the National Cancer Institute to continue research on cancer genomics. The budget also includes $4 million for FDA and $5 million for the Health and Human Services (HHS) health IT coordinator to pursue standards and technology efforts that support precision medicine and user privacy protections.
ADVANCED MANUFACTURING NETWORK
The Administration continues to support the National Networking for Manufacturing Innovation (NNMI), which seeks to foster collaboration among industry, government, and universities through an envisioned system of up to 45 linked institutes developing new manufacturing technologies and processes. The FY 2017 budget builds on the 13 institutes already funded through 2016 with more than $250 million in additional discretionary funds to support these and 5 new manufacturing innovation institutes at NIST, DOD, and DOE. The budget also includes a mandatory spending proposal of $1.9 billion to build out the remaining 27 institutes in the network by FY 2025.
In the current year, NIST received $25 million in discretionary funding for NNMI. In FY 2017, the Administration recommends nearly doubling that amount to establish two new institutes, as well as to coordinate activities of all institutes in the network. As noted above, the budget also includes a $1.9 billion mandatory spending proposal to fully fund the network of 45 Institutes by FY 2025. Last year the President also proposed nearly $2 billion in mandatory funds for NNMI, but was rejected by appropriators.
Other agencies use their operational budgets to support the NNMI program. DOD has established six public-private manufacturing institutes in collaboration with industry, under coordination of the Office of the Secretary of Defense (OSD) and supported by NSF, NASA, and other agencies. Two additional DOD-led manufacturing innovation institutes would be established through the President’s FY 2017 request. A modest increase is also slated for DOD’s Manufacturing S&T program, which focuses on a range of topics like advanced materials manufacturing, electronics and optics.
At DOE, the proposed FY 2017 budget would fund one new
$14 million Clean Energy Manufacturing Innovation Institute while continuing to support five existing institutes, all part of the President’s NNMI vision.
ANTIMICROBIAL RESISTANCE (AMR)
Last year the Administration released a National Action Plan for Combating Antibiotic-Resistant Bacteria, which outlines steps to address increasing illness related to infection caused by antibiotic-resistant bacteria and to guide R&D related to antimicrobial resistance (AMR).8 Following last year’s appropriation, which nearly doubled the initial FY 2015 amount for the initiative, the President’s FY 2017 budget provides a $94 million increase across federal agencies for AMR activities.
NIH funding would go towards continued development of a national clinical trial network for testing of new antibiotics, as well as a national database of resistant pathogens. An increase for CDC would allow the agency to focus on efforts to detect, respond to, and prevent antibiotic resistant threats in healthcare settings, and expand AMR surveillance across the country. BARDA would support new antimicrobials and vaccine and diagnostic candidates.
At USDA, a large proposed funding boost would address antimicrobial resistance in the animal agricultural industry, while VA would help implement antibiotic stewardship programs in hospitals and other healthcare settings. DOD’s contribution to the AMR initiative also includes monitoring and research to better understanding antimicrobial resistance among military personnel and facilities.
NATIONAL STRATEGIC COMPUTING INITIATIVE (NSCI)
In July 2015, the President issued an Executive Order establishing the National Strategic Computing Initiative (NSCI). Three lead agencies have been identified for NSCI: DOE, NSF, and DOD. Over the next decade their goal is to achieve a hundred-fold increase in sustained performance over today’s computing capabilities, potentially leading to new capabilities across multiple sectors.
The FY 2017 budget is the first time that the Administration has proposed specific funding amounts for NSCI activities. The budget recommends an investment of $285 million for DOE’s contribution
8 See: https://www.whitehouse.gov/sites/default/files/docs/national_action_plan_for_combating_antibotic-resistant_bacteria.pdf9 https://www.whitehouse.gov/sites/default/files/microsites/ostp/PCAST/nitrd_report_aug_2015.pdf10 See: https://www.whitehouse.gov/sites/whitehouse.gov/files/documents/2016_Federal_Cybersecurity_Research_and_Development_Stratgeic_Plan.pdf10

WWW.AAAS.ORG/PROGRAM/RD-BUDGET-AND-POLICY-PROGRAM 76
▲ BACK TO TABLE OF CONTENTS
to NSCI. DOE will carry out its NSCI component through the Exascale Computing Initiative (ECI), which began last fiscal year. ECI is a partnership between the Office of Science and NNSA which aims to accelerate R&D leading to deployment of exascale systems in the mid-2020s.
NSF would devote $33 million to NSCI in FY 2017. The majority of this funding would sit within the Directorate for Computer and Information Science and Engineering (CISE), but a significant share would also come from the Engineering Directorate, and a smaller amount from Geosciences to analyze the large complex data sets generated through modeling and simulations. NSF’s Cyberinfrastructure Framework for 21st Century Science, Engineering, and Education (CIF21) Program, which promotes advanced cyberinfrastructure across all disciplines, has a planned sunset at the end of FY 2017; CIF21 efforts will feed into the Administration’s new NSCI. NSF’s STEM professional workforce development programs will also include a training element of NSCI.
DOD serves as the third lead agency in NSCI, focusing on data analytic computing within the national security context. DOD’s High Performance Computing Modernization Program, first established in 1992, has served as a focal point for research and related work in this area.
NETWORKING AND INFORMATION TECHNOLOGY R&D (NITRD) PROGRAM
Now in its 25th year, NITRD is one of the oldest and largest multi-agency initiatives. The NITRD Program provides a framework for coordinating federal IT research and associated budgets. In August 2015, the President’s Council of Advisors on Science and Technology released the Report to the President and Congress Ensuring Leadership in Federally Funded Research and Development in Information Technology.9 One of the major recommendations of the report is to update Program Component Areas (PCAs), which are the major subject areas under which NITRD activities are grouped, including high end computing R&D, large scale networking, and human computer interaction. All but one of the current eight PCAs were created in 2001. Beginning with the FY 2017 budget cycle, NITRD is transitioning to an updated set of 10 PCAs to include new areas such as robotics and intelligent systems.
NITRD investments are also guided by the Federal Cybersecurity Research and Development Strategic Plan published in February, which outlines priorities for research in federal cybersecurity R&D. NITRD activities in FY 2017 align with the Administration’s National Strategic Computing Initiative (NSCI), described above in further detail.
NITRD funding totals $4.5 billion in the FY 2017 budget request, a 1.1 percent increase from last year’s estimated amount.11 Within NITRD, defense contributions from DOD and DARPA would decrease by a combined $19.5 million or 1.5 percent to total $1.3 billion in FY 2017. The bulk of DOD support for NITRD would fund enabling R&D for high-capability computing systems. Meanwhile, DOE and NNSA would see a combined increase of $50 million or 6.7 percent to total $793 million in FY 2017. A majority of DOE’s funding for NITRD supports supercomputing infrastructure and applications. The Health and Human Services (HHS) portion of the NITRD budget would essentially stay flat at $778 million. NIH would focus NITRD efforts on computational neuroscience, organization and retrieval of health-related information, and visualization and mapping of data for clinical researchers.
NATIONAL NANOTECHNOLOGY INITIATIVE (NNI)
Established in 2001, the National Nanotechnology Initiative (NNI) involves 20 federal departments and agencies working to accelerate nanotechnology research and development that supports national priorities in fields such as energy, manufacturing, healthcare, and environmental protection. In its biennial assessment of the NNI in 2014, the President’s Council of Advisors for Science and Technology (PCAST) suggests that the nanotechnology field has entered its second era, dubbed “NNI 2.0.”12 As part of NNI 2.0, PCAST recommends a greater focus on moving nanotechnology research from fundamental discovery to nanotechnology-based applications, and to transition discoveries from lab to market. Over the past year NNI has explored the establishment of Nanotechnology-Inspired Grand Challenges, with the first – for future computing – announced by OSTP this past October.13
The President’s FY 2017 request for NNI is also guided by the 2014 NNI Strategic Plan14 and 2011 NNI Environmental, Health
11 See full NITRD budget supplement: https://www.nitrd.gov/pubs/2017supplement/FY2017NITRDSupplement.pdf12 https://www.whitehouse.gov/sites/default/files/microsites/ostp/PCAST/pcast_fifth_nni_review_oct2014_final.pdf13 See announcement: http://www.nano.gov/grandchallenges14 http://www.nano.gov/node/1113

77 GUIDE TO THE PRESIDENT’S BUDGET | RESEARCH & DEVELOPMENT FY 2017
▲ BACK TO TABLE OF CONTENTS
and Safety Research Strategy.15 The five federal agencies with the largest NNI investments (representing 95 percent of the total) are NSF, HHS/NIH, DOE, DOD, and DOC/NIST. Foundational research accounts for $600 million or 42 percent of the total NNI budget request for FY 2017.
Total NNI funding would amount to $1.4 billion in FY 2017, an $8.7 million or 0.6 percent increase from the FY 2016 estimated level.16 Both NSF and NIH – the two largest contributors to the program – would see flat funding of $415 million and $382 million, respectively, within the NNI budget. NSF investments would support foundational research in nanotechnology, while NIH would continue integration of nanotechnology-driven R&D into broad areas of biomedical applications now being supported by individual NIH institutes.
DOE’s share of the NNI budget would increase by $31 million or 9.5 percent over last year’s estimated amount to a total $362 million in FY 2017. Much of DOE’s contribution funds basic research carried out by the Office of Science, which also operates five Nanoscale Science Research Centers.
DOD receives a small 1.9 percent cut in the proposed NNI budget to total $131 million in FY 2017; over half is slated for foundational research. NIST’s portion of the NNI budget would increase by 2.9 percent to a total $82 million in FY 2017. NIST’s largest investment in nanotechnology continues to be for major research facilities and instrumentation investments in the Center for Nanoscale Science and Technology user facility, as well as across NIST laboratories.
15 http://www.nano.gov/node/68116 See full NNI budget supplement: http://www.nano.gov/sites/default/files/pub_resource/nni_fy17_budget_supplement.pdf

WWW.AAAS.ORG/PROGRAM/RD-BUDGET-AND-POLICY-PROGRAM 78
▲ BACK TO TABLE OF CONTENTS
BRAIN Initiative and Related Funding(budget authority in millions of dollars)
Program/Account FY 2015Actual
FY 2016Estimate
FY 2017Budget
FY 16 Change
Amount Percent
NSF: Understanding the Brain 109 147 142 -5 -3.6%
Specific to BRAIN Initiative 50 73 74 1 1.0%
Natl Institutes of Health* 85 150 195 45 30.0%
DARPA: Biomedical Technology** 121 160 114 -46 -28.5%
Total DARPA BRAIN Initiative - - - - 118 - - - -
DOE - - - - 9 - - - -
*Increase in FY17 funded entirely through new mandatory spending proposal.** Most, but not all, DARPA neuroscience funding is contained in this element, and not all activities in this element are related to neuroscience. Based on agency budget requests and supplements.
Precision Medicine Initiative (PMI) Funding(budget authority in millions of dollars)
Agency/Department FY 2016 Estimatel
FY 2017Budget
FY 16 Change
Amount Percent
NIH* 100 200 100 100.0%
FDA 2 4 2 100.0%
HHS: Of of Nat’l Coord for Health IT - - 5 - - - -
*Increase in FY17 funded entirely through new mandatory spending proposal.Based on agency budget requests.
INTERAGENCY R&D INITIATIVES
TABLES

79 GUIDE TO THE PRESIDENT’S BUDGET | RESEARCH & DEVELOPMENT FY 2017
▲ BACK TO TABLE OF CONTENTS
Antimicrobial Resistance (AMR) Funding(budget authority in millions of dollars)
Program/Account FY 2015Actual
FY 2016Estimate
FY 2017Budget
FY 16 Change
Amount Percent
Health and Human Services (HHS) 453 835 877 42 5.0%
NIH - - 413 413 0 0.0%
AHRQ - - 10 12 2 20.0%
BARDA - - 192 192 0 0.0%
CDC - - 178 218 40 22.5%
FDA - - 42 42 0 0.0%
U.S. Dept of Agriculture (USDA) 20 26 61 35 134.6%
Veterans Affairs (VA) 72 85 85 0 0.0%
Dept. of Defense (DOD) 59 58 75 17 29.3%
Total AMR 604 1,004 1,098 94 9.4%
Based on agency budget requests and HHS supplements.
INTERAGENCY R&D INITIATIVES
TABLES
National Network for Manufacturing Innovation (NNMI) and Related Funding(budget authority in millions of dollars)
Program/Account FY 2015Actual
FY 2016Estimate
FY 2017Budget
FY 16 Change
Amount Percent
NIST
NNMI* - - 25 47 22 88.0%
DOD 88 157 158 2 1.1%
Manuf Innov Inst 65 136 137 1 0.4%
Manuf S&T Program 23 20 21 1 5.3%
DOE: EERE (Adv Man Facil) 89 99 129 31 31.0%
Manuf Innov Inst 42 70 84 14 20.0%
*Includes coordinating office funding.Some NNMI funding also comes from NASA and NSF.Based on agency budget requests and OSTP supplements.

WWW.AAAS.ORG/PROGRAM/RD-BUDGET-AND-POLICY-PROGRAM 80
▲ BACK TO TABLE OF CONTENTS
Networking and Information Technology R&D (NITRD) Funding(budget authority in millions of dollars)
Program/Account FY 2015Actual
FY 2016Estimate
FY 2017Budget
FY 16 Change
Amount Percent
HHS - NIH, AHRQ 758 776 778 1 0.2%
Natl Science Foundation 1,205 1,196 1,198 2 0.2%
Defense 1,339 1,349 1,329 -20 -1.4%
Energy 666 743 793 50 6.7%
Commerce 169 184 204 20 10.8%
NASA 168 162 157 -5 -3.0%
Homeland Security 64 72 74 2 2.6%
All Other 0 0 0 0 0.0%
Total NITRD 4,368 4,481 4,532 51 1.1%Source: OSTP FY 2017 R&D documents and budget supplements.
National Strategic Computing Initiative (NSCI) and Related Funding(budget authority in millions of dollars)
Program/Account FY 2015Actual
FY 2016Estimate
FY 2017Budget
FY 16 Change
Amount Percent
DOE NSCI - - - - 285 - - - -
DOE - Office of Science
Adv Sci Computing Res (ASCR) 523 621 663 42 6.8%
Math and Comp Sci Res 168 179 151 -28 -15.8%
High Perf Comp and Net 356 442 358 -83 -18.9%
Nat Nuclear Sec Admin (NNSA)
Adv Sim & Computing 598 623 663 40 6.4%
Nat Science Foundation (NSF)
Specific to NSCI - - - - 33 - - - -
Computer and Info Sci and Eng 933 936 938 3 0.3%
Dept. of Defense (DOD)
High Perf Comp Modernization 215 222 177 -45 -20.2%
Based on agency budget requests and supplements.
INTERAGENCY R&D INITIATIVES
TABLES

81 GUIDE TO THE PRESIDENT’S BUDGET | RESEARCH & DEVELOPMENT FY 2017
▲ BACK TO TABLE OF CONTENTS
National Nanotechnology Initiative (NNI) Funding (budget authority in millions of dollars)
FY 2015Actual
FY 2016Estimate
FY 2017Budget
FY 16 Change
Amount Percent
Energy 1/ 313 330 362 31 9.5%
HHS - NIH, NIOSH, FDA 386 405 404 -1 -0.1%
Natl Science Foundation 490 415 415 -0 -0.0%
Defense 143 134 131 -3 -1.9%
Commerce - NIST 84 80 82 2 2.9%
Environ Protection Agency 15 14 15 1 10.1%
NASA 14 11 6 -5 -44.5%
USDA - Forest Serv, NIFA 21 22 21 -1 -2.3%
Homeland Security 28 21 2 -20 -92.9%
All Other 3 4 6 2 57.1%
Total NNI 1,496 1,435 1,444 9 0.6%
1/ Includes the combined budgets of the Office of Science, the Office of Energy Efficiency and Renewable Energy (EERE), the Office of Fossil Energy, and the Advanced Research Projects Agency-Energy (ARPA-E).Baesd on OSTP FY 2017 R&D documents and budget supplements.All figures rounded to the nearest million. Changes calculated from unrounded figures.
INTERAGENCY R&D INITIATIVES
TABLE

WWW.AAAS.ORG/PROGRAM/RD-BUDGET-AND-POLICY-PROGRAM 82
▲ BACK TO TABLE OF CONTENTS
APPENDIX 1 OVERVIEW TABLES
Page left intentionally blank. Tables begin on the following page.

83 GUIDE TO THE PRESIDENT’S BUDGET | RESEARCH & DEVELOPMENT FY 2017
▲ BACK TO TABLE OF CONTENTS
Table A-1. R&D in the FY 2017 Budget by Agency and Character of Work(budget authority in millions of dollars, base budgets only)
FY 2015Actual
FY 2016Estimate
FY 2017Budget
Change FY 16-17
Amount Percent
Total R&D (Conduct of R&D and R&D Facilities)Defense 1/ 66,524 72,237 73,743 1,506 2.1%
S&T (6.1-6.3) 12,024 13,037 12,501 -536 -4.1%
All Other DOD 54,500 59,201 61,242 2,041 3.4%
Health and Human Services 30,177 31,917 30,914 -1,003 -3.1%
National Institutes of Health 28,750 30,618 29,592 -1,026 -3.4%
All Other HHS 1,427 1,299 1,322 23 1.8%
Energy 14,385 14,387 16,634 2,247 15.6%
Atomic Energy Defense 6,197 5,726 7,082 1,356 23.7%
Office of Science 5,099 5,305 5,523 217 4.1%
Energy Programs 3,089 3,356 4,029 673 20.1%
NASA 11,413 13,273 12,170 -1,103 -8.3%
National Science Foundation 5,990 6,117 6,160 44 0.7%
Agriculture 2,454 2,674 2,598 -77 -2.9%
Commerce 1,527 1,904 1,879 -26 -1.3%
NOAA 692 805 810 4 0.6%
NIST 669 773 806 33 4.3%
Transportation 887 924 866 -58 -6.2%
Homeland Security 919 579 585 6 1.0%
Veterans Affairs 1,178 1,220 1,252 32 2.6%
Interior 864 974 1,076 102 10.5%
US Geological Survey 666 676 781 105 15.5%
Environ Protection Agency 521 513 512 -1 -0.3%
Education 279 242 248 6 2.5%
Smithsonian 246 250 270 20 8.0%
Intl Assistance Programs 250 275 287 12 4.4%
Patient-Centered Outcomes Res 396 472 530 58 12.3%
Justice 62 69 65 -4 -5.8%
Nuclear Reg Comm 69 86 90 4 4.7%
State 40 40 40 0 0.0%
Housing and Urban Dev 50 60 98 38 63.3%
Social Security 48 51 58 7 13.7%
Tennessee Valley Authority 12 10 17 7 70.0%
Postal Service 28 19 19 0 0.0%
Corps of Engineers 9 9 11 2 22.2%
Cnsmer Prod Safety Comm 2 2 4 2 100.0%
Total R&D 138,328 148,305 150,126 1,821 1.2%
New Mandatory R&D 4,156Total R&D (incl. new mandatory) 154,282 5,977 4.0%
Defense R&D 1/ 72,721 77,963 80,825 2,862 3.7%
Nondefense R&D 65,607 70,343 69,302 -1,041 -1.5%
New Mandatory R&D 4,156Total Nondefense R&D (w/ new mand.) 73,458 3,115 4.4%
1/ Total includes DOD RDT&E prior-year budget authority adjustments.
(continued)
OVERVIEW TABLES

WWW.AAAS.ORG/PROGRAM/RD-BUDGET-AND-POLICY-PROGRAM 84
▲ BACK TO TABLE OF CONTENTS
Table A-1 (cont’d). R&D in the FY 2017 Budget by Agency and Character of Work (budget authority in millions of dollars, base budgets only)
FY 2015Actual
FY 2016Estimate
FY 2017Budget
Change FY 16-17
Amount Percent
Basic Research
Defense 2,213 2,309 2,102 -207 -9.0%
Health and Human Services 15,014 15,964 15,396 -567 -3.6%
National Institutes of Health 14,938 15,892 15,324 -567 -3.6%
All Other HHS 76 72 72 0 0.0%
Energy 4,477 4,612 4,814 202 4.4%
Atomic Energy Defense 91 60 59 -1 -1.5%
Office of Science 4,334 4,505 4,727 222 4.9%
Energy Programs 52 46 27 -19 -41.3%
NASA 3,210 3,578 3,341 -238 -6.6%
National Science Foundation 4,974 4,941 4,947 6 0.1%
Agriculture 993 1,028 1,032 4 0.4%
Commerce 214 223 239 16 7.1%
NIST 214 223 239 16 7.1%
Homeland Security 41 41 40 -1 -2.4%
Veterans Affairs 484 505 542 37 7.3%
Interior 53 54 63 9 17.1%
US Geological Survey 53 54 63 9 17.1%
Education 7 18 16 -2 -11.1%
Smithsonian 210 218 237 19 8.7%
Justice 17 17 17 0 0.0%
Corps of Engineers 1 1 1 0 0.0%
Intl Assistance Programs 1 1 4 3 300.0%
Total Basic Research 31,909 33,510 32,791 -719 -2.1%
New Mandatory 1,718
Total Basic (incl. new mand.) 34,509 999 3.0%
Defense 2,304 2,369 2,161 -208 -8.8%
Nondefense 29,604 31,141 30,629 -511 -1.6%
(continued)
OVERVIEW TABLES

85 GUIDE TO THE PRESIDENT’S BUDGET | RESEARCH & DEVELOPMENT FY 2017
▲ BACK TO TABLE OF CONTENTS
Table A-1 (cont’d). R&D in the FY 2017 Budget by Agency and Character of Work (budget authority in millions of dollars, base budgets only)
FY 2015Actual
FY 2016Estimate
FY 2017Budget
Change FY 16-17
Amount Percent
Applied Research
Defense 6,896 7,724 6,030 -1,694 -21.9%
Health and Human Services 14,974 15,752 15,285 -467 -3.0%
National Institutes of Health 13,676 14,582 14,100 -482 -3.3%
All Other HHS 1,298 1,170 1,185 15 1.3%
Energy 5,600 5,326 6,895 1,569 29.5%
Atomic Energy Defense 3,892 3,509 4,744 1,235 35.2%
Office of Science 65 0 0 0 - -
Energy Programs 1,644 1,817 2,151 334 18.4%
NASA 2,330 2,439 2,511 72 3.0%
National Science Foundation 696 752 761 9 1.3%
Agriculture 1,114 1,113 1,162 49 4.4%
Commerce 922 979 1,053 74 7.6%
NOAA 470 479 523 44 9.2%
NIST 373 385 409 24 6.3%
Transportation 654 612 557 -55 -8.9%
Homeland Security 207 176 168 -8 -4.5%
Veterans Affairs 618 639 634 -5 -0.8%
Interior 685 784 880 96 12.3%
US Geological Survey 506 512 612 100 19.6%
Environ Protection Agency 441 432 432 -0 -0.0%
Education 159 135 132 -3 -2.2%
Intl Assistance Programs 202 223 211 -12 -5.4%
Patient-Centered Outcomes Res 396 472 530 58 12.3%
Justice 20 20 16 -4 -20.0%
Nuclear Reg Comm 69 86 90 4 4.7%
State 27 27 27 0 0.0%
Housing and Urban Dev 31 40 63 23 57.5%
Social Security 48 51 58 7 13.7%
Tennessee Valley Authority 5 5 6 1 20.0%
Corps of Engineers 5 5 5 0 0.0%
Cons Prod Safety Comm 2 2 4 2 100.0%
Total Applied Research 36,101 37,794 37,511 -283 -0.7%
New Mandatory 1,777
Total Applied (incl. new mand.) 39,288 1,494 4.0%
Defense 10,787 11,234 10,774 -459 -4.1%
Nondefense 25,314 25,561 26,737 176 0.7%
(continued)
OVERVIEW TABLES

WWW.AAAS.ORG/PROGRAM/RD-BUDGET-AND-POLICY-PROGRAM 86
▲ BACK TO TABLE OF CONTENTS
Table A-1 (cont’d). R&D in the FY 2017 Budget by Agency and Character of Work (budget authority in millions of dollars, base budgets only)
FY 2015Actual
FY 2016Estimate
FY 2017Budget
Change FY 16-17
Amount Percent
Total Research (basic + applied)
Defense 9,109 10,033 8,132 -1,902 -19.0%
Health and Human Services 29,987 31,716 30,681 -1,034 -3.3%
National Institutes of Health 28,613 30,474 29,424 -1,049 -3.4%
All Other HHS 1,374 1,242 1,257 15 1.2%
Energy 10,077 9,938 11,709 1,771 17.8%
Atomic Energy Defense 3,982 3,569 4,804 1,234 34.6%
Office of Science 4,399 4,505 4,727 222 4.9%
Energy Programs 1,696 1,864 2,178 315 16.9%
NASA 5,540 6,018 5,852 -166 -2.8%
National Science Foundation 5,670 5,692 5,708 15 0.3%
Agriculture 2,107 2,141 2,194 53 2.5%
Commerce 1,136 1,202 1,292 90 7.5%
NOAA 470 479 523 44 9.2%
NIST 587 608 648 40 6.6%
Transportation 654 612 557 -55 -8.9%
Homeland Security 248 217 208 -9 -4.1%
Veterans Affairs 1,102 1,144 1,176 32 2.8%
Interior 739 838 943 105 12.6%
US Geological Survey 506 512 612 100 19.6%
Environ Protection Agency 441 432 432 -0 -0.0%
Education 166 153 148 -5 -3.3%
Smithsonian 210 218 237 19 8.7%
Intl Assistance Programs 203 224 215 -9 -4.0%
Patient-Centered Outcomes Res 396 472 530 58 12.3%
Justice 37 37 33 -4 -10.8%
Nuclear Reg Comm 69 86 90 4 4.7%
State 27 27 27 0 0.0%
Housing and Urban Dev 31 40 63 23 57.5%
Social Security 48 51 58 7 13.7%
Tennessee Valley Authority 5 5 6 1 20.0%
Corps of Engineers 6 6 6 0 0.0%
Cons Prod Safety Comm 2 2 4 2 100.0%
Total Research 68,010 71,304 70,302 -1,002 -1.4%
New Mandatory 3,495
Total Research (incl. new mand.) 73,797 2,493 3.5%
Defense 13,091 13,603 12,936 -667 -4.9%
Nondefense 54,918 57,701 57,366 -335 -0.6%
(continued)
OVERVIEW TABLES

87 GUIDE TO THE PRESIDENT’S BUDGET | RESEARCH & DEVELOPMENT FY 2017
▲ BACK TO TABLE OF CONTENTS
Table A-1 (cont’d). R&D in the FY 2017 Budget by Agency and Character of Work (budget authority in millions of dollars, base budgets only)
FY 2015Actual
FY 2016Estimate
FY 2017Budget
Change FY 16-17
Amount Percent
Development
Defense 57,515 62,884 65,058 2,174 3.5%
S&T (6.1-6.3) 5,233 5,731 5,584 -148 -2.6%
All Other DOD 52,282 57,153 59,474 2,321 4.1%
Health and Human Services 26 30 30 0 0.0%
National Institutes of Health 0 0 0 0 - -
All Other HHS 26 30 30 0 0.0%
Energy 3,314 3,335 3,794 458 13.7%
Atomic Energy Defense 1,941 1,862 1,987 125 6.7%
Office of Science 0 0 0 0 - -
Energy Programs 1,373 1,473 1,807 334 22.7%
NASA 5,821 7,234 6,281 -953 -13.2%
National Science Foundation 0 0 0 0 - -
Agriculture 177 176 179 3 1.7%
Commerce 163 308 264 -43 -14.0%
NOAA 74 80 89 9 11.2%
NIST 2 16 33 17 103.0%
Transportation 207 277 274 -3 -1.1%
Homeland Security 356 354 377 23 6.5%
Veterans Affairs 76 76 76 0 0.0%
Interior 89 135 131 -3 -2.6%
US Geological Survey 106 111 106 -4 -4.1%
Environ Protection Agency 75 78 78 -1 -0.8%
Education 113 89 100 11 12.4%
Intl Assistance Programs 47 47 51 4 8.5%
Justice 30 30 32 2 6.7%
State 13 13 13 0 0.0%
Housing and Urban Dev 19 19 20 1 5.3%
Postal Service 28 28 19 -9 -32.1%
Tennessee Valley Authority 7 7 5 -2 -28.6%
Corps of Engineers 5 5 5 0 0.0%
Total Development 68,081 75,124 76,787 1,662 2.2%
New Mandatory 644
Total Development (incl. new mand.) 77,431 2,306 3.1%
Defense 59,455 64,747 67,045 2,298 3.5%
Nondefense 8,626 10,378 9,742 -636 -6.1%
(continued)
OVERVIEW TABLES

WWW.AAAS.ORG/PROGRAM/RD-BUDGET-AND-POLICY-PROGRAM 88
▲ BACK TO TABLE OF CONTENTS
Table A-1 (cont’d). R&D in the FY 2017 Budget by Agency and Character of Work (budget authority in millions of dollars, base budgets only)
FY 2015Actual
FY 2016Estimate
FY 2017Budget
Change FY 16-17
Amount Percent
Conduct of R&D (basic + applied research, development)Defense 66,624 72,918 73,190 272 0.4%
S&T (6.1-6.3 + medical) 12,024 13,037 12,501 -536 -4.1%
All Other DOD 54,600 59,881 60,689 808 1.3%
Health and Human Services 30,013 31,746 30,711 -1,034 -3.3%
National Institutes of Health 28,880 30,490 29,441 -1,049 -3.4%
All Other HHS 1,400 1,272 1,287 15 1.2%
Energy 13,391 13,274 15,503 2,229 16.8%
Atomic Energy Defense 5,923 5,432 6,791 1,359 25.0%
Office of Science 4,399 4,505 4,727 222 4.9%
Energy Programs 3,069 3,337 3,985 648 19.4%
NASA 11,361 13,251 12,133 -1,118 -8.4%
National Science Foundation 5,670 5,692 5,708 15 0.3%
Agriculture 2,284 2,317 2,373 56 2.4%
Commerce 1,299 1,509 1,556 47 3.1%
NOAA 544 559 612 53 9.5%
NIST 589 624 681 57 9.1%
Transportation 861 889 831 -58 -6.5%
Homeland Security 604 571 585 14 2.5%
Veterans Affairs 1,178 1,220 1,252 32 2.6%
Interior 828 972 1,074 102 10.5%
US Geological Survey 666 676 781 105 15.5%
Environ Protection Agency 516 510 510 -1 -0.2%
Education 279 242 248 6 2.5%
Smithsonian 210 210 218 8 3.8%
Intl Assistance Programs 250 250 275 25 10.0%
Patient-Centered Outcomes Res 396 396 472 76 19.2%
Justice 67 67 69 2 3.0%
Nuclear Reg Comm 69 69 86 17 24.6%
State 40 40 40 0 0.0%
Housing and Urban Dev 50 50 60 10 20.0%
Social Security 48 48 51 3 6.3%
Tennessee Valley Authority 12 12 10 -2 -16.7%
Postal Service 28 28 19 -9 -32.1%
Corps of Engineers 11 11 11 0 0.0%
Labor 0 0 0 0 - -
Cons Prod Safety Comm 2 2 2 0 0.0%
Treasury 0 0 0 0 - -
Total Conduct of R&D 136,091 146,295 146,987 693 0.5%
New Mandatory 4,139Total Development (incl. new mand.) 151,126 4,832 3.3%
Defense 72,547 78,349 79,980 1,631 2.1%
Nondefense 63,544 67,945 67,007 -938 -1.4%
(continued)
OVERVIEW TABLES

89 GUIDE TO THE PRESIDENT’S BUDGET | RESEARCH & DEVELOPMENT FY 2017
▲ BACK TO TABLE OF CONTENTS
Table A-1 (cont’d). R&D in the FY 2017 Budget by Agency and Character of Work (budget authority in millions of dollars, base budgets only)
FY 2015Actual
FY 2016Estimate
FY 2017Budget
Change FY 16-17
Amount Percent
R&D Facilities and Capital Equipment
Defense 116 13 191 178 1,369.2%
Health and Human Services 164 172 203 31 18.0%
National Institutes of Health 137 145 168 23 15.9%
All Other HHS 27 27 35 8 29.6%
Energy 993 1,113 1,131 17 1.6%
Atomic Energy Defense 274 294 291 -3 -0.9%
Office of Science 700 800 795 -5 -0.6%
Energy Programs 19 19 44 25 128.5%
NASA 52 22 37 16 71.1%
National Science Foundation 320 424 452 28 6.6%
Agriculture 170 357 225 -133 -37.1%
Commerce 228 395 322 -72 -18.3%
NOAA 148 246 198 -48 -19.7%
NIST 80 149 125 -24 -16.2%
Transportation 25 35 35 -0 -0.1%
Homeland Security 315 8 0 -8
Veterans Affairs 0 0 0 0 - -
Interior 36 2 2 0 0.0%
US Geological Survey 0 0 0 0 - -
Environ Protection Agency 5 3 3 -1 -16.7%
Smithsonian 36 36 32 -4 -11.1%
Total R&D Facilities 2,460 2,580 2,633 52 2.0%
New Mandatory 18
Total Development (incl. new mand.) 2,651 70 2.7%
Defense 390 307 482 175 57.2%
Nondefense 2,070 2,274 2,151 -123 -5.4%
Source: OMB R&D data, agency budget justifications, and other agency budget documents and data.Excludes R&D funded through new mandatory proposals in FY 2017.Note: The projected GDP inflation rate between FY 2016 and FY 2017 is 1.8 percent.All figures are rounded to the nearest million. Changes calculated from unrounded figures.
OVERVIEW TABLES

WWW.AAAS.ORG/PROGRAM/RD-BUDGET-AND-POLICY-PROGRAM 90
▲ BACK TO TABLE OF CONTENTSOVERVIEW TABLES
Table A-2. Distribution of the FY 2017 Budget (outlays in billions of dollars)
FY 2015Actual
FY 2016Estimate
FY 2017Budget
Change FY 16-17
Amount Percent
Discretionary
Defense 583 595 608 12 2.0%
Nondefense 585 628 625 -3 -0.4%
Total Discretionary 1,169 1,223 1,233 10 0.8%
Entitlements and Mandatory
Social Security /1 882 924 967 43 4.7%
Medicare /1 540 589 598 9 1.6%
Medicaid 350 367 386 18 5.0%
Other Mandatory 641 708 764 56 8.0%
Total Mandatory 2,412 2,588 2,715 127 4.9%
Net Interest 223 240 303 63 26.1%
Undistrib Offsetting Receipts -116 -101 -109 -7 7.2%
Future Disaster Costs 0 2 6 4 193.3%
Total Budget (Outlays) 3,688 3,951 4,147 196 5.0%
Total Receipts 3,250 3,336 3,644 308 9.2%
Unified Surplus or Deficit -439 -616 -503 112 -18.3%
On-budget deficit -466 -624 -502 122 -19.6%
Off-budget surplus/deficit 27 8 -2 -10 -121.5%
Gross Domestic Product (GDP) 17,803 18,472 19,303 831 4.5%
Federal Budget as Percent of GDP 20.7% 21.4% 21.5%Source: Budget of the U.S. Government FY 2017.All figures rounded to the nearest billion. Changes calculated from unrounded figures.Note: The projected GDP inflation rate between FY 2016 and FY 2017 is 1.8%/1 Excludes administrative costs for these programs, which are classified as discretionary.

91 GUIDE TO THE PRESIDENT’S BUDGET | RESEARCH & DEVELOPMENT FY 2017
▲ BACK TO TABLE OF CONTENTSOVERVIEW TABLES
Table A-3. Historical Trends in R&D and Federal Outlays (outlays in billions of dollars)
FY 1970Actual
FY 1980Actual
FY 1990Actual
FY 2000Actual
FY 2010Actual
FY 2017Budget
Composition of Federal Outlays
Mandatory Programs /1 61 262 568 951 1,913 2,607
Net Interest 14 53 184 223 196 303
Defense Discretionary 82 135 300 295 689 608
Nondefense Discretionary 38 142 200 320 658 625
Total Federal Outlays 196 591 1,253 1,789 3,456 4,142
Federal R&D Outlays
Defense 8 15 41 41 81 79
Nondefense 7 16 23 33 60 68
Total Federal R&D Outlays 15 31 64 74 141 147
Composition of Federal Outlays
Mandatory Programs /1 31.2% 44.4% 45.3% 53.2% 55.3% 62.9%
Net Interest 7.4% 8.9% 14.7% 12.5% 5.7% 7.3%
Defense Discretionary 41.9% 22.8% 24.0% 16.5% 19.9% 14.7%
Nondefense Discretionary 19.6% 24.0% 16.0% 17.9% 19.0% 15.1%
Total Federal Outlays 100.0% 100.0% 100.0% 100.0% 100.0% 100.0%
Federal R&D Outlays as Percent of Discretionary Outlays /2
Defense 9.8% 10.9% 13.7% 13.9% 11.8% 13.0%
Nondefense 19.1% 11.2% 11.5% 10.4% 9.1% 10.8%
Total R&D as % of Discret 12.7% 11.0% 12.8% 12.1% 10.5% 11.9%
Federal R&D Outlays as Percent of GDP
Defense R&D 0.8% 0.5% 0.7% 0.4% 0.5% 0.41%
Nondefense R&D /3 0.7% 0.6% 0.4% 0.3% 0.4% 0.35%
Total R&D as % of GDP 1.5% 1.1% 1.1% 0.7% 1.0% 0.76%Source: Budget of the U.S. Government FY 2017.All figures rounded to the nearest billion. Changes calculated from unrounded figures./1 Net of offsetting receipts./2 R&D as a percent of its respective category (e.g., defense R&D as a percentage of defense discretionary).Note that small amounts of R&D funding are mandatory, and this amount would increase in FY 2017 per the President’s request. All R&D is treated as discretionary for these estimates./3 Includes international and domestic R&D programs.

WWW.AAAS.ORG/PROGRAM/RD-BUDGET-AND-POLICY-PROGRAM 92
▲ BACK TO TABLE OF CONTENTSOVERVIEW TABLES
Table A-4. Major Functional Categories of R&D (budget authority in millions of dollars, base budgets only)
FY 2015Actual
FY 2016Estimate
FY 2017Budget
Change FY 16-17 % of Total (‘16)Amount Percent
Defense (050) 1/ 72,721 77,963 80,825 2,862 3.7% 53.8%
Nondefense 65,607 70,343 69,297 -1,045 -1.5% 46.2%
Space (252) 10,897 12,773 11,645 -1,128 -8.8% 7.8%
Health (550) 31,717 33,571 32,680 -891 -2.7% 21.8%
Energy (270) 3,170 3,452 4,136 684 19.8% 2.8%
General Science (251) 11,088 11,422 11,683 261 2.3% 7.9%
Environment (300) 2,389 2,619 2,703 84 3.2% 1.8%
Agriculture (350) 2,152 2,359 2,306 -54 -2.3% 1.6%
Transportation (400) 1,420 1,442 1,414 -28 -1.9% 1.0%
Commerce (370) 863 1,118 1,088 -30 -2.7% 0.7%
International (150) 290 315 327 12 3.8% 0.2%
Justice (750) 962 628 625 -3 -0.5% 0.4%
All Other 659 643 694 51 7.9% 0.5%
Total R&D 138,328 148,305 150,126 1,816 1.2% 100.0%
Source: OMB R&D data, agency budget justifications, and other agency documents and data.Classifications generally follow the government’s budget function categories except Health (which here includes health R&D in VA) and other certain minor accounts.Numbers in parentheses are the federal government budget function codes.All figures rounded to the nearest million. Changes calculated from unrounded figures.1/ Includes Dept of Defense and defense programs in DOE.

93 GUIDE TO THE PRESIDENT’S BUDGET | RESEARCH & DEVELOPMENT FY 2017
▲ BACK TO TABLE OF CONTENTS
Table A-5. Defense and Nondefense R&D by Character of Work (budget authority in millions of dollars, base budget only)
FY 2015Actual
FY 2016Estimate
FY 2017Budget
% Change FY 16-17
% Dist of FY ‘17
Basic Research
Defense 2,304 2,369 2,161 -8.8% 1.4%
Nondefense 29,604 31,141 30,629 -1.6% 20.4%
Total Basic 31,909 33,510 32,791 -2.1% 21.8%
Applied Research
Defense 10,787 11,234 10,774 -4.1% 7.2%
Nondefense 25,314 26,561 26,737 0.7% 17.8%
Total Applied 36,101 37,794 37,511 -0.7% 25.0%
Development
Defense 59,455 64,747 67,045 3.5% 44.7%
Nondefense 8,626 10,374 9,779 -5.7% 6.5%
Total Development 68,081 75,120 76,824 2.3% 51.2%
Total Conduct of R&D (basic and applied research + development)
Defense 72,547 78,349 79,980 2.1% 53.3%
Nondefense 63,544 68,075 67,146 -1.4% 44.7%
Total Conduct 136,091 146,425 147,126 0.5% 98.0%
R&D Facilities and Capital Equipment
Defense 390 307 482 57.2% 0.3%
Nondefense 2,063 2,268 2,152 -5.1% 1.4%
Total R&D Facilities 2,453 2,574 2,634 2.3% 1.8%
Total R&D
Defense 72,721 77,197 80,298 3.7% 53.8%
Nondefense 65,607 70,343 150,126 -1.5% 46.0%
Total R&D 138,328 148,305 150,126 1.2% 100.0%
Source: OMB R&D data, agency budget justification, and agency budget documents. All figures rounded to the nearest million. Changes calculated from unrounded figures.Defense includes Dept. of Defense and defense programs in DOE.
OVERVIEW TABLES

WWW.AAAS.ORG/PROGRAM/RD-BUDGET-AND-POLICY-PROGRAM 94
▲ BACK TO TABLE OF CONTENTS
Table A-6. R&D and Related Homeland Security Spending by Agency (budget authority in millions of dollars)
FY 2015Actual
FY 2016Estimate
FY 2017Budget
Change FY 16-17
Amount Percent
Agriculture 125 195 95 -100 -51.4%
Commerce 203 220 211 -9 -4.0%
Defense 2,254 2,833 2,576 -257 -9.1%
Energy 93 103 103 0 0.0%
Homeland Security 919 579 585 6 1.0%
Environ Protection Agency 37 37 37 0 0.3%
Health and Human Services 1,812 1,925 1,925 0 0.0%
National Institutes of Health 1,812 1,925 1,925 0 0.0%
Natl Aero and Space Admin 16 16 17 0 1.8%
National Science Foundation 383 386 384 -2 -0.5%
All Other 32 37 31 -6 -16.3%
Total Estimate 5,874 6,330 5,963 -368 -5.8%
(Total HS Spending) 71,760 71,679 70,468 -1,211 -1.7%
Source: Budget of the U.S. Government FY 2017.All figures rounded to the nearest billion. Changes calculated from unrounded figures.
OVERVIEW TABLES
Table A-7. R&D Funding by Congressional Appropriations Subcommittee (budget authority in millions of dollars, base budget only)
FY 2015Actual
FY 2016Estimate
FY 2017Budget
Change FY 16-17
Amount Percent
Defense 66,408 72,224 73,552 1,328 1.8%
Labor, HHS, Education 30,421 32,203 31,263 -940 -2.9%
Commerce, Justice, Science 18,992 21,363 20,274 -1,089 -5.1%
Energy & Water 14,488 14,579 16,844 2,265 15.5%
Agriculture 2,558 2,765 2,720 -46 -1.7%
Interior and Environment 1,993 2,039 2,131 93 4.5%
Military Construction, VA 1,294 1,233 1,443 210 17.0%
Transportation, HUD 965 1,003 983 -20 -2.0%
Homeland Security 919 579 585 6 1.0%
State & Foreign Operations 290 315 327 12 3.8%
Financial Services 2 2 4 2 100.0%
Total R&D 138,328 148,305 150,126 1,821 1.2%
Source: OMB R&D data, agency budget justifications, and agency budget documents.

95 GUIDE TO THE PRESIDENT’S BUDGET | RESEARCH & DEVELOPMENT FY 2017
▲ BACK TO TABLE OF CONTENTS
Table A-8. Federal R&D by Agency, FY 2007-2017 (budget authority in millions of dollars)
2007 2008 2009 2010 2011 2012 2013 2014 2015 2016* 2017* ‘07-’17 ‘12-’17
DOD 79,009 81,166 81,484 82,902 79,112 74,460 65,540 66,505 66,524 72,237 73,743 -6.7% -1.0%
NASA 11,582 11,183 8,788 9,262 9,099 11,315 10,999 11,754 11,413 13,273 12,170 5.1% 7.6%
DOE 9,035 9,769 10,301 10,836 10,673 10,811 10,705 11,994 14,385 14,387 16,634 84.1% 53.9%
OS 3,560 3,807 4,372 4,528 4,461 4,463 4,291 4,724 5,099 5,305 5,523 55.1% 23.7%
HHS 29,621 29,250 31,058 31,758 31,183 31,375 29,802 30,669 30,177 31,917 30,914 4.4% -1.5%
NIH 28,350 28,532 29,752 30,189 29,831 30,010 28,341 29,251 28,750 30,618 29,592 4.4% -1.4%
NSF 4,440 4,506 4,767 5,392 5,494 5,705 5,329 5,800 5,990 6,117 6,160 38.7% 8.0%
USDA 2,275 2,332 2,437 2,611 2,365 2,331 2,116 2,380 2,454 2,674 2,598 14.2% 11.4%
Interior 647 683 702 776 757 820 785 840 864 974 1,076 66.4% 31.2%
DOT 767 875 925 1,073 954 919 818 797 887 924 866 13.0% -5.8%
EPA 557 548 563 597 582 568 530 538 521 513 512 -8.0% -9.9%
Commerce 1,073 1,188 1,389 1,337 1,217 1,254 1,297 1,552 1,527 1,904 1,879 75.1% 49.8%
NIST 487 518 553 588 532 557 596 655 669 773 806 65.6% 44.7%
DHS 996 995 1,096 887 760 481 684 1,032 919 579 585 -41.3% 21.6%
VA 819 886 943 1,034 1,160 1,160 1,164 1,101 1,178 1,220 1,252 52.8% 7.9%
All Other 1,113 1,066 1,153 1,131 1,012 1,322 1,714 1,604 1,491 1,585 1,737 56.1% 31.4%
Total R&D 141,933 144,448 145,605 149,595 144,368 142,522 131,483 136,565 138,328 148,305 150,126 5.8% 5.3%
Defense R&D 82,658 85,129 85,309 86,756 83,193 78,717 69,766 71,469 72,721 77,963 80,825 -2.2% 2.7%
Nondef. R&D 59,276 59,318 60,297 62,840 61,176 63,805 61,716 65,096 65,607 70,343 69,302 16.9% 8.6%
Basic Res. 28,166 28,740 28,161 29,317 29,801 31,806 30,202 32,086 31,909 33,510 32,791 16.4% 3.1%
OVERVIEW TABLES

WWW.AAAS.ORG/PROGRAM/RD-BUDGET-AND-POLICY-PROGRAM 96
▲ BACK TO TABLE OF CONTENTS
Table A-8 (continued). Historical Tables: Federal R&D by Agency, FY 2007-2017 (budget authority in millions of constant FY 2016 dollars)
2007 2008 2009 2010 2011 2012 2013 2014 2015 2016* 2017* ‘07-’17 ‘12-’17
DOD 91,084 91,668 90,968 91,744 85,806 79,313 68,632 68,473 67,577 72,237 72,445 -20.5% -8.7%
NASA 13,352 12,630 9,811 10,250 9,869 12,052 11,518 12,101 11,594 13,273 11,956 -10.5% -0.8%
DOE 10,416 11,033 11,500 11,992 11,576 11,516 11,210 12,349 14,612 14,387 16,341 56.9% 41.9%
OS 4,104 4,300 4,881 5,011 4,838 4,754 4,494 4,864 5,179 5,305 5,425 32.2% 14.1%
HHS 34,148 33,034 34,674 35,145 33,822 33,420 31,208 31,577 30,655 31,917 30,370 -11.1% -9.1%
NIH 32,683 32,224 33,216 33,409 32,355 31,966 29,678 30,117 29,205 30,618 29,071 -11.0% -9.1%
NSF 5,119 5,089 5,322 5,967 5,959 6,077 5,580 5,972 6,085 6,117 6,052 18.2% -0.4%
USDA 2,623 2,634 2,721 2,889 2,565 2,483 2,216 2,450 2,493 2,674 2,552 -2.7% 2.8%
Interior 746 772 783 859 821 873 822 865 878 974 1,057 41.8% 21.0%
DOT 884 988 1,033 1,188 1,035 979 857 821 901 924 851 -3.7% -13.1%
EPA 642 618 628 660 631 605 555 554 529 513 503 -21.6% -16.9%
Commerce 1,237 1,341 1,550 1,479 1,320 1,336 1,358 1,598 1,551 1,904 1,846 49.2% 38.2%
NIST 561 585 617 650 577 593 624 674 679 773 792 41.1% 33.4%
DHS 1,149 1,124 1,224 982 825 512 716 1,063 934 579 575 -50.0% 12.2%
VA 945 1,001 1,053 1,144 1,258 1,236 1,219 1,134 1,197 1,220 1,230 30.2% -0.5%
All Other 1,283 1,204 1,287 1,252 1,098 1,408 1,795 1,651 1,515 1,585 1,706 33.0% 21.2%
Total R&D 163,625 163,138 162,554 165,551 156,585 151,810 137,686 140,608 140,518 148,305 147,484 -9.9% -2.8%
Defense R&D 95,290 96,144 95,239 96,009 90,233 83,847 73,058 73,585 73,872 77,963 79,402 -16.7% -5.3%
Nondef. R&D 68,335 66,994 67,315 69,542 66,352 67,963 64,628 67,023 66,646 70,343 68,082 -0.4% 0.2%
Basic Res. 32,470 32,458 31,439 32,444 32,322 33,878 31,627 33,036 32,414 33,510 32,214 -0.8% -4.9%
Source: Historical AAAS data based on OMB and agency R&D budget data.Constant dollar conversions based on OMB’s GDP deflators from the FY 2017 budget.
OVERVIEW TABLES
97 GUIDE TO THE PRESIDENT’S BUDGET | RESEARCH & DEVELOPMENT FY 2017
▲ BACK TO TABLE OF CONTENTS
APPENDIX 2 THE FEDERAL BUDGET PROCESS
The annual federal budgeting cycle is a long, complicated process that can seem opaque to outsiders. This appendix is intended to help shed some light on that process.
It’s useful to think of the federal budget cycle in four phases. The first phase is agency planning; the second phase covers budget review by the Office of Management and Budget. These two phases together amount to the President’s budget formulation. A third phase is the Congressional appropriations cycle; and the fourth and final phase is the execution of the budget by the agencies starting October 1, the beginning of the fiscal year. Altogether, it takes the machinery of government well over two years to formulate, appropriate, and execute a single fiscal year’s budget. That means three budgets are in play at any given time. For instance, at the time of this writing, agencies are executing their FY 2014 budgets; Congress is grappling with FY 2015 appropriations; and federal agencies are already planning for FY 2016.
THE PRESIDENT’S BUDGET FORMULATION
The most public portion of the cycle is the Congressional process, typically beginning in the spring before the fiscal year starts. However, the process actually begins a year before then – and a full 18 months or more before the start of the fiscal year in question – when federal agencies begin their internal budget planning. This means that, for instance, in spring 2010, agencies were already beginning to plan for the FY 2012 budget, which didn’t take effect until October 1, 2011.
The agency budget process is an information-intensive mix of bottom-up formulation and top-down guidance. Beginning in the spring, individual offices or units take the lead, with departmental oversight, in developing their strategic plans, identifying their key priorities and goals, and producing estimates of the staff and resources necessary for achieving those goals. Offices receive guidance and directives on policy and funding priorities from agency leadership, which may be communicated through spring budget retreats or other channels. As a part of the process, agency personnel draw on information or recommendations provided throughout the year by advisory boards, National Academies, panels, or other external stakeholders. Ultimately, expert
technical judgment by agency heads and staff is central in budget formulation and assessment. Agencies may also have to respond to Congressional guidance, legislative changes, and mandates in previous appropriations bills and reports.
The Executive Office of the President also performs an important oversight role. Agencies and offices receive their primary guidance from the Office of Management and Budget (OMB), which orchestrates the budget formulation process, serves as an information resource, and carries out the President’s policy preferences. This guidance is delivered via meetings, memoranda, or more informal interpersonal contacts, and can include directives on general priorities, principles, strategies, or targets for increases and cuts. Science programs also receive budget guidance from the Office of Science and Technology Policy (OSTP), formally through a joint OMB/OSTP guidance memo typically released in the summer. This memo identifies key areas for investment, such as climate research, biotechnology, or advanced manufacturing, for instance.
Eventually, agency requests are completed and submitted to OMB for a stringent, thorough review in early fall. OMB reviews the requests, decides what the Administration will and will not support, and notifies agencies of these decisions through what are called “passbacks,” usually issued around Thanksgiving. The agencies can then either accept OMB’s decisions or, more often, appeal. OMB and the agencies must hash out their differences by January, in time for the President’s budget submission to Congress.
The Budget and Accounting Act of 1921 sets the requirement for a Presidential budget. Current law requires submission by the first Monday in February, though the budget can be delayed. For instance, the Obama Administration delayed the FY 2012 and FY 2013 requests by one week each; the FY 2014 and FY 2015 requests were issued much later. The budget is also typically delayed during presidential transition years by two months or more.
THE CONGRESSIONAL PROCESS
The President’s job is to issue the budget request, but only Congress can actually grant funding, known as appropriations. Fiscally speaking, the President starts the conversation, but Congress finishes it; or, in the old line, “The President proposes, the Congress disposes.” Congress does this by passing the 12 appropriations bills necessary to fund the government each year. This process gets underway when the President delivers his or her budget in February. In addition, Congress receives reports on the

WWW.AAAS.ORG/PROGRAM/RD-BUDGET-AND-POLICY-PROGRAM 98
▲ BACK TO TABLE OF CONTENTS
long-term fiscal and economic outlook from the Congressional Budget Office. These documents identify long-term trends in economic growth, spending, and deficits.
With these materials in hand, the Congressional budget process commences. The first item of business for Congress is passage of the annual budget resolution. The budget resolution, which is developed by the House and Senate Budget Committees, sets an overall framework for funding decisions. It is not signed by the President, and thus is not law, but still serves to bind Congressional appropriations decisions later.
The two Budget Committees, working separately, establish top-line numbers for revenues, mandatory or direct spending, and discretionary spending, with input from other legislators, committee chairs, and party leadership. The discretionary spending target is particularly important for federal R&D, as the federal R&D budget doesn’t tend to fluctuate much as a share of the federal discretionary budget.
The resolution must pass both the House and Senate floor by a simple majority, and any differences between the two versions are worked out by conference committee, a joint committee composed of members of both chambers. This work is to be completed by April 15, but the resolution is often delayed. Indeed, in many years the House and Senate cannot agree on overall figures, and fail to pass a concurrent budget resolution. When this occurs, each chamber can adopt its own framework in the form of a “deeming resolution,” meaning that each chamber can operate under its own spending target, which can create major problems when it’s time to resolve the differences.
Once these targets are established, the scene shifts to the Appropriations Committees. The Appropriations Committee in each chamber takes the discretionary spending target and divides it among the appropriations subcommittees, through what are called 302(b) allocations after the relevant section of the Congressional Budget Act. Each subcommittee is responsible for producing one spending bill; there are 12 appropriations subcommittees, one for each bill, and each committee gets its own allocation. This allocation limits the size of the spending bill produced by each subcommittee, and they can be very different: the Defense appropriations subcommittees might have $500 billion to work with, while the Interior & Environment subcommittees have less than a tenth of that.
Science agencies are scattered throughout these 12 bills, and often must compete with non-science agencies for funding. For
instance, the NIH budget is part of the Labor, Health and Human Services, and Education appropriations bill, and thus competes directly with the Labor and Education departments for funding from the same pool.
Appropriations subcommittees begin to hold hearings on the President’s budget request as early as February, mere weeks after the request has been issued. Usually in April, the subcommittees – traditionally starting with the House first – begin marking up and amending their respective bills. Each of the 12 bills must be passed by its subcommittee before being considered by the full Appropriations Committee. It is during the subcommittee and committee phase that earmarks were usually attached, though Congressional leaders declared a moratorium on them beginning in FY 2011. While earmarks are in reality a very small portion of overall spending, their number grew in the decades leading up to the moratorium, and their relative merits continue to be debated in some quarters.
Once each spending bill has passed the chamber’s Appropriations Committee, it is subject to action by the full chamber. The bills can again be amended on the chamber floor, though the 302(b) spending limits mentioned above remain in force. Thus, most amendments looking to increase spending for a given program must shift spending around rather than add to the sum total. Spending bills can pass the House by a simple majority, but are subject to filibuster in the Senate. Spending bills are also subject to Presidential veto, and the Administration may threaten a veto or otherwise issue a position on a bill through policy statements. Once a spending bill has passed both chambers of Congress, a conference committee is formed to work out the differences between the two versions, and eventually the completed bill is sent to the White House for the President’s signature.
The federal fiscal year ends September 30, so all 12 spending bills must be completed and signed by then. If Congress cannot finish their appropriations work on time and want to avoid a shutdown, they have the option of passing a continuing resolution. Continuing resolutions typically just extend the level of funding from the prior year, though they can also contain funding changes targeted at specific programs. These changes are known as “anomalies.” For instance, when Congress has passed continuing resolutions covering the Department of Energy, they’ve sometimes added extra funding for nonproliferation R&D.
In some years, multiple continuing resolutions are required to avoid a shutdown, one after the other, until final appropriations

99 GUIDE TO THE PRESIDENT’S BUDGET | RESEARCH & DEVELOPMENT FY 2017
▲ BACK TO TABLE OF CONTENTS
are passed. Congress can also bundle multiple appropriations bills together into an omnibus spending package. These steps have been common in recent years due to continuing conflict over spending and deficits. Lastly, the President can issue, and Congress can pass, supplemental or emergency spending bills. These may be necessary to provide sufficient funds for wars, hurricane relief, or other needs.

WWW.AAAS.ORG/PROGRAM/RD-BUDGET-AND-POLICY-PROGRAM 100
▲ BACK TO TABLE OF CONTENTS
APPENDIX 3 DISCIPLINES AT FEDERAL AGENCIES
This report has primarily organized R&D expenditures by federal agency and program, but another way to evaluate the federal R&D portfolio is by discipline. The federal government has historically invested in a broad range of research activities in the physical, life, social, and environmental sciences, in mathematics and computing, and in other disciplines. This appendix is intended as a brief reference guide to the major federal funders of R&D by discipline, for those readers looking for a better sense of who funds what.
Unfortunately, the President’s budget does not typically provide data on R&D expenditures by discipline, and the data in this appendix is not from the FY 2017 request. Instead, this appendix primarily draws from NSF’s Federal Funds for R&D Survey for FY 2013, the most recent year for which detailed data by discipline is available at the time of this writing.1 The intent is to help readers – especially those new to the budget – understand which agencies fund which disciplines, and by how much. This knowledge may inform readings from the main sections of this report, and could familiarize the reader with a wider range of federal agencies.
All data presented below has been adjusted for inflation using current OMB deflators.
PHYSICAL SCIENCE
Federal agencies spent a total of $6.58 billion on physical science research in FY 2013. Physics receives just over half of all research dollars within the overall discipline. The bulk of physics research, 64 percent, is funded by the Department of Energy; DOE’s Office of Science remains the leading source of funding for basic research in the physical sciences. Additional federal support for physics research is included in the budgets for NASA, DOD, and NSF. Physical science research also includes astronomy, making up 18 percent of the total discipline. While NASA contributes 75 percent of federal support for astronomy, NSF comprises a notable share on account of the agency’s astronomical research projects. Lastly, chemistry counts as a significant 16 percent of total physical
science expenditures. Chemistry is well-represented throughout the agencies, with the most significant sources of funding coming from DOE’s Office of Science and NSF’s Chemistry Division.
ENGINEERING
Federal agencies provide significant support for engineering research, totaling $11.46 billion in FY 2013. Funding for engineering is quite varied within the discipline and across agencies. DOD sits on top, and its $824 million contribution to electrical engineering, in particular, remains by far the largest amount compared to other agencies in this field. DOE comes in a very close second for overall engineering research funding; its $1.15 billion budget for materials engineering makes up 40 percent of the agency’s engineering portfolio. At NASA, aeronautical and astronautical engineering comprise 63.4 percent and 28.6 percent, respectively, of the agency’s funding. Elsewhere, NSF accounts for 8 percent of all engineering research funding, principally for activities within the Engineering Directorate. The Department of Transportation funds two-thirds of all civil engineering research among federal agencies.
$0
$500
$1,000
$1,500
$2,000
$2,500
$3,000
DOE NASA NSF DOD All Other
Astronomy
Chemistry
Physics
Other
Physical Sciences Research Funding, FY 2013(expenditures in millions, FY 2016 dollars)
Source: NSF, National Center for Science and Engineering Statistics, Federal Funds for R&D series. © 2016 AAAS
1 Available at http://www.nsf.gov/statistics/2015/nsf15324/.

101 GUIDE TO THE PRESIDENT’S BUDGET | RESEARCH & DEVELOPMENT FY 2017
▲ BACK TO TABLE OF CONTENTS
MATHEMATICAL/COMPUTER SCIENCES
In FY 2013, federal agencies spent $3.59 billion on mathematical and computer sciences research, the latter receiving 69 percent of total expenditures. Funding for the disciplines is dominated by three main agencies – DOE, NSF, and DOD – each contributing over $1 billion in total. Computer sciences research receives significant support from the DOE Office of Science’s Advanced Scientific Computing Research (ASCR) Program, NSF’s Computing and Information Science and Engineering Directorate (CISE), and across DOD’s research offices and the Army, Navy, and Air Force labs. Meanwhile, mathematics research draws its funding from DOE’s Office of Advanced Scientific Computing Research and the DOE Applied Mathematics program, DOE’s Scientific Discovery through Advanced Computing program, NSF’s Mathematical and Physical Sciences Directorate, DOD’s research offices and labs, and the National Security Agency (NSA), the largest employer of mathematicians in the United States.
$0
$200
$400
$600
$800
$1,000
$1,200
Mathematics
Computer Sciences
Other
DOE NSF DOD HHS DOC NASA ALLOTHER
Mathematical/Computer SciencesResearch Funding, FY 2013
(dollars in millions, FY 2016 dollars)
Source: NSF, National Center for Science and Engineering Statistics, Federal Funds for R&D series. © 2016 AAAS
$0
$500
$1,000
$1,500
$2,000
$2,500
$3,500
$3,000
DOD DOE NASA HHS NSF DOT All Other
Other
Metallurgy and Materials Engineering
Mechanical Engineering
Electrical Engineering
Civil Engineering
Chemical Engineering
Astronautical Engineering
Aeronautical Engineering
Engineering Research Funding, FY 2013(expenditures in millions, FY 2016 dollars)
Source: NSF, National Center for Science and Engineering Statistics, Federal Funds for R&D series.© 2016 AAAS

WWW.AAAS.ORG/PROGRAM/RD-BUDGET-AND-POLICY-PROGRAM 102
▲ BACK TO TABLE OF CONTENTS
LIFE SCIENCES
Life sciences remains by far the top federally-funded discipline, totaling $30.7 billion in FY 2013, owing to the massive NIH budget. Out of all federal life sciences funding, $24.9 billion or 81 percent is spent via NIH and its 27 institutes and centers. The remaining $5.8 billion is spread across a number of other agencies. Because of this stratification, we have split NIH disciplinary data off from other agency data, as seen in the graphs.
Within USDA, the National Institute of Food and Agriculture (NIFA) conducted $207 million worth of research in the agricultural sciences and an additional $105 million was invested across other USDA agencies. Meanwhile, the Agricultural Research Service (ARS), USDA’s principal intramural research arm, accounted for $548 million or 80 percent of all biological sciences research at USDA. In addition to NIH, the Department of Health and Human Services (HHS) funds notable amounts of research at FDA, CDC, and the Agency for Healthcare Research and Quality (AHRQ). DOD and the Department of Veterans Affairs (VA) fund $404 million and $534 million in medical sciences research, respectively, due to their healthcare responsibilities to veterans, active-duty personnel, and their families. Both NSF’s Biological Sciences Directorate and DOE’s Biological and Environmental Research Program also play a noteworthy role in this discipline.
$0
$200
$400
$600
$800
$1,200
$1,800
$1,600
$1,000
$1,400
USDA HHS DOD NSF VA DOE NASA All Other
Other
Medical Sciences
Environmental Biology
Biological Sciences
Agricultural Sciences
Life Sciences Research Funding (excluding NIH), FY 2013(expenditures in millions, FY 2016 dollars)
Source: NSF, National Center for Science and Engineering Statistics, Federal Funds for R&D series. © 2016 AAAS
Biological Sciences$12,983
Medical Sciences$9,604
Other Life Sciences$2,305
NIH Life Sciences Research Funding, FY 2013(expenditures in millions, FY 2016 dollars)
Source: NSF, National Center for Science and Engineering Statistics, Federal Funds for R&D series. © 2016 AAAS

103 GUIDE TO THE PRESIDENT’S BUDGET | RESEARCH & DEVELOPMENT FY 2017
▲ BACK TO TABLE OF CONTENTS
$0
$200
$400
$600
$800
$1,000
$1,400
$1,200
NASA NSF HHS DOI DOE DOC All Other
Other
Oceanography
Geological Sciences
Atmospheric Sciences
Environmental Science Research Funding, FY 2013(expenditures in millions, FY 2016 dollars)
Source: NSF, National Center for Science and Engineering Statistics, Federal Funds for R&D series. © 2016 AAAS
ENVIRONMENTAL SCIENCES
A total of $4.23 billion was spent by federal agencies on environmental sciences research in FY 2013. NASA takes in the largest share of the funding, with its Earth Science program focused on the global atmosphere, oceans, and interactions between them and terrestrial ecosystems. NSF, the federal agency which supports all fields of science, totals $965 million, roughly divided between the atmospheric sciences, geological sciences, oceanography, and other environmental science research. Just over half of all environmental science research at the Department of the Interior goes towards the geological sciences, carried out by the US Geological Survey and other offices responsible for the management and conservation of federal land and natural resources. Within the Department of Commerce, NOAA funds all of the $141 million devoted towards atmospheric sciences, as well as the full $128 million for oceanography research.
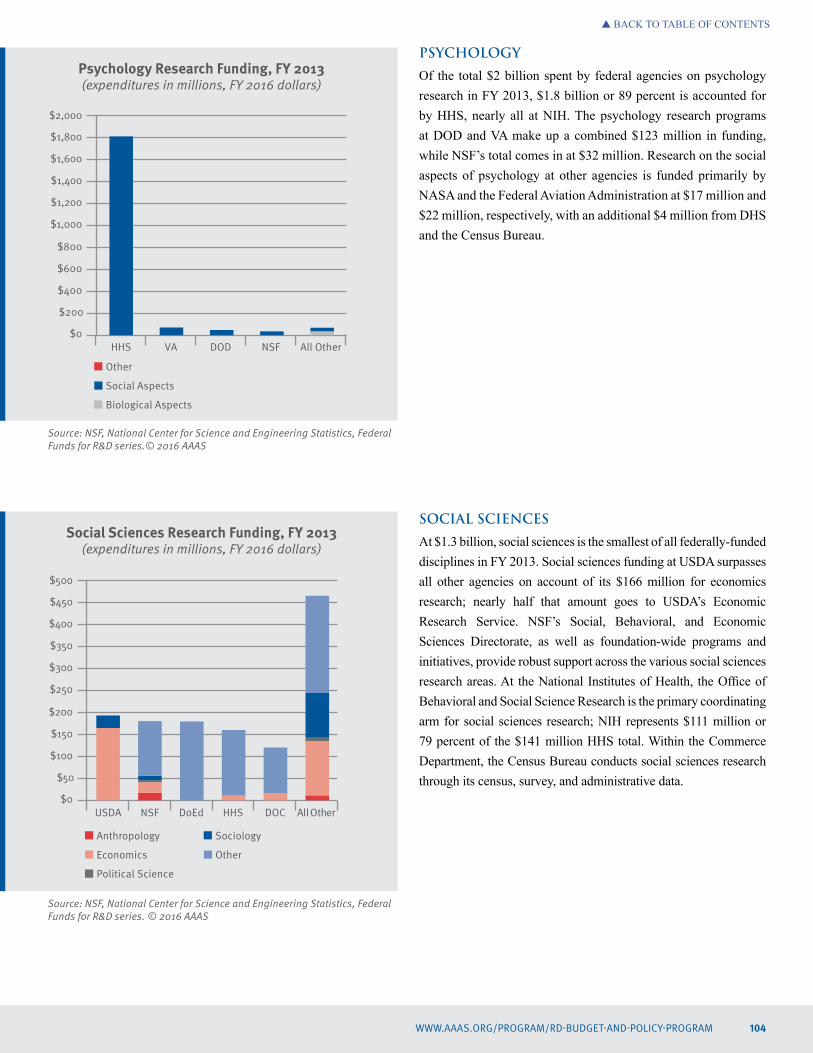
WWW.AAAS.ORG/PROGRAM/RD-BUDGET-AND-POLICY-PROGRAM 104
▲ BACK TO TABLE OF CONTENTS
PSYCHOLOGY
Of the total $2 billion spent by federal agencies on psychology research in FY 2013, $1.8 billion or 89 percent is accounted for by HHS, nearly all at NIH. The psychology research programs at DOD and VA make up a combined $123 million in funding, while NSF’s total comes in at $32 million. Research on the social aspects of psychology at other agencies is funded primarily by NASA and the Federal Aviation Administration at $17 million and $22 million, respectively, with an additional $4 million from DHS and the Census Bureau.
SOCIAL SCIENCES
At $1.3 billion, social sciences is the smallest of all federally-funded disciplines in FY 2013. Social sciences funding at USDA surpasses all other agencies on account of its $166 million for economics research; nearly half that amount goes to USDA’s Economic Research Service. NSF’s Social, Behavioral, and Economic Sciences Directorate, as well as foundation-wide programs and initiatives, provide robust support across the various social sciences research areas. At the National Institutes of Health, the Office of Behavioral and Social Science Research is the primary coordinating arm for social sciences research; NIH represents $111 million or 79 percent of the $141 million HHS total. Within the Commerce Department, the Census Bureau conducts social sciences research through its census, survey, and administrative data.
$0
$200
$400
$600
$800
$1,000
$1,200
$1,400
$1,600
$1,800
$2,000
Other
Social Aspects
Biological Aspects
HHS VA DOD NSF All Other
Psychology Research Funding, FY 2013(expenditures in millions, FY 2016 dollars)
Source: NSF, National Center for Science and Engineering Statistics, Federal Funds for R&D series.© 2016 AAAS
Anthropology
Economics
Political Science
Sociology
Other
USDA NSF DoEd HHS DOC All Other$0
$50
$100
$150
$200
$250
$300
$350
$400
$450
$500
Social Sciences Research Funding, FY 2013(expenditures in millions, FY 2016 dollars)
Source: NSF, National Center for Science and Engineering Statistics, Federal Funds for R&D series. © 2016 AAAS

105 GUIDE TO THE PRESIDENT’S BUDGET | RESEARCH & DEVELOPMENT FY 2017
▲ BACK TO TABLE OF CONTENTS
APPENDIX 4 METHODOLOGY AND DATA SOURCES
The data presented by the AAAS R&D Budget and Policy Program cover only research and development (R&D), not the entire federal budget, except as noted. Within the federal budget, most appropriations are not specifically labeled as R&D except for certain program areas, such as defense. Consequently, most funds for R&D are not line items in an agency’s budget or a spending bill, but are included within general program funding. The Office of Management and Budget (OMB) requires agencies to submit data on R&D programs as part of their annual budget submissions. Specifically, the agencies provide data on funding levels for basic research, applied research, development, R&D facilities construction, and major capital equipment for R&D (see definitions below).
R&D figures rarely correspond to budget line items as found in appropriations bills or the President’s budget. Agencies make determinations as to what proportion of line items are classified as R&D, and many budget line items have both R&D and non-R&D components. Agencies also differ in their tabulation and reporting practices. For instance, some agencies classify program direction or management support as R&D and others do not.
The R&D data presented in the tables represent the agencies’ best estimates of actual and proposed federal funding for R&D collected by OMB and AAAS. These figures incorporate information provided to OMB by two dozen agencies accounting for more than 99 percent of all federal R&D and information collected by AAAS from individual agencies after the release of the full budget. Some adjustments to the original OMB-provided data are made to reflect agency revisions, coding errors, AAAS conversations with agency budget officials, adjustments to conform to historical trends, agency budget documents, supplemental appropriations, emergency spending, and rescissions.
When year-to-year changes are expressed in constant dollars, the deflators used are the Gross Domestic Product (GDP) deflators from the Budget of the United States Government FY 2017, Historical Table 10.1.
Budget statistics can be presented on three bases: (1) budget authority, corresponding to the funds appropriated each year; (2) obligations, indicating the amounts of contracts and grants entered into; and (3) outlays, representing the amounts actually expended. Because budget decisions in the Executive Branch and in Congress are almost always made using budget authority, this metric most accurately reflects current changes in budget policies. AAAS thus uses budget authority as the most meaningful real-time measure of budget decisions.
Although this report relies mostly on OMB and agency data for R&D, it also relies on data from other sources to provide a context for the federal R&D enterprise. When these other sources are used, they are noted in tables and charts. The reader should be aware that although these sources use the same definitions of R&D as AAAS, there may be discrepancies between different data sources resulting from several factors: 1) the use of performer rather than agency surveys; 2) the use of obligations or expenditures rather than budget authority; 3) the use of a calendar year rather than the federal fiscal year; and 4) the use of conduct of R&D, rather than total R&D (including R&D facilities and capital equipment).
Notes on Budget Functions and Homeland Security: All activities in the federal budget are classified into 20 broad functional categories. (AAAS separates the General Science, Space, and Technology function into its subfunctions of General Science and Space; AAAS also classifies VA under Health rather than Veterans Benefits and Services.) Each function often includes programs from multiple agencies. Each R&D program is assigned to only one function, even though the R&D activity may address several functional concerns. Homeland security is a government mission that cuts across mission lines and encompasses many agencies outside DHS: Table A-6 shows all federal homeland security from accounts with some level of R&D orientation. It is based on a special analysis of all homeland security spending conducted by OMB, from which AAAS identifies those accounts that typically contain at least moderate levels of R&D spending.

WWW.AAAS.ORG/PROGRAM/RD-BUDGET-AND-POLICY-PROGRAM 106
▲ BACK TO TABLE OF CONTENTS
DEFINITIONS
In this report, R&D refers to actual research and development activities as well as R&D facilities. These definitions are used by the Office of Management and Budget, the National Science Foundation, and AAAS.
Research is systematic study directed toward more complete scientific knowledge or understanding of the subject studied. The federal government classifies research as either basic or applied according to the objective of the sponsoring agency.
– In basic research, the objective is to gain knowledge or understanding of phenomena without specific applications in mind.
– In applied research, the objective is to gain knowledge or understanding necessary for meeting a specific need.
Development is the systematic use of the knowledge or understanding gained from research directed toward the production of materials, devices, systems, or methods, including design, development, and improvement of prototypes and new processes. It excludes quality control, routine product testing, and production.
R&D funding normally includes those personnel, program supervision, and administrative support costs directly associated with R&D activities. Laboratory equipment is also included. Defense R&D also includes testing, evaluation, prototype development, and other activities that precede actual production.
Funding for R&D facilities (also known as R&D plant) includes construction, repair, or alteration of physical plant (e.g., reactors, wind tunnels, particle accelerators, or laboratories) used in the conduct of R&D (R&D facilities construction). It also includes major capital equipment used for R&D.
The allocation of agency budgets among basic research, applied research, and development is not an exact procedure and some allocations are inevitably arbitrary. The severe time pressures under which these figures are compiled for OMB can also pose a challenge. Nevertheless, there is likely sufficient consistency within each agency’s estimates so that the trends are meaningful.
As mentioned above, the federal R&D funding data in this report are presented in terms of budget authority. Budget authority is the initial budget parameter for congressional action on the President’s proposed budget. Other R&D data sources may express R&D funding in terms of obligations or outlays. There are also R&D data sources that obtain funding data from funding recipients (companies, universities) rather than from funding sources (agencies).
Budget authority is the legal authorization to expend funds.
Obligations represent orders placed, contracts awarded, services received, and similar transactions during a given period, regardless of when the funds were appropriated and when the future payment of money is required.
Outlays represent checks issued and cash payments made during a given period, regardless of when the funds were appropriated or obligated. Some surveys refer to outlays as expenditures.
As an example, Congress may appropriate $100 million to NASA in FY 2006 for an R&D laboratory. NASA may then issue contracts to build the lab and sign $50 million of the contracts in FY 2006 and $50 million in FY 2007. Upon completion of the lab in FY 2007, NASA may then write checks to the contractors for a total of $100 million. Budget authority would be $100 million in FY 2006; obligations would be split $50 million each in FY 2006 and FY 2007; outlays would be $100 million in FY 2007. In the federal budget process, there is normally a lag between budget authority and outlays for large capital projects and research contracts; budget authority and outlays usually occur in the same year for recurring expenses such as staff salaries.
(Definitions adapted from National Science Foundation, Federal R&D Funding by Budget Function: Fiscal Years 2007-2009, Arlington, VA, 2008.)

107 GUIDE TO THE PRESIDENT’S BUDGET | RESEARCH & DEVELOPMENT FY 2017
▲ BACK TO TABLE OF CONTENTS
APPENDIX 5 AAAS COMMITTEE ON SCIENCE, ENGINEERING AND PUBLIC POLICY
William B. Bonvillian (2017) Massachusetts Institute of Technology
Susan B. Butts (2017) Independent Consultant
Robert Cook-Deegan (2017) Duke University
Sharon L. Hays, Chair (2017) Computer Sciences Corporation
Miriam E. John (2017) Independent Consultant
Martha Krebs (2017) Consortium for Building Energy Innovation, Penn State
Mary Maxon (2018) Lawrence Berkeley National Laboratory
Michael R. Nelson (2018) CloudFlare
William D. Provine (2018) DuPont
Anthony (Bud) Rock (2019) Association of Science-Technology Centers
Rush Holt (Ex Officio) AAAS
Edward Derrick (Staff Officer) AAAS
* Terms expire on the last day of Annual Meeting in year shown.

▲ BACK TO TABLE OF CONTENTS
The American Association for the Advancement of Science (AAAS) is the world’s largest general scientific society and publisher of the journal Science (www.sciencemag.org). Science has the largest paid circulation of any peer-reviewed general science journal in the world. AAAS was founded in 1848 and includes nearly 250 affiliated societies and academies of science, serving 10 million individuals. The non-profit AAAS is open to all and fulfills its mission to “advance science and serve society” through initiatives in science policy, international programs, science education, public engagement, and more. For information about AAAS go to www.aaas.org.

American Association for the Advancement of Science
1200 New York Avenue, NW Washington, DC 20005