guide to oisp data reports - data and research services - texas
TRANSCRIPT

Office of Institutional Studies 129 Teague MS 1244 College Station, Texas 77843-1244 www.tamu.edu/oisp
Guide to OISP Data Reports
Office of Institutional Studies Texas A&M University Cindy Dutschke, Ph.D.
Assistant Vice President
July 2009

i
This guide is designed to provide an overview of reports regularly generated by the Office of Institutional Studies and Planning. It also provides an approximate date when a report can be expected to be available on the OISP website and the location of each report. We encourage anyone who regularly uses university statistical information to browse our report website and become familiar with the data that we make available there. In the case that needed information is not included in any of the reports, we have provided a Data Request Form on our report website. When requesting data from OISP, please complete all fields in the form and be as detailed as possible in your request descriptions.
Please note that graphic illustrations provided in this publication represent examples and are only segments of the report. These illustrations should not be used for data gathering purposes.
If you have any questions or comments about our reports, our website, or this publication please feel free to contact us by phone or email.
OISP Staff

ii
TABLE OF CONTENTS
STUDENT Fingertip Facts ........................................................................................................ 1
Enrollment Profile ................................................................................................... 2
Applied-Admitted-Enrolled ......................................................................................... 3
Retention & Graduation Profile .................................................................................... 4
FACULTY Instructional Faculty Profile ........................................................................................ 5
Faculty Workload Report ............................................................................................ 6
Semester Teaching Analysis Report (STAR) ...................................................................... 8
Who’s Teaching Whom .............................................................................................. 10
Faculty Salary Study (OSU) ......................................................................................... 11
Faculty Salary Study (AAUDE) ...................................................................................... 12
SEMESTER CREDIT HOUR Semester Credit Hour (SCH) & Weighted Semester Credit Hour (WSCH) Report ........................... 13
WSCH Three Year Trend ............................................................................................ 14
WSCH Base Year Comparison ....................................................................................... 15
Approved Course Inventory ......................................................................................... 16
COURSE & DEGREE
Course Profile by Major ............................................................................................. 17
Courses Taken by Major by Level .................................................................................. 18
History of Courses Taught .......................................................................................... 19
Average Class Size Report .......................................................................................... 20
Degree Profile ........................................................................................................ 21
Degrees Awarded by Fiscal Years .................................................................................. 22
Degree Inventory ..................................................................................................... 23
GENERAL DATA Common Data Set .................................................................................................... 24
LBB Performance Measures ......................................................................................... 25
VISION 2020 METRICS REPORT Metrics Data Website ................................................................................................ 26
Presentation .......................................................................................................... 27
MORE SUMMARY REPORTS ........................................................................................28
COGNOS Web Applications .......................................................................................33 ADDITIONAL OISP DATA RESPONSIBILITIES ............................................................................. 34
APPENDIX: DATA RESPONSIBILITY GRID ................................................................................ 34

1
FINGERTIP FACTS
PRODUCTION FINGERTIP FACTS is published each fall, spring, and summer (Summer I and II combined, unduplicated) semesters. The report is based on preliminary data extracted from the student information system on the 1st, 5th, and 12th class day for fall and spring semesters and official, non-certified 4th class day data for the Summer I, II, and 10 Week sessions. The preliminary data presented does not include any edit corrections and is never certified (marked clearly in red NOT CERTIFIED). College- and Department-specific versions of this report are also distributed directly to Deans, Department Heads, and other departmental users via email (known as ‘burst reports’). Upon completion of the ENROLLMENT PROFILE report, FINGERTIP FACTS will be removed from the OISP website.
APROXIMATE AVAILABILITY FALL SEMESTER – September 15th
SPRING SEMESTER – February 1st SUMMER I & 10-WEEK – June 30th SUMMER II – July 30th
SUMMARY This report provides a quick overview of student enrollment and demographic information by level, classification, and entry status. The primary function of FINGERTIP FACTS is to provide preliminary enrollment information as quickly as possible in the semester. The data presented should not be considered official for any purpose. Please also note that previous years’ data are official certified data.
LOCATION OISP Website: http://www.tamu.edu/oisp/reports/student.html STUDENT >> Fingertip Facts

2
ENROLLMENT PROFILE
PRODUCTION ENROLLMENT PROFILE is published each fall, spring, and summer (I and II combined, unduplicated) semesters. The report is made available soon after the beginning of each semester based on edited, but not yet certified, data extracted from SIMS on the 20th class day for fall and spring semesters and the 15th class day of the second session for the combined summer semester. The original production of the report will indicate clearly in red letters NOT CERTIFIED. After the data becomes certified, OISP will reproduce the Enrollment Profile and publish it on the report website; very few changes, if any, should occur by certification.
APROXIMATE AVAILABILITY FALL SEMESTER – October 15th
SPRING SEMESTER – March 15th SUMMER SEMESTER – August 15th
SUMMARY
The report provides in-depth data of student enrollment by multiple variables. It is based on a data file that is a subset of the “OISP Student File” that the office receives from the student information system. Student enrollment and demographics are presented by university, college, department and major as well as by level and classification. Special population information includes data for Top 10% students, First-Time in College students, Corps of Cadets, Blinn TEAM, and housing information. Geographic distribution data details county, state, and country feeder patterns.
LOCATION OISP Website: http://www.tamu.edu/oisp/reports/student.html STUDENT >> Enrollment Profile

3
APPLIED-ADMITTED-ENROLLED REPORT
PRODUCTION APPLIED-ADMITTED-ENROLLED REPORT is published each fall semester. The report is made available after the official census day (12th class day) using data from the Admissions File and the Student File.
APPROXIMATE AVAILABILITY Fall –October 15th
SUMMARY This report shows official census day data for the number of applications, admits and enrolled students by ethnic categories for each of the following groups:
• Total First-Time-In-College (FTIC)
• FTIC Top 10% of Texas Residents from Texas High Schools
• 1st Generation FTIC
• New Undergraduate Transfers
• First Time Graduates
• Summary Page by FTIC, Transfers, Readmits and First Time Graduates
LOCATION OISP Website: http://www.tamu.edu/oisp/reports/student.html STUDENT >> Applied/Admitted/Enrolled

4
RETENTION AND GRADUATION PROFILE PRODUCTION RETENTION AND GRADUATION PROFILE for each fall semester is usually produced in the middle of the fall semester. The report is based on certified student data from the OISP data warehouse.
APPROXIMATE AVAILABILITY November 15th
SUMMARY RETENTION AND GRADUATION PROFILE contains retention and graduation information for several under-graduate student populations (cohorts) at the university level, the college level, the departmental level, and the major level. The following frequently-requested cohorts are found in the report:
• First-Time In College (FTIC) – undergraduate degree seeking students who applied and enrolled in college for the first time (regardless of whether these students have acquired college level credit through testing, advanced placement or summer enrollment)
• First-Time in College Full-Time (FTFT) – those first-time in college students who enrolled for 12 or more hours during their first semester at TAMU
• Transfer students
• Blinn TEAM students
For each cohort the report shows one- to six-year retention/graduation (as available), split by various demographic categories.
Retention and graduation are calculated for each student based solely on Universal Identification Number (UIN). OISP constantly attempts to improve the accuracy of this report by updating the changed UIN’s (as well as previously used SSN and SID fields).
Only fall semesters are considered for retention calculations, however graduation data is taken from all three commencements during that academic year (December, May, August)
LOCATION OISP Website: http://www.tamu.edu/oisp/reports/student.html STUDENT >> Retention & Graduation Report

5
INSTRUCTIONAL FACULTY PROFILE
PRODUCTION FACULTY PROFILE for each fall semester is usually produced toward the end of the following spring semester. The report is based on certified faculty data from the OISP data warehouse as well as additional Faculty data obtained from the Dean of Faculties office.
APPROXIMATE AVAILABILITY March 1st
SUMMARY FACULTY PROFILE provides an in-depth overview of the university’s instructional faculty:
• Instructional Faculty Reported to the Texas Higher Education Coordinating Board - includes all faculty members who were listed on CBM-008 Faculty Report to the THECB, e.g. each person who has a faculty appointment for the fall semester or who is paid from faculty salary funds, as well as all faculty (including teaching assistants) who are teaching a course reported to the THECB. For this population the metrics include head count, teaching FTE, average salary, average age, average years of experience at Texas A&M as well as average years of total experience. These metrics are summarized by various demographic categories (ethnicity, gender, tenure status) and shown for each college and department by rank.
LOCATION OISP Website: http://www.tamu.edu/oisp/reports/faculty.html FACULTY >> Faculty Profile

6
FACULTY WORKLOAD REPORT
PRODUCTION FACULTY WORKLOAD REPORT is published each fall and spring semesters.
APPROXIMATE AVAILABILITY Fall – December 1st Spring – April 1st
SUMMARY This report shows that TAMU faculty members are in compliance or not in compliance with the minimum workload requirements approved by the Texas A&M Board of Regents. Three times a year (Fall, Spring and Summer) the departments review and make corrections to the course and faculty data used to generate this report through an on-line web application. The data is usually available for update on-line five working days after the 20th class day. Although the Faculty Workload Report is not required in the summer, the corrected course and faculty data are used to generate other reports (i.e. STAR and reports to the Texas Higher Education Coordinating Board), so it is still essential that it be completed. The TAMU workload policy and a tutorial for the web application can be found at http://www.tamu.edu/oisp/tools.html.
The report consists of several sections. The first section is a listing of faculty members not in compliance for the current semester and it includes their SSN, budget data, teaching data and the reason for non-compliance. The next section is a university summary, which shows the total classroom teaching credits (CTC), total teaching credits (TTC) (including equivalent teaching credits), faculty FTE and the percent of classroom teaching credits to total teaching credits. The same data is provided for each college by department. The last section of the report shows an individual listing of faculty members and GAT’s by department. It shows their classroom and equivalent teaching credits, and their compliance status and reason for non-compliance if applicable.
LOCATION OISP Website: http://www.tamu.edu/oisp/reports/faculty.html FACULTY >> Faculty Workload Report *password protected*
*Because this report contains sensitive information, it is posted to our website as a password protected site. Contact OISP to gain access to this report.
[Example report segment shown on next page]

7

8
SEMESTER TEACHING ANALYSIS REPORT (STAR)
PRODUCTION SEMESTER TEACHING ANALYSIS REPORT (STAR) is published each fall, spring, and summer (combined, unduplicated) semesters. Additionally, a STAR report is published for the entire fiscal year.
APPROXIMATE AVAILABILITY Fall – December 1st Spring – May 1st Summer – August 19th Fiscal Year – October 25th
SUMMARY STAR is a compilation of reports designed to provide departments and colleges with a comprehensive overview of their teaching effort.
STAR consists of two major parts. The first part contains teaching summaries shown by college, department, funding area, and level. Each summary displays total Semester Credit Hours (SCH) and Weighted SCH (WSCH) generated by the college or department as well as number of bonus WSCH gained by tenured faculty (Teaching Supplement1) and lost due to Excess PhD2 students. The result of the calculation is the Net WSCH for that college or department. Also displayed are the teaching Full-Time Equivalents (FTE) and salaries paid to faculty members and teaching assistants, which allows for computation of cost per SCH and per WSCH by the college or department. Aside from actual numbers, percentage change from the previous like semester is also shown for the high-level reports (to department level only), as well as the actual numeric change.
The second part of the report is the detailed Teaching Load Report. This section provides individual departments with a complete listing of every faculty member or graduate assistant who either participates in teaching any of the department’s courses, or is paid by the department. Each instructor’s courses and the SCH generated by each course are displayed, as well as the total FTE for the instructor and the salary paid by the department.
1 Teaching Supplement – Every lower level course taught by a tenured or tenure-track faculty member receives a specified percentage as bonus hours.
2 Excess PhD – Credit hours by doctoral students whose number of attempted hours exceeds the limit set by the Coordinating Board. These hours are ineligible to receive State funding and are therefore ‘lost’ by the University.
LOCATION OISP Website: http://www.tamu.edu/oisp/reports/faculty.html FACULTY >> Semester Teaching Analysis Report (STAR) *password protected*
*Because this report contains sensitive information, it is posted to our website as a password protected site. Contact OISP to gain access to this report.
[Example report segment shown on next page]

STAR
STAR
R Part 1
R Part 2
9

PW
A
ST
LOhF
PRODUCTIOWHO’S TEACH
APPROXIMA
SUMMARY This report incl
• Graph• Semes
instruc
• Weighfor eac
• Organlevel o
• Facultvisiting
LOCATION OISP Websitehttp://www.tFACULTY >>
ON HING WHOM i
ATE AVAILA
ludes 5 major s
hs-This section
ster Credit Hoction. The dat
hted Semesterch level of inst
ized Sectionsof instruction.
ty Rank- Profeg faculty is incl
e: tamu.edu/oisWho’s Teach
W
s published e
ABILILTY
sections:
gives visual re
ours-This sectita are shown b
r Credit Hourstruction. The
-This section
essor through uded in “Other
sp/reports/fahing Whom
WHO’S TE
each fall, spri
Fall – DecemSpring – AprSummer – A
epresentation s
ion reflects thby department
-This section r data are show
reflects the n
Instructor shoFaculty.”
aculty.html
10
EACHING
ng, and summ
mber 1st ril 8th ugust 15th
summarizing th
he semester cr and college.
reflects the wen by departme
umber of orga
own on this rep
WHOM
mer (combine
he data presen
redit hours tau
eighted semestent and college
anized classes
port represent
L
ed, unduplica
ted in the repo
ught by facult
ter credit houre.
taught by eac
tenure or tenu
LOWER DIVI
ated) semeste
ort.
ty rank for eac
rs taught by fa
ch faculty ran
ure-track facul
ISION
ers.
ch level of
aculty rank
k for each
ty. TAMU

11
FACULTY SALARY STUDY (OSU) (as reported to the Oklahoma State University Survey)
PRODUCTION Faculty salary data is extracted from the budget each fall semester and is used to generate the TAMU information in the TAMU FACULTY SALARY STUDY. Average salaries from peer institutions are extracted from a salary study by Oklahoma State University and the comparison report is produced in the Spring semester.
APPROXIMATE AVAILABILITY March 21st
SUMMARY The FACULTY SALARY STUDY shows average faculty salaries by rank, by college and by department and compares Texas A&M average salaries to average salaries for peer institutions. The peers vary by college and a peer listing is included in the report. Salaries are 9-month FTE and exclude administrators and department heads. The report also includes five-year line graphs of university average salaries, peer average salaries and the Peer Group index.
LOCATION OISP Website: http://www.tamu.edu/oisp/reports/faculty.html FACULTY >> Faculty Salary Study (5yr, OSU)

12
FACULTY SALARY STUDY (AAUDE) (as reported to the Association of American University Data Exchange)
PRODUCTION FACULTY SALARY (AAUDE) STUDY using AAUDE data is published during the summer with the most recent fall salary data. The report is made available once the data have been verified and proofread.
APPROXIMATE AVAILABILITY Summer – August 31
SUMMARY This report is similar to the Oklahoma State Faculty Salary Study. The data is aggregated by CIP code for fulltime tenured and tenure track faculty. Comparisons are made to our Vision 2020 peer institutions showing the percentage strength of TAMU average salaries to Vision 2020 peers average salaries.
LOCATION OISP Website: http://www.tamu.edu/oisp/reports/faculty.html FACULTY >> Faculty Salary Study (AAUDE)
13
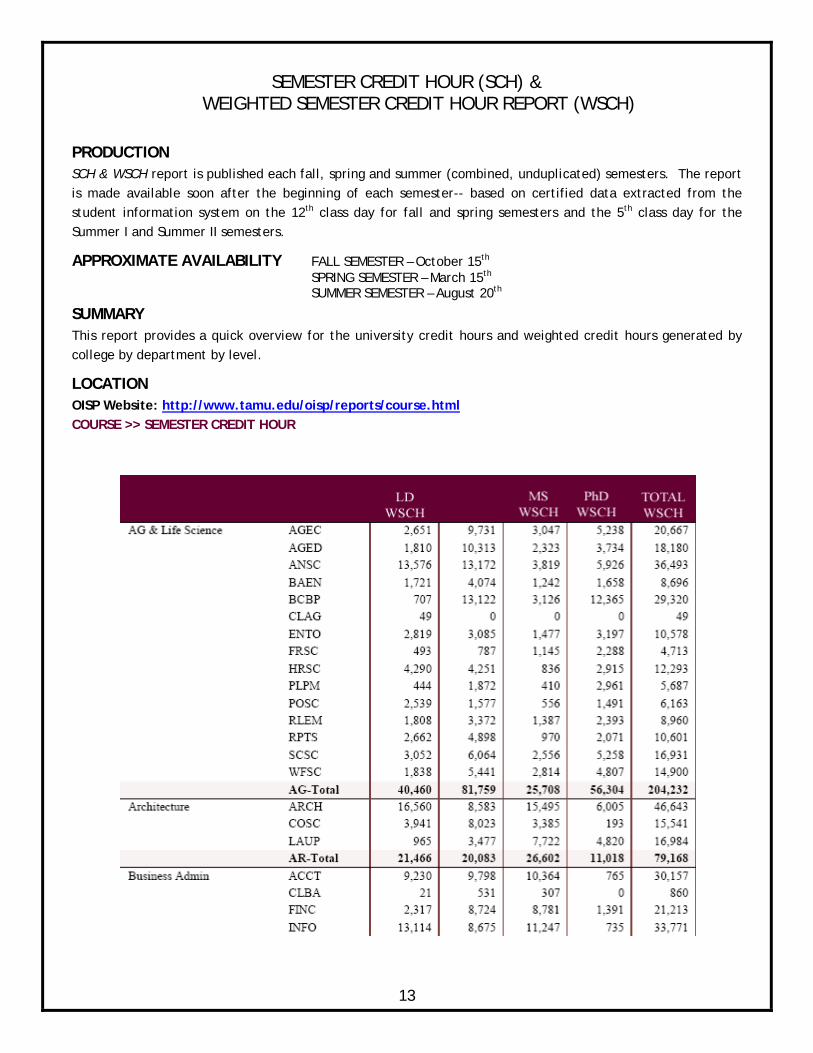
SEMESTER CREDIT HOUR (SCH) & WEIGHTED SEMESTER CREDIT HOUR REPORT (WSCH)
PRODUCTION SCH & WSCH report is published each fall, spring and summer (combined, unduplicated) semesters. The report is made available soon after the beginning of each semester-- based on certified data extracted from the student information system on the 12th class day for fall and spring semesters and the 5th class day for the Summer I and Summer II semesters.
APPROXIMATE AVAILABILITY FALL SEMESTER – October 15th SPRING SEMESTER – March 15th SUMMER SEMESTER – August 20th
SUMMARY This report provides a quick overview for the university credit hours and weighted credit hours generated by college by department by level.
LOCATION OISP Website: http://www.tamu.edu/oisp/reports/course.html COURSE >> SEMESTER CREDIT HOUR

14
WEIGHTED SEMESTER CREDIT HOUR (WSCH) THREE YEAR TREND REPORT
PRODUCTION WSCH THREE YEAR TREND REPORT – Updated each fall.
APPROXIMATE AVAILABILITY – Fall Semester
SUMMARY This report shows the three year trend in WSCH by college, by level, and by academic year.
LOCATION OISP Website: http://www.tamu.edu/oisp/reports/course.html COURSE >> WSCH Three Year Trend Report
15
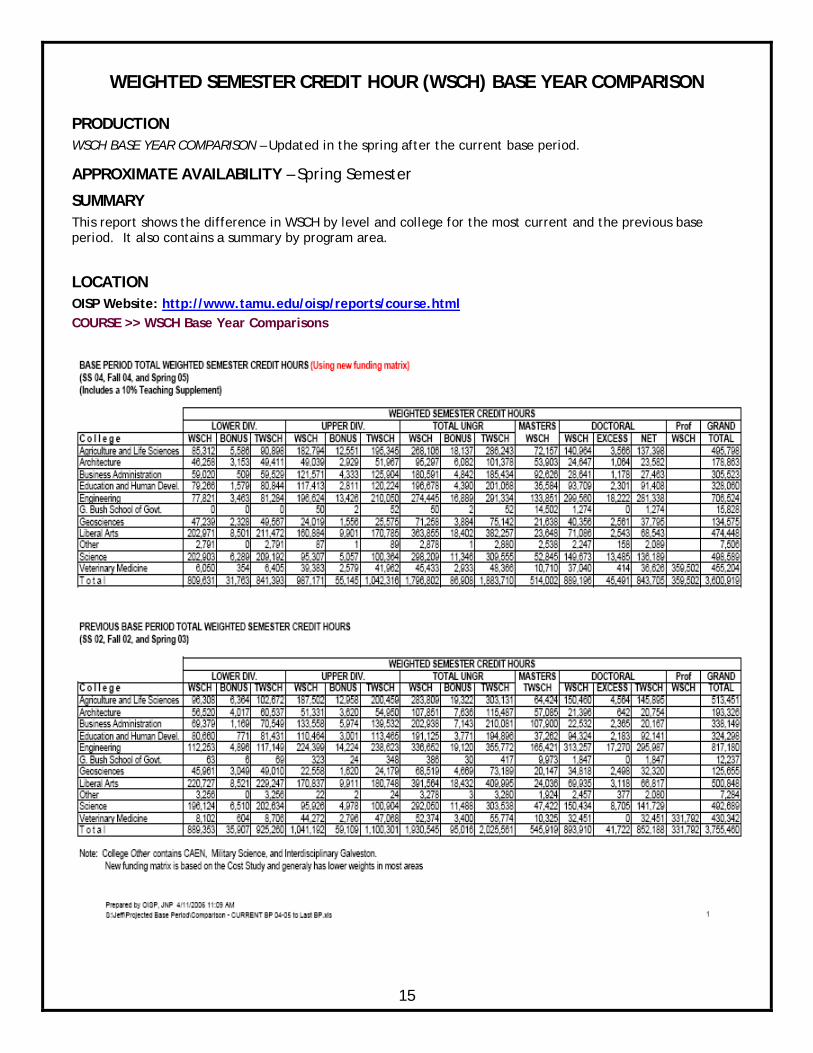
WEIGHTED SEMESTER CREDIT HOUR (WSCH) BASE YEAR COMPARISON
PRODUCTION WSCH BASE YEAR COMPARISON – Updated in the spring after the current base period.
APPROXIMATE AVAILABILITY – Spring Semester
SUMMARY This report shows the difference in WSCH by level and college for the most current and the previous base period. It also contains a summary by program area.
LOCATION OISP Website: http://www.tamu.edu/oisp/reports/course.html COURSE >> WSCH Base Year Comparisons

16
APPROVED COURSE INVENTORY
PRODUCTION APPROVED COURSE INVENTORY is an on-line report that is updated at the beginning of each fall semester.
APPROXIMATE AVAILABILITY – Beginning of each Fall Semester
SUMMARY This file contains a record for each course that has been approved by THECB to be taught by TAMU. New approved courses are added during the summer.
LOCATION OISP Website: http://www.tamu.edu/oisp/reports/course.html COURSE >> Approved Course Inventory

17
COURSE PROFILE BY MAJOR
PRODUCTION COURSE PROFILE BY MAJOR is published each fall, spring, and summer (combined, unduplicated) semesters.
APPROXIMATE AVAILABILITY Fall – November 15th Spring – April 15th Summer – August 18th
SUMMARY This report shows each course (all sections combined into one record), the number of the various majors taking the course, and the assigned SCH, broken down by student level with course and department subtotals. The report is useful for departments in analysis of enrollment patterns in courses taught by that department.
LOCATION OISP Website: http://www.tamu.edu/oisp/reports/course.html COURSE >> Course Profile by Major

18
COURSES TAKEN BY MAJOR BY LEVEL PRODUCTION COURSES TAKEN BY MAJOR BY LEVEL is published each fall, spring, and summer (combined, unduplicated) semesters.
APPROXIMATE AVAILABILITY Fall – November 15th Spring – April 15th Summer – August 18th
SUMMARY This report shows for each major the number of students enrolled in each course by classification (without ‘U0’). In the example below, the U1 column shows all the courses taken by students classified as ELEN major, U1 classification. The report is useful for departments in analysis of course enrollment patterns by the majors of that department.
LOCATION OISP Website: http://www.tamu.edu/oisp/reports/course.html COURSE >> Course Taken by Major by Level

19
HISTORY OF COURSES TAUGHT
PRODUCTION HISTORY OF COURSES TAUGHT is published annually at the end of each fiscal year.
APPROXIMATE AVAILABILITY September 20th
SUMMARY The report shows each course taught during the fiscal year. For each semester it provides the number of sections taught and the number of students enrolled during that semester, along with the FY total and annual average section size. Published by college and by department, with departmental subtotals, the report is useful for departments in analysis of enrollment patterns in courses taught by that department. This report also contains a section listing courses that were not taught in the fiscal year.
LOCATION OISP Website: http://www.tamu.edu/oisp/reports/course.html COURSE >> History of Course Taught

20
AVERAGE CLASS SIZE REPORT
PRODUCTION AVERAGE CLASS SIZE REPORT is published each fall semester.
APPROXIMATE AVAILABILITY Fall – November 15th
SUMMARY This report shows the number of sections and the average section size by lecture, laboratory and course level. The report breaks down numbers by university, college and department, and is produced every fall. Cross-listed courses are courses which have the same course content and meet at the same time with one faculty member. The enrollments are combined and if the courses are offered by two departments, only one gets the credit on this report.
LOCATION OISP Website: http://www.tamu.edu/oisp/reports/course.html COURSE >> Average Class Size Report

21
DEGREE PROFILE
PRODUCTION DEGREE PROFILE is published annually for all degrees conferred during the previous five fiscal years.
APPROXIMATE AVAILABILITY December 1st
SUMMARY This report is an overview of the degrees awarded to students for the previous five fiscal years. It includes analysis regarding: college, major, ethnicity, gender, age group, first generation status, and entry type.
LOCATION OISP Website: http://www.tamu.edu/oisp/reports/degree.html DEGREE >> Degree Profile

22
DEGREES AWARDED BY FISCAL YEARS PRODUCTION DEGREES AWARDED BY FISCAL YEAR is updated annually for all degrees conferred during that fiscal year. (September 1 – August 31) APPROXIMATE AVAILABILITY December 1st SUMMARY The report is an Excel spreadsheet containing the number of degrees conferred by fiscal year, administrative unit, program name, CIP code and degree. Each worksheet displays five years of data and a total for those years. Historical sheets are maintained for reference. It is based on a subset of the “OISP Degree File” that the office receives from the student information system.
LOCATION OISP Website: http://www.tamu.edu/oisp/reports/degree.html DEGREE >> Degrees Awarded by FY

23
DEGREE INVENTORY
SUMMARY This is a listing of all the Coordinating Board approved degree programs and shows each degree program by college, department, department number, department abbreviation, degree program, major, option, degree awarded, degree level and CIP. This listing is updated as new degree programs are approved by the Coordinating Board.
LOCATION OISP Website: http://www.tamu.edu/oisp/reports/degree.html MISCELLANEOUS >> Degree Inventory Sorted by College & Sorted by CIP

24
COMMON DATA SET (CDS)
SUMMARY The COMMON DATA SET (CDS) initiative is a collaborative effort among higher education data providers and publishers such as the College Board, Peterson’s, U.S. News & World Report and Wintergreen/Orchard House. The combined goal of this collaboration is to improve the quality and accuracy of information involved in a student’s transition into higher education as well as to reduce the reporting burden of data providers.
The CDS is a set of standards and stated definitions of data items rather than a survey instrument or set of data represented in a database. Each of the higher education surveys conducted by participating publishers incorporates items from the CDS as well as unique items proprietary to each publisher. Consequently, the publishers’ surveys differ in that they utilize varying numbers of items from the CDS.
The major categories of the CDS are as follows:
A. General Information • Institution contact information • Institution source and classification • Academic calendar • Degrees offered (types)
B. Enrollment and Persistence • Enrollment by gender, level and
ethnicity • Degrees awarded • Graduation rates • Retention rates
C. First-Time, First-Year (Freshman) Admission • Applied, admitted, enrolled • Admission requirements • Basis for selection • SAT and ACT policies • Freshman profile • Admission policies • Early decision and early action plans
D. Transfer Admission • Fall applicants • Application for admission • Transfer credit policies
E. Academic Offerings and Policies • Study options • Library collections
F. Student Life • General student information • Activities offered • Housing
G. Annual Expenses • Tuition • Required fees • Room and board • Other estimated expenses
H. Financial Aid • Aid awarded to enrolled
undergraduates • Processes for first-year/freshman
students • Types of aid available • Criteria in awarding institutional aid
I. Instructional Faculty and Class Size • Faculty demographics • Student to faculty ratio • Undergraduate class size
J. Degrees Conferred
LOCATION OISP Website: http://www.tamu.edu/oisp/reports/student.html STUDENT >> Common Data Set
25
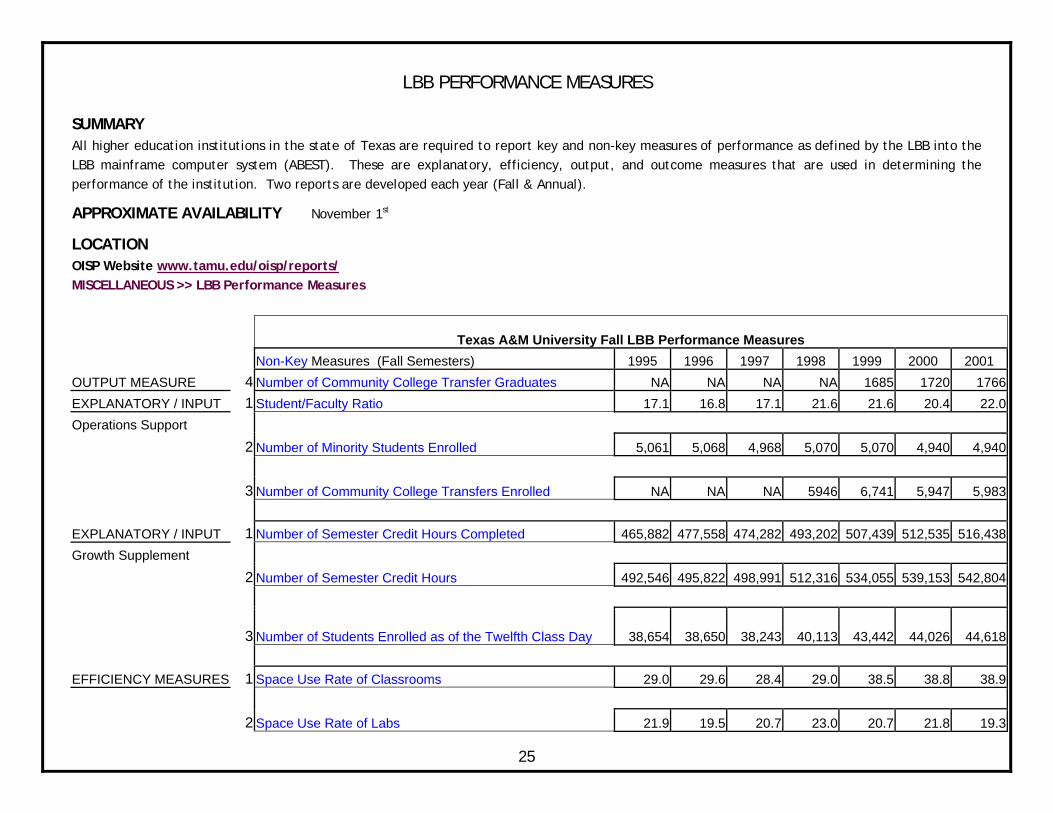
LBB PERFORMANCE MEASURES
SUMMARY All higher education institutions in the state of Texas are required to report key and non-key measures of performance as defined by the LBB into the LBB mainframe computer system (ABEST). These are explanatory, efficiency, output, and outcome measures that are used in determining the performance of the institution. Two reports are developed each year (Fall & Annual).
APPROXIMATE AVAILABILITY November 1st
LOCATION OISP Website www.tamu.edu/oisp/reports/ MISCELLANEOUS >> LBB Performance Measures
Texas A&M University Fall LBB Performance Measures Non-Key Measures (Fall Semesters) 1995 1996 1997 1998 1999 2000 2001 OUTPUT MEASURE 4 Number of Community College Transfer Graduates NA NA NA NA 1685 1720 1766 EXPLANATORY / INPUT 1 Student/Faculty Ratio 17.1 16.8 17.1 21.6 21.6 20.4 22.0 Operations Support
2 Number of Minority Students Enrolled 5,061 5,068 4,968 5,070 5,070 4,940 4,940
3 Number of Community College Transfers Enrolled NA NA NA 5946 6,741 5,947 5,983 EXPLANATORY / INPUT 1 Number of Semester Credit Hours Completed 465,882 477,558 474,282 493,202 507,439 512,535 516,438 Growth Supplement
2 Number of Semester Credit Hours 492,546 495,822 498,991 512,316 534,055 539,153 542,804
3 Number of Students Enrolled as of the Twelfth Class Day 38,654 38,650 38,243 40,113 43,442 44,026 44,618 EFFICIENCY MEASURES 1 Space Use Rate of Classrooms 29.0 29.6 28.4 29.0 38.5 38.8 38.9
2 Space Use Rate of Labs 21.9 19.5 20.7 23.0 20.7 21.8 19.3
26
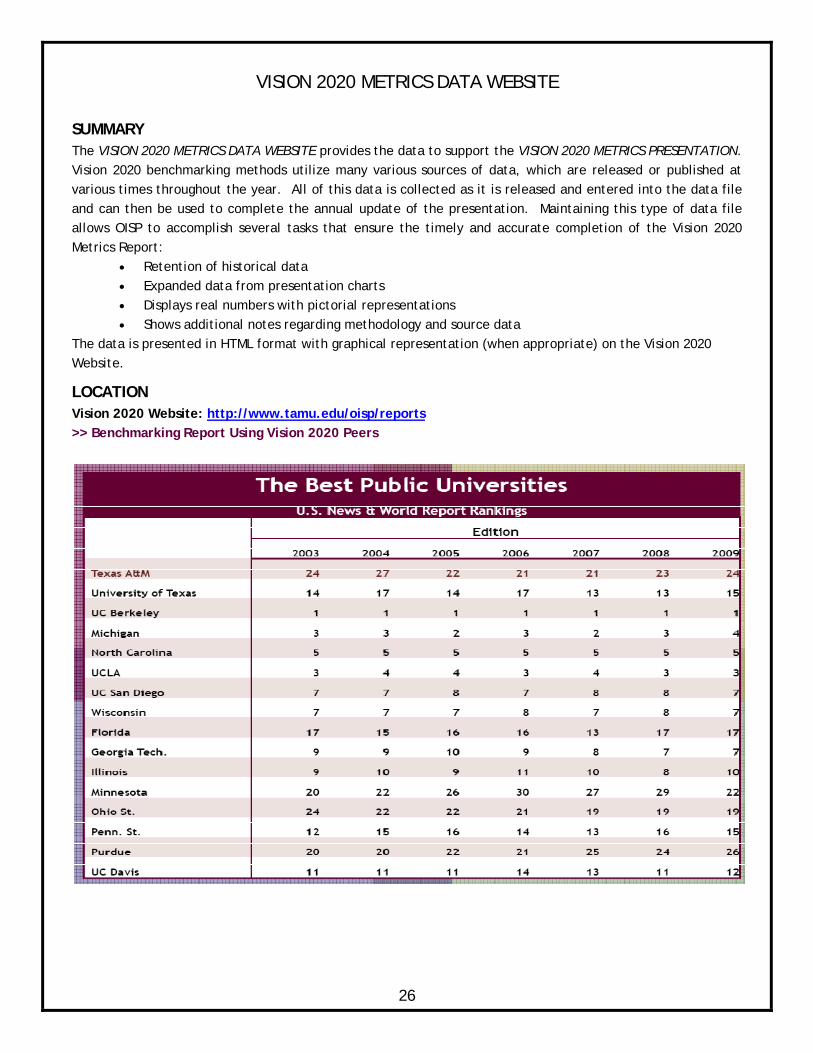
VISION 2020 METRICS DATA WEBSITE
SUMMARY The VISION 2020 METRICS DATA WEBSITE provides the data to support the VISION 2020 METRICS PRESENTATION. Vision 2020 benchmarking methods utilize many various sources of data, which are released or published at various times throughout the year. All of this data is collected as it is released and entered into the data file and can then be used to complete the annual update of the presentation. Maintaining this type of data file allows OISP to accomplish several tasks that ensure the timely and accurate completion of the Vision 2020 Metrics Report:
• Retention of historical data • Expanded data from presentation charts • Displays real numbers with pictorial representations • Shows additional notes regarding methodology and source data
The data is presented in HTML format with graphical representation (when appropriate) on the Vision 2020 Website.
LOCATION Vision 2020 Website: http://www.tamu.edu/oisp/reports >> Benchmarking Report Using Vision 2020 Peers

27
VISION 2020 METRICS PRESENTATION SUMMARY The VISION 2020 METRICS PRESENTATION is developed in PowerPoint and updated annually in the Fall. It is designed to allow ease in presentation and clear interpretations in comparison and trends. Text slides are used to guide the presentation and two formats are used to display the benchmarking data:
1. Chart Slides: usually bar charts, depicting 3-4 most current years’ data
Due to space limitations, many charts display only the first seven peer institutions plus TAMU. The data file expands all charts to include all 15 peer institutions.
2. Table Slides: usually depicting 3-4 most current years’ data
While these tables look similar to those found in the data file, they cannot retain all historical data due to space restrictions.
When viewing these slides from the Internet or in a presentation setting, the notes sections cannot be seen. In order to see the notes regarding methodology or source data, the presentation must be viewed or printed in “Notes View” in PowerPoint.
This presentation is useful in comparing the peer institutions’ recent progress, easily identifying trends and presenting to groups. For more specific numbers in benchmarking, the data file will prove more helpful.
Location Vision 2020 Website: http://www.tamu.edu/oisp/reports >> Benchmarking Report Using Vision 2020 Peers

28
MORE SUMMARY REPORTS
DATA BROCHURE PRODUCTION DATA BROCHURE is updated twice a year in spring and fall.
APPROXIMATE AVAILABILITY Spring – May 15th Fall – December 15th
SUMMARY The brochure provides current university data in a condensed format. The report covers summary information on students, faculty, courses, degrees, and facilities.
LOCATION OISP Website: http://www.tamu.edu/oisp/misc.html MISC >> DATA BROCHURE

29
OISP STATISTICS BOOKLET PRODUCTION OIPS STATISTICS BOOKLET is published in the summer semester.
APPROXIMATE AVAILABILITY Summer – August 15th
SUMMARY The booklet presents both current and trend data summaries for the university in a condensed format. The report covers summary information on students, faculty, finances, courses, degrees, and facilities.
LOCATION OISP Website: http://www.tamu.edu/oisp/reports/misc.html MISC >> Statistics Booklet

30
NATIONAL SCIENCE FOUNDATION RESEARCH AND DEVELOPMENT
PRODUCTION The NSF Research and Development report is published annually in the summer semester. The report is made available soon after the Association of American University Data Exchange updates its warehouse contents.
APROXIMATE AVAILABILITY SUMMER SEMESTER – August 11th
SUMMARY
The report presents current and trend data on research and development dollars as reported to the NSF through the Office of the Vice President for Research. Expenditures are compared between Texas A&M University and our Vision 2020 peer universities in terms of funding sources and academic fields of study. Dollar amounts cited are absolute value of R&D dollars to academic institutions without any adjustments (such as inflation index).
LOCATION OISP Website: http://www.tamu.edu/oisp/reports/misc.html MISC >> NSF Research and Development (Executive Summary) Among all the 16 Vision 2020 institutions, Texas A&M ranked second in receiving 2008 R&D dollars in Environmental Sciences from all sources. (Figure 10). Figure 10. 2008 R&D in Environmental Sciences

31
CSRDE RETENTION AND GRADUATION RATES (as reported to the Consortium for Student Retention Data Exchange)
PRODUCTION The CSRDE Retention and Graduation Rates is published annually in the fall semester. The report is made available soon after the CSRDE database completes the updates.
APROXIMATE AVAILABILITY FALL SEMESTER – October 15th
SUMMARY
The report summarizes the retention and graduation rates of entering freshman cohorts at Texas A&M University as compared to our Vision 2020 peer universities. General overview of the trends and findings is presented to benchmark our efforts in navigating our freshmen through graduation. There are three sections in the report: retention and graduation rates for All Freshmen; for Under Represented Minority (URM); and for the freshmen in Science, Technology, Engineering, and Mathematics (STEM) majors.
LOCATION OISP Website: http://www.tamu.edu/oisp/reports/misc.html MISC >> CSRDE Retention and Graduation Rates (Executive Summary)
Figure 8. UMR Four-, Five-, and Six-Year Graduation Rates (1999 and 2000 Cohorts’ Composite Data)

32
AAUDE SURVEY OF GRADUATE ASSISTANT STIPENDS (as reported to the Association of American University Data Exchange) PRODUCTION The AAUDE SURVEY OF GRADUATE ASSISTANT STIPENDS is published annually in the fall semester. The report is made available soon after the AAUDE warehouse completes the updates.
APROXIMATE AVAILABILITY FALL SEMESTER – December 15th
SUMMARY
This report presents both current and trend data at the institutional level. Stipends are compared between Texas A&M University and our Vision 2020 peer universities. Dollar amounts cited are absolute values without any adjustment. However, the Runzhemier Report of Living Cost Standards Index is listed at the end of the report.
LOCATION OISP Website: http://www.tamu.edu/oisp/reports/misc.html MISC >> AAUDE Survey of Graduate Assistant Stipends
Figure 1. Teaching Assistants: Average Cash Salary

33
COGNOS WEB APPLICATIONS
Cognos Reporting Portal The reporting portal can be used to access the OISP historical data warehouse, which currently contains Official Certified data for Students, Courses, Degrees and Faculty (Admissions/Applications data set is currently in development). During the early part of each semester, a limited subset of preliminary data is also available via the reporting portal. Preliminary data is available as of 1st, 5th, 12th and 20th class-day, with a typical lag time no longer than two business days. The portal provides designated users with secure access to interactive versions of many of the reports that OISP has published on its website, e.g. Enrollment Profile, Degree Profile, Semester Teaching Analysis Report (STAR), and others, with new reports being constantly developed per user needs. Users of the reporting portal are able to generate focused, parameterized reports in one of the available formats (PDF, HTML, Excel, Tab-delimited), which can then be saved, distributed via email and/or scheduled for recurring execution. Prior to being able to access the reporting portal, all users are required to attend one of the training sessions. Cognos License Allocations Each academic department has been allocated one “Consumer” license which allows the user to login and interact with developed reports and queries. Consumer-level users are able to open existing reports and queries, change selections of prompts, and drill-through from one report or query to another. Typically, this license holder will be the department chair or a person designated by the department chair. Each academic college (usually the Dean’s office) and several major units on-campus have been allocated “Business Author” licenses which allow those users to generate new queries and modify existing queries to serve their needs as well as the needs of “Consumer”-level users in their college.
Accessing OISP Cognos Reporting Portal The URL for the Reporting Portal is: https://oisp.tamu.edu/cognos8 *password protected*
*Because this report contains sensitive information, it is posted to our website as a password protected site. Contact OISP to gain access to this report.

34
ADDITIONAL OISP DATA RESPONSIBILITIES In addition to these reports, the Office of Institutional Studies is considered the primary source on the following information:
• Fees and Costs
• Student FTE Trends
• Student Faculty Ratios
• Average salary information
• All external surveys
• Faculty count by rank, age, tenure status etc.
• Average SCH per FTE student
• Formula revenue projections
• Credit hour five-year trend data by major, department, college and university
• Enrollment Projections
APPENDIX
DATA RESPONSIBILITY LIST - SEE FOLLOWING WEB SITE:
http://www.tamu.edu/oisp/reports/ (click on Data Responsibility List)