guide to north dakota's ground-water resources · guide to north dakota's ground-water...
TRANSCRIPT

Guide to North Dakota's Ground-Water Resources
United States Geological Survey Water-Supply Paper 2236

Ground water discharging at rate of 1,500 gallons a minute during lOO-hour pumping test of well tapping Spiritwood aquifer in Griggs County, eastern North Dakota. Photograph courtesy of North Dakota State Water Comm ission.

Guide to North Dakota's Ground-Water Resources
By Q. F. Paulson
u.s. GEOLOGICAL SURVEY WATER-SUPPLY PAPER 2236

UNITED STATES DEPARTMENT OF THE INTERIOR
JAMES G. WAD, Secretary
GEOLOGICAL SURVEY
Dallas L. Peck, Director
UNITED STATES GOVERNMENT PRINTING OFFICE : 1983
For sale by Distribution Branch Text Products Section U.S. Geological Survey 604 South Pickett Street Alexandria. Virginia 22304

CONTENTS Introduction 1 Where can ground water be found in North Dakota, and how much is available for development? 3
Ground water in the unconsolidated rocks 4 Ground water in the bedrock 6
What is the quality of ground water in North Dakota, and how does it affect intended uses? 9 Quality of water from the unconsolidated rocks 10 Quality of water from the bedrock 10
Can ground water be protected? Should it be? 12 How much ground water is used in North Dakota? 15 What are the limits on ground-water usage? 16
A renewable resource 16 The "safe yield" concept 16 Ground-water "mining" 17
How does ground water interact with streams, lakes, and wetlands? 18 Interaction with streams 18 Interaction with lakes and wetlands 18
Who owns the ground water? 20 How can we best use the ground-water resources in North Dakota? 21 Where can we get ground-water information? 22 Selected references 24
FIGURES
I . Photograph of irrigation well and Carrington irrigation experiment farm 1 2. Photograph showing exposure of unconsolidated rocks (sand and gravel) in Griggs County, eastern
North Dakota 2 3. Photograph showing bedrock exposures in western North Dakota 3 4. Diagram showing confined and unconfined aquifers 4 S. Map showing location of unconsolidated aquifers 5 6. Map showing preglacial drainage pattern in North Dakota 4 7. Geologic section of typical unconsolidated aquifers 5 8. Map and geologic section showing locations and depths of bedrock aquifer units A, B, C, and D 7 9. Graph showing salinity and sodium hazard classifications of water to be used for crop irrigation 9
10. Grouping of five pie diagrams showing average water quality in aquifers in unconsolidated rocks and in bedrock aquifer units A, B, C, and D 10
Contents iii

II . Diagram showing operation of a septic system 13 12. Diagram showing contamination of ground water from surface source 13 13. Diagram showing protection against contamination provided by clay deposits 13 14. Pie diagram showing percentage of water use by category during 1980 15 15. Bar diagram showing increase in irrigation use from 1950 to 1980 15 16. Photograph showing center-pivot sprinkler irrigating small-grain crop 15 17. Diagram showing water cycle 16 18. Diagram showing effect of pumping on water levels in an aquifer 16 19. Hydrograph showing annual water-level decline and rise due to irrigation usage and recovery 17 20. Hydrograph showing declining water level 17 21. Diagram showing interaction of ground water with stream 18 22. Photograph of Sheyenne River southwest of Kindred in August 1973 18 23. Graph showing average discharge in Sheyenne River during fall of 1963 19 24. Photograph showing aerial view of prairie wetlands in southeastern North Dakota 19 25. Diagram showing three types of ground water-wetlands relationships 19 26. Map showing water doctrines used in different parts of the conterminous United States 20 27. Diagram showing overlapping pumping cones 21 28. Diagram showing well diverting water from streamflow 21 29. Photograph showing samples of North Dakota ground-water publications 22
TABLES
I. Major chemical constituents in water-their sources. effects upon usability. and recommended and mandatory concentration limits 8
2. Hardness classifications 9 3. Maximum contaminant levels permitted for public supply use: Inorganic chemicals. organic chemicals.
radionuclides. and microbiological 14 4. List of public agencies in North Dakota where ground-water information can be obtained 23
Contents iv

GUIDE TO NORTH DAKOTA'S GROUND-WATER RESOURCES
By Q. F. Paulson
Figure 1. Irrigation well and Carrington irrigation experiment farm. Photograph by M. O. lindvig.
INTRODUCTION
Ground water, the water we pump from the Earth through wells or that which flows naturally from springs, is one of North Dakota's most valuable resources. More than 60 percent of the people living in the State use ground water for one purpose or another. It is the only source of water for thousands of farm families and their livestock. Almost all smaller cities and villages depend solely on ground water as a source of supply. Increasingly, ground water is being used to irrigate crops and grasslands (fig. I) during protracted dry spells so common in North Dakota. During recent years there has been a rapid development of rural water distribution systems in which thousands of farms and rural residences are connected via underground pipeline to a single water source, usually wells pumping ground water.
We depend on ground water for all of these needs and more, and yet, the subject of ground water is astonishingly misunderstood by many. Notions of underground lakes and rivers or water veins still are commonly held and often appear in the spoken or printed media. To some, ground water even has an aura of mystery, understandable to only a few gifted individuals.
The occurrence of ground water is not mysterious, but it can be complex and difficult to quantify. The science that deals with the principles of ground-water occurrence is called geohydrology. It is an imprecise science, still in an early stage of development compared to some of the older, further-evolved sciences. However, impressive advances in geohydrologic knowledge have been made during a relatively short time.
Statewide evaluations, on a county-by-county basis during the past 25 years, indicate a surprisingly good potential for ground-water development in North Dakota, particularly in the region north and east of the Missouri River. Large and productive aquifers (water-bearing formations that are capable of yielding water to wells) previously unidentified have been described and delineated in reports and maps, which are available to the public from the North Dakota State Water Commission and North Dakota Geological Survey. Except in a few localities, water use from most of these aquifers is minimal. As the economy and population of the State increase, increasing attention will be focused on these relatively unused sources of water.
Development of the State's ground-water resources, however, will not be without problems. Some of the difficult ones will be those dealing with salinity, uneven distribution of aquifers (as well as permeability within aquifers), and insufficient aquifer recharge (replenishment). Adequate solutions to these problems, which to some degree, at least, are common to ground-water use everywhere, will require the application of sound geohydrologic principles along with the best developmental technology available.
2
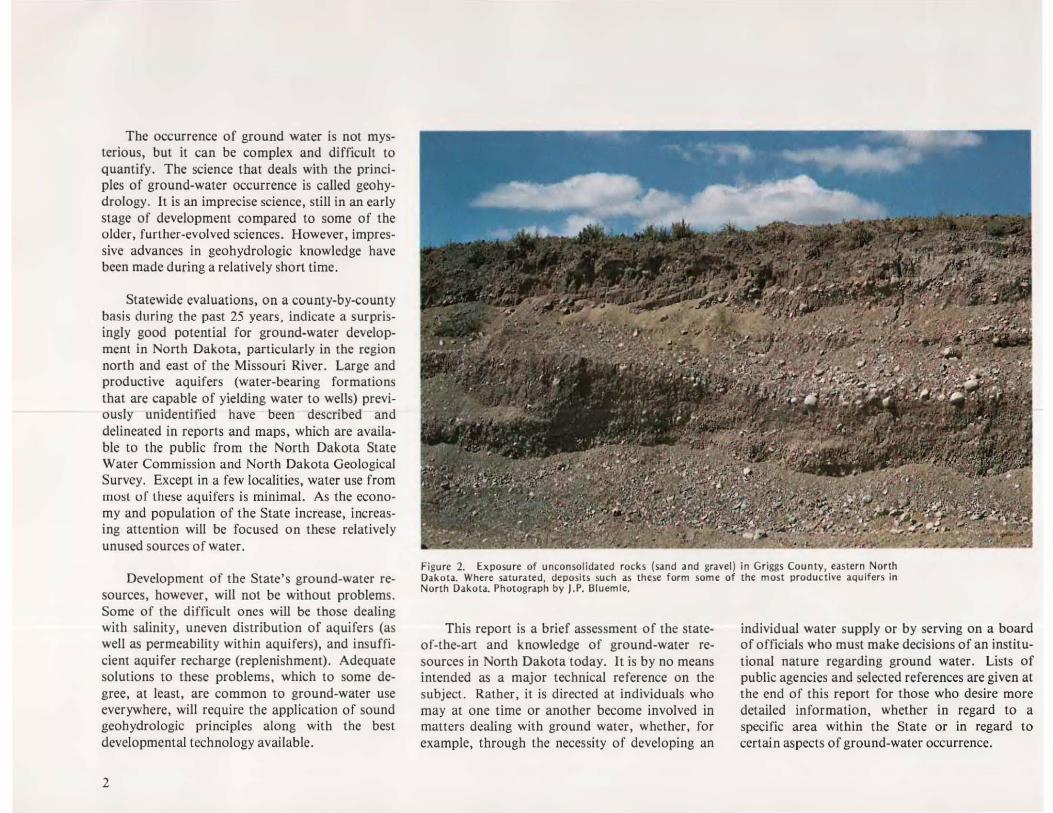
Figure 2. Exposure of unconsolidated rock s (sand and gravel) in Griggs County! eaSlern North Dakota. Where saturated, deposi ts such as these form some of the most productive aquifers in North Dakota. Photograph by J.P. Bluemle.
This report is a brief assessment 0 f the stateof-the-art and knowledge of ground-water resources in North Dakota today. It is by no means intended as a major technical reference on the subject. Rather, it is directed at individuals who may at one time or another become involved in matters dealing with ground water, whethcr, for example, through the necessity of developing an
individual water supply or by serving on a board of officials who must make decisions of an institutional nature regarding ground water. Lists of public agencies and selected references are given at the end of this report for those who desire more detailed information, whether in regard to a specific area within the State or in regard to certain aspects of ground-water occurrence.

WHERE CAN GROUND WA TER BE FOUND IN NORTH DAKOTA, AND HOW MUCH IS AVAILABLE FOR DEVELOPMENT?
Ground water underlies the land surface throughout most of North Dakota. At some depth, almost everywhere in the State, the earth is saturated with water. Why then, the problems one often hears or reads about in connection with developing ground-water supplies? The problems relate to both the quantity and quality of water needed at a particular location and for a particular purpose. Both the quantity and quality of water that can be obtained at a given location vary greatly across the State. These variations are related primarily to variations in the earth's composition and structure.
Generally ground water in North Dakota occurs in two major rock types. These are uncon-
solidated rocks and bedrock underlying the unconsolidated rocks. However, in many places the distinction is not precisely defined. Unconsolidated rocks are loose beds of gravel, sand, silt, or clay such as may be seen in commercial gravel pits and along river banks (fig. 2). Conversely, bedrock, as the term implies, generally is solid unbroken rock (fig . 3) . However, it varies greatly from only slightly consolidated deposits of clay or sand to hard rock such as shale, limestone, or granite, which may contain numerous fractures .
The various rock formations that make up the Earth's crust have been classified by geologists according to rock type and have been given formal names. The name usually is in reference to a
Figure 3. Bedrock exposures in western North Dakota. These rocks are part of the Fort Union Formation. Sandstone and lignite beds In this formation yield water to wells and springs throughout most of western North Dakota. Photograph by D. G. Emerson.
geographic location where the formation is particularly well exposed, or, in the case of subsurface occurrence only, is well identified in geophysical logs. For example, the Fort Union Formation, which is referred to further on in this report, is well exposed in the vicinity of historic Fort Union near the confluence of the Missouri and Yellowstone Rivers in northwestern North Dakota.
Although the earth beneath North Dakota is saturated with water below certain depths, some rock formations yield much larger quantities than others. Those that yield sufficient quantities to wells or springs to be useful are termed aquifers. These generally consist of sand and gravel beds in the unconsolidated rocks and sandstone layers in the bedrock. For reasons relating to their origin, aquifers in the unconsolidated rocks are more productive and generally yield less mineralized water than those in the bedrock. In contrast, also because of origin, the aquifers in the bedrock tend to be more continuous and widespread than those in the unconsolidated rocks.
Aquifers generally are described as being either confined or unconfined. The two types are illustrated in the block diagram on the next page (fig. 4) . A confined aquifer is overlain and underlain by beds o f less permeable material. The water within this type of aquifer, which also may be termed artesian, is under pressure. If a well is drilled into the aquifer, water will rise in the well to some level higher than the top of the aquifer. If the pressure is great enough, the water will flow at land surface. An unconfined aquifer is not overlain by impermeable beds and the top of the aquifer is the land surface. The upper surface of the water within the aquifer is the water table, and such aquifers are referred to as water-table aquifers.
3
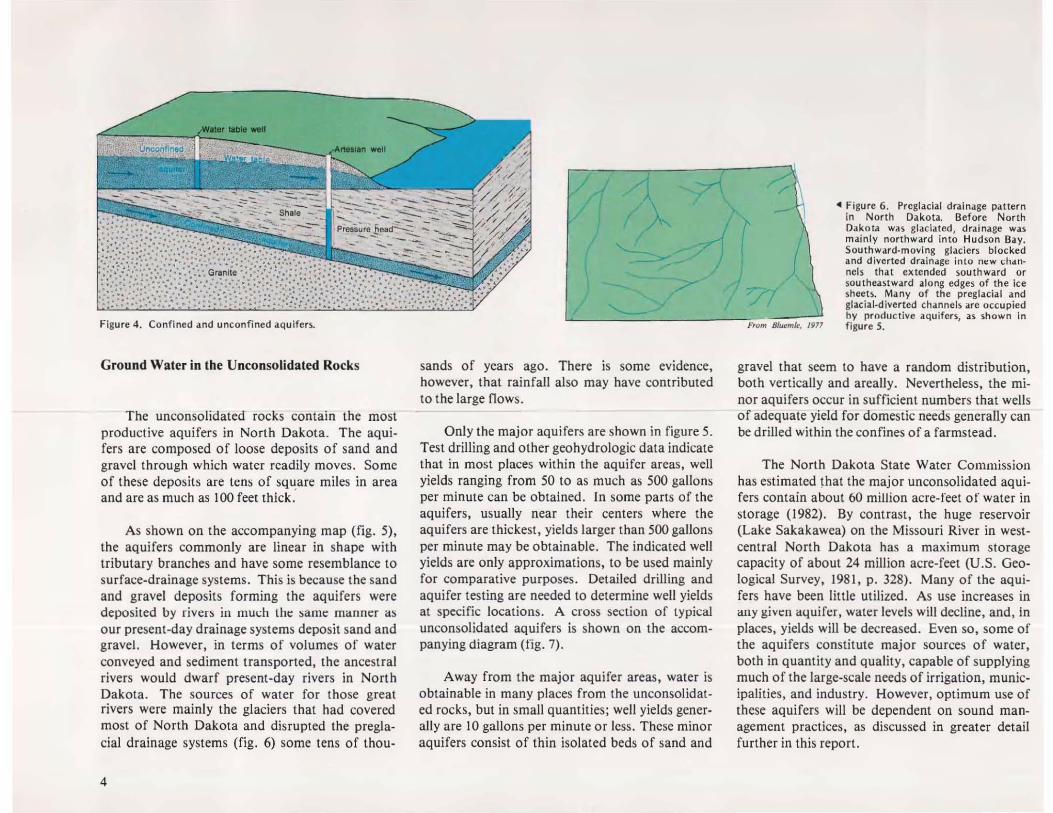
Figure 4. Confined and unconfined aquifers.
Ground Water in the Unconsolidated Rocks
The unconsolidated- rocks contain the most productive aquifers in North Dakota_ The aquifers are composed of loose deposits of sand and gravel through which watcr rcadily moves. Some of these deposits are tens of square miles in area and are as much as 100 feet thick :
As shown on the accompanying map (fig . 5), the aquifers commonly are linear in shape with tributary branches and have some resemblance to surface-drainage systems. This is because the sand and gravel deposits forming the aquifers were deposited by rivers in much the same manner as our present-day drainage systems deposit sand and gravel. However, in terms of volumes of water conveyed and sediment transported, the ancestral rivers would dwarf present-day rivers in North Dakota. The sources of water for those great rivers were mainly the glaciers that had covered most of North Dakota and disrupted the preglacial drainage systems (fig. 6) some tens of thou-
4
->1
A -~ ----,....-
/'
'----
sands of years ago. There is some evidence, however, that rainfall also may have contributed to the large flows.
Only the major aquifers are shown in figure 5. Test drilling and other geohydrologic data indicate that in most places within the aquifer areas, well yields ranging from 50 to as much as 500 gallons per minute can be obtained. In some parts of the aquifers, usually near their centers where the aquifers are thickest, yields larger than 500 gallons per minute may be obtainable. The indicated well yields are only approximations, to be used mainly for comparative purposes. Detailed drilling and aquifer testing are needed to determine well yields at specific locations. A cross section of typical unconsolidated aquifers is shown on the accompanying diagram (rig. 7).
Away from the major aquifer areas, water is obtainable in many places from the unconsolidated rocks, but in small quantities ; well yields generally are 10 gallons per minute or lcss. Thcse minor aquifers consist of thin isolated beds of sand and
/'
,. r
j
From B/~mle, /911
... Figure 6. Preglacial drainage pattern in North Dakota. Before North Dakota was glaciated, drainage was mainly northward into Hudson Bay. Southward-moving glaciers blocked and diverted drainage into n~w ch"nneh that extended southward or southeastward along edges of the ice sheets. Many of the preglacial and glacial-diverted channels are occupied by productive aqu ifers, as shown in figure S.
gravel that seem to have a random distribution, both vertically and areally. Nevertheless, the minor aquifers occur in sufficient numbers that wells of adequate yield for domestic needs generally can be drilled within the confines of a farmstead.
The North Dakota State Water Commission has estimated that the major unconsolidated aquifers contain about 60 million acre-reet or water in storage (1982). By contrast, the huge reservoir (Lake Sakakawea) on the Missouri River in westcentral North Dakota has a maximum storage capacity of about 24 million acre-feet (U .5. Geological Survey, 1981, p. 328). Many of the aquifers have been little utilized. As use increases in any given aquifer, water levels will decline, and, in places, yields will be decreased. Even so, some of the aquifers constitute major sources of water, both in quantity and quality, capable of supplying much of the large-scale needs of irrigation, municipalities, and industry. However, optimum use of these aquifers will be dependent on sound management practices, as discussed in greater detail further in this report.

1900
Clay
1800
17110
1800
1~O ~~~----~L---~--~--'~M=m~~~,"~,,~ng~. ~/'~7' o 'h 2 MILES '-' ----'------',
VK1lcIJ SCIIt i, Qrtatly .~agomted Nationll Gtodenc Vert,cal Datum ot 1929.
J! 10,0 100° MANITOBA " 0 ____ ~ ________ ;::-{ 'If'
-r~--7. ---;--~ rc:----- .. ---r:--------- r-~--~ V )-
B, ~ <3: t ijl ., \ _ )
I ~~. J~-rJ ~ " ] J, l 1.% F"---- . ~- n, 1 , I ,
~;;:..~ ~ d . J P ....... _""' .. \- 4110
, , I '1~'
~.
~ ! , ' \
___________ _ f __ ""' __ ~_C(~ 1~, 0 SOUTH 100:-' -'---"""-;O-OA'KOTA
20 XI «I NILES ! I ,
i i i o 10 20 30 <40 50 KJUlMETERS
• Figure 5, Location of major u nconsolidated aquifers.
.. Figure 7. (INSET) Geologic section of tvpical unconsolidated aquifers. Several aquifers (b lue) may be penetrated by a single well or test hole (vertical line).
L ~ ---~~~ "," -- ---=. \!J \ <
! ~ \~ , ~ -- \~ t? ~'-. ;-. •
"*"'W'-M---- q \
" l~'" .P/ , -~-
.' ---~-o
Modf/ltti from North DDlcOla SIIU' Waltr Commwlon. 1981
o EXPLANATION
YIELDS GfIIEATER THAN 500 GALLO NS PER MINUTe A V A I LABLE
VIElC ,S FADM 50 TO 500 GALLONS PER MINUTE AVAI LA BLE
5

Ground Waler in Ihe Bedrock
The accompanying map and geologic section show the distribution of bedrock formations and associated aquifers in the State (fig. 8). Although the map shows where the various formations occur (crop out or subcrop) at land surface, one needs to examine the geologic section in order to visualize their occurrence beneath the land surface. A large number of individual bedrock formations have been formally identified and described in North Dakota, but for the purpose of defining bedrock aquifers these formations can be grouped into four major units, which are labeled A-D in descending order.
The relationship of the bedrock formations to the aquifer units is given in the following table.
BH,oc:k IOnMttone Thle ...... Aqu't.r unlta ('M')·
Rocks of Tertiary age White Ri .... r Group "" A
~g~dITnl~~'t?or~O;t'ro~ion 300 2.300
Rocks 01 Cretaceous age Hell Creek Formation 600 Folt Hili, Sandstone 400 B
(Includes lower gart of Hell
reek Formallon). Undifferentiated rocks 3.000
Dakota Sandstone 400 C
Rocks 01 Jurassic age 1.000
Rocks 01 Triassic age 600
Rocks of PaieololC age 7.000 0
"Maximum known thickness, rounded to nearest 30 feet.
Unit A, the uppermost unit, includes a series of aquifers composed of sandstone and lignite beds that occur mainly in the Fort Union Formation in the western one-half of the State. Generally these aquifers are quite variable in horizontal extent and thickness. Although several may be present in vertical sequence at one location, none may be present at another. Consequently, the aquifers in unit A are less reliable sources for development than the deeper aquifers. Nevertheless, most farms and ranches and many small
6
communities are able to obtain sufficient quantities of water for most purposes from these aquifers. Water in unit A, although commonly more mineralized than desirable, is used for most purposes except for irrigation. Even if the quality were suitable for irrigation, quantities available in most places would be inadequate except for limited use.
Unit B is an extensive sandstone aquifer I which underlies all except the eastern one-third of the State. The sandstone beds are mainly in the Fox Hills Sandstone, but they also are in the lower part of the overlying Hell Creek Formation. The aquifer is at or near land surface near its eastern edge, from where it slopes westward to depths of about 2,000 feet below land surface.
In most places, water in unit B is under artesian pressure, but the pressure is not sufficient to produce flowing wells except in low-lying areas such as major river valleys. The aquifer is a relatively dependable source of water because of its wide extent and uniform character. It supplies water to many farms and ranches and several small cities in central and western North Dakota. Water from unit B is similar in quality to that of unit A and generally is used for the same purposes.
The undifferentiated rocks between units B and C consist mainly of shale or other fine-grained materials and are virtually non-water bearing. However, in the eastern part of North Dakota, where not covered by unit B, the upper part of the shale is locally fractured and will yield small quantities of water to wells.
Unit C, which underlies most of the State, consists of several sandstone layers that are commonly referred to as the Dakota Sandstone aquifer, or simply the Dakota aquifer. This aquifer is
well known throughout the Great Plains because of the large number of artesian wells that have been drilled into it. Most or these wells in North Dakota are in the southeastern part of the State. The first well drilled in the Dakota Sandstone is reported to have been drilled at Ellendale in 1886 to a depth of 1,087 feet (Wenzel and Sand, 1942, p. 26). The well reportedly flowed 600 to 700 gallons per minute and had a pressure variously reported between 115 and 175 pounds per square inch. Because of the expense of such deep drilling, few additional wells were drilled until about 1900 when a new and less expensive method of drilling, termed jetting, was developed. From 1900 to 1930, thousands of small-diameter wells were drilled into the Dakota Sandstone in southeastern North Dakota and in eastern South Dakota. Most of the wells were allowed to flow freely, and pressures decreased rapidly in many areas so that some wells ceased to flow, and the flows in others were decreased to a few gallons per minute. In 1921, State laws required all Dakota wells be equipped with pressure-control valves.
It was probably the availability of a freeflowing water supply that mad" the Dakota Sandstone such an attractive source. Certainly it was not the water quality, which generally is unsuitable for many uses because of salinity. However, in many areas it was the only readily available source. Water from the Dakota was particularly valued, and still is, for watering livestock during the winter because of the relatively warm temperature of the water. In western North Dakota the aquifer is used both as a source and a sink in connection with oil-field operations. Water is pumped from the aquifer for use in repressurizing depleted oil reservoirs, and waste brine from the reservoirs is injected into the aquifer.

""
•. r-~OU;'fI"j,r ....J. ---.
I All un its prase" t '1
r _...r---.,..-_
MONTANA I NORTH DAKOTA
-Non ·water boaring
,.'
" 1 I i " ~
'""
<10 MILES I
IOlOMETERS
--
\A ..... -.--'------
Figure 8. Location and depths of bedrock aquifer units A, B, C, and D. More bedrock aquifers are avail· able in western North Dakota than in the eastern part. However, depth to aquifers increases towards the west. Color on map represents uppermost unit.
Approx imate traco
of soction
- All unite abeant
NORTH DAKOTA IMINNESOTA
PRECAMBRIAN ROCKS
Mod/f~d I,em BJl«mlt, 1917
7

Unit C is separated from unit D by thick deposits of shale and other fine-grained rocks of Jurassic and Triassic age, which arc virtually non-water bearing. Unit D, the deepest and thickest of the aquifer units , underlies the entire State except a small area near the North Dakota-Minnesota boundary. Comprised mostly of limestone, but also some sandstone and shale, unit D contains the oldest sedimentary rocks (Paleozoic) in North Dakota. The top of this unit is only a few hundred feet below land surface near the eastern edge of the State, from where it slopes westward to depths of about 6,000 feet. Very little is known about the water-bearing properties of the rocks in this unit. In most parts of North Dakota it would not be practical to drill wells this deep to obtain water. In addition, dat<l from oil wells completed in rocks of this unit indicate that the water is saline and not usable for most purposes.
8
Conilituentl
Silica (5i0 2 )
I,on (Fe)
Manganese (Mn)
CalCium (Ca)
MagneSium (Mg)
Sodium tNa)
Potassium (K'
BOron
("' Bicarbonate (HC0 3 )
Carbonate (C03 )
SuI/ate (SO, )
Chloride (CI)
---Fluoride (F,
Nitrate (N03 )
Dissolved solids
Tab le 1. Major chemical constituents in water··thcir sources, effects upon usabilit y. and recommended and mandatory concentration lim its.
(Modified from Durfor and Becker, 1964, table 2).
Concentrat ions are in milligrams pe r liter (mg/L) Of micrograms per liter (~g/L)
U.S. Environmental
Malor .ourc. Enectl upon uNbHlty Protection Agency (1976, 1977) r9C0mml"ded and rnl"detory 1111'111'1 lor drlnldng wlter
Feldspars, Quartz, and In presence of calcium and magnesium, None. lorromagnosian and silica forms 8 :scale in boilers and on clay minerals. steam turbines that retards neat transler,
Natural sources: amph'- II more than 100 ~gll Is present, 300 ~g/L (recommended). boles, terromagneslan It will precipitate when ellposed 10 air; minerals, ferrous and causes turbidity, sla lns plumbing fixtures, terric sulfides, oxides, laundry, and cooking utensils, and imparts carbonates, and clay tastes and colors to food and dnnks. minerals. Manmade More than 200 .ug/ L is objechonable for sources: well caSings, most industrial uses. pumps, and storage tanks.
Solts, micas, amphiboles. and hornblende.
More than 200.u giL precipitates upon oxidation. Causes undesirable taste and
50 ~g/L (recommended).
dark-brown Of black stains on labrics and porcolSIn Iialuros. Most i ndu:llrill/ USM require water conlalnlng less than 200 .ugA..
AmphibOles. feldspars, Calcium and magnesium combine wllh None. gypsum, pyroxenes, blcarbOnale. carbonate, sulfate, and anhydrite. calcite, silica 10 fOrm scale In heating equipment. aragonite. limestone, Calcium and ma~nes lum retard the suds-dolomil e and clay minerals. formin9 action 0 soap and detergent
Excessfve concentrations 01 magnesium Amphiboles, olivine. have a laxalive eHec!. pyroxenos, magnesi te, dolo-mile, and clay minerals.
Feldspars. clay minerals, More than 50 mg/L sodium and potassium None. and evaporlte$. :~~~u:~~~e~~:re cro~~:li~<:.a~~, FeldSpars, feldspathoids, COfrosion in boilers. micas. and clay minerals
Tourmaline, biot ite. Essential to plant nutrition More than None. and amphiboles. 2 mg/ L may damage some plants.
Heating water diSSOCiates bicarbonate None. 10 carbonate, carbon diollide. Or both .
Limestone and dolomite The carbonate can combino with alkaline earths ~prinCIPallY calcium and magnesium to lorm scale.
Gypsum, anhydrite, and Combines with calcium to lorm scalo. 250 mg/ L (recommended). OXIdallon of sulfide More than 500 mg/L laSles bitter and m., mInerals. be a l axative.
HaUte and Sylvite. In OIlCesS 01 250 mg/ L may Impan salty 250 mg/ L (recommondod). laste. greatly in ellcess may cause physiO-logical distress. Food processlng indus-tries usually require less than 250 mg/L
AmphibOles, apatite, Optimum concentration In drInking water Mandatory maw.imum Huodte, and mica. has a benefiCial eHect on the structure limits depond on
and resistance to decay 01 children's average 01 maximum leeth. ConCenlrallOnS '" excess 01 daily air tempor-optimum may cause mOllli ng 01 children's atures. Malllmum teeth. limits range Irom
, 4 moIL al 32g C 10 2.4 mgll at lOoC.
Organic malter. leni- More Ihan 100 mglL may cause a bitter 10 m9lL (mandatory) IIzers, and sewage. ~~!:'cean~~atk:,rs ~u::c:~r~~'~ica l ;rs~:: .
been reported to cause methem~oblnemla (blue-baby disease) in infants.
Anything that is soluble. Less Ihan 300 mgll is desirable lor some 500 mg/L (recommended) . manufacturin~ processes. excessive dissolved sol ds restrict the use 01 water lor Irr igation

WHAT IS THE QUALITY OF GROUND WATER IN NORTH DAKOTA, AND HOW DOES IT AFFECT INTENDED USES?
Fortunately, ground water in most parts of the State, as in most other areas of the Earth, is bacteria-free and safe to use. That is to say, if wells are sited and constructed according to modern sanitation codes. the water generally does not require chlorination or other forms of purification. Nature already has purified the water for us . Also. fortunately. ground water in North Dakota has been relatively unaffected by toxic-waste disposal or other man-made actions as has been the case in some parts of the United States. But that is the bright side of the picture. Unfortunately. the ground water in parts of North Dakota is so mineralized or saline that is has only limited uses.
Salinity in water begins to develop almost immediately at its point of origin as rainfall. Rainfall dissolves some mineral matter from dust and other air-borne particles as it falls and continues to dissolve mineral matter as it infiltrates into and through the soil. The quantity and kind of dissolved mineral matter in water depends upon the kinds and proportions of minerals that comprise the soil and rocks through which the water moves, as well as upon temperature and pressure. As would be expected. the longer the time that the water is in contact with the rocks. the more mineralized the water becomes. Therefore. water that has moved great distances (or very slowly) through the rocks from its point of entry, or recharge. to its point of exit. or discharge. is likely to be significantly mineralized. And, of course, the converse is true. Some comparatively unmineralized ground water exists in places in North Dakota where the aquifers are shallow and are readily recharged by rainfall or melted snow.
The suitability of water for various uses is determined by the kind. as well as the quantity. of various dissolved substances it contains. The accompanying tables (tables I and 2) and graph (fig. 9) show some of the major chemical constituents and properties found in water--their sources. effects upon usability. and recommended and mandatory concentration limits.
Table 2. Scale of hardness used by U. S. Geological Survey.
C.lclum and m.g"Hlum h.rdnH' .. C.C03
(milligram, per liter)
0-60
61-120
121-180
More than 180
H.rdn ... dHcr1pUon
Soft
Moderately hard
Hard
Very hard
Calcium and magnesium are the principal chemicals causing water hardness.
100 SOl 11", 5000
L ., t > 28 Cl·S4
" ~
I ~ ,.
0 22 a: " " ;20 ~
C+S'
Cl·S2
r 0 ;: 18
:::; E ~
~ ,
~ 16 i ", ~ '4 ~ ~ :;. ~
"."
::; ~ 12 ::J 0 ~ 10 0
C2·S2
<n C>S2
~- Cl ·S1 ,.."
C2·51
C3-S' CHI
'<-'-'<:- ~OOOc--...!..'''50:-'-'''!''-'-'-!!",!cLl---2250~...!.....!..-I ~ CONDUCTIVITY, IN MICROMHOS PER CENTIMETER AT 2SOC
~
Low Medium HI h Very HI h
SALINITY HAZARD
From U.S. SIIIi"i l)l lAbOftUOf )l StQIf, / 9J4
Figure g, Salinity and sodium haurd classifications. Water to be used for crop irrigation needs to be tested for sa:linity (dissolved·solids concentration) and sodium hnards. As these hazards increase, the usa:bility for irrigation decreases. However, other factors such as soil drainage, climate, and type of crop also are important. Advice usually can be obtained from County Extension Agents.
9
Quality of Water from the Unconsolidated Rocks
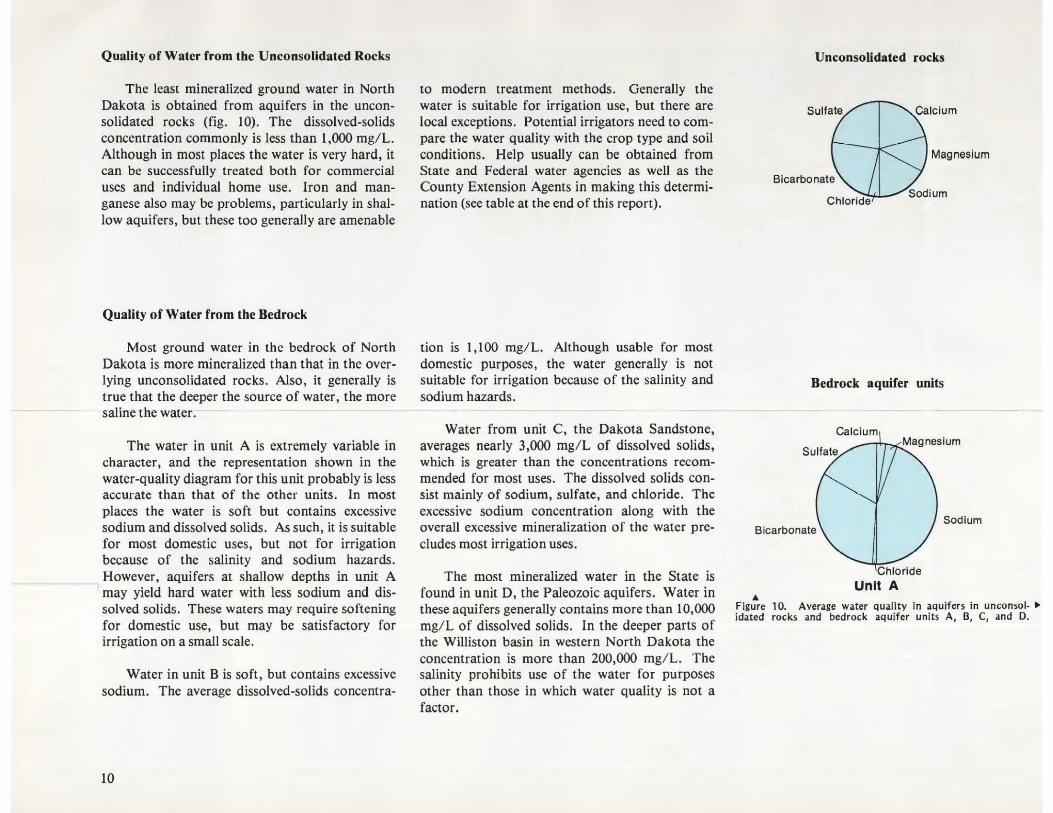
The least mineralized ground water in North Dakota is obtained from aquifers in the unconsolidated rocks (fig. 10). The dissolved-solids concentration commonly is less than 1,000 mg/ L. Although in most places the water is very hard, it can be successfully treated both for commercial uses and individual home use. Iron and manganese also may be problems, particularly in shallow aquifers, but these too generally are amenable
Quality of Water from the Bedrock
Most ground water in the bedrock of North Dakota is more mineralized than that in the overlying unconsolidated rocks. Also, it generally is true that the deeper the source of water, the more saline the water.
The water in unit A is extremely variable in character, and the representation shown in the water-quality diagram for this unit probably is lcss accurate than that of the other units. In most places the water is soft but contains excessive sodium and dissolved solids. As such, it is suitable for most domestic uses, but not for irrigation because of the salinity and sodium hazards. However, aquifers at shallow depths in unit A may yield hard water with less sodium and dissolved solids. These waters may require softening for domestic use, but may be satisfactory for irrigation on a small scale.
Water in unit B is soft, but contains excessive sodium. The average dissolved-solids concentra-
10
to modern treatment methods. Generally the water is suitable for irrigation use, but there are local exceptions. Potential irrigators need to compare the water quality with the crop type and soil conditions. Help usually can be obtained from State and Federal water agencies as well as the County Extension Agents in making this determination (see table at the end of this report).
tion is 1,100 mg/ L. Although usable for most domestic purposes, the water generally is not suitable for irrigation because of the salinity and sodium hazards .
Water from unit C, the Dakota Sandstone, averages nearly 3,000 mg/ L of dissolved solids, which is greater than the concentrations recommended for most uscs. The dissolved solids consist mainly of sodium, sulfate, and chloride. The excessive sodium concentration along with the overall excessive mineralization of the water precludes most irrigation uses.
The most mineralized water in the State is found in unit D, the Paleozoic aquifers. Water in these aquifers generally contains more than 10,000 mg/ L of dissolved solids. In the deeper parts of the Williston basin in western North Dakota the concentration is more than 200,000 mg/ L. The salinity prohibits use of the water for purposes other than those in which water quality is not a factor.
Unconsolidated rocks
Magnesium
Bicarbonate
Bedrock aquifer units
Calcium ..--r.,.,;::!Mag nesium
Sodium Bicarbonate
&
Chloride Unit A
Figure 10. Average water Quality In aquifers in unconsol· ... idated rocks and bedrock aquifer units A, B, C, and D.

Bedrock aquifer units
Magnesium
Bicarbonate Sodium
Chloride Unit B
calcium Magnesium
Chloride Sodium
Sodium
Unit C
EXPLANATION
Scale of radii
o 10 20 30 40 50 Milliequivalents per liter I ! ! ! ! !
Total dissolved solids are proportional to area of circle Unit D
11

CAN GROUND WATER BE PROTECTED? SHOULD IT BE?
Until recently, water-pollution-control activities have focused mainly on rivers and lakes . Ground water was considered a pristine source, protected from the effects of man's activities by virtue of burial within the Earth. We are becoming increasingly aware, however, that not only is ground water vulnerable to pollution but that serious degradation already has occurred in places, particularly in parts of the industrialized eastern United States where toxic chemicals have been detected in drinking-water supplies. It is because ground water is widely used as a source of drinking water that we need to be constantly alert to the hazards of pollution.
North Dakota is not an industrial State, and the likelihood of serious ground-water pollution resulting from industrial processes appears remote at this time. However, little is presently known concerning the long-term hydrologic effects of the State's rapidly expanding energy-related industries, such as coal and oil production and coalfired electrical plants. Studies of the present and potential impacts due to these activities are currently underway, but few data are as yet available.
It appears that the most likely sources of ground-water contamination in North Dakota are related to agricultural activities, which is not unexpected, considering the intensity of farming within the State. Some pesticides and herbicides as well as fertilizers leave residues that can and do leach downward to shallow aquifers. To date, monitoring efforts within the State have indicated very little contamination due to these sources. Other possible sources of ground-water contamination include cattle feedlots, municipal landfi lls, septic tanks, sewage lagoons, oil wells, and the mud pits used for oil-well drilling operations. Even ground-water wells can be sources of contamination if they are not properly constructed.
12
The location, construction, or both, of potential sources of contamination need to be based on earth-science considerations. Informatiun is available at a number of State and Federal agencies (listed at the end of this report) that would aid in the location or construction so that aquifer contamination can be avoided or minimized.
Absolute protection against ground-water contamination probably is an impractical, if not impossible, goal. The first and foremost consideration needs to be the protection of aquifers that are being used, or have the potential for being used, as sources of drinking water. In North Dakota these sources would include most aquifers in the unconsolidated rocks and in bedrock units A and B and at least part of unit C. The water in bedrock unit D generally is too saline to be used for drinking purposes, although treatment may be economically feasible in some instances if the water needs to be used for drinking-water supplies.
Although total protection against groundwater contamination may not be attainable or even desirable, measures can be taken that will minimize the hazards. A thorough knowledge of the geohydrology is necessary to determine the direction and rate of movemeot as well as the eventual fate of contaminants. Water beneath the Earth's surface generally moves very slowly (a few feet per year is not uncommon). This slow movement may result in optimism by some regarding the possibility of a slug of contaminants ever reaching a point of withdrawal. Addeo cumfurt may be derived from the knowledge that as the contaminant moves through the subsurface it is continually being dispersed and diluted. However, studies have shown that given enough time and driving energy. a contaminant can travel considerable distances from the point of origin. Also,
unfortunately, once the contaminant reaches a point of withdrawal, the damage may be complete and remedy impossible in terms of a lifetime or even several generations because of the slow movement.
Many inorganic and most synthetic substances that move through the subsurface remain relatively unchanged except for dilution and dispersal. Contamination associated with human and animal wastes generally is decreased to acceptable limits by bacterial processes within the soil, if the depth to the water table is sufficient. Once the contaminant reaches the water table, however, these processes are no longer effective. Thus, the depth to the water table is a critical factor in regard to contamination from such sources as septic tanks and animal feedlots, as shown in diagrams on the next page (figs. 11 and 12).
Also' of importance is the texture of the materials through which the contaminant moves. Obviously coarse sand or gravel will permit a much faster rate of movement than will clay or shale. In fact, the existence of a thick continuous bed of clay or shale overlying an a4uifer may, for practical purposes, be considered sufficient protection against non-point sources of contamination (fig. 13).
As can be seen from this brief discussion, the poss ible sources of ground-water contamination are many and diverse. This field of study is relatively new, and some of the findings to date have resulted in controversy. Unfortunately, there are rew generally accepted standards regarding either the effects of various contaminants or the limits that should be defined for various uses.
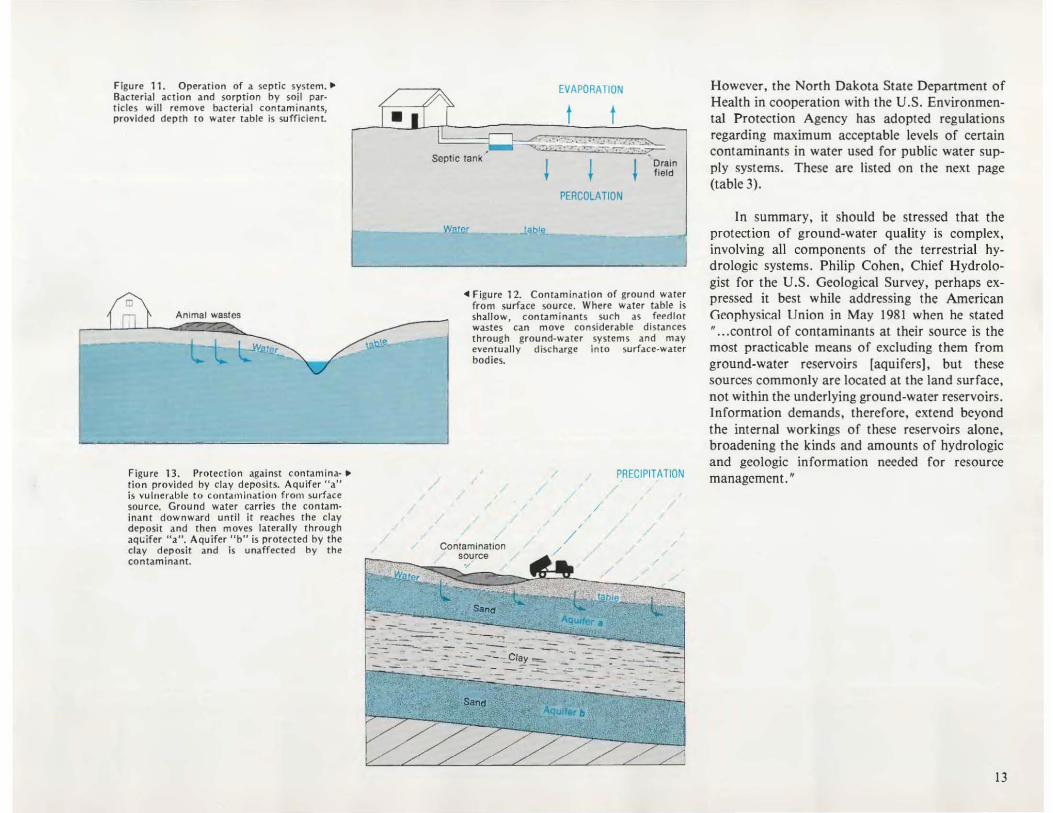
Figure 11. Operation of a septic system." Bacterial action and sorption by soil par· ticles will remove bacte rial contaminants, provided depth to water table is suffieienL
Animal wastes
Figure 13. Protection against contam! na- .. ti on provided by clay deposits. Aquifer "a" is vu lne rdb le to contamination from surface source. Ground water ca rries the contaminant downward until it reaches the clay deposit and then moves latera ll y through aqt;ifer "a", Aquifer lib" is protected by the clay deposit and is unaffected by the contaminant.
Septic tank
EVAPORATION
t t • • ' ,. ' ~ . ' .. ..... ' ~ .••• • , • .:.....tL
-~.'!Ir"""'~_~.~ ..
PERCOLATION
Drain field
1------W41Jlf ..l'll>'''-_________ _
<41 Figure 12. Contamination of ground water from surface source. Where Water table is shallow, contaminants surh as feedlot wa stes can move considerable dis tances th rough grou nd-water systems and may evenlUally discharge into surface-water bodies.
, Contamination
source
•
, /
/
-
PRECIPITATION
/ I
/
--- -
However . the North Dakota State Department of Health in cooperation with the U.S. Environmental Protection Agency has adopted regulations regarding maximum acceptable levels of certain contaminants in water used for public water supply systems. These are listed on the next page (table 3).
In summary. it should be stressed that the protection of ground-water quality is complex. involving all components of the terrestrial hydrologic systems. Philip Cohen. Chief Hydrologist for the U.S. Geological Survey. perhaps expressed it best while addressing the American Geophysical Union in May 1981 when he stated " ... control of contaminants at their source is the most practicable means of excluding them from ground-water reservoirs [aquifers]. but these sources commonly are located at the land surface. not within the underlying ground-water reservoirs. Information demands. therefore. extend beyond the internal workings of these reservoirs alone. broadening the kinds and amounts of hydrologic and geologic information needed for resource management, /I
13

14
Table 3. Maxim um contaminant levels permitted for public supply use: Ino rganic chemicals, organic chemicals, radion uclides, and microbiological. (From North Dakota State Department of Health, 1977).
Inorg8nlc Chemal.
The maxImum contaminan t level for nitrate is applicable to both community and non-community water supply systems. The levels for other inorganic chemicals apply only to community water supply systems. The maximum contaminant levels for Inorganic chemical contaminants are as follows:
Org.nlc C ....... c.I.
The maximum contaminant levels for organic chemical contaminants. applicable only to commun ity water supply systems, are as follows:
R.dlonudkt ..
The maximum contaminant levels for radlonuclides, applicable on ly to community water supply systems, are as follows :
Mlcroblologlc.1
The maximum contaminant levels for coli form bacteria, applicable to both commun ity and non-community water supply systems. are as follows :
Arsenic Barium Cadmium Chromium Lead Mercury Nitrate (as N) Selen ium Silver Fluoride
Chlorinated Hydrocarbons: Cndrin (1,2,3.4,10, 1o-hexachloro-6,7 -epoxy-1.4 ,4a, 5,6, 7,8,8a-octahydro-l,4-endo, endo-5. 8-dl-methano naphthalene).
Lindane (1,2,3,4,5,6-hexachlorocyclohexane, gamma Isomer).
Methoxychlor (1 ,1, l-Trlchloro-2.2-bis [p-methoxyphenyl] ethane).
Toxaphene (Cl0 H,O CI8 -Technical ch lorinated camphene, 61-69% chlorine).
Chlorophenoxys; 2,4-0 (2,4-0 ichlorophonoxyacetlc acid) .
2,4,5-TP Silvex (2,4,5-Trlchlorophenoxypropionic acid) .
Cont.mln.nt
(1) Combined Rad lum-226 and Radium-228.
(2) Gross alpha particle activity, including Rad lum-226. but excluding radon and uranium.
(1) Membnlne Filter Method
When the membrane t llter method is used, the number of coliform bacteria colonies shall not exceed:
(a) One per 100 milliliters as the arithmetic mean of all routine and check samples examined per month; or
(b) Four per ,00 mill iliters in more than one sample when less than 20 are examined per month; or
(c) Four per 100 milliliters in mare than five percenl of the samples when 20 or more are examined per month.
Lowel Millig ram ,Per Liter
0.05 ,. 0.01 0.05 0.05 0.002
'0. 0,01 0.05 2.4
Level Milligram Per Liter
0.0002
0.004
0.1
0.005
0.1
om
Level Plcocuries Per Liter
5
'5
(2) Fermentlltlon Tube Method
When the fermentation tu be method and 10 milliliter standard portions are used, coliform bacteria shall not be present In:
(a) More than ten percent of the portions from both routine and check samples examined In any month: or
(b) Three or more portions in more than one sample when less than 20 samples are examined during the sampling period; or
(c) Three or mOre portions in more than five percent of the samples when 20 or more samples are examined per month.

HOW MUCH GROUND WATER IS USED IN NORTH DAKOTA?
A recent survey showed that during 1980 an average of about 121 Mgal/ d of ground water was withdrawn from aquifers in North Dakota. This is an increase of nearly 14 percent since a similar survey was made in 1975.
The use mainly was for the following purposes:
• Public supply • Rural domestic • Livestock • Irrigation • Industry (self supplied)
The volumes used for each purpose are shown on the accompanying diagram (fig. 14). The largest withdrawals are for irrigation use, followed by public supply, and rural domestic. Irrigation alone accounts for more than 50 percent of the ground-water withdrawals in North Dakota.
Industry 4%,
Public Supply 21%
Irrigation of crops with ground water has increased steadily in North Dakota since about 1960 (figs. 15 and 16), when there were probably fewer than 6 irrigation wells in the State. By 1980 there were nearly 1,500 wells pumping a total of 65 Mgal/d during the irrigation season. Today (1982) almost 100,000 acres of land are irrigated with ground water in North Dakota.
The significant increase in irrigation use can be attributed mainly to two nearly simultaneous developments--one informational and the other technological. The first relates to the statewide program of county ground-water investigations, which began in 1955 and is now nearing completion. The reports and maps resulting from this program provided much of the decision-making information necessary for the potential irrigators. Also, during this same period, technology produced the center-pivot, sprinkler-irrigation system, which can be adapted so well for use with ground-water sources of supply.
<II Figure 14. Percentage of water use by category during 1980. Irrigation accounts for more than 50 percent of the ground water used in North Dakota.
Figure 16. Center-pivot sprinkler" irrigating small-grain crop. Sprinkler rotates full circle and can irrigate a quarter section or more in one revolution . Photograph from North Dakota State Water Commission.
)0
60 ,.. « 0
50 a: w a. (fJ 40 Z 0 .J .J « 30 Cl
Z 0 ::J 2O :! ::;
10
L:::7B,t;;7Lr! 1950 1955 1960 1965 1970 1975 1980
Figure 15. Increase in irrigation use from 1950 to 1980.
15
WHAT ARE THE LIMITS ON GROUND-WATER USAGE?
A Renewable Resource
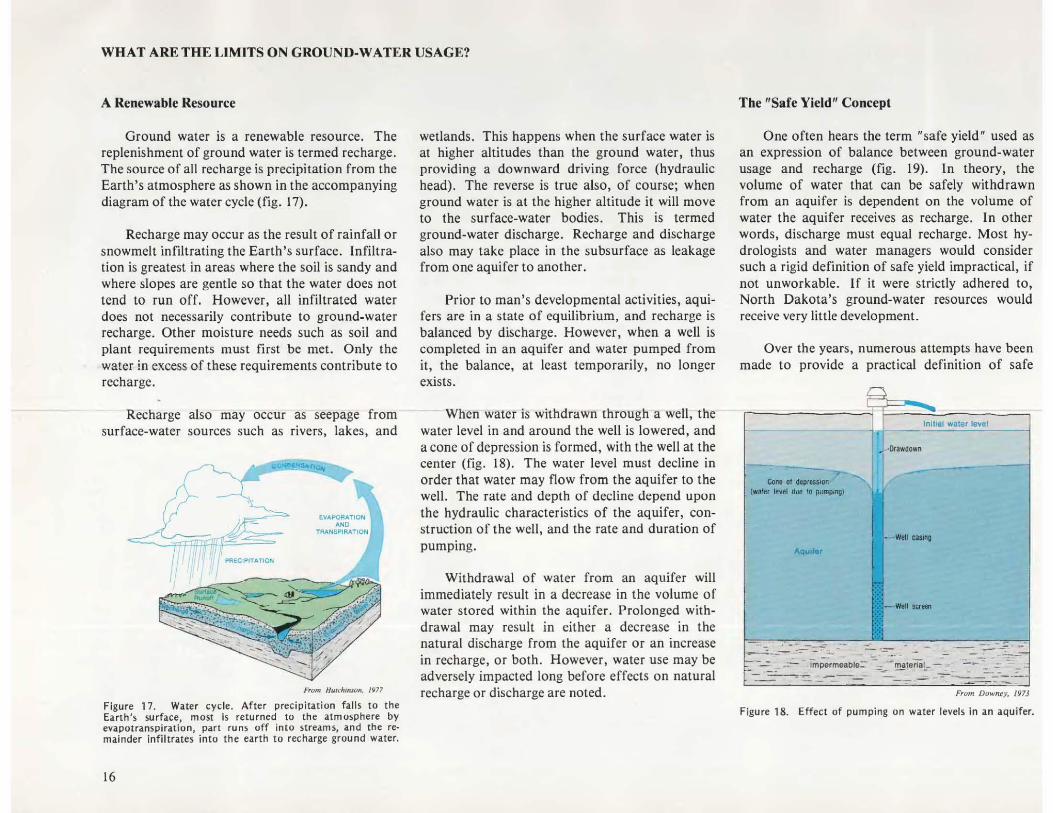
Ground water is a renewable resource. The replenishment of ground water is termed recharge. The source of all recharge is precipitation from the Earth's atmosphere as shown in the accompanying diagram of the water cycle (fig. 17).
Recharge may occur as the result of rainfall or snowmelt infiltrating the Earth's surface. Infiltration is greatest in areas where the soil is sandy and where slopes are gentle so that the water does not tend to run off. However, all infiltrated water does not necessarily contribute to ground-water recharge. Other moisture needs such as soil and plant requirements must first be met. Only the water in excess of these requirements contribute to
recharge.
Recharge also may occur as seepage from surface-water sources such as rivers, lakes, and
From Hu(chinJCIf', /977
Figure 17. Water cycle. After precipitation fall s to the Earth 's surface, most is returned to the atmosphere by evapotranspiration, part rum> off into streams, and the remainder infiltrates into the earth to recharge ground water.
16
wetlands. This happens when the surface water is at higher altitudes than the ground water, thus providing a downward driving force (hydraulic head). The reverse is true also, of course; when ground water is at the higher altitude it will move to the surface-water bodies. This is termed ground-water discharge. Recharge and discharge also may take place in the subsurface as leakage from one aquifer to another.
Prior to man's developmental activities, aquifers are in a state of equilibrium, and recharge is balanced by discharge. However, when a well is completed in an aquifer and water pumped from it, the balance, at least temporarily, no longer exists.
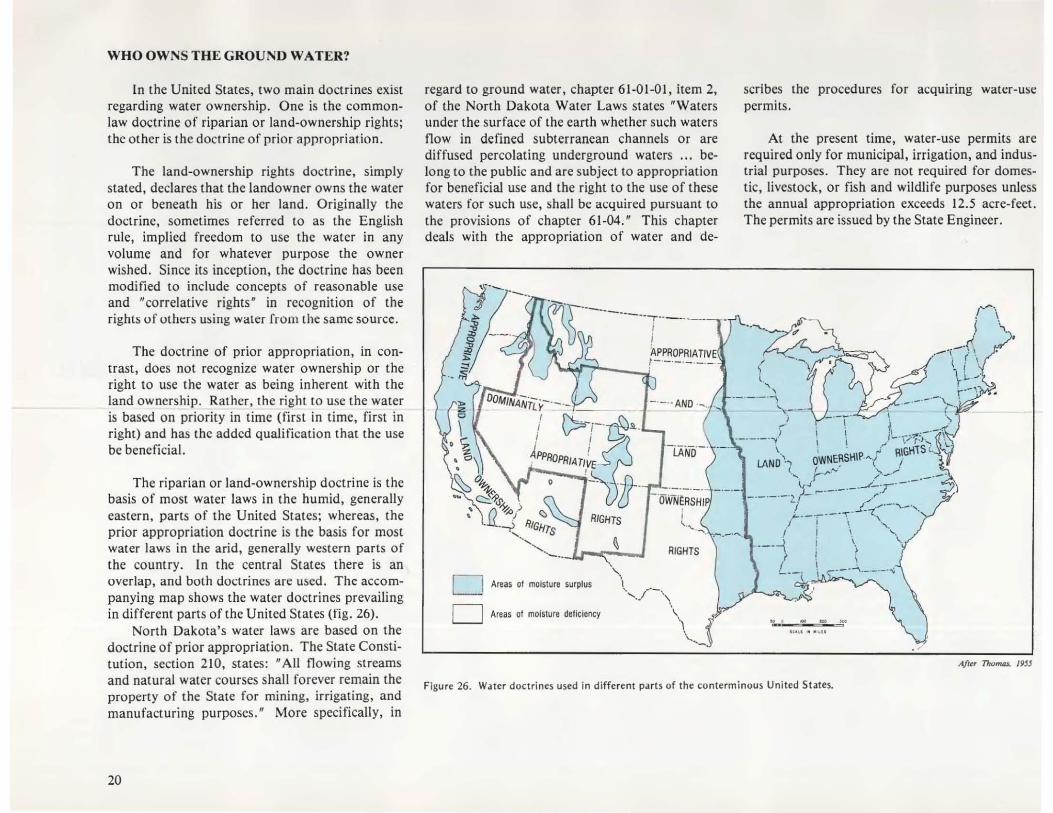
When water is withdrawn through a well, the water level in and around the well is lowered, and a cone of depression is formed, with the well at the center (fig. 18). The water level must decline in order that water may flow from the aquifer to the well. The rate and depth of decline depend upon the hydraulic characteristics of the aquifer, construction of the well, and the rate and duration of pumping.
Withdrawal of water from an aquifer will immediately result in a decrease in the volume of water stored within the aquifer. Prolonged withdrawal may result in either a decrease in the natural discharge from the aquifer Or an increase in recharge, or both. However, water use may be adversely impacted long before effects on natural recharge or discharge are noted .
The "Safe Yield" Concept
One often hears the term "safe yield' used as an expression of balance between ground-water usage and recharge (fig. /9). In theory, the volume of water that can be safely withdrawn from an aquifer is dependent on the volume of water the aquifer receives as recharge. In other words, discharge must equal recharge. Most hydrologists and water managers would consider such a rigid definition of safe yield impractical, if not unworkable. If it were strictly adhered to, North Dakota's ground-water resources would receive very little development.
Over the years, numerous attempts have been made to provide a practical definition of safe
r ' l Inltisl wBter level
, ·Drawaown
.----- -
- well sa_
Ffom Downey, 197}
Figure 18. Effect of pumping on water levels in an aquifer.

yield, but without much success (Kazmann, 1965, p. 158-161). Some definitions were concerned only with the quantity of water that could be withdrawn from an aquifer without producing severe water-level declines. These led to the inevitable problem of trying to define acceptable water-level declines. Other definitions included economic aspects such as energy costs. The cost of pumping water from great depths can become prohibitively expensive, as has already occurred in some parts of the United States. Still others included reference., t.o wat.er quality. As t.he hydraulic head within an aquifer is decreased by withdrawals, water of a different quality may move into the aquifer from another source. This is not to say that the change in quality is always for the worse, but it commonly is.
w
~ a: ~ 10
" z 5 " ;:
" ~ w OJ
.... " ilj u. Z - '" .J w
~ 0: " W .... -< ;:
"75 " 76 "" 1978
From Rondkh. /98/
Figure 19. Annual water-level decline and rise in an observation well. Declines are caused by pumping during the irrigation season and rises are caused by recharge during the non-growing season. The concept of "safe yield" is only partly achieved because there is an overall net decline.
Ground-Waler "Mining"
Another term commonly associated with ground-water use is ground-water "mining. " Ground-water mining occurs when water is withdawn at rates faster than it is replenished. The usual result is declining water levels, as illustrated in figure 20. It is unfortunate that this term ever came into use because, to many, it has an undesirable connotation and is associated with exploitation or irresponsible use of ground water. Yet, almost all aquifers are in places and at times mined. For example, the Dakota Sandstone aquifer in southeastern North Dakota and adjacent areas has been virtually mined since the first well was drilled into it in 1886.
Obviously such concepts as safe yield and ground-water mining are difficult to define and quantify. The more we learn about ground-water occurrence the more we realize that the problems of ground-water use must be dealt with on an aquifer-by-aquifer basis. This is particularly true of the unconsolidated aquifers of glacial origin in North Dakota. Instead of these terms, we probably should be thinking in terms of best management practice or optimum development. These and other aspects of aquifer management are discussed in greater detail further in this report.
~
M
57
w
" ~ -< U. 0: :J
'" Cl " z 5 ;: ~ 0 ~ w OJ
M tu w u.
;:; 67
.J w >
~ w ~
0: w ....
" -< ;:
"
"
i" n z 20 0 .. • • " ~ • z g • < 0 u
"" '~7 , .. , .. 1970
Fig. 20 From Randich, 1977
Figure 20. Declining wat~r level. When aquifers are pumped at rates faster than they arc receiving recharge, water levels will continue to decline. This hydrograph is for a municipalsupply well in north-central North Dakota. The well was eventually abandoned, and a new well constructed in a more favorable location.
17

HOW DOES GROUND WATER INTERACT WITH STREAMS, LAKES, AND WETLANDS?
Ground water is only one phase of a vast system of water transport--ocean to atmosphere to land and back to ocean again, in repeated cycles. In the process, ground water may at times and in places be discharging from aquifers to surfacewater bodies, or vice versa, depending on head relationships and hydraulic connection (fig. 21) . As would be expected, the importance of this interaction to the water user varies greatly from place to place.
Interaction with Streams
Probably the best example of ground-water interaction with streamflow in North Dakota is along the Sheyenne River in the southeastern part of the State (fig. 22). Studies have shown that in a 52-mile reach southwest of Kindred, where the river flows through a large, thick sand aquifer (Sheyenne delta), ground-water discharge into theriver is as much as 28.8 ft3 / s during the fall (Paulson, 1964, p. 0181). The increase in discharg. is shown on tho accompanying graph on the following page (fig. 23) .
• Figure 21, Interaction of ground water with stream, The water table is higher than the stream level at pai nt a, and ground water discharges (0 the stream. Vegetation b, inte r· cepts some of the ground water before it reaches the stream and discharges it into the atmosphere by a process known as transpiration. The shal low water body at point c is higher than the water table and provides recharge to the ground water.
Figu re 22. Sheyenne River southwest of Kindred in August .. 1973. Streamflow at this time of year is derived mainly from gro und· water discharge.
18
[n contrast, records show that little or no ground water is discharged into the Sheyenne River in the reach from Kindred northeast to its confluence with the Red River. [n fact, streamflow is decreased in this reach due to evapotranspiration losses. If it were not for the groundwater discharge, at times augmented by releases from Lake Ashtabula (a manmade reservoir north of Valley City), very little streamflow, if any, would be contributed to the Red River of the North from the Sheyenne River except during times of surface runoff.
Interaction with Lakes and Wellands
Questions often arise concerning the effects of lakes (including manmade lakes) and wetlands (locally referred to as sloughs or prairie potholes)
on ground-water levels. For example, would a significant rise in a lake level or the creation of a new lake by impoundment cause significant and possibly detrimental rises in nearby ground-water levels? Conversely, would the lowering of a lake level or the complete drainage of a lake or wetland significantly affect nearby ground-water levels? Unfortunately, the answers to questions such as these usually are not readily apparent and require rather intensive hydrologic studies. One needs to know the altitude of the lake or wetland in relation to the ground-water levels, but also other factors such as the rate and direction of ground-water movement and the rate of evapotranspiration in the area.

Valley Ctly rl )
11) 20 3CI 40 RIVER MILES ! ! ! !
Downstream _
l Isbon (b)
•
•
~
~
~
c • • ,
Studies to date in North Dakota hav~ not been very conclusive, primarily because of the inability to quantify certain hydrologic characteristics needed to properly describe the ground-water flow systems. Where there is good hydraulic connection between ground-water and surface-water systems, significantly altering one obviously will alter the other.
The problems become much more difficult to resolve in areas where hydraulic connections are limited. The questions relating to the effects of wetland (fig. 24) drainage on ground-water levels and ground-water recharge are very difficult to answer, quantitatively. Winter and Carr (1980, p. I) in a study of a wetland complex in Stutsman County, N. Oak., state, " ... some wetlands appear
Kindred (e) West Fargo (d)
From PQu/S01l, /964
.. Figure 23 , Average discharge in Sheyenne River during faU of 1963. Measurements showed that river discharge increased significantly in 52· mile reach upstream from Kindred because of ground-water inflow.
Figure 24. Aer ial vi ew of prairie wet- .. lands In southeastern North Dakota . Wetlands store precipitation, and, in places, provide ground-water recharge. Photograph f rom North Dakota Game and Fish Department.
to recharge ground water , some wetlands are flow-through types where ground water enters one side and surface water seeps into the ground on the other side, and some wetlands are discharge points for ground water. Further, these interrelations,hips vary throughout the year" (fig. 25). Their study consisted of a small group of wetlands. When one considers the large area of wetlands in North Dakota and the erratic climate in the State, it is not difficult to understand why caution is needed in attempting to categorize the effect of wetlands in a given hydrologic situation.
Figure 25. Three types of ground-water-wetland relation· .. ships. Some wetlands discharge gruund witltr tu tht surfa l:t where it is lost to evapotranspiration (A ), some discharge water downward and provide ground-water recharge (8), and others are sources of both recharge and disl:harge (e).
land surface INFLOW Water Table
Water lurface
---' ~ I t \
" Land surface OUTFLOW
Water IUri.CO
,- Water table
8
THROUGH FLOW Land surfacil
W" llJf wrlacll Water lable
-,/// "'-
C
From S/0411, /971
19
WHO OWNS THE GROUND WATER?
In the United States, two main doctrines exist regarding water ownership. One is the commonlaw doctrine of riparian or land-ownership rights; the other is the doctrine of prior appropriation.
The land-ownership rights doctrine, simply stated, declares that the landowner owns the water on or beneath his or her land. Originally the doctrine, sometimes referred to as the English rule, implied freedom to use the water in any volume and for whatever purpose the owner wished. Since its inception, the doctrine has been modified to include concepts of reasonable use and "correlative rights' in recognition of the rights of utht:rs using waler from the same source.
The doctrine of prior appropriation, in contrast, does not recognize water ownership or the right to use the water as being inherent with the land ownership. Rather, the right to use the water is based on priority in time (first in time, first in right) and has the added qualification that the use be beneficial.
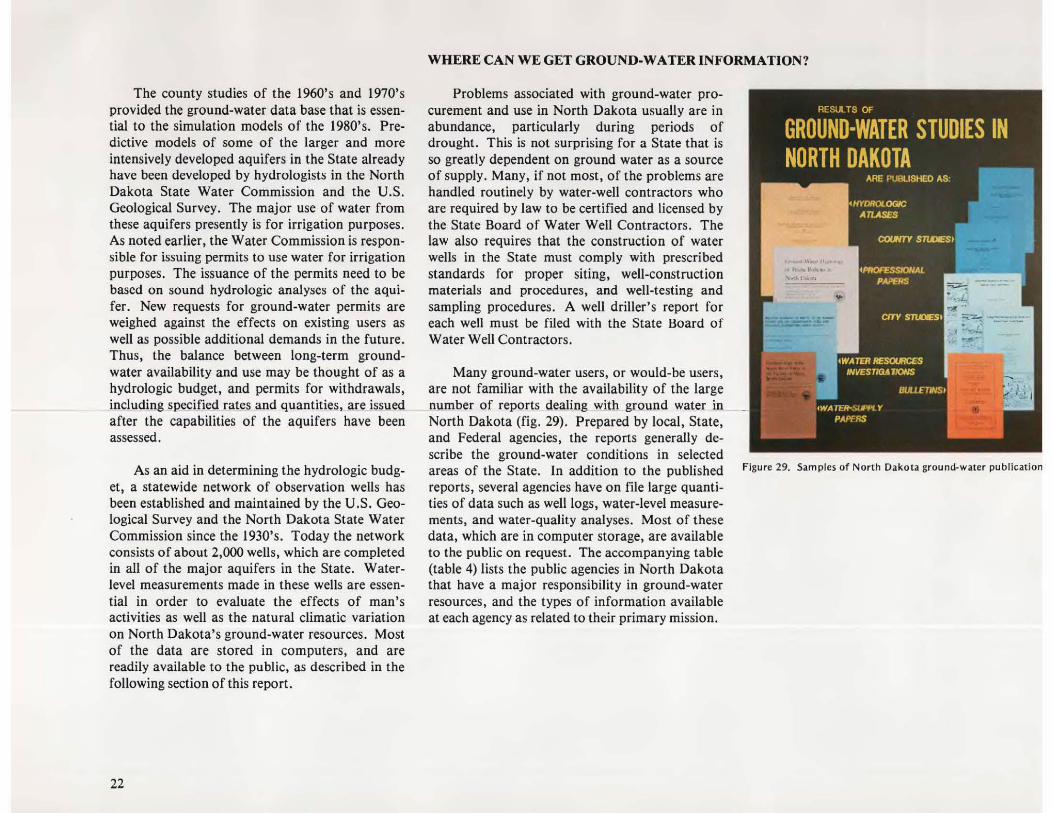
The riparian or land-ownership doctrine is the basis of most water laws in the humid , generally eastern, parts of the United States; whereas, the prior appropriation doctrine is the basis for most water laws in the arid, generally western parts of the country. In the central States there is an overlap, and both doctrines are used. The accompanying map shows the water doctrines prevailing in different parts of the United States (fig. 26).
North Dakota'S water laws are based on the doctrine of prior appropriation. The State Constitution, section 210, states: • All flowing streams and natural water courses shall forever remain the property of the State for mining, irrigating, and manufacturing purposes.' More specifically, in
20
regard to ground water, chapter 61-01-01, item 2, of the North Dakota Water Laws states "Waters under the surface of the earth whether such waters flow in defined subterranean channels or are diffused percolating underground waters ... belong to the public and are subject to appropriation for beneficial use and the right to the use of these waters for such use, shall be acquired pursuant to the provisions of chapter 61-04.' This chapter deals with the appropriation of water and de-
o o
~·-··------I'---' --' i i ~PPROPRIATIVE
~"''--_....ir- ·- · - . - . - . - .
- ·- ·- AND ._.
OWN~RSHI , RIGHTS l .~ ..... . - .- ......
RIGHTS
Areas 01 moisture surplus
Areas of moisture deUclency
scribes the procedures for acquiring water-use permits.
At the present time, water-use permits are required only for municipal, irrigation, and industrial purposes. They are not required for domestic, livestock, or fish and wildlife purposes unless the annual appropriation exceeds 12.5 acre-feet. The permits are issued by the State Engineer.
A/Itt 71romoJ. 19JJ
Fi gure 26. Water doctrines used in different parts of the conterminous United States.

HOW CAN WE BEST USE THE GROUND- WATER RESOURCES IN NORTH DAKOTA?
Most people probably would agree to the need for a planned and orderly development of the State's ground-water resources. Haphazard or piecemeal development generally leads to detrimental results; economically, environmentally, or both.
Not many years ago, the effects of a given plan of ground-water development could be assessed only in very qualitative terms. Today, thanks mainly to computer technology, more quantitative assessments can be made. It is possible to simulate or model large complex groundwater flow systems with the aid of computers so that the effects of various forms of stress on the systems may be reasonably understood. The stresscs may be the result of climate, such as prolonged drought conditions, or the result of man's activities, such as pumping water from wells.
However, even the most sophisticated computer technology cannot provide the correct answers unless the "real-world" system to be simulated in the computer model is thoroughly understood. For example, if we wish to know how many productive wells a given aquifer can support with minimum interference with each other (fig. 27), we must know the physical dimensions of the aquifer, its capacity to transmit and to store water, as well as the volume of recharge it receives and the volume of water that it naturally discharges. It generally is necessary to collect a substantial quant.it.y of geologic and hydrologic data and to carefully analyze and interpret the data to gain an understanding of how the aquifer functions. The degree to which this understanding is obtained will determine the accuracy of the predictions made by the computer.
Another example may involve the interaction between ground water and surface-water bodies. Where and when streamflow is maintained by ground-water discharge, depletion of groundwater storage (fig. 28) may result in decreased streamflow. Problems may then occur if prior appropriators, using water from the stream, find their source of supply decreasing. Again, the system may be modeled with the aid of a computer, and solutions obtained, such as how much water can be pumped from the aquifer; where, within the aquifer the pumpage should occur and at what times of the year, without detrimentally affecting the streamflow. As in the first example, a large quantity of geologic and hydrologic information is needed to design the model.
OOKl'latglng well II / GrOUnd tlJrf.ce
r--=
From U.S. Blluau 0/ RHMmlll 'Off, 1977
Figure 27. Overlapping pumping cones. When morc than onf well is constructed In the same aquifer they need (0 be spaced far enough apart so that interference is minimized. However, for dewaterinJt wells such as used in construction work , interference may be desirable in order to achieve maximum drawdown.
Figure 28, Well diverting water from streamflow. Where an aquifer is in hydraulic connection with a stream, water may be diverted from the stream to the aquifer and ultimately to ground-water lise by means ot well pumping.
These are but two examples of the many problems that may be associated with large-seale ground-water usage. The variations are almost unlimited. Fortunately, North Dakota has an excellent on-going program designed to insure the safe and orderly development of the State's ground-water resources. During the past 25 years the ground-water resources have been systematically identified and described on a county-bycounty basis. The program has been a cooperative effort involving each county of the State, the North Dakota State Water Commission, the North Dakota Geological Survey, and the U.S. Geological Survey. In some counties where there are large areas of federally owned lands, other Federal agencies such as the U.S. Forest Service and U.S. Bureau of Land Management also have been involved. The last county ground-water ~tudy was begun in 1979 and will be completed In 1983.
21
The county studies of the 1960's and 1970's provided the ground-water data base that is essential to the simulation models of the 1980's. Predictive models of some of the larger and more intensively developed aquifers in the State already have been developed by hydrologists in the North Dakota State Water Commission and the U.S. Geological Survey. The major use of water from these aquifers presently is for irrigation purposes. As noted earlier, the Water Commission is responsible for issuing permits to use water for irrigation purposes. The issuance of the permits need to be based on sound hydrologic analyses of the aquifer. New requests for ground-water permits are weighed against the effects on existing users as well as possible additional demands in the future. Thus, the balance between long-term groundwater availability and use may be thought of as a hydrologic budget, and permits for withdrawals, including specified rates and quantities, are issued after the capabilities of the aquifers have been assessed.
As an aid in determining the hydrologic budget, a statewide network of observation wells has been established and maintained by the U.S. Geological Survey and the North Dakota State Water Commission since the 1930's. Today the network consists of about 2,000 wells, which are completed in all of the major aquifers in the State. Waterlevel measurements made in these wells are essential in order to evaluate the effects of man's activities as well as the natural climatic variation on North Dakota's ground-water resources. Most of the data are stored in computers, and are readily available to the public, as described in the following section of this report.
22
WHERE CAN WE GET GROUND-WATER INFORMATION?
Problems associated with ground-water procurement and use in North Dakota usually are in abundance, particularly during periods of drought. This is not surprising for a State that is so greatly dependent on ground water as a source of supply. Many, if not most, of the problems are handled routinely by water-well contractors who are required by law to be certified and licensed by the State Board of Water Well Contractors. The law also requires that the construction of water wells in the State must comply with prescribed standards for proper siting, well-construction materials and procedures, and well-testing and sampling procedures. A well driller's report for each well must be filed with the State Board of Water Well Contractors.
Many ground-water users, or would-be users, are not familiar with the availability of the large number of reports dealing with ground water in North Dakota (fig. 29) . Prepared by local, State, and Federal agencies, the reports generally describe the ground-water conditions in selected areas of the State. In addition to the published Figure 29. Samples of North Dakota ground-water publication
reports, several agencies have on file large quanti-ties of data such as well logs, water-level measure-ments, and water-quality analyses. Most of these data, which are in computer storage, are available to the public on request. The accompanying table (table 4) lists the public agencies in North Dakota that have a major responsibility in ground-water resources, and the types of information available at each agency as related to their primary mission.
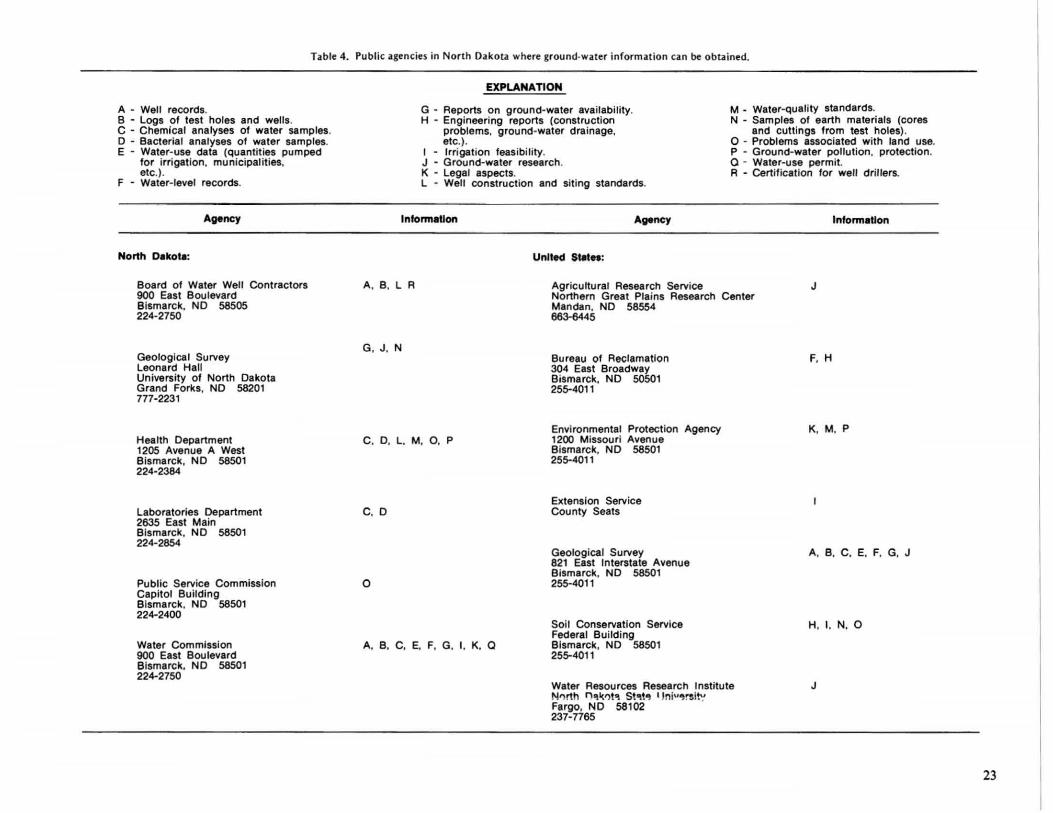
Table 4. Public agencies in North Dakota where ground· water information can be obtained.
A - Well records. B - logs of test holes and wells . C - Chemical analyses of water samples. o - Bacterial analyses of water samples. E - Water-use data (quantities pumped
for irrigation. municipalities, etc. ).
F - Water-level records.
Agency
Board of Water Well COntractors 900 East Bou levard Bismarck, NO 58505 224-2750
Geological Survey leonard Hall University of North Dakota Grand Forks, NO 58201 777-2231
Health Department 1205 Avenue A West Bismarck, NO 58501 224-2384
laboratories Department 2635 East Main Bismarck, NO 58501 224-2854
Public Service Commission Capitol Building Bismarck. NO 58501 224-2400
Water Commission 900 East Boulevard Bismarck, NO 58501 224-2750
A, B. L R
G, J, N
EXPLANATION
G - Reports on ground-water availability. H - Engineering reports (construction
problems, ground-water drainage, etc.).
I - Irrigat ion feasibility. J - Ground-water research. K - legal aspects. l - Well construction and siting standards.
Agency
Unllocl S~";
Agricultural Research Service
M _ Water-quality standards. N - Samples of earth materials (cores
and cuttings from test holes) . o - Problems associated with land use. P - Ground-water pollution, protection. a - Water-use permit. R - Certif ication for well drillers.
J Northern Great Plains Research Center Mandan, NO 58554 883-6445
Bureau of Reclamation 304 East Broadway Bismarck, NO 50501 255-4011
F, H
K, M, P C, 0 , L, M, 0, P
Environmental Protection Agency 1200 Missouri Avenue
C, 0
o
A, B, C, E, F, G, i, K, a
Bismarck, NO 58501 255-4011
Extension Service County Seats
Geological Survey 821 East Interstate Avenue Bismarck, NO 58501 255-4011
Soil Conservation Service Federal Building Bismarck, NO 58501 255-4011
Water Resources Research Institute N,.,rth f"'!",I(I)!." S!IIi!.!4IJ I Jniu 4IJ!'sit': Fargo, NO 58102 237-7765
A, B, C, E, F, G, J
H, I. N, 0
J
23
SELECTED REFERENCES
Ackerman, D. J. , 1980, Ground-water resources of Morton County, North Dakota: North Dakota State Water Commission County Ground-Water Studies 27, Part III, and North Dakota Geological Survey Bulletin 72, Part Ill, 51 p.
Anna, L. 0. , 1981, Ground-water resources of Billings, Golden Valley, and Slope Counties, North Dakota: North Dakota State Water Commission County Ground-Water Studies 29, Part III, and North Dakota Geological Survey Bulletin 76, Part III, 56 p.
Armstrong, C. A., 1967, Geology and groundwater resources of Divide County, North Dakota; Part III, Ground-water resources: North Dakota State Water Commission County Ground-Water Studies 6 and North Dakota Geological Survey Bulletin 45, 56 p.
___ 1969, Geology and ground-water resources of Williams County, North Dakota; Part III, Hydrology: North Dakota State Water Commission County Ground-Water Studies 9 and North Dakota Geological Survey Bulletin 48 , 82p.
___ 1971, Ground-water resources of Burke and Mountrail Counties: North Dakota State Water Commission County Ground-Water Studies 14, Part III, and North Dakota Geological Survey Bulletin 55 , Part III, 86 p.
___ 1978, Ground-water resources of Emmons County, North Dakota: North Dakota State Water Commission County Ground-Water Studies 23, Part III, and North Dakota Geological Survey Bulletin 66, Part III , 43 p.
___ 1980, Ground-water resources of Dickey and LaMoure Counties, North Dakota: North Dakota State Water Commission County Ground-Water Studies 28, Part III, and North Dakota Geological Survey Bulletin 70, Part III, 61 p.
___ 1982, Ground-water resources of Ransom and Sargent Counties, North Dakota: North Dakota State Water Commission County
24
Ground-Water Studies 31, Part III, and North Dakota Geological Survey Bulletin 69, Part 111 , 51 p .
Baker, C., H., Jr. , and Paulson , Q. F., 1967, Geology and ground-water reSOurces of Richland County, North Dakota; Part III, Ground-water resources: North Dakota State Water Commission County Ground-Water Studies 7 and North Dakota Geological Survey Bulletin 46, 45 p.
Bluemle, J . P ., 1977, The face of North Dakota, the geologic story: North Dakota Geological Survey Educational Series II, 73 p.
Bradley, Edward, Petri, L. R., and Adolphson, D. G., 1963, Geology and ground-water resources of Kidder County, North Dakota; Part Ill, Ground water and chemical quality of water: North Dakota State Water Commission County Ground-Water Studies I and North Dakota Geological Survey Bulletin 36, 38p.
Burkart, M. R., 1981, Ground-water resources of Sheridan County, North Dakota: North Dakota State Water Commission County Ground-Water Studies 32, Part III, and North Dakota Geological Survey Bulletin 75, Part 111,32 p.
Buturla, Frank, Jr. , 1970, Geology and groundwater resources of Wells County, North Dakota: Part Ill, Ground-water resources; North Dakota State Water Commission County Ground-Water Studies 12 and North Dakota Geological Survey Bulletin 51, 57 p .
Carlson, C. G., 1973 , Generalized bedrock geologic map of North Dakota: North Dakota Geological Survey Miscellaneous Map 16.
Croft, M. G., 1973, Ground-water resources of Mercer and Oliver Counties, North Dakota: North Dakota State Water Commission County Ground-Water Studies 15, Part III, and North Dakota Geological Survey Bulletin 56, Part III, 81 p.
___ 1978, Ground-water resources of Adams and Bowman Counties, North Dakota: North Dakota State Water Commission County Ground-Water Studies 22, Part III, and North
Dakota Geological Survey Bulletin 65, Part 111,54 p.
Deutsch, Morris, 1963, Ground-water contamination and legal controls in Michigan: U.S. Geological Survey Water-supply Paper lo~I, 79p.
Downey, J. S., 1973, Ground-water resources of Nelson and Walsh Counties, North Dakota: North Dakota State Water Commission County Ground-Water Studies 17, Part m, and North Dakota Geological Survey Bulletin 57, Part III, 57 p.
Downey, J . S. , and Armstrong, C. A., 1977, Ground-water resources of Griggs and Steele Counties, North Dakota: North Dakota State Water Commission County Ground-Water Studies 2 (, Part III, and North Dakota Geological Survey Bulletin 64, Part III , 33 p.
Downey, J. S., and Paulson, Q. F., 1974, Predictive modeling of effects of the planned Kindred Lake on ground-water levels and discharge, southeastern North Dakota: U.S. Geological Survey Water-Resources Investiga tions 30-74, 22 p.
Durfor, C. N., and Becker, Edith, 1964, Publi, water supplies of the 100 largest cities in th United States, 1962: U.S. Geological Surve) Water-Supply Paper 1812, 364 p.
Gough, L. P ., and others, 1979, Element concen trations toxic to plants, animals, and man U.S. Geological Survey Bulletin 1466, 80 p.
Hutchinson, R. D., 1977, Ground-water resource_ of Cavalier and Pembina Counties, Norti Dakota: North Dakota State Water Commis sion County Ground-Water Studies 20, Par· III, and North Dakota Geological Surve·. Bulletin 62, Part llI, 68 p.
Hutchinson, R. D., and KJausing, R. L., 1980 Ground-water resources of Ramsey County North Dakota: North Dakota State Wate, Commission County Ground-Water Studie 26, Part III, and North Dakota Geologica Survey Bulletin 71, Part III , 36 p .

Huxel, C. J., Jr., and Petri , L. R., 1965, Geology and ground-water resources of Stutsman County, North Dakota; Part 111, Ground water and its chemical quality: North Dakota State Water Commission County GroundWater Studies 2 and North Dakota Geological Survey Bulletin 41,58 p.
Jensen, H. M ., and Klausing, R. L., 1971, Geology and ground-water resources of Traill County; Part Ill, Ground-water resources: North Dakota State Water Commission County Ground-Water Studies 10 and North Dakota Geological Survey Bulletin 49, 40 p.
Kazmann, R. G ., 1965, Modern hydrology: New York, Harper & Row , 301 p.
Kelly, T . E ., 1966, Geology and ground-water resources of Barnes County, North Dakota; Part III , Ground-water resources: North Dakota State Water Commission County Ground-Water Studies 4 and North Dakota Geological Survey Bulletin 43, 67 p.
Kelly, T. E., and Paulson, Q. F., 1970, Geology and ground-water resources of Grand Forks County; Part III , Ground-water resources: North Dakota State Water Commission County Ground-Water Studies 13 and North Dakota Geological Survey Bulletin 53, 58 p.
Klausing, R. L., 1968, Geology and ground-water resources of Cass County, North Dakota; Part 1Il, Hydrology: North Dakota State Water Commission County Ground-Water Studies 8 and North Dakota Geological Survey Bulletin 47, 77 p .
___ 1974, Ground-water resources of McLean County, North Dakota: North Dakota State Water Commission County Ground-Water Studies 19, Part III, and North Dakota Geological Survey Bulletin 60, Part 111, 73 p.
_ __ 1979, Ground-water resources of Dunn County, North Dakota: North Dakota State Water Commission County Ground-Water Studies 25, Part 111, and North Dakota Geological Survey Bulletin 68 , Part 111, 48 p.
___ 1 ~g l, Ground-water resources o f McInlosh County, North Dakota: North Dakota State Water Commission County Ground-Water
'I) u.s. GOVERNMENT PRINTING OFFICE: 1983 - 421 - 594 :) 06
Studies 30, Part 111, and North Dakota Geological Survey Bulletin 73, 37 p .
Miller, D . W., 1980, Waste disposal effects on ground water: Berkeley, Premier Press , 512 p.
North Dakota State Water Commission, compilers, 1977, North Dakota water laws: 345 p.
___ 1982, Map showing glacial-drift aquifers ill North Dakota and estimated potential yields.
Paulson, Q. F ., 1964, Geologic factors affecting discharge of the Sheyenne River in southeastern North Dakota: U.S. Geological Survey Professional Paper 501 -D, p. DI77-DI81.
Pettyjohn , W. A., and Hutchinson, R. D., 1971, Ground-water resources of Renville and Ward Counties: North Dakota State Water Commission County Ground-Water Studies \I, Part 1II, and North Dakota Geological Survey Bulletin 50, Part 1II, lOOp.
Randich, P . G., 1977, Ground-water resources of Benson and Pierce Counties, North Dakota: North Dakota State Water Commission County Ground-Water Studies 18, Part III, and North Dakota Geological Survey Bulletin 59, Part 1II, 76 p .
___ 1979, Ground-water resources of Grant and Sioux Counties, North Dakota: North Dakota State Water Commission County Ground-Water Studies 24, Part 111, and North Dakota Geological Survey Bulletin 67, Part 111 , 49 p.
___ 1981, Ground-water resources of McHenry County, North Dakota: North Dakota State Water Commission County Ground-Water Studies 33, Part 111 , and North Dakota Geological Survey Bulletin 74, Part 111, 47 p.
Randich, P. G. , and Hatchett, J . L. , 1966, Geology and ground-water resources of Burleigh County, North Dakota; Part III, Groundwater resources: North Dakota State Water Commission County Ground-Water Studies 3 and North Dakota Geological Survey Bulletin 42, 92 p.
Sloan , C. E., 1972, Ground-water hydrology of prairie potholes in North Dakota: U.S. Geological Survey Professional Paper 585C, 28 p.
Thomas, H . E ., 1955, Water rights in areas of ground-water mining: U.S. Geological Survey Circular 347, 16 p.
Trapp, Henry, Jr., 1968, Geology and groundwater resources of Eddy and Foster Counties, North Dakota; Part Ill, Ground-water resources: North Dakota State Water Commission County Ground-Water Studies 5 and North Dakota Geological Survey Bulletin 44, \lOp.
Trapp, Henry, Jr., and Croft, M . G. , 1975, Geology and ground-water resources of Hettinger and Stark Counties North Dakota: North Dakota State Water Commission County Ground-Water Studies 16, Part 1, 51 p.
U .S. Envrionmental Protection Agency, 1976 (1978), National interim primary drinking water regulations: Office of Water Supply, U.S. Environmental Protection Agency, Report EPA-570/ 9-76-003, 159 p.
_ __ 1977, National secondary drinking water regulations: Federal Register, v. 42, no . 62, Thursday, March 31, 1977, Part I, p . 17143-17147.
U.S. Geological Survey, 1981, Water resources data for North Dakota: U.S. Geological Survey Water-Data Report ND-80-1, 803 p.
U .S. Salinity Laboratory Staff, 1954, Diagnosis and improvement of saline and alkali soils: U.S. Department of Agriculture , Agriculture Handbook no. 60, 100 p.
Wenzel, L. K., and Sand, H . H ., 1942, Water su pply of the Dakota Sandstone in the Ellendale-Jamestown area, North Dakota: U.S. Geological Survey Water-Supply Paper 889-A, 81 p .
Winter, T. c., and Carr, M. R., 1980, Hydrologic setting of wetlands in the Cottonwood Lake area, Stutsman County, North Dakota: U.S . Geological Survey Water-Resources Investigations 80-99, 42 p.
25

Paulso~UIDE TO NORTH DAKOTA'S GROUND-WATER RF.sOURCES--U.S. Geological Survey Water~'~uply Paper 2236