guide to analyze natural resources in national … · guide to analyze natural resources in...
TRANSCRIPT

GUIDE TO ANALYZE NATURAL RESOURCES IN NATIONAL
ACCOUNTS
EXECUTIVE SUMMARY
This Guide to Analyze Natural Resources in the National Accounts (The Guide) presents
and explains a set of standard Template Tables using the concepts recommended in the
United Nations’ System of National Accounts 2008 (2008 SNA). Economic activity
associated with natural resources is macro-critical for about 30 percent of Fund
member countries. Nevertheless, the available data on natural resources to guide
policymaking and assess economic performance have often been limited. The Template
Tables will guide compilation of national accounts for natural resources, and provide
indicators for understanding the macroeconomic impact of changes in natural resource
output and prices. Also, as part of the initiatives to develop national accounts beyond
GDP, The Guide goes beyond production and covers other areas such as income,
financing, labor, terms of trade, and depletion. It also takes into account Goal 5 of the
UN Sustainable Development Goals (gender equality) by showing employment by
gender.
The Guide is consistent with, and builds upon, the Template to Collect Data on
Government Revenues from Natural Resources (GFS Template) by expanding coverage to
the full suite of economic units and macroeconomic accounts. It also addresses the
broader range of analytical questions that arise in national accounts.
The Guide has been field tested with a diverse range of stakeholders, including
statistical compilers. Country tables will be made available on the Fund’s website with
the authorities’ consent. The Statistics Department will collaborate with selected area
department teams and other stakeholders to implement The Guide in countries, as
appropriate.
This project was supported by the Managing Natural Resource Wealth-Topical Trust
Fund (MNRW-TTF) with funding provided by Australia, the European Union, Kuwait, the
Netherlands, Norway, Oman, and Switzerland.
January 17, 2017

GUIDE TO ANALYZE NATURAL RESOURCES IN NATIONAL ACCOUNTS
2 INTERNATIONAL MONETARY FUND
Approved By Jose Roberto Rosales
Prepared by Chris Hinchcliffe, Marshall Reinsdorf, and Michael Stanger
CONTENTS
GLOSSARY __________________________________________________________________________________________ 3
INTRODUCTION ____________________________________________________________________________________ 4
DEFINITION OF NATURAL RESOURCES AND NATURAL RESOURCE PRODUCTS AND
INDUSTRIES ________________________________________________________________________________________ 6
A. Natural Resource Products ________________________________________________________________________ 6
B. Natural Resource Industries _______________________________________________________________________ 9
C. Processing and Transport of Imported Natural Resources _______________________________________ 11
TEMPLATE TABLES FOR NATURAL RESOURCES IN THE NATIONAL ACCOUNTS _______________ 11
A. General Considerations __________________________________________________________________________ 11
B. Template on the Proportion of Natural Resource Industries to GDP _____________________________ 12
C. Distribution of the Income Generated by the Natural Resource Industries _______________________ 14
D. Labor in the Natural Resource Industries ________________________________________________________ 17
E. Contributions of the Natural Resource Industries to the Volume and Deflator Change in GDP ___ 18
F. Terms of Trade Effects ____________________________________________________________________________ 20
G. Quarterly Indicators for GDP and Exports of Goods and Services ________________________________ 20
BOXES
1. Natural Resource Products ________________________________________________________________________ 8
2. Fixed Assets and Services Produced by Natural Resource Industries ______________________________ 9
3. Industries Engaged in Natural Resource Activities ________________________________________________ 10
APPENDIX
I. Template Tables for National Accounts on Natural Resources ____________________________________ 22

GUIDE TO ANALYZE NATURAL RESOURCES IN NATIONAL ACCOUNTS
INTERNATIONAL MONETARY FUND 3
Glossary
2008 SNA System of National Accounts 2008
CPC Central Product Classification
CPI Consumer Price Index
EITI Extractive Industries Transparency Initiative
GFS Government Finance Statistics
ISIC International Standard Industrial Classification of All Economic Activities
MNRW-TTF Managing Natural Resource Wealth Topical Trust Fund
PPI Producer Price Index
SEEA-CF System of Environmental-Economic Accounting 2012–Central Framework
The Guide The Guide to Analyze Natural Resources in the National Accounts
VAT Value Added Tax

GUIDE TO ANALYZE NATURAL RESOURCES IN NATIONAL ACCOUNTS
4 INTERNATIONAL MONETARY FUND
INTRODUCTION1
1. The Guide to Analyze Natural Resources in the National Accounts (The Guide) presents
a set of Template Tables that show national accounts statistics on natural resources in a
standard format. Economic activity associated with natural resources is considered
macro-critical in about 30 percent of the Fund’s member countries.2 The Guide will aid in the
compilation of national accounts and in macroeconomic analysis of natural resources The natural
resources covered are those extracted and sold by the mining industries, including oil and gas.
2. The Template Tables use the concepts recommended in the United Nations’ System of
National Accounts 2008 (2008 SNA). This facilitates comparisons of the natural resource industries
with other parts of the economy and comparisons across economies. Also, as part of initiatives to
develop national accounts beyond GDP, The Guide goes beyond production and covers other areas
such as income, financing, labor, terms of trade, and depletion. It takes into account Goal 5 of the
UN Sustainable Development Goals (gender equality) by showing employment by gender. The Guide
is complemented by the System of Environmental-Economic Accounting 2012–Central Framework
(SEEA-CF, United Nations and others, 2014). The SEEA-CF covers measures of environmental assets
such as pollution and physical stocks of natural resources such as oil reserves.
3. The management of natural resources is an important function of government, and
statistics are needed to support analysis of macroeconomic impacts of natural resources. For
countries that rely heavily on natural resources, fluctuations in government revenues, exports,
employment, and national income caused by changes in the output and prices of natural resources
have major macroeconomic and fiscal implications. Sound policymaking when such risks are present
requires accurate, timely, and complete coverage of relevant industries in the national accounts and
analytical measures to assess the macroeconomic effects.
1 This project was directed by Claudia Dziobek and Robert Dippelsman and reviewed by Michael Davies, Robert
Heath, and Gabriel Quiros. Valuable comments were provided by Sagé De Clerck, Jemma Dridi, Segismundo Fassler,
Rodrigo Garcia-Verdu, Dominique Guillaume, Clementina Ivan-Ungureanu, Alberto Jiménez de Lucio, Gary Jones,
Gregory Legoff, Oana Luca, Maria Mantcheva, Lisbeth Rivas, Randa Sab, Alpa Shah, Bob Traa, and participants in the
Fund’s Forum for Resource-Rich Economies (FRRE). The Guide also benefited from advice by Ann Lisbet Brathaug
(Statistics Norway), Erdenesan Eldev-Ochir (National Statistics Office of Mongolia), Alain Gallais (National Institute of
Statistics and Economic Studies, France), Sanjiv Mahajan (Office for National Statistics, United Kingdom), Jonas
Moberg and Jürgen Reitmaier (Extractive Industries Transparency Initiative), Paul Roberts (Australian Bureau of
Statistics), Riana Willemse (South African Reserve Bank), and members of the United Nations Advisory Expert Group
on National Accounts. Colleagues of national statistical offices from Kyrgyz Republic, Lesotho, Mongolia, Sierra
Leone, and Zambia assisted by completing draft versions of the Template Tables. This project was supported by the
Managing Natural Resource Wealth Topical Trust Fund (MNRW-TTF) with funding provided by Australia, the
European Union, Kuwait, the Netherlands, Norway, Oman, and Switzerland.
2 See Fiscal Regimes for Extractive Industries: Design and Implementation,
http://www.imf.org/external/np/pp/eng/2012/081512.pdf, and Macroeconomic Policy Frameworks for Resource Rich
Developing Countries, http://www.imf.org/external/np/pp/eng/2012/082412.pdf. A list of 51 countries where natural
resources are macro-critical is in The Commodities Roller Coaster: A Fiscal Framework for Uncertain Times,” Fiscal
Monitor, October 2015, http://www.imf.org/external/pubs/ft/fm/2015/02/fmindex.htm.
GUIDE TO ANALYZE NATURAL RESOURCES IN NATIONAL ACCOUNTS
INTERNATIONAL MONETARY FUND 5
4. The Guide is designed to meet multiple purposes. Data are shown at a relatively high
level of aggregation, but the structure can be expanded to include data with greater granularity to
support specific user needs. The Template Tables can also be partially completed when countries
find that some of the lines in the Template Tables do not apply to them or source data are not
available to compile these data. In addition, the statistics covered here can provide context for the
reports countries submit to the Extractive Industries Transparency Initiative (EITI).
5. The Guide serves as a companion to the Template to Collect Data on Government
Revenues from Natural Resources (GFS Template). The Fund has published the Template to
Collect Data on Government Revenues from Natural Resources3 (or GFS Template) to guide the
collection and presentation of data on government revenues. Definitions of natural resource
industries and products are aligned with those of the GFS Template. However, a broader range of
questions arise in the national accounts and these require a longer list of products. For example, in
measuring output of the natural resource industries, the Template Tables include construction of
fixed assets for extraction of natural resources such as oil wells. These are not needed for
the GFS Template.
6. The Guide is the result of extensive consultation with stakeholders. A draft was posted
on the Fund’s external website and comments from many stakeholders were incorporated as
acknowledged in Footnote 1. Feedback was received during the meeting of the United Nation’s
Advisory Expert Group on National Accounts in April 2016, a meeting with the EITI Secretariat during
April 2016, and a presentation at the Ulaanbaatar City Group on Natural Resources in September
2016. The Guide was also presented at the International Association for Research in Income and
Wealth (IARIW) conference held in Dresden, Germany (August 2016).
7. The Guide has been tested in nine countries. Desk studies and field tests have been
conducted in countries with varying levels of statistical development. Field tests were conducted in
Kyrgyz Republic, Mongolia, Mozambique, and Sierra Leone and desk studies were conducted for
Australia, Canada, Chile, Lesotho, and Zambia. These have demonstrated The Guide’s suitability
regardless of the level of statistical development, and provided an opportunity to identify data
shortcomings. Further data collection will increase coverage and extend the data to generate annual
and quarterly time series.
8. The main body of The Guide comprises two sections. The first section defines the natural
resource products and industries. The second section presents and explains eight Template Tables
that guide the compilation of national accounts for natural resources and provide analytical tools for
understanding the macroeconomic impact of changes in natural resource output and prices.
3 Accessed at: http://www.imf.org/external/pubs/ft/gfs/manual/comp.htm. The Fund has also a model for Fiscal
Analysis of Resource Industries to project the fiscal impact of natural resource projects. See
http://www.imf.org/external/np/fad/fari/index.htm.

GUIDE TO ANALYZE NATURAL RESOURCES IN NATIONAL ACCOUNTS
6 INTERNATIONAL MONETARY FUND
DEFINITION OF NATURAL RESOURCES AND NATURAL
RESOURCE PRODUCTS AND INDUSTRIES
9. The 2008 SNA (paragraph 10.164) defines natural resources as nonproduced naturally
occurring assets, where nonproduced means that the assets are not created by an economic
production process. The 2008 SNA recognizes three types of nonproduced nonfinancial assets:
natural resources; contracts, leases and licenses; and purchased goodwill and marketing assets.
Natural resources can be divided into: (a) renewable resources, such as uncultivated forests and fish
stocks; (b) land; and (c) non-renewable resources, which consist mainly of deposits of minerals that
have an economic value.
10. The Guide focuses on nonrenewable natural resources. The Guide uses the concepts
recommended in the 2008 SNA and is consistent with the GFS Template. Environmental economic
accounts for natural resources are not covered. However, the Template Tables could also be applied
to some renewable natural resources.
A. Natural Resource Products
11. Natural resource products may be extracted and sold with minor processing;
alternatively, they may undergo more extensive, secondary, or downstream processing.
In The Guide, manufactured products that have undergone secondary processing (for example metal
ingots) are generally not considered to be natural resource or extractive industry products. However,
given the integration of production processes, it is not always straightforward to draw the line
between extractive and manufactured products made from natural resource inputs. Nevertheless,
the distinction is important. For example, to analyze the external current account of a country
exporting natural resources, exports should include extracted and processed natural resources such
as crude oil and diesel. On the other hand, to analyze the contribution of the extractive industries to
GDP, refined petroleum products should be included in manufacturing industries rather than
extractive industries.
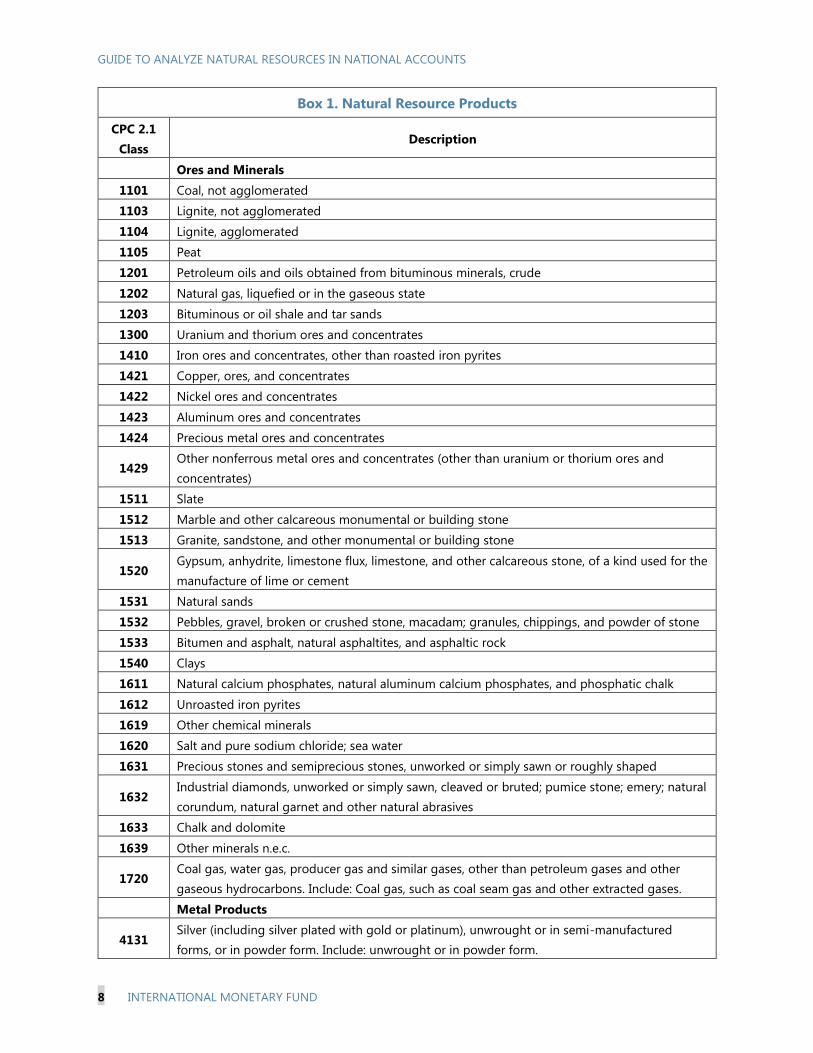
12. A list of the relevant natural resource products for The Guide is in Box 1. The products
are shown at the four-digit level of the Central Product Classification Version 2.1 (CPC 2.1).4 Although this list provides a standard definition of the natural resource products, products that have
undergone secondary processing may also be included if the available data at the enterprise level
combine the extraction and secondary processing activities. In addition, natural resources subject to
secondary processing before export should usually be taken into account when analyzing exports of
natural resource products.
13. Fixed capital assets and services produced by the natural resource industries are
considered in compiling national accounts. These are shown in Box 2, and include structures used
4 CPC version 2.1 was released in August 2015 and posted at: http://unstats.un.org/unsd/cr/registry/cpc-21.asp.
The natural resource products are identified in the GFS Template.

GUIDE TO ANALYZE NATURAL RESOURCES IN NATIONAL ACCOUNTS
INTERNATIONAL MONETARY FUND 7
for exploration or extraction, such as wells and mine shafts, or for transport via pipeline. Several
activities which contribute to mineral exploration are included in product class 8621, Support services
for mining. To compile an estimate of intellectual property products that includes mineral
exploration, as recommended in 2008 SNA paragraph 10.98, mineral exploration products must be
separately identified. This can be accomplished by creating a more detailed level of aggregation
within the CPC 2.1 subclass codes of class 8621 or by classifying all mineral exploration activities to
CPC 2.1 subclass 83413, Mineral exploration.
14. Natural resource projects have four phases: exploration, development, extraction, and
environmental remediation. Most expenses during the exploration phase, including licensing and
acquisition costs, surveys and appraisals, and drilling and test bores, are included in the fixed capital
formation as intellectual property products (2008 SNA, paragraph 10.106). Fixed assets such as oil
wells or mine shafts that are produced in the development phase are intended for direct use in
resource extraction and should be classified as structures (Box 2).
15. In some cases, CPC 2.1 groups a natural resource product together with one or more
nonnatural resource products, even at the subclass (5-digit) level. Some examples of this are
found in product classes 1720 to 4143 of Box 1. Also, in Box 2, liquefaction of natural gas for
transport purposes when done away from the well site is part of CPC 2.1 class 6799, Other
supporting transport services. To distinguish natural resource products, country-specific codes that
are suitable for a resource-intensive economy can be created by adding extra digits to the CPC 2.1
subclass code.
GUIDE TO ANALYZE NATURAL RESOURCES IN NATIONAL ACCOUNTS
8 INTERNATIONAL MONETARY FUND
Box 1. Natural Resource Products
CPC 2.1
Class Description
Ores and Minerals
1101 Coal, not agglomerated
1103 Lignite, not agglomerated
1104 Lignite, agglomerated
1105 Peat
1201 Petroleum oils and oils obtained from bituminous minerals, crude
1202 Natural gas, liquefied or in the gaseous state
1203 Bituminous or oil shale and tar sands
1300 Uranium and thorium ores and concentrates
1410 Iron ores and concentrates, other than roasted iron pyrites
1421 Copper, ores, and concentrates
1422 Nickel ores and concentrates
1423 Aluminum ores and concentrates
1424 Precious metal ores and concentrates
1429 Other nonferrous metal ores and concentrates (other than uranium or thorium ores and
concentrates)
1511 Slate
1512 Marble and other calcareous monumental or building stone
1513 Granite, sandstone, and other monumental or building stone
1520 Gypsum, anhydrite, limestone flux, limestone, and other calcareous stone, of a kind used for the
manufacture of lime or cement
1531 Natural sands
1532 Pebbles, gravel, broken or crushed stone, macadam; granules, chippings, and powder of stone
1533 Bitumen and asphalt, natural asphaltites, and asphaltic rock
1540 Clays
1611 Natural calcium phosphates, natural aluminum calcium phosphates, and phosphatic chalk
1612 Unroasted iron pyrites
1619 Other chemical minerals
1620 Salt and pure sodium chloride; sea water
1631 Precious stones and semiprecious stones, unworked or simply sawn or roughly shaped
1632 Industrial diamonds, unworked or simply sawn, cleaved or bruted; pumice stone; emery; natural
corundum, natural garnet and other natural abrasives
1633 Chalk and dolomite
1639 Other minerals n.e.c.
1720 Coal gas, water gas, producer gas and similar gases, other than petroleum gases and other
gaseous hydrocarbons. Include: Coal gas, such as coal seam gas and other extracted gases.
Metal Products
4131 Silver (including silver plated with gold or platinum), unwrought or in semi-manufactured
forms, or in powder form. Include: unwrought or in powder form.

GUIDE TO ANALYZE NATURAL RESOURCES IN NATIONAL ACCOUNTS
INTERNATIONAL MONETARY FUND 9
Box 1. Natural Resource Products (Concluded)
4132
Gold (including gold plated with platinum), unwrought or in semi-manufactured forms, or in
powder form. Include: unwrought or in semi-manufactured forms, or in powder form, gold
bars.
4133 Platinum, unwrought or in semi-manufactured forms, or in powder form. Include: unwrought or
in powder form.
4134 Base metals or silver, clad with gold, not further worked than semi-manufactured. Include: only
those products upstream from semi-manufactured.
4135
Base metals clad with silver, and base metals, silver or gold clad with platinum, not further
worked than semi-manufactured. Include only those products downstream from semi-
manufactured.
4141 Copper unwrought, copper mattes, cement copper. Include: Copper mattes; cement copper,
unrefined copper.
4142 Nickel, unwrought; intermediate products of nickel metallurgy. Include: Nickel mattes.
4143 Aluminum unwrought; alumina.
Source: United Nations Central Product Classification 2.1 (http://unstats.un.org/unsd/cr/registry/cpc-21.asp).
Box 2. Fixed Assets and Services Produced by Natural Resource Industries
CPC 2.1
Class or
Subclass
Description
Fixed Asset and Services Products
54261 General construction services for mines
65131 Transport services via pipeline of petroleum and natural gas
6722 Bulk liquid or gas storage services
6799 Other supporting transport services (liquefaction of natural gas component)
7335 Licensing services for the right to use mineral exploration and evaluation
83413 Mineral exploration and evaluation
8621 Support services to mining
Source: United Nations Central Product Classification 2.1 (http://unstats.un.org/unsd/cr/registry/cpc-21.asp).
B. Natural Resource Industries
16. The natural resource industries comprise the extractive industries defined in the ISIC,
revision 4 (ISIC 4),5 together with other establishments whose primary activity is producing
one of the products shown in Box 1 or Box 2 for the natural resource industry. The extractive
industries defined in section B of ISIC 4 (Mining and Quarrying) are shown in Box 3, together with
other natural resource industries. In the cases of the ISIC 4 industry group 242 and classes 4930 and
5221, only some of the detailed activities in the ISIC 4 class fall within the natural resource industries.
5 International Standard Industrial Classification of All Economic Activities, Revision 4
(http://unstats.un.org/unsd/cr/registry/isic-4.asp).

GUIDE TO ANALYZE NATURAL RESOURCES IN NATIONAL ACCOUNTS
10 INTERNATIONAL MONETARY FUND
In particular, only the part of industry class 242 involving production of mattes of copper and nickel
is included; only the part of class 4930 involving transport of gas, crude petroleum, and other
extracted minerals is included; and only the part of class 5221 involving liquefaction of natural gas
for transport is included.6 Countries should choose to include or exclude all of the establishments in
a given class depending on whether natural resource products are the predominant output of these
establishments.
Box 3. Industries Engaged in Natural Resource Activities
ISIC 4
Section
ISIC 4
Group/Class Description
Engages in
Extractive
Activity*
Related
to
Extractive
Activity*
B Mining and Quarrying Y
05 Mining of coal and lignite Y
051 Mining of hard coal Y
052 Mining of lignite Y
06 Extraction of crude petroleum and natural gas Y
061 Extraction of crude petroleum Y
062 Extraction of natural gas Y
07 Mining of metal ores Y
071 Mining of iron ores Y
072 Mining of nonferrous metal ores Y
08 Other mining and quarrying Y
810 Quarrying of stone, sand, and clay Y
890 Mining and quarrying n.e.c. Y
09 Mining support service activities N Y
091 Support activities for petroleum and natural gas extraction N Y
099 Support activities for other mining and quarrying N Y
C Manufacturing
24 Manufacture of basic metals
242 Manufacture of basic precious and other nonferrous metals N Y
H Transportation and Storage
4930 Transport via pipelines N Y
5221 Service activities incidental to land transportation N Y
* Y—Yes N—No.
Source: International Standard Industrial Classification of All Economic Activities, Rev.4 (ISIC).
17. In the 2008 SNA, industries comprised the establishments engaged in the same kind of
economic activity. Establishments that engage in more than one type of activity are classified
based on their primary activity. If the secondary activity is important, a second establishment may be
created for statistical purposes. An establishment may belong to an enterprise that owns other
establishments. When an enterprise has extractive industry establishments and establishments
engaged in secondary processing of natural resources, such as an integrated oil company that
extracts and refines petroleum, data that are reported at the enterprise level may have to be
allocated to establishments. If this is impractical, the definition of the natural resource industries
6 Liquefaction of gas at the well site is included in class 0910.

GUIDE TO ANALYZE NATURAL RESOURCES IN NATIONAL ACCOUNTS
INTERNATIONAL MONETARY FUND 11
may be expanded to include the secondary processing activity so that entire enterprises can be
included.
C. Processing and Transport of Imported Natural Resources
18. Services for processing and transport of imported natural resources are not included
in the definition of an economy’s natural resource industries. Processing and transport of
natural resources extracted in an economy have been included in the definition of natural resource
industries because of their close links to extractive activities. However, when the natural resources
come from other economies, the links to foreign extractive activities do not justify including the
processing and transport in the economy’s natural resource industries. The processing and transport
services that facilitate sale of imported natural resources can therefore be excluded from the
definition of an economy’s natural resource industries in many cases. For example, a natural gas
pipeline that transports imported gas used for final consumption would not be treated as part of
that economy’s natural resource industries.
19. The purpose of analysis may sometimes warrant inclusion of services to process or
transport foreign-origin natural resources in an economy’s natural resource industries. For
example, if a provider of the transport services receives an economic ownership interest in the
natural resource, the economic role resembles that of a partner in the natural resources extraction.
This sort of arrangement might occur in the case of a pipeline that transports crude oil from another
economy across the economic territory for sale to third parties. A criterion of whether to include an
oil pipeline in the natural resource industries may be whether income from the oil is shared between
the nonresident extractor and the resident owner of the pipeline. For practical reasons, it may not
always be possible to exclude services for processing and transport of foreign-origin natural
resources. For example, the data may not support a distinction between processing and transport of
local-origin natural resources.
TEMPLATE TABLES FOR NATURAL RESOURCES IN THE
NATIONAL ACCOUNTS
A. General Considerations
20. The Template Tables (Appendix I) are designed to be consistent with the conceptual
framework of the 2008 SNA. This framework treats the payments received by owners of natural
resources for providing the right to extract those resources as rent. Treating these payments as rent
makes them distributions of income, not purchases of services or taxes (in the case of payments to
the government that owns the resources). Payments for the use of produced assets, which include
“rentals,” are classified as purchases of services, and a deduction for consumption of fixed capital is
made when calculating the net income of the asset owner. The 2008 SNA also includes a deduction
for depletion in the other changes in the volume of assets account. An alternative treatment of
depletion of natural resource reserves as a subtraction from income may be presented in an
environmental satellite account, as discussed in the SEEA-CF.

GUIDE TO ANALYZE NATURAL RESOURCES IN NATIONAL ACCOUNTS
12 INTERNATIONAL MONETARY FUND
21. In the SNA framework, taxes on products levied on the output of an industry are
viewed as part of the price paid by the purchaser. This makes the treatment of taxes on products
produced by natural resource industries more complicated here than in the GFS Template. In the
GFS Template, those taxes are included in government revenues from natural resources under the
headings of general taxes on goods and services (GFS code 1141), excises (GFS code 1142) or taxes
on exports (GFS code 1152).
22. The Template Tables are general enough to allow any relevant transaction to be
included. Countries will often not complete a Template Table in its entirety. In many economies,
only a subset of the items shown will be relevant. Where data are not available, the notation NA
(Not Available) should be used. Template Tables 1–5 provide a time series describing the natural
resource industries based on detailed data such as supply-and-use tables, usually available annually.
These data may be available with a long delay and require substantial compilation effort. Template
Tables 6–8 meet the needs of contemporary economic policy analysis based on quarterly GDP
estimates and other high-frequency data.
23. Compilation of the Template Tables is likely to require coordination among data
providers as complete data are unlikely to be available from a single source. Source data may
be obtained from multiple data providers; for example, a central bank will provide exports and
imports of goods and services as part of the balance of payments, while value added is likely to be
compiled by the national statistical office. Modeled estimates may have to be compiled for
transactions where direct observation is impractical, such as artisanal mining.
24. If an enterprise has establishments in multiple industries, the data on the income of
the enterprise may be impossible7 to allocate to individual establishments as items such as
interest and dividends are not attached to a particular location. This is a problem because, for
purposes of analyzing production of natural resource products, the output of each establishment
should be assigned to the appropriate industry. It will likely be necessary to include all the
establishments of the enterprise, even those that do not produce natural resource products, when
analyzing income from natural resources. Income flows are important to track, but doing so may
require the acceptance of a broader definition of the natural resource industries to cover entire
enterprises in cases where the enterprise’s other activities, such as secondary processing, are
combined with its natural resource activity. The template for tracing the flows of the income
generated by natural resources therefore covers the entire enterprise if the main activities of the
enterprise fall within the natural resource industries. For example, an integrated oil company that
extracts (primary production) and refines (secondary production) petroleum would be included.
B. Template on the Proportion of Natural Resource Industries to GDP
25. Template Table 1 shows output, value added, taxes on products, and subsidies on
products, both for the natural resource industries and for the economy as a whole. The
7 Countries are encouraged to complete the Template Tables using the best available implementation of the
establishment/enterprise in the data sources underpinning their economic statistics. A similar principle applies when
distinguishing between industry and product.

GUIDE TO ANALYZE NATURAL RESOURCES IN NATIONAL ACCOUNTS
INTERNATIONAL MONETARY FUND 13
standard concept for the output of an industry is the sum of the output of every establishment in
the industry. However, consolidated industry output, which excludes output used by other
establishments in the same industry, is an alternative concept that is better-suited for analyzing
industry proportions of GDP. For example, the output of the mining support services industry is
excluded from the consolidated output of natural resource industries as a group because this output
is consumed by mining industries. Consolidated output for the economy as a whole equals GDP less
net taxes on products plus imports. Estimation of annual supply-and-use tables is encouraged, and
these tables allow consolidated (or “unconsolidated”) measures of the output of each natural
resource industry, and of all natural resource industries as a group, to be compiled. Although the
consolidated measure of output is preferred for Template Table 1, the standard, unconsolidated
output measure is acceptable if estimation of consolidated output is unfeasible.
26. Taxes on products levied on the output of the natural resource industries may
represent a significant source of government revenue. These taxes are based on the quantity or
value of the natural resource products produced or sold, and consist of: nondeductible VAT, if any
(GFS code 1141 in the IMF’s Government Finance Statistics Manual 2014); excises (GFS code 1142);
profits of fiscal monopolies (GFS code 1143); taxes on the use of goods, including pollution taxes
(GFS code 1145); other taxes on goods and services (GFS code 1146), if calculated based on
production or sales; and taxes on exports (GFS code 1152). In national accounts, taxes on products
are considered to be paid by the buyer of the products, not the seller. Yet, regardless of who is
viewed as paying them, the taxes on products sold by the natural resource industries are part of
government revenues from natural resources, and are included in this Template and in
the GFS Template.
27. Subsidies on products based on natural resources, such as fuel, may allow households
to pay lower prices on these products. Such subsidies are typically paid to a downstream
processing industry (such as petroleum refining) which, under normal circumstances, would not be
included in natural resource industries. However, if the subsidies are substantial, a broader definition
of the boundary of the natural resource industries that allows the subsidies to be shown in Template
Table 1 may be best suited to the circumstance of the economy.
28. The proportion of value added at basic prices8 of each industry is the standard way to
analyze the relative significance of natural resource industries. Nevertheless, national accounts
aggregates are frequently shown as a proportion of GDP (which is measured at purchasers’ prices)
rather than as a proportion of the total value added of all industries (which is measured at basic
prices). Taxes on products normally exceed subsidies on products, so GDP is normally larger than
the value added of all industries. Taxes less subsidies on products must be added to the value added
of all industries to obtain GDP.
29. Value added by industry can be measured at basic prices or producers’ prices. The
difference is that producers’ prices include taxes on products (other than value added tax) and
8 Basic prices exclude taxes on products and includes subsidies on products.
GUIDE TO ANALYZE NATURAL RESOURCES IN NATIONAL ACCOUNTS
14 INTERNATIONAL MONETARY FUND
deduct subsidies on products. Value added at basic prices is shown in Section B of Template Table 1,
while value added at producers’ prices is shown in section E.
30. Template Table 1 shows the importance of the natural resource industries in GDP as
measured by ratios of value added at producers’ prices to GDP. The residual that is not assigned
to any industry only comprises VAT if producers’ prices are used. For purposes of finding shares of
GDP, the similarity between producers’ prices and the purchasers’ prices used in the expenditure
approach to GDP makes producers’ prices conceptually appealing. Note, however, that the
significance of the natural resource industries can also be measured using value added at basic
prices. For example, the basic price approach is advantageous if an industry receives large subsidies
on products, especially if value added is negative when subsidies on products are not included.
While a negative number is meaningful—GDP would have been larger had the inputs used by the
subsidized industry been deployed elsewhere—the price including the subsidies may give a more
useful measure of the industry’s significance to the economy.
31. Economies where natural resources are extracted may also import natural resources
for processing or domestic uses. Establishments included in natural resource industries that
process or service natural resources extracted by resident establishments may also process or
service imported natural resources. For the purposes of measuring the significance of an economy’s
natural resource industries, it is appropriate to exclude the value added associated with processing
or servicing foreign-origin natural resources. If the value added from processing and servicing
foreign-origin natural resources cannot be estimated directly from the available source data, ratios
based on relevant flows should be applied to allocate output and intermediate consumption so that
only the activity relevant to natural resources extracted by resident establishments is recorded in
Template Table 1.
32. Some of the output of the natural resource industries, particularly support services for
the mining industry, is used for fixed capital formation. For example, drilling for oil and
geophysical or seismic surveys are typically done by contractors included within Mining support
service activities (ISIC 4 Group 09). However, imported goods and services are also used for fixed
capital formation. Aggregate amounts of fixed capital formation are important indicators, and are
reported in Template Table 2, as discussed below.
C. Distribution of the Income Generated by the Natural Resource
Industries
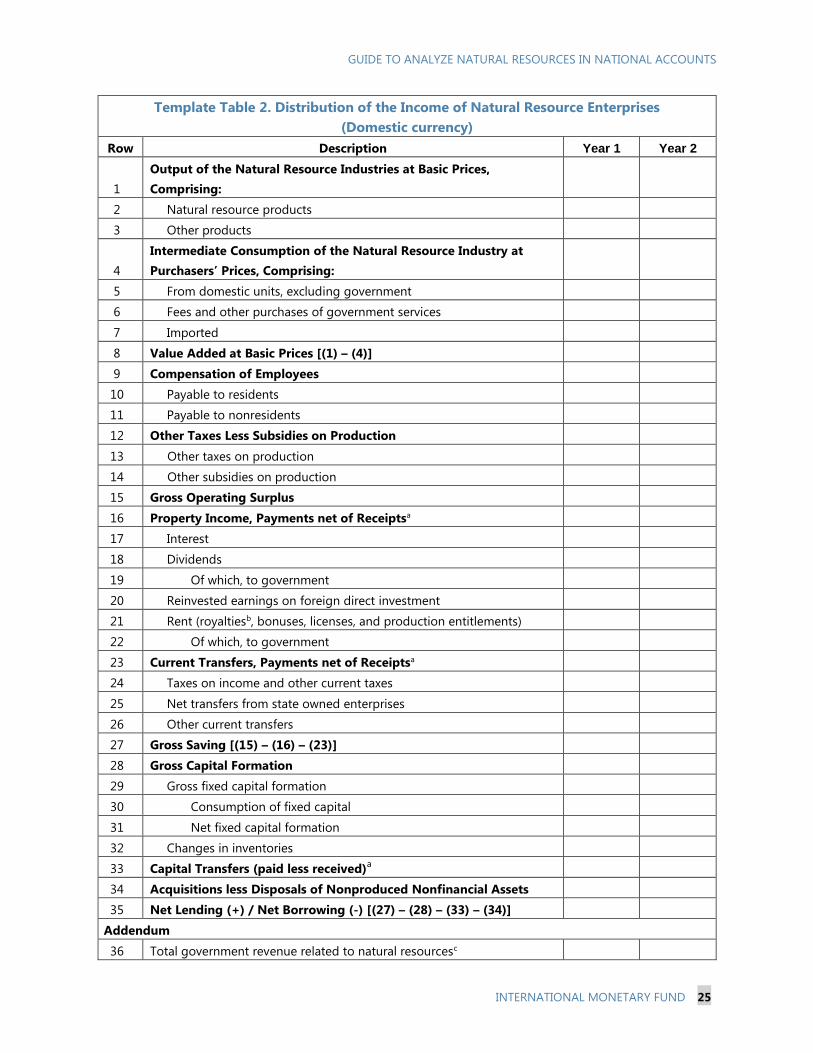
33. Indicators of distribution of income generated by the natural resource industries are
presented in Template Table 2. Data on uses of income must be collected at the enterprise level
rather than at the establishment level, so all of the income from domestic operations of resident
enterprises that engage in a natural resource activity is included. An explanatory note on the reason
for the discrepancy between the value added of the establishments in Template Table 1 and the
value added data of the enterprises in Template Table 2 may accompany Template Table 2 if
necessary. It may be possible to separately identify the value added of the establishments producing
natural resource products, which would allow this discrepancy to be quantified.

GUIDE TO ANALYZE NATURAL RESOURCES IN NATIONAL ACCOUNTS
INTERNATIONAL MONETARY FUND 15
34. The main headings of Template Table 2 are intended for all compilers of natural
resource statistics, while the rows showing the composition of the main headings are
optional. The main headings are: output, intermediate consumption, value added, compensation of
employees, other taxes less subsidies on production, gross operating surplus, property income,
current transfers, gross saving, gross capital formation, capital transfers, acquisitions less disposals
of nonproduced nonfinancial assets, and net lending (+) / net borrowing (-). The rows showing the
detailed composition of each of the main headings are provided both to serve as a reference on the
items that should be included in at least some countries and to enable countries to provide as much
detail as possible on the distribution of the income generated by their natural resource enterprises.
These rows need not be filled out if source data are not readily available or the amounts involved
are small. However, when completing the table, rent paid to owners of natural resources should be
reported.
35. The top row of Template Table 2 shows the revenue received from sales of output plus
the value of output used for capital formation. Taxes on products that are paid by buyers of the
goods and services produced by natural resource enterprises are excluded as output is valued using
basic prices. Enterprises that produce natural resource products may have additional establishments
that produce other kinds of goods and services as secondary or downstream outputs. The other
products are included in the income from production of the natural resource enterprises.
36. The part of the income from output that is used to purchase products used for
intermediate consumption is shown in row 4. Taxes on products, including import duties on
items directly imported by the enterprise, are included in the prices paid for intermediate inputs.
Fees paid to government are treated as purchases of intermediate inputs if they entitle the payer to
receive a service or cover the costs of government services used by the industry.
37. The income arising from the value added equals the difference between output and
intermediate consumption. A portion of this income is used for compensation of employees, and
another part is used for payment of other taxes less subsidies on production. Examples of other
taxes on production include property taxes, business and professional licenses, licenses required for
exploration or extraction, and pollution taxes.
38. Gross operating surplus is the amount of value added that remains after expenses for
compensation of employees and other taxes less subsidies on production. Gross operating
surplus plus gross receipts of property income is the amount that is available for distribution as
property income to investors and to owners of natural resources. The payments to investors consist
of dividends and interest. If the government has a stake in enterprises engaged in natural resource
activities within the country’s economic territory, including public corporations, the dividends
payable to the government should be shown as an “of which” item.
39. Foreign direct investment often plays an important role in the natural resource
industries. In the case of foreign direct investment, the proportion of retained earnings of local
corporations that are owned by nonresident direct investors such as multinational corporations are
treated as if they had been distributed and then reinvested by the nonresident owner. They are
therefore shown below dividends in the table as an imputed distribution of property income.

GUIDE TO ANALYZE NATURAL RESOURCES IN NATIONAL ACCOUNTS
16 INTERNATIONAL MONETARY FUND
40. Payments of property income to the owners of natural resources are rent. All users of
the template should report rent payments of natural resource enterprises. Rent includes royalties,
bonuses, and license charges payable by natural resource enterprises. If the government is not the
only recipient of royalty and license payments, the rent received by government should be shown
separately in the table as an “of which” item. A measure of the net rent that deducts a depletion
expense associated with the extracted natural resources owned by the recipient of the rent may also
be calculated, which goes beyond the 2008 SNA but is in line with the SEEA-CF.
41. The government may also receive rent payments from foreign-owned or private
natural resource enterprises as production entitlements or production sharing. These
enterprises also may meet their production sharing obligations by making payments or transferring
output to a public corporation. In this case, the value of the payments and output that the public
corporation is entitled to receive should be rerouted through the general government sector.
Rerouting means that government is recorded as receiving rent equal to the value of the production
transferred to the public corporation, and paying a current transfer to the public corporation.
42. Current transfers, which include taxes on income or capital gains, are another use of
the gross operating surplus of natural resource enterprises. Fines, forfeitures, and penalties paid
by natural resource enterprises are included in the line for “other current transfers.” If public
corporations are entitled to production sharing, the amounts received by the public corporation are
shown as current transfers made by the government from the rent that it has received in connection
with production sharing. A transfer received by an enterprise would be recorded as a negative
number in Template Table 2 because the table shows net payments from enterprises.
43. Gross saving is the amount that remains after property income is distributed and
income taxes and other current transfers are paid. For natural resource enterprises, gross saving
is, conceptually, equal to retained corporate earnings after tax but before charges for depletion.
Consumption of fixed capital, which is a charge for depreciation of fixed assets as calculated in
national accounts, can be subtracted from gross saving to obtain net saving, and also subtracted
from gross fixed capital formation to obtain net fixed capital formation.
44. Gross saving that is not used for capital transfers may be invested in produced assets,
in nonproduced nonfinancial assets, or in financial assets. Net acquisitions of produced assets
used in production are known as “gross fixed capital formation,” where “gross,” in this case, means
before deduction of consumption of fixed capital. Changes in inventories include natural resource
products produced but not yet sold, and work in progress. To measure capital formation on an
accrual basis, work-in-progress assets should be recorded for fixed assets that are not completed in
one accounting period. For example, some kinds of fixed capital assets used by extractive industries,
such as major offshore oil and gas platforms and liquefied natural gas (LNG) plants, take more than
one year to construct. To measure capital formation on an accrual basis, work-in-progress assets
should be recorded for fixed assets that are not completed at the end of one accounting period.
45. Nonproduced nonfinancial assets include long-lived licenses to extract mineral
reserves (2008 SNA, paragraph 17.316). If payments for long-lived licenses are treated as
GUIDE TO ANALYZE NATURAL RESOURCES IN NATIONAL ACCOUNTS
INTERNATIONAL MONETARY FUND 17
acquisitions of nonproduced nonfinancial assets rather than as rent, investment in such assets
should be shown as one of the uses of gross saving, and excluded from rent.
46. Net acquisition of financial assets less net incurrence of financial liabilities equals net
lending (+)/net borrowing (-). Net lending (+)/net borrowing (-) is estimated as the residual that
remains after accounting for the uses of gross saving for gross capital formation, net payments of
capital transfers, and net acquisitions of nonproduced nonfinancial assets.
47. Government revenue from taxes, rent and fees for services paid by the natural
resource enterprises or buyers of their output is shown in the addendum to Template Table 2.
The total of the fees for services, other taxes on production, dividends, rent, and current transfers
shown above is reported in the addendum in row 37.
48. The next addendum section shows exports of natural resource products. Locally
produced natural resources subject to secondary processing before being exported should also be
included, and their inclusion should be noted. Total exports of all goods and services are shown
below exports of natural resource products for comparison purposes.
49. The addendum shows depletion of natural resource reserves. In the 2008 SNA,
reductions in the value of known reserves resulting from depletion as a result of extracting assets
are recorded in the other changes in the volume of assets’ account as opposed to sales of fixed
assets. This means in the 2008 SNA depletion is treated differently from depreciation for fixed capital
when calculating net domestic product and net disposable income. In contrast, the SEEA-CF
introduces supplementary measures of depletion, by recording depletion as a cost against the
associated income. The Guide shows depletion in the addendum to allow calculation of alternative
income measures as proposed by SEEA-CF, and may also be reported by the natural resource
enterprises. Depletion-adjusted value added as defined by SEEA-CF can also be derived using
2008 SNA data reported in Template Table 1. For comparison purposes, the last two lines of the
addendum show the total value of reserves, and the total value of all assets of natural resource
enterprises. 9
D. Labor in the Natural Resource Industries
50. To analyze the role of labor Template Table 3 shows employment and compensation
of employees in the natural resource industries. Comparable figures for the whole economy are
also shown along with the gender composition of the labor force. These data can be used to analyze
questions such as the under-representation of women in high-paying industries. Hours worked is
the preferred measure of labor input to compare returns to labor and productivity over time, across
industries, and among comparable countries. Opting for hours worked as the labor input measure
instead of number of employees improves comparability because average hours worked can vary
over time, across industries, and countries. However, comparability may still be mitigated by
9 The valuation of nonproduced nonfinancial assets is discussed in 2008 SNA Chapter 20. A discussion on reserve
valuation is provided in Guide on Resource Revenue Transparency,
https://www.imf.org/external/np/pp/2007/eng/101907g.pdf.

GUIDE TO ANALYZE NATURAL RESOURCES IN NATIONAL ACCOUNTS
18 INTERNATIONAL MONETARY FUND
differences in occupational mix and human capital reflecting education, training, or experience.
Average hours worked may be available from a household or employer survey. Where this
information is not available, full time equivalent employment or number of employees may be used,
keeping in mind that multiple job holders or part-time workers may not be recorded consistently by
these approaches.10
51. Labor productivity growth over time is measured by the difference between the
growth of value added in volume terms and the growth of hours worked. Thus, the data on
hours worked in Template Table 3 can be combined with the data on value added at constant prices
in Template Table 4 to measure the growth of labor productivity in the natural resource industries.
Cross-section comparisons of value added per hour in different industries within an economy should
generally be based on value added at current prices, however.
E. Contributions of the Natural Resource Industries to the Volume and
Deflator Change in GDP
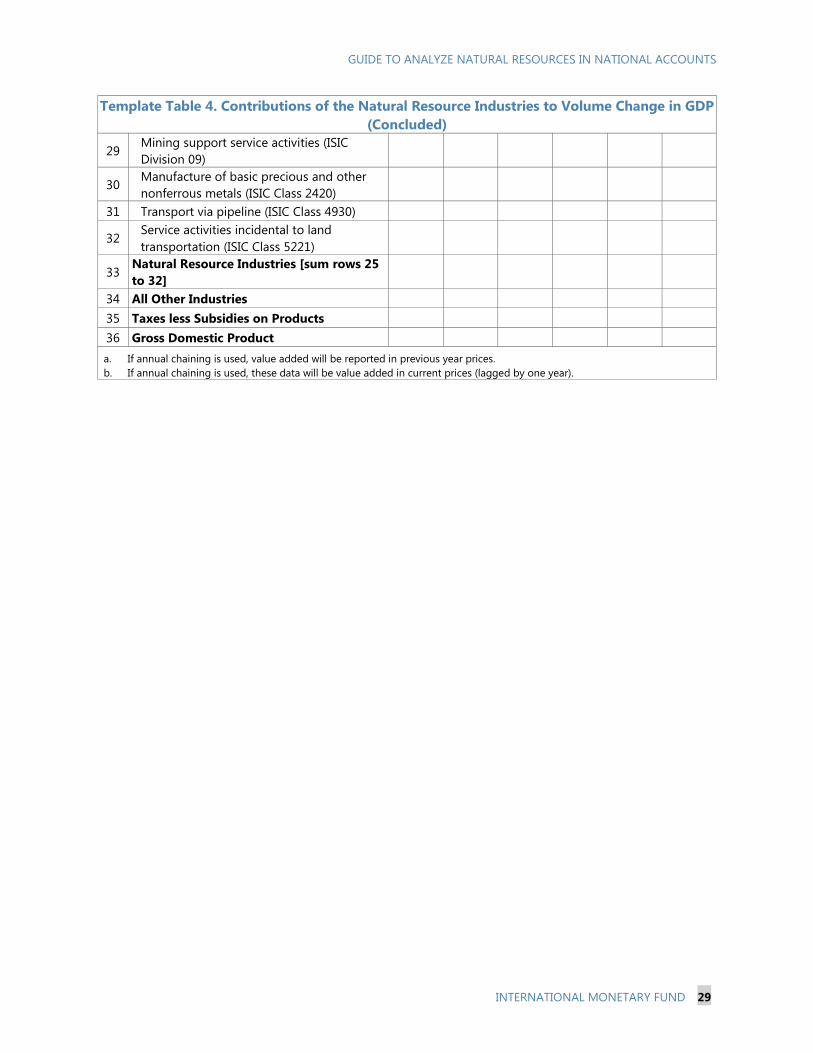
52. The contribution of natural resource industries to the volume change in GDP is an
important measure. The general approach to calculating contributions to growth of these (and
other) industries is shown in Template Table 4. The difference in level between the current year and
the preceding year in the value added shows the absolute change in volume expressed in base
period prices. Expressing the absolute change as a proportion of GDP in the previous year describes
the industry’s direct contribution to the growth in GDP. This value could also be calculated by
multiplying the industry’s share of GDP in the previous period by the growth rate of its industry
value added at constant prices.
53. Some countries calculate volume measures in a constant price framework, with
updates of the base year at intervals of more than a year. In the constant price volume, both the
current year and the preceding year are measured using the prices of a third base year. The
calculation of contributions to volume change in the constant price framework can be derived from
Template Table 4. The difference in value added between the current year and the preceding year
(measured at constant prices of the base year) is divided by GDP of the preceding year (measured at
prices of the base year) and then expressed as a percentage to calculate the contribution to volume
change from the natural resource industry.
54. If the contributions to change in GDP are calculated from value added at producers’
prices (as in Template Table 1), the contribution of unallocated taxes on products in Template
Table 4 will consist of VAT, while if basic prices are used, all taxes less subsidies on products
will be shown. These definitions ensure that the contributions to change shown in the final column
add up to the aggregate change in GDP. Producers’ prices have the advantage of corresponding
more closely to the prices used to calculate GDP based on final expenditures, while basic prices have
10 For example, consider one person working two jobs - one in the natural resource industry, and the second in the
education industry. This individual will be recorded in the labor force survey as one employed person (i.e.,
employment) classified to the predominant industry. The employer survey will record two jobs (i.e., employees).

GUIDE TO ANALYZE NATURAL RESOURCES IN NATIONAL ACCOUNTS
INTERNATIONAL MONETARY FUND 19
the advantage of being the standard way that value added is measured in production. Using basic
prices may also prevent value added from being negative in cases of industries producing heavily
subsidized products.
55. Estimates of taxes less subsidies on products in volume (constant price) terms should
always be calculated using volume extrapolation or by applying the base year tax rate to the
volume of the taxed item in the current period. The volume of the tax or subsidy on a product
must change in the same proportion as the volume of the product itself (2008 SNA, paragraphs
14.148-152). The volume movement for the underlying product must first be determined by either
price deflation or quantity extrapolation applied to output, imports, or consumption, and then the
movement of the tax or subsidy on the product is calculated from the product’s volume change. For
example, an excise tax levied on production of natural gas should move in proportion to the volume
of natural gas output. Deflating taxes or subsidies on products directly by a price index such as a CPI
or PPI should be avoided.
56. Some countries use a chained index framework in which the prices used to calculate
the volume change are updated annually. With annual chaining, the prices of the preceding year
are used to measure the volume of GDP in the current year. In this case, the value added of the
natural resource industries in the preceding year is subtracted from value added in the current year
measured at the prices of the preceding year. The difference in levels with prices held constant is
then divided by the GDP of the preceding year to obtain the contribution to the volume change in
GDP.
57. Contributions of prices of the outputs and intermediate inputs to the change in the
GDP deflator may be calculated using an analogous approach to the one used for volume
change contributions, as shown in Template Table 5. However, the interpretation of such price
change contributions is not straightforward because they show only the direct effects. Other things
being equal, a change in the price of the output that is sold by the natural resource industries to a
resident establishment in another industry will have offsetting effects on the two industries, but only
the direct effect on the seller will be reflected in the price change contribution.
58. The deflators for outputs and intermediate consumption of natural resource industries
should use appropriate individual prices for each product. The assumption that input and output
prices change at the same rate can lead to distorted results. This is particularly relevant for natural
resource industries, where prices often change rapidly.11 For example, a sharp fall in the price of oil
will not necessarily be paralleled by a sharp fall in the prices of inputs used by the oil industry.
11 This also occurs in other industries, such as processors of agricultural commodities. IMF Staff Discussion Note
(SDN/17/02) “Measure up: A Better Way to Calculate GDP” by Thomas Alexander,
Claudia Dziobek, Marco Marini, Eric Metreau, and Michael Stanger elaborates this point,
http://www.imf.org/~/media/files/publications/sdn/2017/sdn1702.ashx.

GUIDE TO ANALYZE NATURAL RESOURCES IN NATIONAL ACCOUNTS
20 INTERNATIONAL MONETARY FUND
F. Terms of Trade Effects
59. Export and import prices have direct effects on GDP in current prices and on real
income. An improvement in the terms of trade, an index of the ratio of export prices to import
prices, raises export revenues relative to import costs and makes it possible to increase consumption
while maintaining the same trade balance in Template Table 6.
60. The high price volatility that is characteristic of natural resources means that terms of
trade effects are particularly important for economies with large exports of natural resource
products.12 The terms of trade index provides a single summary statistic for the effects of changes
in prices of internationally traded goods and services. In addition, the influence of natural resource
products on the terms of trade can be shown by calculating export and import price indexes with
and without natural resource products. Because changes in petroleum prices tend to be passed
through to refined petroleum product prices, exports and imports of refined petroleum products
should be included in the sensitivity analysis along with the natural resource products defined in
Box 1. These indexes are shown in Template Table 6.
61. Implicit deflators for the expenditure components of GDP can be used to measure the
effects of international trade prices on real income. The combined consumption and capital
formation components of the expenditure approach make up gross domestic final expenditure.
Deflating GDP by the implicit deflator for gross domestic final expenditure yields real gross domestic
income. Real gross domestic income is a measure of the purchasing power of the income generated
by domestic production.
62. The difference in the growth rates of real gross domestic income and GDP volume is
measured by the change in the ratio of the implicit deflator for GDP to the implicit deflator
for gross domestic final expenditure.13 This ratio is also known as the trading gains index. The
effect of natural resource prices on the trading gains index can be isolated by calculating a version
of the GDP deflator that excludes exports and imports of natural resources. Differences in growth
rates between real gross domestic income and GDP in volume terms show the effect of changes of
international trade prices on real income.
G. Quarterly Indicators for GDP and Exports of Goods and Services
63. Quarterly national accounts provide timely information to assist contemporary
economic policy, but are almost always compiled at a less detailed level than the annual
accounts.14 The quarterly Template Tables 7 and 8 have less detail than the annual template tables
(1–5) because source data are unlikely to be available on a quarterly basis at the same detailed level
12 Changes in terms of trade are also often important for exporters of agricultural commodities.
13 Gross domestic final expenditure is defined as the sum of final consumption and capital formation (2008 SNA
paragraph 15.185).
14 See Quarterly National Accounts Manual - Concepts, Data Sources, and Compilation
http://www.imf.org/external/pubs/ft/qna/2000/Textbook/, paragraph 2.30.

GUIDE TO ANALYZE NATURAL RESOURCES IN NATIONAL ACCOUNTS
INTERNATIONAL MONETARY FUND 21
needed for the annual template tables. For example, value added for the Transport via pipeline
industry is unlikely to be available with full coverage on a quarterly basis (Box 3). Template Tables 7
and 8 are therefore designed to approximate the natural resource industries by using the mining
industry (ISIC Section B). Template Tables 7 and 9 also make use of high frequency data on exports
of goods which are typically provided via administrative records of customs departments.
64. Template Table 7 describes quarterly value added for mining and all other industries,
taxes less subsidies on products, and GDP. It is expected that the share of GDP in current prices
represented by the natural resource industries will vary over the short term in accordance with
movements in commodity prices. The table disaggregates changes in current prices into volume and
price changes.
65. Template Table 8 decomposes exports of goods and services into natural resources
products and other products. Similar to Template Table 7, movements in current price data can be
decomposed into changes in price and changes in volume. The Template Table is presented in terms
of quarterly data as exports of goods and services is a key component of quarterly GDP. Subject to
availability of appropriate source data (e.g., price indexes and customs records), it may be possible
to present Template Table 8 as a monthly time series.

GUIDE TO ANALYZE NATURAL RESOURCES IN NATIONAL ACCOUNTS
22 INTERNATIONAL MONETARY FUND
Appendix I. Template Tables for National Accounts on Natural Resources
Template Table 1. Proportion of Natural Resource Industries to GDP
Row Description Year 1 Year 2 Year 3 Year 4 Year 5 Year 6
A. Outputa (domestic currency)
1 Mining of coal and lignite (ISIC Division 05)
2 Extraction of crude petroleum and natural gas
(ISIC Division 06)
3 Mining of metal ores (ISIC Division 07)
4 Other mining and quarrying (ISIC Division 08)
5 Mining support service activities (ISIC Division
09)
6 Manufacture of basic precious and other
nonferrous metals (ISIC Class 2420b)
7 Transport via pipeline (ISIC Class 4930b)
8 Service activities incidental to land
transportationc (ISIC Class 5221b)
9 Natural Resource Industries [sum rows 1 to 8]
10 All Industries in the Economy
B. Value Added (domestic currency)
11 Mining of coal and lignite (ISIC Division 05)
12 Extraction of crude petroleum and natural gas
(ISIC Division 06)
13 Mining of metal ores (ISIC Division 07)
14 Other mining and quarrying (ISIC Division 08)
15 Mining support service activities (ISIC Division
09)
16 Manufacture of basic precious and other
nonferrous metals (ISIC Class 2420b)
17 Transport via pipeline (ISIC Class 4930b)
18 Service activities incidental to land
transportationc (ISIC Class 5221b)
19 Natural Resource Industries [sum rows 11 to
18]
20 All Industries in the Economy
C. Taxes on Productsd (domestic currency)
21 Mining of coal and lignite (ISIC Division 05)
22 Extraction of crude petroleum and natural gas
(ISIC Division 06)
23 Mining of metal ores (ISIC Division 07)
24 Other mining and quarrying (ISIC Division 08)
25 Mining support service activities (ISIC Division
09)
26 Manufacture of basic precious and other
nonferrous metals (ISIC Class 2420b)
27 Transport via pipeline (ISIC Class 4930b)

GUIDE TO ANALYZE NATURAL RESOURCES IN NATIONAL ACCOUNTS
INTERNATIONAL MONETARY FUND 23
Template Table 1. Proportion of Natural Resource Industries to GDP (Continued)
28 Service activities incidental to land
transportationc (ISIC Class 5221b)
29 Natural Resource Industries [sum rows 21 to
28]
30 All Industries in the Economy
D. Subsidies on Products (domestic currency)
31 Mining of coal and lignite (ISIC Division 05)
32 Extraction of crude petroleum and natural gas
(ISIC Division 06)
33 Mining of metal ores (ISIC Division 07)
34 Other mining and quarrying (ISIC Division 08)
35 Mining support service activities (ISIC Division
09)
36 Manufacture of basic precious and other
nonferrous metals (ISIC Class 2420b)
37 Transport via pipeline (ISIC Class 4930b)
38 Service activities incidental to land
transportationc (ISIC Class 5221b)
39 Natural Resource Industries [sum rows 31 to
38]
40 All Industries in the Economy
E. Value Added + Taxes less Subsidies on Products [B + C – D] (domestic currency)
41 Mining of coal and lignite (ISIC Division 05)
42 Extraction of crude petroleum and natural gas
(ISIC Division 06)
43 Mining of metal ores (ISIC Division 07)
44 Other mining and quarrying (ISIC Division 08)
45 Mining support service activities (ISIC Division
09)
46 Manufacture of basic precious and other
nonferrous metals (ISIC Class 2420b)
47 Transport via pipeline (ISIC Class 4930b)
48 Service activities incidental to land
transportationc (ISIC Class 5221b)
49 Natural Resource Industries
50 All Industries in the Economye, f
F. Share of GDP [E / (50)] (percent)
51 Mining of coal and lignite (ISIC Division 05)
52 Extraction of crude petroleum and natural gas
(ISIC Division 06)
53 Mining of metal ores (ISIC Division 07)
54 Other mining and quarrying (ISIC Division 08)
55 Mining support service activities (ISIC Division
09)
56 Manufacture of basic precious and other
nonferrous metals (ISIC Class 2420b)
57 Transport via pipeline (ISIC Class 4930b)

GUIDE TO ANALYZE NATURAL RESOURCES IN NATIONAL ACCOUNTS
24 INTERNATIONAL MONETARY FUND
Template Table 1. Proportion of Natural Resource Industries to GDP (Concluded)
58 Service activities incidental to land
transportationb (ISIC Class 5221b)
59 Natural Resource Industries
60 All Industries in the Economy 100 100 100 100 100 100
a. A footnote should be included to indicate whether this is unconsolidated or consolidated.
b. Manufacturing, transport, and other services of natural resources imported from another economy are excluded.
c. This class includes liquefaction of gas for transportation purposes.
d. Taxes on products of the natural resource industries omit VAT that is deductible to the purchaser. Total payments of VAT are
included in the total for all resident units of taxes on products.
e. Total for all resident units equals GDP.
f. This item includes VAT which is deductible to purchaser.
GUIDE TO ANALYZE NATURAL RESOURCES IN NATIONAL ACCOUNTS
INTERNATIONAL MONETARY FUND 25
Template Table 2. Distribution of the Income of Natural Resource Enterprises
(Domestic currency)
Row Description Year 1 Year 2
1
Output of the Natural Resource Industries at Basic Prices,
Comprising:
2 Natural resource products
3 Other products
4
Intermediate Consumption of the Natural Resource Industry at
Purchasers’ Prices, Comprising:
5 From domestic units, excluding government
6 Fees and other purchases of government services
7 Imported
8 Value Added at Basic Prices [(1) – (4)]
9 Compensation of Employees
10 Payable to residents
11 Payable to nonresidents
12 Other Taxes Less Subsidies on Production
13 Other taxes on production
14 Other subsidies on production
15 Gross Operating Surplus
16 Property Income, Payments net of Receiptsa
17 Interest
18 Dividends
19 Of which, to government
20 Reinvested earnings on foreign direct investment
21 Rent (royaltiesb, bonuses, licenses, and production entitlements)
22 Of which, to government
23 Current Transfers, Payments net of Receiptsa
24 Taxes on income and other current taxes
25 Net transfers from state owned enterprises
26 Other current transfers
27 Gross Saving [(15) – (16) – (23)]
28 Gross Capital Formation
29 Gross fixed capital formation
30 Consumption of fixed capital
31 Net fixed capital formation
32 Changes in inventories
33 Capital Transfers (paid less received)a
34 Acquisitions less Disposals of Nonproduced Nonfinancial Assets
35 Net Lending (+) / Net Borrowing (-) [(27) – (28) – (33) – (34)]
Addendum
36 Total government revenue related to natural resourcesc

GUIDE TO ANALYZE NATURAL RESOURCES IN NATIONAL ACCOUNTS
26 INTERNATIONAL MONETARY FUND
Template Table 2. Distribution of the Income of Natural Resource Enterprises
(Domestic currency) (Concluded)
37 Total government revenue from all sources
38 Exports of natural resource productsd
39 Exports of goods and services
40 Depletion of reserves
41 Depletion-adjusted net value added [Template Table 1, (20) – (30) – (40)]
42 Value of reserves
43 Total assets
a. An industry allocation for many of the items comprising property income and transfers is not readily available. Some items
(e.g., dividends) can be estimated separately from enterprise data, while modelled estimates are required for others (e.g.,
reinvested earnings).
b. “Royalties” for nonproduced assets refers to 2008 SNA “rent”.
c. This value is obtained directly from the GFS Template.
d. Re-exports are excluded and downstream products made from local natural resources should be noted.

GUIDE TO ANALYZE NATURAL RESOURCES IN NATIONAL ACCOUNTS
INTERNATIONAL MONETARY FUND 27
Template Table 3. Labor in the Natural Resource Industries
Row Description Year 1 Year 2 Year 3 Year 4 Year 5 Year 6
A. Compensation of Employeesa (domestic currency)
1 Natural resource industries
2 All other industries
3 All industries
B. Hours Worked (hours)b / Employees (persons) / Employment (jobs)
4 Natural resource industries
of which female
5 All other industries
of which female
6 All industries
of which female
C. Compensation of Employees per unit of Labor [A / B] (domestic currency)
7 Natural resource industries
8 All other industries
9 All industries
D. Compensation of Employees as a share of Value Addedc [100 × A / Value Added] (percent)
10 Natural resource industries
11 All other industries
12 All industries
a. Compensation of employees should relate to either: (i) the set of establishments used to derive value added (Template
Table 1); (ii) or enterprises (Template Table 2, (9)), classified to the natural resource industries. The compiler should select
and note the measure which provides the best correspondence with the selected labor measure.
b. While hours worked is preferred, full-time equivalent (FTE) employment or number of employees may be used.
c. Template Table 1 should be used if compensation of employees relates to establishments classified to the natural resource
industries. Template Table 2 should be used if compensation of employees relates to enterprises classified to the natural
resource industry.

GUIDE TO ANALYZE NATURAL RESOURCES IN NATIONAL ACCOUNTS
28 INTERNATIONAL MONETARY FUND
Template Table 4. Contributions of the Natural Resource Industries to Volume Change in GDP
Row Description Year 1 Year 2 Year 3 Year 4 Year 5 Year 6
A. Value Added in Base Year Pricesa (domestic currency)
1 Mining of coal and lignite (ISIC Division 05)
2 Extraction of crude petroleum and natural
gas (ISIC Division 06)
3 Mining of metal ores (ISIC Division 07)
4 Other mining and quarrying (ISIC Division
08)
5 Mining support service activities (ISIC
Division 09)
6 Manufacture of basic precious and other
nonferrous metals (ISIC Class 2420)
7 Transport via pipeline (ISIC Class 4930)
8 Service activities incidental to land
transportation (ISIC Class 5221)
9 Natural Resource Industries [sum rows 1 to
8]
10 All Other Industries
11 Taxes less Subsidies on Products
12 Gross Domestic Product
B. Value Added of the Previous Period in Base Year Pricesb (domestic currency)
13 Mining of coal and lignite (ISIC Division 05)
14 Extraction of crude petroleum and natural
gas (ISIC Division 06)
15 Mining of metal ores (ISIC Division 07)
16 Other mining and quarrying (ISIC Division
08)
17 Mining support service activities (ISIC
Division 09)
18 Manufacture of basic precious and other
nonferrous metals (ISIC Class 2420)
19 Transport via pipeline (ISIC Class 4930)
20 Service activities incidental to land
transportation (ISIC Class 5221)
21 Natural Resource Industries [sum rows 13
to 20]
22 All Other Industries
23 Taxes less Subsidies on Products
24 Gross Domestic Product
C. Contribution to Volume Change in GDP [100 × (A – B) / (24)] (percentage points)
25 Mining of coal and lignite (ISIC Division 05)
26 Extraction of crude petroleum and natural
gas (ISIC Division 06)
27 Mining of metal ores (ISIC Division 07)
28 Other mining and quarrying (ISIC Division
08)
GUIDE TO ANALYZE NATURAL RESOURCES IN NATIONAL ACCOUNTS
INTERNATIONAL MONETARY FUND 29
Template Table 4. Contributions of the Natural Resource Industries to Volume Change in GDP
(Concluded)
29 Mining support service activities (ISIC
Division 09)
30 Manufacture of basic precious and other
nonferrous metals (ISIC Class 2420)
31 Transport via pipeline (ISIC Class 4930)
32 Service activities incidental to land
transportation (ISIC Class 5221)
33 Natural Resource Industries [sum rows 25
to 32]
34 All Other Industries
35 Taxes less Subsidies on Products
36 Gross Domestic Product
a. If annual chaining is used, value added will be reported in previous year prices.
b. If annual chaining is used, these data will be value added in current prices (lagged by one year).

GUIDE TO ANALYZE NATURAL RESOURCES IN NATIONAL ACCOUNTS
30 INTERNATIONAL MONETARY FUND
Template Table 5. Contributions of Prices Paid and Received by the Natural Resource
Industries to the Cumulative Change in GDP Implicit Deflator since the Base Year
Row Description Year 1 Year 2 Year 3 Year 4 Year 5 Year 6
A. Value Added in Current Prices (domestic currency)
1 Mining of coal and lignite (ISIC Division 05)
[Template Table 1, (11)]
2 Extraction of crude petroleum and natural gas
(ISIC Division 06) [Template Table 1, (12)]
3 Mining of metal ores (ISIC Division 07)
[Template Table 1, (13)]
4 Other mining and quarrying (ISIC Division 08)
[Template Table 1, (14)]
5 Mining support service activities (ISIC Division
09) [Template Table 1, (15)]
6
Manufacture of basic precious and other
nonferrous metals (ISIC Class 2420) [Template
Table 1, (16)]
7 Transport via pipeline (ISIC Class 4930)
[Template Table 1, (17)]
8
Service activities incidental to land
transportation (ISIC Class 5221) [Template
Table 1, (18)]
9 Natural Resource Industries [Template Table
1, (19)]
10 All Other Industries [Template Table 1, (20)
– (9)]
11 Taxes less Subsidies on Products [Template
Table 1, (30) – Template Table 1, (40)]
12 Gross Domestic Product [Template Table 1,
(50)]
B. Contribution to change in GDP Deflator (percentage points) [100 × (A – Template Table 4, A) /
Template Table 4, (12)] (percentage points)
13 Mining of coal and lignite (ISIC Division 05)
14 Extraction of crude petroleum and natural gas
(ISIC Division 06)
15 Mining of metal ores (ISIC Division 07)
16 Other mining and quarrying (ISIC Division 08)
17 Mining support service activities (ISIC Division
09)
18 Manufacture of basic precious and other
nonferrous metals (ISIC Class 2420)
19 Transport via pipeline (ISIC Class 4930)
20 Service activities incidental to land
transportation (ISIC Class 5221)
21 Natural Resource Industries [sum rows 13 to
20]
22 All Other Industries
23 Taxes less Subsidies on Products
24 Gross Domestic Product

GUIDE TO ANALYZE NATURAL RESOURCES IN NATIONAL ACCOUNTS
INTERNATIONAL MONETARY FUND 31
Template Table 6. Terms of Trade Index a
Row Description Quarter 1 Quarter 2 Quarter 3 Quarter 4
A: Index Numbers
1 Implicit Deflator – Exports of Goods and Services
2 Implicit Deflator – Imports of Goods and Services
3 Terms of Trade Index [100 × (1) / (2)]
4 Implicit Deflator – Exports of Goods and Services
excluding natural resources
5 Implicit Deflator – Imports of Goods and Services
excluding natural resources
6 Terms of Trade Index – excluding natural resources
[100 × (4) / (5)]
7 Implicit Deflator – GDP
8 Implicit Deflator - Gross Domestic Final
Expenditure
9 Effect of export and import prices on real gross
domestic incomeb [100 × (7) / (8)]
10 Implicit Deflator - GDP excluding exports and
imports of natural resources
11
Effect of export and import prices on real gross
domestic income excluding natural resources [100
× (10) / (8)]
B: Percentage Change since Preceding Period
12 Implicit Deflator – Exports of Goods and Services
13 Implicit Deflator – Imports of Goods and Services
14 Terms of Trade Index [ (12) – (13)]
15 Implicit Deflator – Exports of Goods and Services
excluding natural resources
16 Implicit Deflator – Imports of Goods and Services
excluding natural resources
17 Terms of Trade Index – excluding natural resources
[ (15) – (16)]
18 Implicit Deflator – GDP
19 Implicit Deflator - Gross Domestic Final
Expenditure
20 Effect of export and import prices on real gross
domestic incomeb [ (18) – (19)]
21 Implicit Deflator - GDP excluding exports and
imports of natural resources
22
Effect of export and import prices on real gross
domestic income excluding natural resources [
(21) – (19)]
a. The Template Table is presented in terms of quarterly data - however it may be possible to compile a monthly time series.
Countries without quarterly estimates are encouraged to compile this table using annual data.
b. Also known as the “trading gains index.”
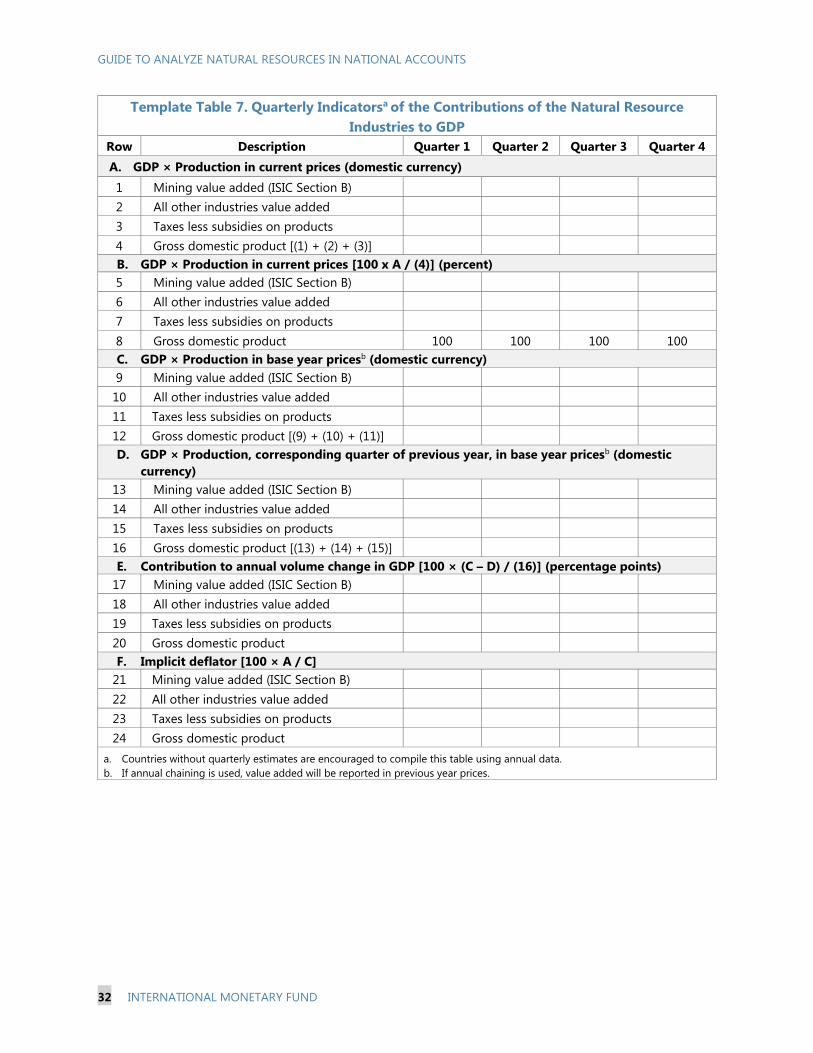
GUIDE TO ANALYZE NATURAL RESOURCES IN NATIONAL ACCOUNTS
32 INTERNATIONAL MONETARY FUND
Template Table 7. Quarterly Indicatorsa of the Contributions of the Natural Resource
Industries to GDP
Row Description Quarter 1 Quarter 2 Quarter 3 Quarter 4
A. GDP × Production in current prices (domestic currency)
1 Mining value added (ISIC Section B)
2 All other industries value added
3 Taxes less subsidies on products
4 Gross domestic product [(1) + (2) + (3)]
B. GDP × Production in current prices [100 x A / (4)] (percent)
5 Mining value added (ISIC Section B)
6 All other industries value added
7 Taxes less subsidies on products
8 Gross domestic product 100 100 100 100
C. GDP × Production in base year pricesb (domestic currency)
9 Mining value added (ISIC Section B)
10 All other industries value added
11 Taxes less subsidies on products
12 Gross domestic product [(9) + (10) + (11)]
D. GDP × Production, corresponding quarter of previous year, in base year pricesb (domestic
currency)
13 Mining value added (ISIC Section B)
14 All other industries value added
15 Taxes less subsidies on products
16 Gross domestic product [(13) + (14) + (15)]
E. Contribution to annual volume change in GDP [100 × (C – D) / (16)] (percentage points)
17 Mining value added (ISIC Section B)
18 All other industries value added
19 Taxes less subsidies on products
20 Gross domestic product
F. Implicit deflator [100 × A / C]
21 Mining value added (ISIC Section B)
22 All other industries value added
23 Taxes less subsidies on products
24 Gross domestic product
a. Countries without quarterly estimates are encouraged to compile this table using annual data.
b. If annual chaining is used, value added will be reported in previous year prices.

GUIDE TO ANALYZE NATURAL RESOURCES IN NATIONAL ACCOUNTS
INTERNATIONAL MONETARY FUND 33
Template Table 8. Quarterly Indicatorsa of the Contributions of Natural Resources to
Exports of Goods and Services
Row Description Quarter 1 Quarter 2 Quarter 3 Quarter 4
A. Exports of Goods and Services in Current Prices (domestic currency)
1 Natural resource products
2 Other products
3 Exports of goods and services [(1) + (2)]
B. Exports of Goods and Services in Current Prices [100 × A / (3)] (percent)
4 Natural resource products
5 Other products
6 Exports of goods and services 100 100 100 100
C. Exports of Goods and Services in Base Year Pricesb (domestic currency)
7 Natural resource products
8 Other products
9 Exports of goods and services [(7) + (8)]
D. Exports of Goods and Services, Corresponding Quarter of Previous Year, in Base Year Pricesb
(domestic currency)
10 Natural resource products
11 Other products
12 Exports of goods and services [(10) + (11)]
E. Contribution to Annual Volume Change in Exports of Goods and Services [100 × (C – D) / (12)]
(percentage points)
13 Natural resource products
14 Other products
15 Exports of goods and services
F. Implicit Deflator [100 × A / C]
16 Natural resource products
17 Other products
18 Exports of goods and services
a. The Template Table is presented in terms of quarterly data - however it may be possible to compile a monthly time series.
Countries without quarterly estimates are encouraged to compile this table using annual data.
b. If annual chaining is used, value added will be reported in previous year prices.