guidance on assessing risk of impact of water
TRANSCRIPT

Guidance on Assessing Risk of Impact of Water Infrastructure Licence Holder Storage Operations on Aquatic Ecosystems
August 2020

This publication has been compiled by the Science Coordination Team, Water Policy, Department of Natural Resources, Mines and Energy. © State of Queensland, 2020 The Queensland Government supports and encourages the dissemination and exchange of its information. The copyright in this publication is licensed under a Creative Commons Attribution 4.0 International (CC BY 4.0) licence. Under this licence you are free, without having to seek our permission, to use this publication in accordance with the licence terms.
You must keep intact the copyright notice and attribute the State of Queensland as the source of the publication. Note: Some content in this publication may have different licence terms as indicated. For more information on this licence, visit https://creativecommons.org/licenses/by/4.0/. The information contained herein is subject to change without notice. The Queensland Government shall not be liable for technical or other errors or omissions contained herein. The reader/user accepts all risks and responsibility for losses, damages, costs and other consequences resulting directly or indirectly from using this information.
Interpreter statement:
The Queensland Government is committed to providing accessible services to Queenslanders from all culturally and linguistically diverse backgrounds. If you have difficulty in understanding this document, you can contact us within Australia on 13QGOV (13 74 68) and we will arrange an interpreter to effectively communicate the report to you.

Purpose Monitoring, evaluation and reporting on the impact of storage operations is an essential part of the adaptive monitoring cycle. Monitoring programs are in place for all water supply schemes across the state, and many of these programs have not been reviewed for some time. Regular review of monitoring programs is beneficial for both scheme operators and the department to ensure monitoring is appropriate, fit for purpose, efficient and cost effective.
If the Water Infrastructure Licence (WIL) holder for a water supply scheme proposes to alter the current water quality, bank slumping or fish stranding monitoring program, this guideline should be used as it presents information to the department in a form that facilitates assessment of the change request. The purpose of this guideline is to support WIL holders in evaluating their current monitoring programs and proposing an alternate monitoring program to the department for approval, based on the outcomes of a risk assessment. This guideline provides a new approach to WIL holder data collection and is part of a series of documents (see diagram below) that form part of the new WIL holder data collection and reporting framework.
This guideline can also be applied in new schemes to design a fit for purpose monitoring program in response to risk. Whether amending or designing a new program, the aim is to design a contemporary monitoring program in response to identified risks from storage operations. Analysis of historical water quality, fish stranding or bank slumping data in the context of flows will enable identification of high risk periods and allow the monitoring programs to be tailored appropriately.
Figure 1: WIL holder data collection and reporting framework
This document is divided into three parts:
Part 1 – Guideline: Provides guidance on how to fill in the template
Part 2 – Risk assessment approach: outlines how to complete the risk assessment
Part 3 – Definitions: provides definitions for key terms used throughout the document
Table of contents Part 1: Guideline .................................................................................................................................... 1
Using the template and guideline .......................................................................................................... 1
Overview ............................................................................................................................................... 1
Step 1: Establish scope, context and criteria ........................................................................................ 2
1.1 Scope ............................................................................................................................................ 2
1.2 Context .......................................................................................................................................... 2
1.2.1 Catchment and site context ..................................................................................................... 2
1.2.2 Water planning context ............................................................................................................ 2
1.3 Risk criteria ................................................................................................................................... 4
Step 2: Risk assessment ...................................................................................................................... 4
2.1 Identification of risks ..................................................................................................................... 4
2.2 Risk analysis ................................................................................................................................. 4
2.3 Risk evaluation and treatment ...................................................................................................... 6
Step 3: Recording and reporting ........................................................................................................... 7
Step 4: Communication and consultation ............................................................................................. 8
Appendix 1 (in template): Catchment map and location of sites .......................................................... 9
Appendix 2 (in template): Site map and photos .................................................................................... 9
Appendix 3 (in template): Supporting water quality information ........................................................... 9
Appendix 4 (in template): Schedule of current monitoring requirements ............................................ 12
Appendix 5 (in template): Schedule of proposed monitoring requirements ........................................ 13
Appendix 6 (in template): Optional additional supporting information to support application ............. 14
Part 2: Risk assessment approach ................................................................................................... 15
Defining likelihood ............................................................................................................................... 15
Defining consequence ........................................................................................................................ 16
Risk ..................................................................................................................................................... 18
Acceptable level of risk ....................................................................................................................... 18
Uncertainty .......................................................................................................................................... 19
Part 3: Definitions ............................................................................................................................... 20
References ........................................................................................................................................... 21

Water Infrastructure Licence holder monitoring program evaluation guideline: Department of Natural Resources, Mines and Energy 1
Part 1: Guideline Using the template and guideline This guideline should be read in conjunction with the Template for assessing risk of impact of Water Infrastructure Licence holder storage operations on aquatic ecosystems (Version 1, June 2020).
Note: The template and guideline are intended for review and amendment of an existing monitoring program. However, the risk-based approach could also be applied in the case where no monitoring program exists, to establish a risk-based monitoring program.
The template is intended to be applied for either one piece of infrastructure, or multiple sites in a water supply scheme. It could be applied for an entire catchment if the number of monitoring sites was minimal (e.g. less than 10 sites).
Overview A risk-based approach to evaluation of monitoring programs has been adopted in this guideline and associated template. The risk-based assessment approach is intended to be applied to water quality monitoring, bank slumping and fish stranding, as these are areas where the operator may reduce the risks to ecosystems through their storage operations.
The risk-based approach is not intended to be used for monitoring of water quantity (e.g. stream flow, storage water level, water use etc). as these are mandatory monitoring requirements that inform a range of water management, water planning and modelling actions, and cannot be amended outside of a water plan review.
Any operations and associated monitoring in conjunction with flood operations are also outside the scope of this risk assessment.
The evaluation approach and steps used in this guide and associated template are adapted from the 2018 ISO Risk Management Guidelines as outlined in Figure 1 below. The process and steps have been modified slightly to ensure they are fit for purpose for review of monitoring programs.
Figure 1: The risk management process from ISO 31000:2018 Risk Management - Guidelines

Water Infrastructure Licence holder monitoring program evaluation guideline: Department of Natural Resources, Mines and Energy 2
Step 1: Establish scope, context and criteria 1.1 Scope The purpose of Step 1 is to establish the scope of the monitoring program being assessed as well as the context in terms of catchment and site context.
Either the full program or a subset of this monitoring may be considered in the template for review (e.g. just water quality monitoring at selected sites). Table 3 in section 2.1 of the template should be used to demonstrate which risks are in and out of scope of the assessment. Further notes on scope are provided in the ‘Overview’ section above.
1.2 Context 1.2.1 Catchment and site context A series of questions are asked in the template to understand the catchment and site context (see
Table 1 below)
Table 1 (in template): Catchment and site context Context questions Rationale Catchment context How many water quality (WQ) sampling sites are there in the catchment and how many sites does this proposal relate to?
The intent of this question is to understand the catchment context and what other monitoring is occurring in the catchment. For example, would there be any monitoring sites remaining if this proposal is approved? The applicant is requested to show on a map (Appendix 1 in template) the sites proposed for removal and remaining sites in the catchment and provide a table of all sites with lat/longs.
Site context Describe the site features e.g. impoundment type and show location in the catchment
The applicant is requested to briefly describe the infrastructure features and provide a map showing the location of the sampling site/s in relation to the infrastructure as well as photos (see Appendix 2 of the template).
Provide a short overview of operating arrangements for the storage and whether there is any ability to influence downstream WQ
Briefly describe the operating arrangements for the storage and any ability or requirements of the storage to release flows, and any passing flow requirements.
Which monitoring is being reviewed at this site/s?
Are all or some sites/sampling points under review? Are all or some parameters under review?
How well characterised is the site/s? Describe briefly how well characterised the site is in terms of water quality trends. Provide supporting WQ sampling information in Appendix 3 of the template.
Have any issues been identified? E.g. exceedance of water quality objectives
Have any issues with WQ been identified in the past. If so have they been resolved?
Knowledge gaps? Are there any important knowledge gaps that continuation of monitoring would assist with?
1.2.2 Water planning context The purpose of this section is to identify the ecological outcomes to which the monitoring relates and how these outcomes are delivered through the water plan by the strategies in the Resource Operations Plan (ROP) or Water Management Protocol (WMP). WIL monitoring is used to assess the effectiveness of the strategies in the plan and the operating rules in delivering the outcomes of the plan.

Water Infrastructure Licence holder monitoring program evaluation guideline: Department of Natural Resources, Mines and Energy 3
Table 2 (in template): Ecological outcomes that apply Table 2 headings Rationale Example Location Describe location e.g. infrastructure
and/or Water Supply Scheme name Cedar Grove Weir
General and ecological outcomes that apply
List any specific outcomes in the plan that relate to water quality in general, or water quality at this location
11a For the Logan and Albert Rivers estuary- (i) To minimise changes to the
delivery of fresh water, sediment, nutrients and organic matter to the estuary and southern Moreton Bay
(ii) To minimise changes to the brackish water habitat in the estuary
Plan measures or monitoring strategies that apply
List any specific plan measures that relate to water quality or any specific monitoring requirements under a Monitoring, Evaluation and Reporting Strategy (MERS).
None apply
ROP / WMP strategies that deliver outcomes
List the relevant Resource Operation Plan (ROP) or Water Management Protocol (WMP) strategies that apply.
Check ROP
Comments Any comments that may assist to set the context relating to the achievement of outcomes in the scheme, and the ability of the infrastructure management to influence outcomes.
E.g. does the operation of the storage either positively or negatively affect the passage of sediment, nutrients, organic matter or salinity? Does this vary over time (e.g. different in high flow events, baseflow/low flows and nil flows?)

Water Infrastructure Licence holder monitoring program evaluation guideline: Department of Natural Resources, Mines and Energy 4
1.3 Risk criteria For more information on the risk assessment method and the criteria to be used to evaluate risks, see Part B of this document. For definitions, see Part C.
Term Application of categories Likelihood Separate categories of likelihood are proposed for water quality risks, as distinct
from risks relating to bank slumping and fish stranding / fish kills Consequence Separate categories of consequence are proposed for water quality risks, as distinct
from risks relating to bank slumping and fish stranding / fish kills. For water quality risks, consider both the impacts on environmental values (EVs) and water quality, and whether there is a short term, medium term or long term non-compliance in assigning a consequence ranking
Risk Risk is the product of likelihood and consequence (see risk assessment matrix in part B of this document)
Acceptable level of risk
Risks falling into the ‘low’ category are considered acceptable. For risks identified as medium or high, a risk mitigation action is required. This action may be to put in additional management controls to minimise risk, and/or to continue monitoring at the site.
Uncertainty Note: Slightly different definitions have been provided for uncertainty for risks relating to water quality vs bank slumping and fish stranding / fish kills
Step 2: Risk assessment 2.1 Identification of risks In Table 3 of the template the WIL holder is asked to identify all the possible risks that exist for comprehensiveness and then identify which of those are out of scope for this assessment and why. Table 3: Identification of risks in scope of assessment
Table 3 headings Rationale Example Risk In this column, identify all possible risks to
ecosystems that could result from the operation of the storage.
Bank slumping
Caused by (hazard) Identify the underlying cause of the risk Destabilisation of banks exacerbated by continued releases from storage
Able to be influenced by scheme /storage management
Are there any ways that storage management could reduce the risk? If so the risk should be ranked and is in scope of the risk assessment
Yes
In scope of this proposal to amend monitoring
Is the monitoring (in this case monitoring of bank slumping) in scope for amendment of this proposal.
No – this proposal to amend monitoring only relates to WQ sampling
Flow stages at which risk applies
Does this risk occur at all types of flow stages or just at high flows?
Event (high flow) only
Comment Any other comments relevant to the assessment or mitigation of risk?
Rock cage structures already installed on both banks downstream to mitigate bank slumping.
2.2 Risk analysis Use the definitions of likelihood, consequence, risk level and uncertainty in Attachment 1 of this guideline to score each aspect.
Use Table 4 in the template to record the results of the risk assessment, including justification of scores. Explanation of expectations for each column are provided below.

Water Infrastructure Licence holder monitoring program evaluation guideline: Department of Natural Resources, Mines and Energy 5
Table 4 (in template): Risk ranking table
Table 4 headings Explanation of information required Example Site Location Indicate position of site in relation to
infrastructure e.g. upstream or downstream 1a U/S Storage
Risk Describe risk being assessed Water quality impacted by weir operation
Flow stage Assess risk for high flows (flow event) and baseflow (ambient) conditions (see definitions above).
High flow (flow event)
Comment on risk factors / current situation (Step 1: Define the context)
Use this field to describe the context for the risk, what is the current situation based on the data
Upstream water has strong stratification.
Likelihood score Using the data and the definitions in Tables 8 and 9 of Appendix 1, rank the likelihood from rare to almost certain
Rare (1)
Justification and reference to supporting evidence
Provide a short 1 sentence justification referring to data if available
Previous sampling records show water quality impacts from weir operations are rare (Appendix 4)
Consequence score for (A) storage ecosystem, (B) downstream ecosystem and (C) environmental values / WQ
Using the data and the definitions in Tables 10 of Appendix 1, rank the consequence from insignificant to catastrophic. Rank consequence for the ecosystem within the storage (A), the downstream ecosystem (B), and the relevant environmental values at this site related to water quality (C). For all water quality related risks, consider the impacts on EVs and whether there is a short term, medium term or long term impact when assigning the consequence ranking.
A Minor (2) B Minor (2) C Minor (2)
Overall consequence ranking
If rankings above differ, carry the most severe ranking through to the overall score.
Minor (2)
Justification and reference to supporting evidence
Discuss impacts in terms of severity and length of impact and refer to any supporting information
If an impact were to occur, the impact would be temporary, as U/S and D/S ecosystems are adapted to fluctuations in WQ and secondary recreation could still occur
Risk level Use the Risk Assessment Matrix (Table 11) in Appendix 1 of the template to assign a risk ranking
Low (2)
Uncertainty ranking Use the uncertainty rankings provided in Table 13 in Appendix 1 of the template to assign a risk ranking. The uncertainty ranking expresses how confident you are in your likelihood and consequence assessments.
Confident (4)
Comments on uncertainty ranking
Explain justification for uncertainty ranking i.e. if data are available or not to support assessment. You may be more confident in the likelihood ranking than the consequence ranking, for example, and a comment to this effect and why can be made here.
Likelihood rankings supported by previous sampling records in Appendix 4, therefore confident.

Water Infrastructure Licence holder monitoring program evaluation guideline: Department of Natural Resources, Mines and Energy 6
2.3 Risk evaluation and treatment This section considers evaluation and treatment of the risk. In this situation, the monitoring program is likely to be the primary treatment, unless additional management and mitigation strategies have been identified through this process.
In this section, the applicant is asked to summarise the current program and the changes proposed, relative to the risk level assessed. Table 5 in the template is a summary of a number of sections and appendices, which can be referred to for more detail. The intention of bringing this information together in this section is to complete the monitoring program review and use the results of the risk assessment to inform the evaluation and review of the monitoring program. Table 5 (in template): Proposed changes to monitoring program
Table 5 headings Explanation of information required
Example
Scheme Name of water supply scheme that application applies to
Logan
DNRME Site ID Site ID allocated by DNRME if known
560/559
Site location Description of site location. The applicant is requested to provide a map in Appendix 1 and 2 of the template.
Cedar Grove Weir H/W
ROL holder site code Side ID allocated by WIL holder LRS-SP012 Risk level Overall risk level from risk
assessment (section 2.2 of template)
LOW
Description of current monitoring (frequency, parameters etc)
Briefly describe the current monitoring program including the frequency of measurement and the water quality parameters sampled. Refer to Appendix 4 of template for more information on a site by site basis of information currently collected
Monthly cyanobacteria, nitrogen, phosphorus,
Description of modifications proposed
Briefly describe what modifications to the sampling program are proposed e.g. change in frequency, change in parameters, cease monitoring altogether. Refer to Appendix 5 in the template for more information on a site by site basis of proposed changes to the monitoring program.
Maintain current WIL monitoring and reporting as per Appendix 5
Comments on proposed program in relation to risk
Given the risk level above, comment on the appropriateness of the modification to the monitoring program.
Low risk. Maintain surveillance monitoring. Well characterised site, no impacts associated with weir releases / overtopping.
Alternative monitoring plan to address any WH&S issues identified
Briefly provide information on proposed alternatives to the approved monitoring e.g. alternative sites or technologies for sampling. Refer to Appendix 5 in template for more information on a site by site basis of any contingency plan.
E.g. In the case of high flows being too dangerous for sampling, the WIL holder will deploy a robotic sampler, drone etc.
Water Infrastructure Licence holder monitoring program evaluation guideline: Department of Natural Resources, Mines and Energy 7
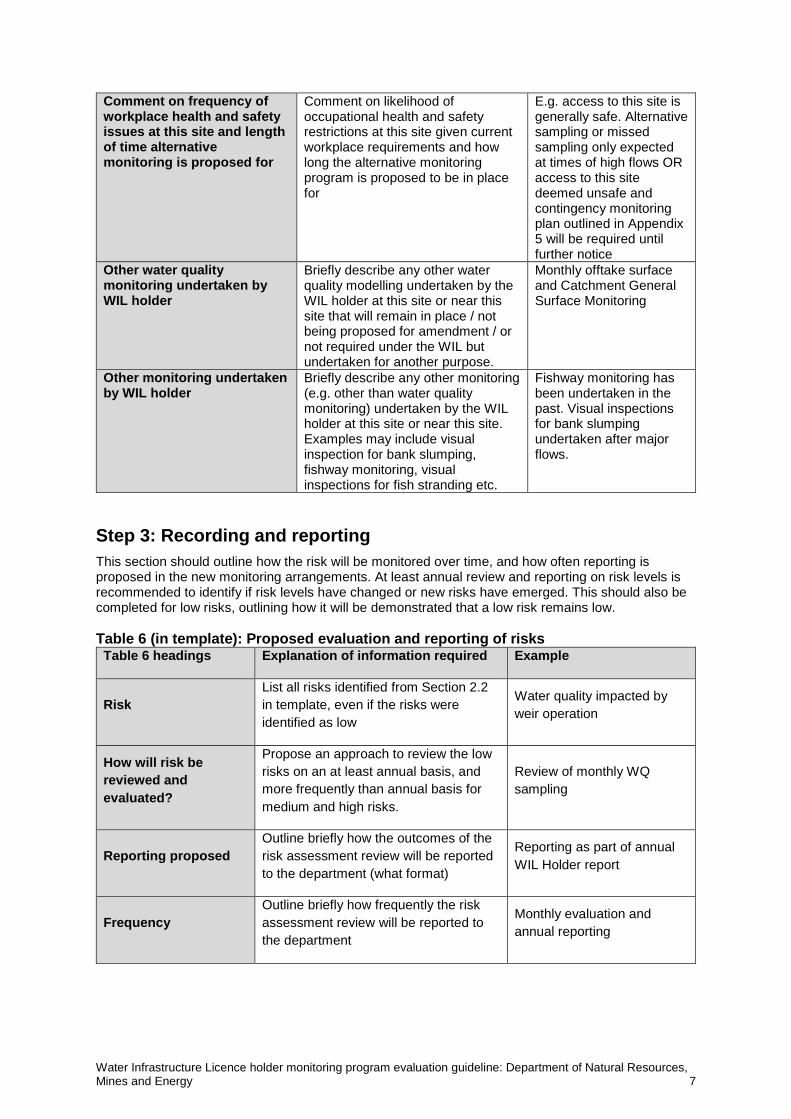
Comment on frequency of workplace health and safety issues at this site and length of time alternative monitoring is proposed for
Comment on likelihood of occupational health and safety restrictions at this site given current workplace requirements and how long the alternative monitoring program is proposed to be in place for
E.g. access to this site is generally safe. Alternative sampling or missed sampling only expected at times of high flows OR access to this site deemed unsafe and contingency monitoring plan outlined in Appendix 5 will be required until further notice
Other water quality monitoring undertaken by WIL holder
Briefly describe any other water quality modelling undertaken by the WIL holder at this site or near this site that will remain in place / not being proposed for amendment / or not required under the WIL but undertaken for another purpose.
Monthly offtake surface and Catchment General Surface Monitoring
Other monitoring undertaken by WIL holder
Briefly describe any other monitoring (e.g. other than water quality monitoring) undertaken by the WIL holder at this site or near this site. Examples may include visual inspection for bank slumping, fishway monitoring, visual inspections for fish stranding etc.
Fishway monitoring has been undertaken in the past. Visual inspections for bank slumping undertaken after major flows.
Step 3: Recording and reporting This section should outline how the risk will be monitored over time, and how often reporting is proposed in the new monitoring arrangements. At least annual review and reporting on risk levels is recommended to identify if risk levels have changed or new risks have emerged. This should also be completed for low risks, outlining how it will be demonstrated that a low risk remains low. Table 6 (in template): Proposed evaluation and reporting of risks
Table 6 headings Explanation of information required Example
Risk List all risks identified from Section 2.2 in template, even if the risks were identified as low
Water quality impacted by weir operation
How will risk be reviewed and evaluated?
Propose an approach to review the low risks on an at least annual basis, and more frequently than annual basis for medium and high risks.
Review of monthly WQ sampling
Reporting proposed Outline briefly how the outcomes of the risk assessment review will be reported to the department (what format)
Reporting as part of annual WIL Holder report
Frequency Outline briefly how frequently the risk assessment review will be reported to the department
Monthly evaluation and annual reporting
Water Infrastructure Licence holder monitoring program evaluation guideline: Department of Natural Resources, Mines and Energy 8
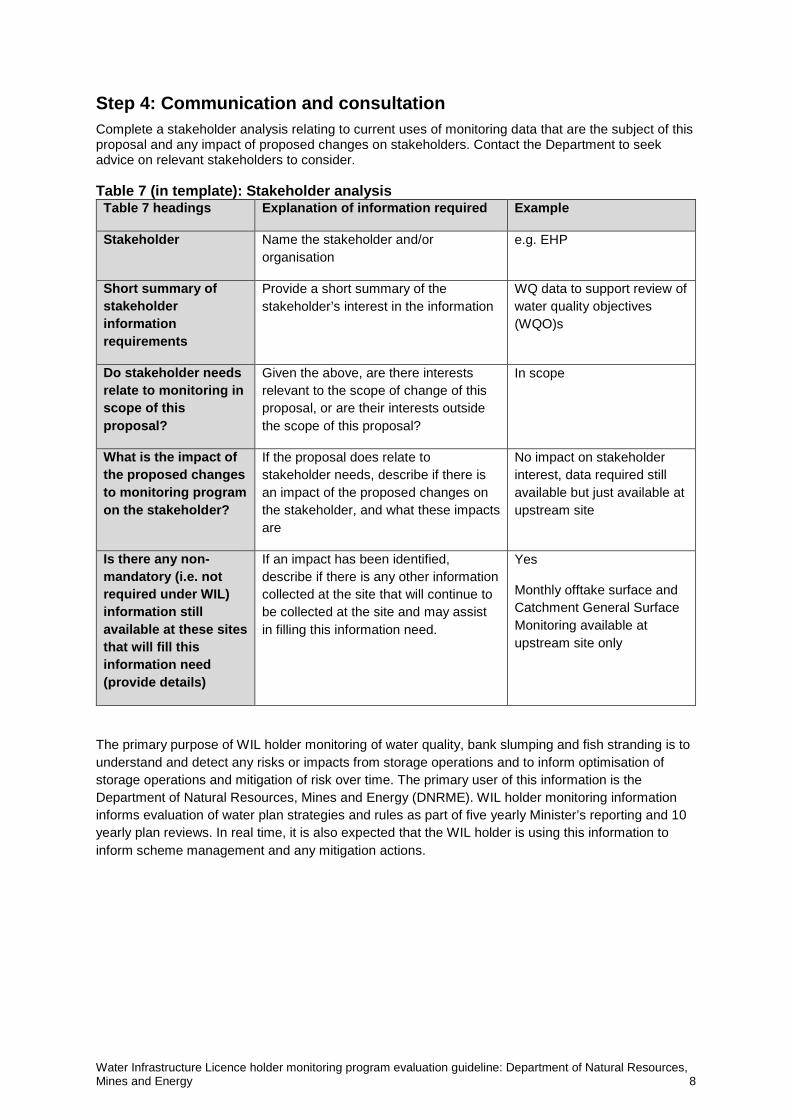
Step 4: Communication and consultation Complete a stakeholder analysis relating to current uses of monitoring data that are the subject of this proposal and any impact of proposed changes on stakeholders. Contact the Department to seek advice on relevant stakeholders to consider. Table 7 (in template): Stakeholder analysis
Table 7 headings Explanation of information required Example
Stakeholder Name the stakeholder and/or organisation
e.g. EHP
Short summary of stakeholder information requirements
Provide a short summary of the stakeholder’s interest in the information
WQ data to support review of water quality objectives (WQO)s
Do stakeholder needs relate to monitoring in scope of this proposal?
Given the above, are there interests relevant to the scope of change of this proposal, or are their interests outside the scope of this proposal?
In scope
What is the impact of the proposed changes to monitoring program on the stakeholder?
If the proposal does relate to stakeholder needs, describe if there is an impact of the proposed changes on the stakeholder, and what these impacts are
No impact on stakeholder interest, data required still available but just available at upstream site
Is there any non-mandatory (i.e. not required under WIL) information still available at these sites that will fill this information need (provide details)
If an impact has been identified, describe if there is any other information collected at the site that will continue to be collected at the site and may assist in filling this information need.
Yes
Monthly offtake surface and Catchment General Surface Monitoring available at upstream site only
The primary purpose of WIL holder monitoring of water quality, bank slumping and fish stranding is to understand and detect any risks or impacts from storage operations and to inform optimisation of storage operations and mitigation of risk over time. The primary user of this information is the Department of Natural Resources, Mines and Energy (DNRME). WIL holder monitoring information informs evaluation of water plan strategies and rules as part of five yearly Minister’s reporting and 10 yearly plan reviews. In real time, it is also expected that the WIL holder is using this information to inform scheme management and any mitigation actions.
Water Infrastructure Licence holder monitoring program evaluation guideline: Department of Natural Resources, Mines and Energy 9
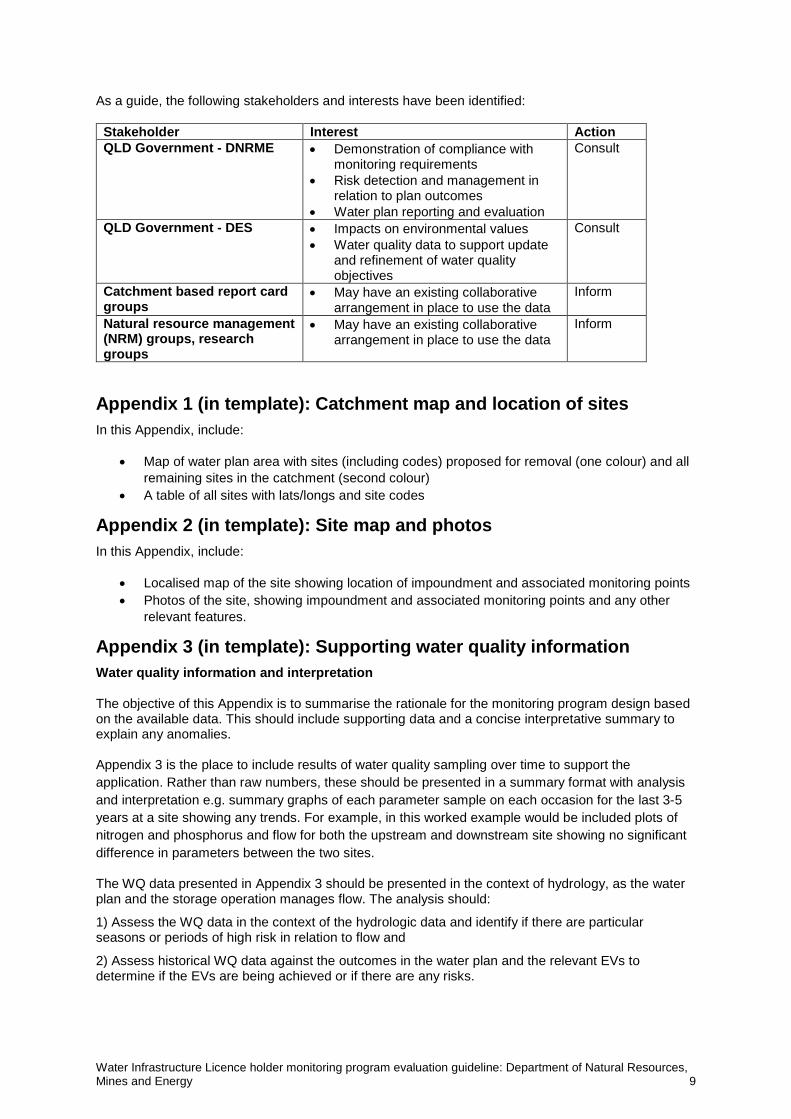
As a guide, the following stakeholders and interests have been identified:
Stakeholder Interest Action QLD Government - DNRME • Demonstration of compliance with
monitoring requirements • Risk detection and management in
relation to plan outcomes • Water plan reporting and evaluation
Consult
QLD Government - DES • Impacts on environmental values • Water quality data to support update
and refinement of water quality objectives
Consult
Catchment based report card groups
• May have an existing collaborative arrangement in place to use the data
Inform
Natural resource management (NRM) groups, research groups
• May have an existing collaborative arrangement in place to use the data
Inform
Appendix 1 (in template): Catchment map and location of sites In this Appendix, include:
• Map of water plan area with sites (including codes) proposed for removal (one colour) and all remaining sites in the catchment (second colour)
• A table of all sites with lats/longs and site codes
Appendix 2 (in template): Site map and photos In this Appendix, include:
• Localised map of the site showing location of impoundment and associated monitoring points • Photos of the site, showing impoundment and associated monitoring points and any other
relevant features.
Appendix 3 (in template): Supporting water quality information Water quality information and interpretation
The objective of this Appendix is to summarise the rationale for the monitoring program design based on the available data. This should include supporting data and a concise interpretative summary to explain any anomalies. Appendix 3 is the place to include results of water quality sampling over time to support the application. Rather than raw numbers, these should be presented in a summary format with analysis and interpretation e.g. summary graphs of each parameter sample on each occasion for the last 3-5 years at a site showing any trends. For example, in this worked example would be included plots of nitrogen and phosphorus and flow for both the upstream and downstream site showing no significant difference in parameters between the two sites.
The WQ data presented in Appendix 3 should be presented in the context of hydrology, as the water plan and the storage operation manages flow. The analysis should:
1) Assess the WQ data in the context of the hydrologic data and identify if there are particular seasons or periods of high risk in relation to flow and
2) Assess historical WQ data against the outcomes in the water plan and the relevant EVs to determine if the EVs are being achieved or if there are any risks.

Water Infrastructure Licence holder monitoring program evaluation guideline: Department of Natural Resources, Mines and Energy 10
Because water quality is strongly dependent on flow, we have specified that risk be considered under both high flows and low flows, consistent with the Queensland Water Quality Guidelines. Therefore, the years of record provided as supporting information should include both wet and dry years, with water quality recorded under a range of flow conditions e.g. high flow events, baseflow/low flows and nil flows (see example figure below).
Figure 1a Generic flow duration curve for stream in a wetter coastal area of Queensland. Source: Queensland Water Quality Guidelines 2009
Figure 1b Generic flow duration curve for an ephemeral stream in Queensland. Source: Queensland Water Quality Guidelines 2009
Interpretation of water quality information
In this section provide an interpretation of the water quality information (above) and explain any anomalies.
Assessment of impact on water plan outcomes and environmental values
In this section, use the table in the template to:
a) List the relevant plan outcomes to be considered, including general, ecological / environmental, economic, social and cultural outcomes
b) List the relevant environmental values c) Provide an assessment of what the data are showing in terms of achievement of plan
outcomes and environmental values
Environmental values related to each type of outcome are shown in Table 8. In considering risks to plan outcomes, also consider the relevant EVs and if there are any risks from storage operations to the EVs below.

Water Infrastructure Licence holder monitoring program evaluation guideline: Department of Natural Resources, Mines and Energy 11
Table 8: Alignment between water plan outcomes and environmental values
Minimum number of records before a change can be proposed
The number of records that are required to display risks over a range of climatic and flow conditions will vary depending on the area of the state, the type of stream and the recent climatic history. As a guide, provide a representative range of climatic extremes.
Designing or proposing a new monitoring program based on risk
Depending on when the risk is experienced by the ecosystem, it may make more sense in well characterised systems to complete a seasonal monitoring program rather than monthly sampling throughout the entire year. Such a proposal would need to be supported by the information presented in the risk assessment and presentation of water quality results in Appendix 3 in the context of streamflow.

Water Infrastructure Licence holder monitoring program evaluation guideline: Department of Natural Resources, Mines and Energy 12
Appendix 4 (in template): Schedule of current monitoring requirements The purpose of this section is to document the current monitoring program requirements under the WIL on a site by site basis for each Water Supply Scheme to provide clarity for the assessment panel on what monitoring is currently in place, and what the proposed changes are (as shown in Appendix 5). This Appendix also outlines the current contingencies if sampling at each site is deemed unsafe.
Appendix 4 Table headings Explanation of information required Example
Site ID List both DNRME and WIL holder site ID if known
DNRME: 560/559 Seqwater: LRS-SP012
Site location Description of site location Cedar Grove Weir Headwater
Monitoring parameters List the water quality parameters currently required to be collected at this site under the WIL
Cyanobacteria, Nitrogen, Phosphorus
Frequency
Describe the frequency of measurement of the water quality parameters listed above as required under the WIL. Note if the frequencies are different for each parameter the easiest way to do this may be to put the frequency in brackets after each parameter above
Monthly
Workplace health and safety*
Alternative site/s or frequency contingency
Outline briefly what current contingency arrangements are in place in terms of alternate sites or sampling frequency when a sample can’t be taken for workplace health and safety reasons.
For example, the contingency may be to sample at a nearby upstream or downstream site instead, or reduce the frequency of sampling at the site to only those instances where safe to do so (if WHS risk is flow related)
Alternative measurement / other contingency
Outline briefly what current contingency arrangements are in place in terms of other measurement options when a sample can’t be taken for workplace health and safety reasons.
For example, the contingency may be to use alternative measurement technology such as automatic samplers, robotic samplers, drones etc when not safe for staff to access the site.
Other comments Make any other comments relevant to the current monitoring program here
*Note: the WIL holder may propose alternative monitoring sites, frequencies, measurement technologies etc. on a temporary basis to overcome particular Workplace Health and Safety Issues identified. The alternative monitoring program should not be in place more than 12 months. If it is required for more than 12 months the WIL holder needs to submit the alternative monitoring program as the ongoing monitoring program for re-approval.

Water Infrastructure Licence holder monitoring program evaluation guideline: Department of Natural Resources, Mines and Energy 13
Appendix 5 (in template): Schedule of proposed monitoring requirements The purpose of this section is to document the proposed monitoring program arrangements under the WIL on a site by site basis for each Water Supply Scheme to provide clarity for the assessment panel on what the proposed changes are and what the new monitoring program will look like. Once approved, this schedule will be published in the updated WIL. This Appendix also outlines the current contingencies if sampling at each site is deemed unsafe.
Appendix 5 Table headings Explanation of information required Example
Site ID List both DNRME and WIL holder site ID if known
DNRME: 560/559
Seqwater: LRS-SP012
Site location Description of site location Cedar Grove Weir H/W
Monitoring parameters List the water quality parameters proposed to be collected at this site under the WIL
Cyanobacteria, Nitrogen, Phosphorus (no change)
Frequency
Describe the frequency of measurement of the water quality parameters listed above as required under the WIL. Note if the frequencies are different for each parameter the easiest way to do this may be to put the frequency in brackets after each parameter above
Monthly (no change)
Workplace health and safety*
Alternative site/s or frequency contingency
Outline briefly what proposed contingency arrangements are in place in terms of alternate sites or sampling frequency when a sample can’t be taken for workplace health and safety reasons.
For example, the contingency may be to sample at a nearby upstream or downstream site instead, or reduce the frequency of sampling at the site to only those instances where safe to do so (if WHS risk is flow related)
Alternative measurement / other contingency
Outline briefly what proposed contingency arrangements are in place in terms of other measurement options when a sample can’t be taken for workplace health and safety reasons.
For example, the contingency may be to use alternative measurement technology such as automatic samplers, robotic samplers, drones etc when not safe for staff to access the site.
Other comments Make any other comments relevant to the proposed monitoring program here
Water Infrastructure Licence holder monitoring program evaluation guideline: Department of Natural Resources, Mines and Energy 14
Appendix 6 (in template): Optional additional supporting information to support application In this section the WIL holder may include additional materials such as catchment characterisations or conceptual models to support the application. It is requested this additional information is no more than 10 pages.
Water Infrastructure Licence holder monitoring program evaluation guideline 15
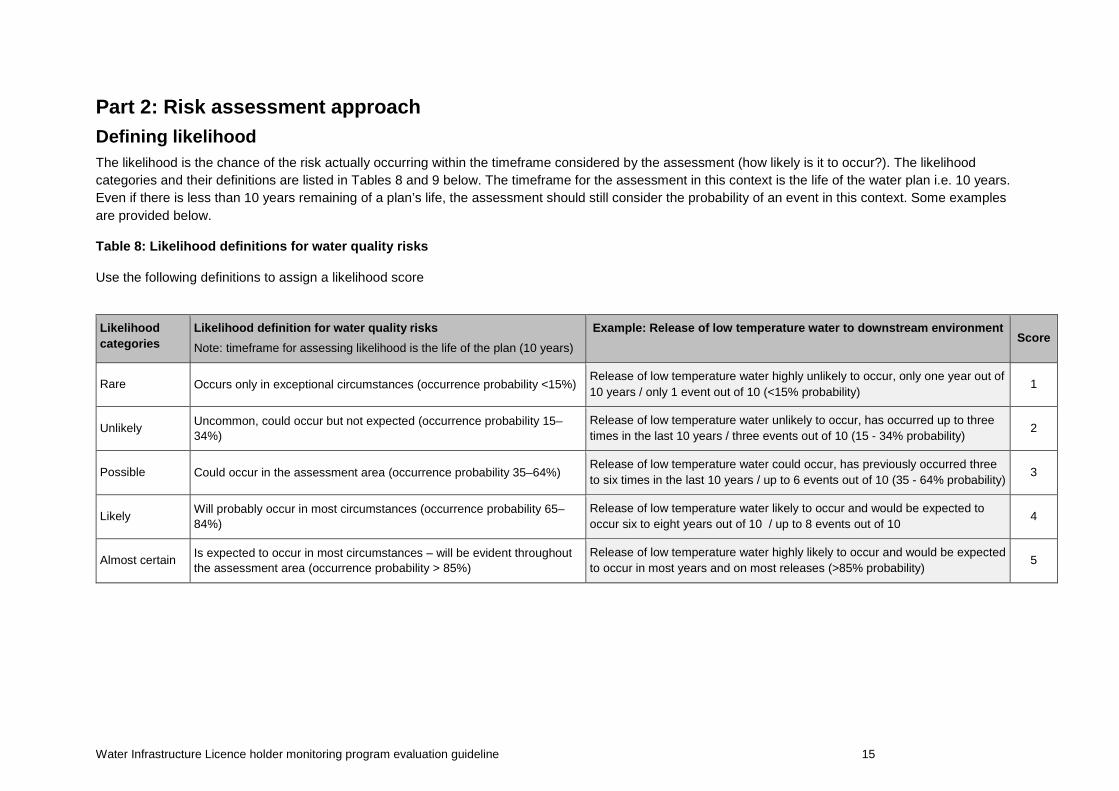
Part 2: Risk assessment approach Defining likelihood The likelihood is the chance of the risk actually occurring within the timeframe considered by the assessment (how likely is it to occur?). The likelihood categories and their definitions are listed in Tables 8 and 9 below. The timeframe for the assessment in this context is the life of the water plan i.e. 10 years. Even if there is less than 10 years remaining of a plan’s life, the assessment should still consider the probability of an event in this context. Some examples are provided below.
Table 8: Likelihood definitions for water quality risks
Use the following definitions to assign a likelihood score
Likelihood categories
Likelihood definition for water quality risks Note: timeframe for assessing likelihood is the life of the plan (10 years)
Example: Release of low temperature water to downstream environment Score
Rare Occurs only in exceptional circumstances (occurrence probability <15%) Release of low temperature water highly unlikely to occur, only one year out of 10 years / only 1 event out of 10 (<15% probability) 1
Unlikely Uncommon, could occur but not expected (occurrence probability 15–34%)
Release of low temperature water unlikely to occur, has occurred up to three times in the last 10 years / three events out of 10 (15 - 34% probability) 2
Possible Could occur in the assessment area (occurrence probability 35–64%) Release of low temperature water could occur, has previously occurred three to six times in the last 10 years / up to 6 events out of 10 (35 - 64% probability) 3
Likely Will probably occur in most circumstances (occurrence probability 65–84%)
Release of low temperature water likely to occur and would be expected to occur six to eight years out of 10 / up to 8 events out of 10 4
Almost certain Is expected to occur in most circumstances – will be evident throughout the assessment area (occurrence probability > 85%)
Release of low temperature water highly likely to occur and would be expected to occur in most years and on most releases (>85% probability) 5

Water Infrastructure Licence holder monitoring program evaluation guideline 16
Table 9: Likelihood definitions for bank slumping and fish stranding / fish kills
Defining consequence Consequence is the expected impact on the environmental values, should a risk actually occur. This is separate to the consideration of how likely something is to occur (covered by Likelihood above).
Likelihood categories
Likelihood definition for bank slumping or fish stranding / fish kills Note: timeframe for assessing likelihood is the life of the plan 10yrs
Example: Bank slumping Score
Rare Occurs only in exceptional circumstances (occurrence probability <15%)
Bank slumping highly unlikely to occur, only one recorded slumping in the last 10 years / 1 event out of 10 (<15% probability) 1
Unlikely Uncommon, could occur but not expected (occurrence probability 15–34%)
Bank slumping unlikely to occur, has only occurred two or three times in the last 10 years / three events out of 10 (15 - 34% probability) 2
Possible Could occur in the assessment area (occurrence probability 35–64%) Bank slumping could occur, has previously occurred three to six times in the last 10 years / up to six events out of 10 (35 - 64% probability) 3
Likely Will probably occur in most circumstances (occurrence probability 65–84%)
Bank slumping is likely to occur and would be expected to occur six to eight years out of 10 / up to eight events out of 10 4
Almost certain Is expected to occur in most circumstances – will be evident throughout the assessment area (occurrence probability > 85%)
Bank slumping is likely to occur and would be expected to occur in most years and on most releases (>85% probability) 5

Water Infrastructure Licence holder monitoring program evaluation guideline 17
Table 10: Consequence definitions for water quality risks, bank slumping, fish stranding / fish kills
Use the following definitions to assign a consequence score.
Consequence Consequence descriptions of impacts on
ecosystems from bank stranding, fish stranding / fish kills
Consequence descriptions of impacts on environmental values (EVs) and water
quality
Non-compliance with guideline values (from
Queensland Water Quality Guidelines 2009 (s.5.1)
Example: Release of low temperature water to
downstream environment Score
Insignificant Impact on aquatic ecosystems is negligible/undetectable
No impact to aquatic ecosystem Environmental Value. Undetectable change from current water quality.
Short term (a few days) non-compliance. May be due to storm inflow or pollutant discharges in dry times
Insignificant change of overall temperature of water downstream
1
Minor
Minimal detectable impact on aquatic ecosystems, minor reduction in population size and community structure, change in food resource availability, recovery likely within a short time frame
Minimal impact to the aquatic ecosystem Environmental Value. Deterioration of current water quality is detectable, albeit minimal, and may result in non-compliance with aquatic ecosystem local water quality targets
Minor changes in downstream temperature, easily recovered to normal temperature, aquatic species largely unaffected
2
Moderate
Obvious and significant impacts on aquatic ecosystems, change in community structure (loss of sensitive species), moderate habitat disturbance and loss, recovery possible within years.
Some impact to the aquatic ecosystem Environmental Value. Deterioration of current water quality results in non-compliance with some aquatic ecosystem local water quality targets. The aquatic ecosystem is able to recover in the short-medium term.
Medium term (weeks to a few months) intermittent, cyclic or seasonal non-compliance with guideline values
Obvious changes to downstream water temperature, many aquatic species affected, slow to resume normal temperature
3
Major
Significant spatial and temporal impact on aquatic ecosystems, changes to long-term recruitment processes possibly leading to local extinction of one or more populations, loss of sensitive species, major changes in food resources and food webs, major habitat loss.
Major impact to the aquatic ecosystem Environmental Value. Deterioration of current water quality results in significant non-compliance with aquatic ecosystem local water quality targets. The aquatic ecosystem may recover in the long term or impacts may be permanent.
Chronic long term non-compliance – months to years. Small but consistent shift in pollutant values above guidelines
Significant changes to downstream water temperature over a large area and long enough to lead to major ecosystem changes including possible local extinctions
4
Catastrophic Extreme and widespread impacts – loss of species, dramatic changes to
Disastrous impact to the aquatic ecosystem Environmental Value.
Major widespread and longstanding change to
5

Water Infrastructure Licence holder monitoring program evaluation guideline 18
Consequence Consequence descriptions of impacts on
ecosystems from bank stranding, fish stranding / fish kills
Consequence descriptions of impacts on environmental values (EVs) and water
quality
Non-compliance with guideline values (from
Queensland Water Quality Guidelines 2009 (s.5.1)
Example: Release of low temperature water to
downstream environment Score
communities and ecosystem functions, replaced with generalists, exotic biota, and extensive loss of habitat.
Deterioration of current water quality results in no ability to maintain aquatic ecosystem local water quality targets. Permanent and irreversible impacts to ecosystems.
downstream water temperature, causing dramatic and lasting changes to communities and ecosystems
Risk Risk is the product of the probability of an event (likelihood) combined with its potential severity (consequence). Based on the scores for likelihood and consequence, assign the level of risk as low, medium or high using the risk assessment matrix (Table 11).
Table 11: Risk assessment matrix
Likelihood
Consequence Insignificant
1 Minor
2 Moderate
3 Major
4 Catastrophic
5 Rare 1 1 2 3 4 5 Unlikely 2 2 4 6 8 10 Possible 3 3 6 9 12 15 Likely 4 4 8 12 16 20 Almost certain 5 5 10 15 20 25
Acceptable level of risk
Acceptable level of risk – the level of risk which is considered tolerable and no mitigation actions are required. Risks falling into the ‘low’ category (see tables 12 in Appendix 1 of the template are considered acceptable.

Water Infrastructure Licence holder monitoring program evaluation guideline 19
Table 12: Level of risk and response required
Risk ranking Scores Response to risks High 12–25 At levels of risk from 12-25, the risk is high and risk mitigation action is required Medium 8–11 At levels of risk from 8-11, the risk is medium and risk mitigation action is required Low 1–7 At levels of 7 or below, the risk is low and is considered acceptable
Uncertainty Uncertainty is a measure of confidence around the risk assessment score and whether the underpinning likelihood and consequence scores represent the true values. Use the table below to rank uncertainty. Note slightly different definitions have been adopted.
Table 13: Uncertainty definitions and scores for water quality
Category Definition for water quality Definition for fish stranding, fish kills or bank slumping Score Uncertain There is limited or no monitoring data available and the processes are
not well understood. No system in place for collection or storage of data
There is limited or no monitoring data available and the processes are not well understood.
1
Estimate There is limited monitoring data available and there is a reasonable understanding of the processes involved. No system in place for collection or storage of data
There is limited monitoring data available and there is a reasonable understanding of the processes involved.
2
Reliable There is at least a year of continuous* monitoring data available, which has been assessed and there is a good understanding of the processes involved. Some processes in place to ensure quality of data collection and storage.
There is at least a year of monitoring data available, which has been assessed and there is a good understanding of the processes involved.
3
Confident There is 5 years of continuous* monitoring data, which has been collated and assessed, with at least monthly monitoring or for the duration of seasonal events. There is a good understanding of the processes involved. Well-developed systems in place for collection and storage of data
There is 5 years of monitoring data, which has been collated and assessed, with at least monthly monitoring or monitoring for the duration of the release season.
4
Certain There is 5 years of continuous* monitoring data, which has been trended and assessed, with at least daily monitoring. The processes involved are thoroughly understood. Certified quality management system in place for collection and storage of data
There is 5 years of monitoring data, which has been trended and assessed, with monitoring undertaken for every release or at least daily. The processes involved are thoroughly understood.
5
*Continuous monitoring data means monitoring data from samples taken frequently enough to characterise the variability of the site conditions and with few missing records.

Water Infrastructure Licence holder monitoring program evaluation guideline 20
Part 3: Definitions Term Definition Likelihood The likelihood is the chance of the risk actually occurring within the timeframe
considered by the assessment (10 years) - how likely it is to occur. Consequence Consequence is the expected impact on the environmental values, should a risk
actually occur. This is separate to the consideration of how likely something is to occur (covered by Likelihood above).
Risk Risk is the product of the probability of an event (likelihood) combined with its potential severity (consequence).
Acceptable level of risk
The level of risk which is considered tolerable and no mitigation actions are required.
Uncertainty A measure of confidence around the risk assessment score – do the underpinning likelihood and consequence scores represent the true values?
Thermal stratification
Thermal Stratification is a vertical difference in temperature from the top to the bottom of a water body (Source: Chudek 1998)
• If the temperature difference between the upper layer (epilimnion) and deeper layer (hypolimnion) of water in a storage is greater than 5 degrees, the storage is termed strongly stratified
• If the temperature difference between the upper layer (epilimnion) and deeper layer (hypolimnion) of water in a storage is less than 5 degrees, the storage is termed weakly stratified
Infrastructure Instream storages such as a dam or weir that has the potential to impact environmental values
Bank slumping
Destabilisation of banks exacerbated by continued releases from storages
Fish stranding Isolation of fish or other fauna, e.g. turtles, to a confined area of the channel or off the channel, related to storage releases (such as rapid rate of change in release rate or cessation of releases).
High flows (event flows)
During floods, stream flows are considerably increased as a result of surface runoff, and these are termed high flows or flow events. This runoff picks up large quantities of natural and man-made pollutants as it passes over land surfaces which leads to short-lived but often quite large fluctuations in water quality. Such fluctuations occur naturally but, in general, the more disturbed a catchment, the greater these fluctuations are likely to be. DES (2018) recommends the following approach based on flow percentiles to identify high flows—
• in large inland, drier catchments such as the Fitzroy and Burdekin, the default to assign high flows is the upper 10th percentile of daily mean flows;
• in coastal and wetter catchments such as southeast Queensland and the Wet Tropics, the default to assign high flow is the upper 20th percentile of daily mean flows; and
• in small and more arid catchments, the default to assign high flow is the upper 5th percentile of daily mean flows.
Low flows (base flows)
Low flows refers to flow conditions when the stream is still flowing, but there is limited or no runoff. Most of the flows are derived from water already in the stream, sub-surface seepage or groundwater inflows. At these flows water quality is relatively stable.
No flows (nil flows)
No flows refers to when the stream has stopped flowing, the watercourse has contracted to a series of waterholes or pools and water quality is often poor and also variable due to the effects of stagnation.
Environmental values (EVs)
Environmental values (EVs) are particular values or uses of the environment that are important for a healthy ecosystem or for public benefit, welfare, safety or health and that require protection from the effects of pollution, waste discharges and deposits. The environmental values for waters to be enhanced or protected are stated under section 6 of the EPP Water and include aquatic ecosystem and human (e.g. agriculture, recreation, industry) values.
Water Infrastructure Licence holder monitoring program evaluation guideline 21
References Chudek E., Joo M.,Horn T., McLaren S. (1998) Stratification behaviour of Queensland Dams. Resource Sciences Group, Department of Natural Resources.
Department of Environment and Heritage Protection (2009) Queensland Water Quality Guidelines, Version 3, ISBN 978-0-9806986-0-2.
Department of Environment and Science (2018) Environmental Protection (Water) Policy 2009. Deciding aquatic ecosystem indicators and local water quality guidelines.