guia ingles completo - porto...
TRANSCRIPT

1

2
Dear Entrepreneur, Porto Alegre is a city that represents faithfully its own name (Happy Harbor). The City is vibrant and internationally recognized by its people’s generosity, by its renowned companies and, moreover, by its rich cultural History. We want to extend our invitation so your company may participate on this journey with Porto Alegre and take part on the historic construction of development with quality of life for everyone! The City of Porto Alegre wants to have you as a partner on this journey. We understand your investment as a vital point to the continuous development of our city and to the expansion of economic, social and environment progresses.
José Fogaça,Mayor of Porto Alegre

3
Index 1 – The city of Porto Alegre ......................................……....04 2 – The City and the Local Private Sector...…....................07 3 –Economy ..............................................................................10 4 – Human Resources.............................................................42 5 – Infrastructure ....................................................................54 6 – Opportunities ....................................................................62 7 – The Captare and the Investor Support Center.............69
LAÇADOR (Roper) Simbol of Porto Alegre
A great figure of Porto Alegre, the Laçador was chosen by the community of Porto Alegre, capital of Rio Grande do Sul, as a symbol of the city. His statue is located on the entrance of the city, with 4.45m height. The Laçadorportrays the pride of all gauchos, as are known the state citizens. This work had as a model a recognized researcher of Rio Grande do Sul’s traditions, Paixão Cortes.

4
The city of Porto Alegre
I. Porto Alegre, a city of quality
Porto Alegre is a privileged city.
The capital of Rio Grande do Sul, the
most southern state in Brazil, stands at
Gauíba Lake’s shores and is situated at
the geographic center of Mercosur,
considering the main cities of the block:
São Paulo, Montevideo, Buenos Aires,
Santiago and Asunción. In terms of
population, it is the 10th biggest
Brazilian city, with around 1,4 million
inhabitants and a population density of
2.848,55 inhabitants per square
kilometer.
The arrival of 60 Azorean
couples, settled in Morro Santana in the
end of 1751, was the beginning of Porto
Alegre’s history. The city’s foundation
date, celebrated every year with many
artistic, cultural and sportive events, is
March 26th , 1752. It was when came up
the Clientele of São Francisco do Porto
dos Casais. Some time after, German
and Italian immigrants arrived to Rio
Grande do Sul’s capital and, thereafter,
other ethnic groups settled down in the
city. Such ethnical miscegenation gave
the city a diversified socio-economic
and cultural environment.
The inhabitants of Porto Alegre
are proud of the quality of life that the
city offers them. The municipality is one
of the most arborous in Brazil,
outstanding for the quantity and good
location of squares and parks. The
Human Development Index (HDI) of
Porto Alegre is among the tem best in
the country and is the best if it is
considered only the cities with over
than 1 million inhabitants. Other
indicators attest to the good quality of
life: life expectancy at birth is 71.5
years, higher than national average;
100% of the population is supplied of
water and 85% have sewage collection
service
Investor’s Guide – Chapter 01

5
In the past years, Porto Alegre
has consolidated itself as an important
center of business tourism, not only
because of the hospitality of those who
live in it, but especially because of the
hotel structure and spaces for great
events’ realization, such as
international conventions and
congresses, and in the more different
segments. Trade and service sector’s
competence fits the demands of
organizers, sponsors and visitors of
these calendars.
II. Geographical Location
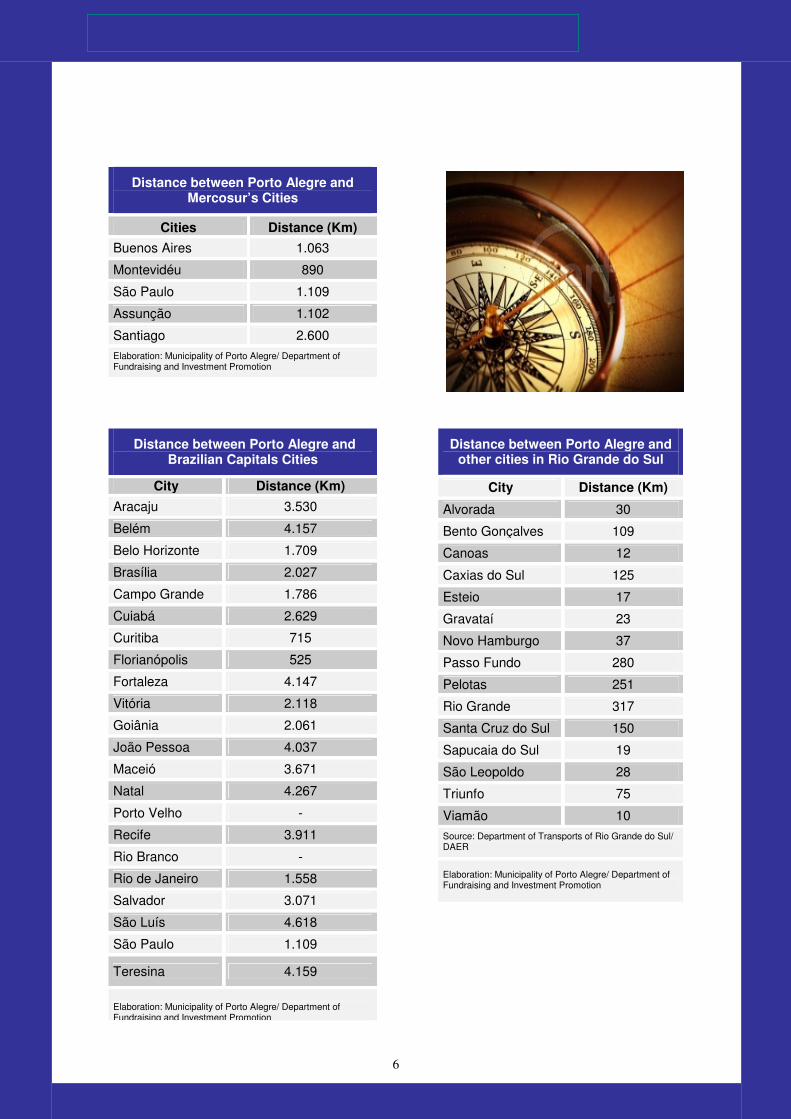
6
Distance between Porto Alegre and Mercosur’s Cities
Cities Distance (Km)
Buenos Aires 1.063
Montevidéu 890
São Paulo 1.109
Assunção 1.102
Santiago 2.600 Elaboration: Municipality of Porto Alegre/ Department of Fundraising and Investment Promotion
Distance between Porto Alegre and
Brazilian Capitals Cities
City Distance (Km)
Aracaju 3.530
Belém 4.157
Belo Horizonte 1.709
Brasília 2.027
Campo Grande 1.786
Cuiabá 2.629
Curitiba 715
Florianópolis 525
Fortaleza 4.147
Vitória 2.118
Goiânia 2.061
João Pessoa 4.037
Maceió 3.671
Natal 4.267
Porto Velho -
Recife 3.911
Rio Branco -
Rio de Janeiro 1.558
Salvador 3.071
São Luís 4.618
São Paulo 1.109
Teresina 4.159
Elaboration: Municipality of Porto Alegre/ Department of Fundraising and Investment Promotion
Distance between Porto Alegre and other cities in Rio Grande do Sul
City Distance (Km)
Alvorada 30
Bento Gonçalves 109
Canoas 12
Caxias do Sul 125
Esteio 17
Gravataí 23
Novo Hamburgo 37
Passo Fundo 280
Pelotas 251
Rio Grande 317
Santa Cruz do Sul 150
Sapucaia do Sul 19
São Leopoldo 28
Triunfo 75
Viamão 10 Source: Department of Transports of Rio Grande do Sul/ DAER
Elaboration: Municipality of Porto Alegre/ Department of Fundraising and Investment Promotion

7
The City and the Local Private Sector A partnership for the city development
The City of Porto Alegre is partner with
entrepreneurs and investors present in
the city, and works constantly to
improve the investment environment in
town. The work aiming the city
development includes policy integration
and combined efforts of the
government, the private sector, and the
universities and research institutes,
through a Governance System that
intends to define, along with the
business communities, a “future vision”
fro the city defining strategic objectives,
leading the actions of all actors involved
towards the same goal.
Infrastructure – Relevant investments
on infrastructure and human resources
are being implemented in several areas
in the city. Important enterprises and
universities are already partners of de
Municipality for this work, which has
higher international acknowledgement
every time.
Incentives – New incentives are
implemented, with tax reduction on
services for strategic sectors, and the
refund of the acquisition value for areas
inside de Restinga Industrial Park.
Sector Development – The high-tech
sector development and its impact on
the development of all other local
productive sectors, has created the
possibility for the arrival of a growing
number of local, national and foreign
companies, technological parks,
universities, personnel and
technological infrastructure research
and formation centers. All these
policies, actions and projects were
elaborated and implemented,
articulately between the public power
Investor’s Guide – Chapter 02

8
and the local civil society, with the
fundamental participation of the
Municipal Council of Science and
Technology.
Public Private Partnership – Porto
Alegre was also one of the first cities in
Brazil to pass a bill that regulated de
Public-Private Partnerships, an
important instrument for the
implementation of relevant necessary
projects for the local development.
Management Model – Internally, all this
work is part of the Management Model
that the Municipality of Porto Alegre has
implemented, focusing on results. The
idea is to combine efforts around major
themes and subjects involving the
interests of all the community. The
internal objectives are the public
services qualification, modernizing the
administration, reaching financial
stabilization and optimizing resources
utilization. The adopted model
preserves the city conquests and
promotes important changes. The
already achieved results make this
Management Model a landmark for
other public institutions in the country.
The development promotion is attained
through three great axes –
environmental; social; economic and
financial -, which are opened into
Strategic Programs and actions. All of
them are related to the government 4-
year plan, with objectives, indicators
and goals.
The Management Model has the
participation of the National Institute for
Management Development (INDG),
through a partnership with the Gaucho
Program of Quality and Productivity
(PGQP).

9

10
Economy
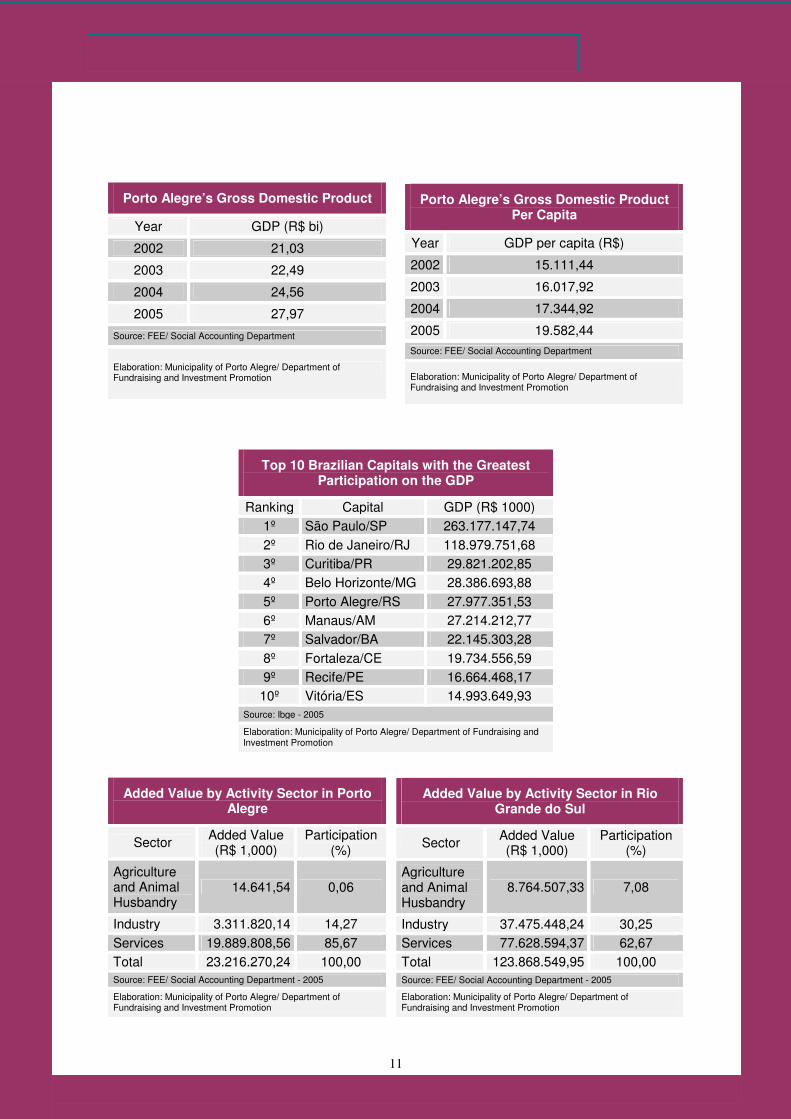
I. Well ranked economy
Porto Alegre is the sixth
Brazilian capital regarding Gross
Domestic Product (GDP), that
registered R$ 27.977.351,53 in 2005. In
the ranking of the country’s
municipalities, it also occupies the 6th
position. Among metropolitan cities,
Porto Alegre is the leader, ahead of
Canoas, Triunfo, Gravataí and Novo
Hamburgo. Rio Grande do Sul’s capital
also stands out in GDP per capita
evaluation, showing the value of R$
19.582,44.
The economic activities held in Porto
Alegre are quite diverse, focusing on trade
and services sectors, which account for 86%
of the value added of the city’s economy.
Industry has a participation of 14%.
Porto Alegre's GDP (R$ bi)
21,0322,49
24,57
27,98
2002 2003 2004 2005
Investor’s Guide – Chapter 03
11
Top 10 Brazilian Capitals with the Greatest Participation on the GDP
Ranking Capital GDP (R$ 1000) 1º São Paulo/SP 263.177.147,74 2º Rio de Janeiro/RJ 118.979.751,68 3º Curitiba/PR 29.821.202,85 4º Belo Horizonte/MG 28.386.693,88 5º Porto Alegre/RS 27.977.351,53 6º Manaus/AM 27.214.212,77 7º Salvador/BA 22.145.303,28 8º Fortaleza/CE 19.734.556,59 9º Recife/PE 16.664.468,17 10º Vitória/ES 14.993.649,93
Source: Ibge - 2005
Elaboration: Municipality of Porto Alegre/ Department of Fundraising and Investment Promotion
Porto Alegre’s Gross Domestic Product
Year GDP (R$ bi)
2002 21,03
2003 22,49
2004 24,56
2005 27,97
Source: FEE/ Social Accounting Department
Elaboration: Municipality of Porto Alegre/ Department of Fundraising and Investment Promotion
Porto Alegre’s Gross Domestic Product Per Capita
Year GDP per capita (R$)
2002 15.111,44
2003 16.017,92
2004 17.344,92
2005 19.582,44 Source: FEE/ Social Accounting Department
Elaboration: Municipality of Porto Alegre/ Department of Fundraising and Investment Promotion
Added Value by Activity Sector in Rio Grande do Sul
Sector Added Value (R$ 1,000)
Participation (%)
Agriculture and Animal Husbandry
8.764.507,33 7,08
Industry 37.475.448,24 30,25 Services 77.628.594,37 62,67 Total 123.868.549,95 100,00 Source: FEE/ Social Accounting Department - 2005
Elaboration: Municipality of Porto Alegre/ Department of Fundraising and Investment Promotion
Added Value by Activity Sector in Porto Alegre
Sector Added Value (R$ 1,000)
Participation (%)
Agriculture and Animal Husbandry
14.641,54 0,06
Industry 3.311.820,14 14,27 Services 19.889.808,56 85,67 Total 23.216.270,24 100,00 Source: FEE/ Social Accounting Department - 2005
Elaboration: Municipality of Porto Alegre/ Department of Fundraising and Investment Promotion

12
Top 20 Cities with the Greatest Participation on the GDP
Ranking City GDP (R$ mil) Participation (%)
1º São Paulo/SP 263.177.147,74 12,26 2º Rio de Janeiro/RJ 118.979.751,68 5,54 3º Brasília/DF 80.516.681,69 3,75 4º Curitiba/PR 29.821.202,85 1,39 5º Belo Horizonte/MG 28.386.693,88 1,32 6º Porto Alegre/RS 27.977.351,53 1,30 7º Manaus/AM 27.214.212,77 1,27 8º Barueri/SP 22.430.474,53 1,04 9º Salvador/BA 22.145.303,28 1,03 10º Guarulhos/SP 21.615.314,47 1,01 11º Campinas/SP 20.620.765,63 0,96 12º Fortaleza/CE 19.734.556,59 0,92 13º São Bernardo do Campo/SP 19.448.018,40 0,91 14º Osasco/SP 18.310.451,82 0,85 15º Duque de Caxias/RJ 18.309.544,76 0,85 16º São José dos Campos/SP 17.090.191,04 0,80 17º Recife/PE 16.664.468,17 0,78 18º Campos dos Goytacazes/RJ 16.116.179,57 0,75 19º Vitória/ES 14.993.649,93 0,70 20º Betim/MG 14.447.525,44 0,67
Source: IBGE - 2005
Elaboration: Municipality of Porto Alegre/ Department of Fundraising and Investment Promotion
Gross Domestic Product, Total and Per capita, and its Growth Rates in Rio Grande do Sul and in Brazil
Rio Grande do Sul Brazil
GDP Growth Rates (%) GDP Growth Rates
(%) Years Total (R$ millions)
Per capita (R$)
Total Total (R$ millions)
Per capita (R$)
Total
2002 105.486,82 10.056,79 - 1.477.822,00 8.378,10 2,7 2003 124.551,27 11.741,68 1,7 1.699.948,00 9.497,70 1,1 2004 137.830,68 12.850,07 3,4 1.941.498,00 10.691,89 5,7 2005 144.344,17 13.309,64 -2,8 2.147.239,00 11.658,10 3,2 2006¹ 155.510,63 14.184,76 2,7 2.332.935,54 12.490,92 3,8 2007¹ 175.208,68 15.812,55 7,0 - - 5,2² ¹ Preliminary estimative for 2006 and 2007
² IPEA’s projection
Source: FEE/ Social Accounting Department; Ibge/ National Account Coordination
Elaboration: Municipality of Porto Alegre/ Department of Fundraising and Investment Promotion

13
II. Influence Zone
Porto Alegre’s Metropolitan Region Population
City Population Alvorada 212.784 Araricá 5.467 Arroio dos Ratos 13.688 Cachoeirinha 119.403 Campo Bom 60.729 Canoas 334.685 Capela de Santana 11.413 Charqueadas 33.646 Dois Irmãos 29.253 Eldorado do Sul 33.747 Estância Velha 40.530 Esteio 86.241 Glorinha 7.134 Gravataí 262.365 Guaíba 97.677 Ivoti 19.306 Montenegro 59.606 Nova Hartz 18.961 Nova Santa Rita 20.845 Novo Hamburgo 256.185 Parobé 52.055 Portão 29.302 Porto Alegre 1.415.237 Santo Antônio da Patrulha 40.679 São Jerônimo 22.928 São Leopoldo 214.904 Sapiranga 79.911 Sapucaia do Sul 132.672 Taquara 56.376 Triunfo 25.133 Viamão 260.133 Porto Alegre’ Region 4.052.995 Source: FEE/ Social Indicators Center - 2006
Elaboration: Municipality of Porto Alegre/ Department of Fundraising and Investment Promotion
GDP and GDP Per Capita: Cities of the Metropolitan Region of Porto Alegre
City GDP (R$) GDP per capita (R$)
Alvorada 783.517,69 3.726,90 Araricá 35.748,31 7.604,40 Arroio dos Ratos 96.889,42 6.784,02 Cachoeirinha 2.005.511,57 16.754,62 Campo Bom 1.146.753,09 19.817,39 Canoas 9.376.152,61 28.483,88 Capela de Santana 69.198,04 5.948,43 Charqueadas 878.257,05 26.436,01 Dois Irmãos 454.671,90 16.664,42 Eldorado do Sul 753.014,70 22.639,57 Estância Velha 502.117,48 12.717,95 Esteio 1.504.229,71 17.491,04 Glorinha 105.909,17 16.623,63 Gravataí 3.713.638,65 14.016,22 Guaíba 1.154.753,88 11.097,53 Ivoti 302.632,03 16.894,55 Montenegro 1.082.482,17 18.165,20 Nova Hartz 210.377,44 11.451,61 Nova Santa Rita 193.846,75 9.976,16 Novo Hamburgo 3.726.441,94 14.595,35 Parobé 455.832,92 8.635,98 Portão 552.599,55 19.809,99 Porto Alegre 27.977.350,53 19.582,44 Santo Antônio da 304.711,16 7.905,13 São Jerônimo 197.511,46 9.845,05 São Leopoldo 2.368.537,21 11.299,68 Sapiranga 815.036,27 10.516,33 Sapucaia do Sul 1.520.891,53 11.354,68 Taquara 417.289,61 7.035,26 Triunfo 4.799.640,68 193.346,79 Viamão 1.330.648,66 5.183,49
Source: FEE/ Social Accounting Department - 2005
Elaboration: Municipality of Porto Alegre/ Department of Fundraising and Investment Promotion

14
III. More than one million people
Porto Alegre is a city of over 1
million inhabitants: in 2006, the
estimation indicated 1.415.237
inhabitants, corresponding to an
increase of 0,67% in comparison with
the previous year. The population
density is 2,849 inhabitants per square
kilometer. And urbanization rate, of
97.81%, reflects the characteristics of a
modern city
Porto Alegre’s population account for
13,42% of Rio Grande do Sul’s total
population. The city is the 10th Brazilian city
in the ranking of number of inhabitants.
Porto Alegre’s Population
Year Man Participation (%) Women Participation (%) Total 2003 648.721 46,78 738.046 53,22 1.386.767 2004 653.210 46,78 743.101 53,22 1.396.311 2005 657.645 46,78 748.166 53,22 1.405.811 2006 661.870 46,77 753.367 53,23 1.415.237 Source: FEE/ Social Indicators Center
Elaboration: Municipality of Porto Alegre/ Department of Fundraising and Investment Promotion
Porto Alegre’s Population Density
Year Population Density (hab/ km²)
2006 2.848,55
Source: FEE/ Social Indicators Center
Elaboration: Municipality of Porto Alegre/ Department of Fundraising and Investment Promotion
Porto Alegre’s Urbanization Index
Year Rural Urban Urbanization Rate
2003 35.523 1.351.244 97,44% 2004 34.029 1.362.282 97,56% 2005 32.536 1.373.275 97,69% 2006 31.050 1.384.187 97,81%
Source: FEE/ Social Indicators Center
Elaboration: Municipality of Porto Alegre/ Department of Fundraising and Investment Promotion

15
Ranking of the Cities by Population
Ranking City Population* 1º São Paulo 10.886.518 2º Rio de Janeiro 6.093.472 3º Salvador 2.892.625 4º Fortaleza 2.455.903 5º Belo Horizonte 2.431.415 6º Brasília 2.412.937 7º Curitiba 1.797.408 8º Manaus 1.646.602 9º Recife 1.533.580 10º Porto Alegre 1.420.667
Brazil 183.989.711 Rio Grande do Sul 10.582.887 Porto Alegre 1.420.667 * Estimated Resident Population in 01.04.2007
Source: IBGE
Elaboration: Municipality of Porto Alegre/ Department of Fundraising and Investment Promotion
Porto Alegre’s Population by Age Group
Age Group
Men Women Total Participation
0 to 04 56.346 55.783 112.129 8% 05 to 09 52.612 49.356 101.968 7% 10 to 14 51.722 48.585 100.307 7% 15 to 19 56.183 53.946 110.129 8% 20 to 24 66.156 64.360 130.516 9% 25 to 29 61.147 62.278 123.425 9% 30 to 34 50.234 53.018 103.252 7% 35 to 39 45.234 50.433 95.667 7% 40 to 44 46.809 56.895 103.704 7% 45 to 49 44.131 55.164 99.295 7% 50 to 54 37.849 50.194 88.043 6% 55 to 59 29.129 40.594 69.723 5% 60 to 64 21.603 31.788 53.391 4% 65 to 69 16.068 25.737 41.805 3% 70 and more
26.647 55.236 81.883 6%
Source: FEE/ Social Indicators Center - 2006
Elaboration: Municipality of Porto Alegre/ Department of Fundraising and Investment Promotion

16
Porto Alegre’s Neighborhoods
Neighborhoods Resident Population*
Agronomia 12.393 Anchieta 1.281 Arquipélago 7.619 Auxiliadora 9.985 Azenha 10.475 Bela Vista 10.097 Belém Novo 13.787 Belém Velho 8.274 Boa Vista 9.030 Bom Fim 9.368 Bom Jesus 30.423 Cel. Aparício Borges 15.100 Camaquã 22.009 Campo Novo 7.652 Cascata 27.784 Cavalhada 15.403 Centro 36.591 Chapéu do Sol 2.620 Cidade Baixa 18.523 Cristal 30.220 Cristo Redentor 15.505 Espírito Santo 6.121 Farrapos 17.083 Farroupilha 1.101 Floresta 15.493 Glória 9.077 Guarujá 4.841 Higienópolis 9.096 Hípica 10.948 Humaitá 10.293 Independência 10.986 Ipanema 20.790 Jardim Botânico 11.494 Jardim Carvalho 25.161 Jardim do Salso 4.530 Jardim Floresta 4.237 Jardim Itú 7.569 Jardim Lindóia 7.932 Jardim Sabará 14.987 Jardim São Pedro 5.152 Lageado 6.476
Lami 3.493
Porto Alegre’s Neighborhoods
Lomba do Pinheiro 43.882 Mário Quintana 28.518 Medianeira 10.701 Menino Deus 30.717 Moinhos de Vento 8.067 Mont`Serrat 10.236 Morro Santana 19.236 Navegantes 4.227 Nonoai 21.393 Partenon 47.430 Passo D`Areia 20.880 Passo das Pedras 24.549 Chácara das Pedras 6.479 Pedra Redonda 316 Petrópolis 34.593 Ponta Grossa 3.290 Praia de Belas 1.869 Restinga 53.764 Rio Branco 16.473 Rubem Berta 68.536 Santa Cecília 5.800 Santa Maria Goretti 3.964 Santa Teresa 59.222 Santana 25.028 Santo Antônio 15.003 São Geraldo 9.202 São João 18.721 São José 30.164 São Sebastião 6.714 Sarandi 90.665 Serraria 4.682 Teresópolis 9.877 Três Figueiras 3.657 Tristeza 14.837 Vila Assunção 3.819 Vila Conceição 1.467 Vila Ipiranga 21.105 Vila Jardim 14.450 Vila João Pessoa 12.641 Vila Nova 33.417 *Dado de 2000
Source: Observapoa
Elaboration: Municipality of Porto Alegre/ Department of Fundraising and Investment Promotion

17
IV. Well-fare reflected in indicators
Life quality is prominent in the capital of Rio Grande do Sul
Human Development Index
(HDI) of Porto Alegre is among the top
ten of all the cities of the country.
According to Brazilian Human
Development Atlas, organized by the
Institute of Applied Economic Research
(IPEA) and João Pinheiro Foundation,
Porto Alegre held the second-best
position in 2000 in relation to Brazilian
capitals, standing ahead of important
urban centers, like São Paulo, Belo
Horizonte, Rio de Janeiro, Curitiba
Salvador, Recife and Fortaleza.
Another indicator,
Socioeconomic Development Index
(IDESE), also highlights the quality of
life in Porto Alegre. The result of the
municipality is the best across Rio
Grande do Sul, particularly if income,
education, sanitation and habitation are
considered.
Top Ten Cities with the Higher Human Development Index (HDI)
Ranking City HDIM HDIM-Income
HDIM-Life Expectancy
HDIM-Education
1º São Caetano do Sul (SP) 0,919 0,896 0,886 0,975 2º Águas de São Pedro (SP) 0,908 0,918 0,874 0,933 3º Niterói (RJ) 0,886 0,891 0,808 0,960 4º Florianópolis (SC) 0,875 0,867 0,797 0,960 5º Santos (SP) 0,871 0,873 0,788 0,952 6º Bento Gonçalves (RS) 0,870 0,799 0,873 0,938 7º Balneário Camboriú (SC) 0,867 0,859 0,803 0,940 8º Joaçaba (SC) 0,866 0,793 0,856 0,949 9º Porto Alegre (RS) 0,865 0,869 0,775 0,951 10º Fernando de Noronha (PE) 0,862 0,829 0,835 0,923
Source: UNDP - 2000
Elaboration: Municipality of Porto Alegre / Department of Fundraising and Investment Promotion

18
Human Development Index by State
State IDHM IDHM-Income
IDHM-Life Expectancy
IDHM-Education
Brazil 0,766 0,723 0,727 0,849
Distrito Federal 0,844 0,842 0,756 0,935
Santa Catarina 0,822 0,750 0,811 0,906
São Paulo 0,820 0,790 0,770 0,901
Rio Grande do Sul 0,814 0,754 0,785 0,904
Rio de Janeiro 0,807 0,779 0,740 0,902
Paraná 0,787 0,736 0,747 0,879
Mato Grosso do Sul 0,778 0,718 0,751 0,864
Goiás 0,776 0,717 0,745 0,866
Mato Grosso 0,773 0,718 0,740 0,860
Minas Gerais 0,773 0,711 0,759 0,850
Espírito Santo 0,765 0,719 0,721 0,855
Amapá 0,753 0,666 0,711 0,881
Roraima 0,746 0,682 0,691 0,865
Rondônia 0,735 0,683 0,688 0,833
Pará 0,723 0,629 0,725 0,815
Amazonas 0,713 0,634 0,692 0,813
Tocantins 0,710 0,633 0,671 0,826
Pernambuco 0,705 0,643 0,705 0,768
Rio Grande do Norte 0,705 0,636 0,700 0,779
Ceará 0,700 0,616 0,713 0,772
Acre 0,697 0,640 0,694 0,757
Bahia 0,688 0,620 0,659 0,785
Sergipe 0,682 0,624 0,651 0,771
Paraíba 0,661 0,609 0,636 0,737
Piauí 0,656 0,584 0,653 0,730
Alagoas 0,649 0,598 0,646 0,703
Maranhão 0,636 0,558 0,612 0,738 Source: UNDP - 2000
Elaboration: Municipality of Porto Alegre/ Department of Fundraising and Investment Promotion

19
Access to Final Goods in Porto Alegre
Goods 1991 2000
Computer ND* 27,9%
Refrigerator 93,2% 96,8%
Telephone 33,8% 68,4%
Television 94,4% 97,8% *ND: not available
Source: UNDP
Elaboration: Municipality of Porto Alegre/ Department of Fundraising and Investment Promotion
Number of Hospitals in Porto Alegre
Year Hospitals
2000 24 2001 24 2002 23 2003 23
Source: FEE
Elaboration: Municipality of Porto Alegre/ Department of Fundraising and Investment Promotion
Access to Basic Services in Porto Alegre
Service 1991 2000 Piped Water Supply 95,7 97,8
Garbage Collection* 97,0 99,3
Electric Energy 99,5 99,8 *Only urban homes
Source: UNDP
Elaboration: Municipality of Porto Alegre/ Department of Fundraising and Investment Promotion
Life Expectancy, Mortality and Fecundity Indexes of Porto Alegre
Indicator 1991 2000 Mortality until 1 year old (per 1000 born alive) 21,1 18,1 Life Expectancy (Years) 69,9 71,5 Total Fecundity Rate (children per woman) 2,0 1,8 Source: UNDP
Elaboration: Municipality of Porto Alegre/ Department of Fundraising and Investment Promotion
Porto Alegre’s Socioeconomic Development Index
IDESE IDESE and its blocks 2004 2003 2002
Idese 0,815 0,814 0,813
Education 0,868 0,866 0,860
Income 0,812 0,810 0,809
Sanitary and Homes 0,744 0,746 0,747
Health 0,835 0,833 0,834 Source: FEE/ Statistics Information Center
Elaboration: Municipality of Porto Alegre/ Department of Fundraising and Investment Promotion

20
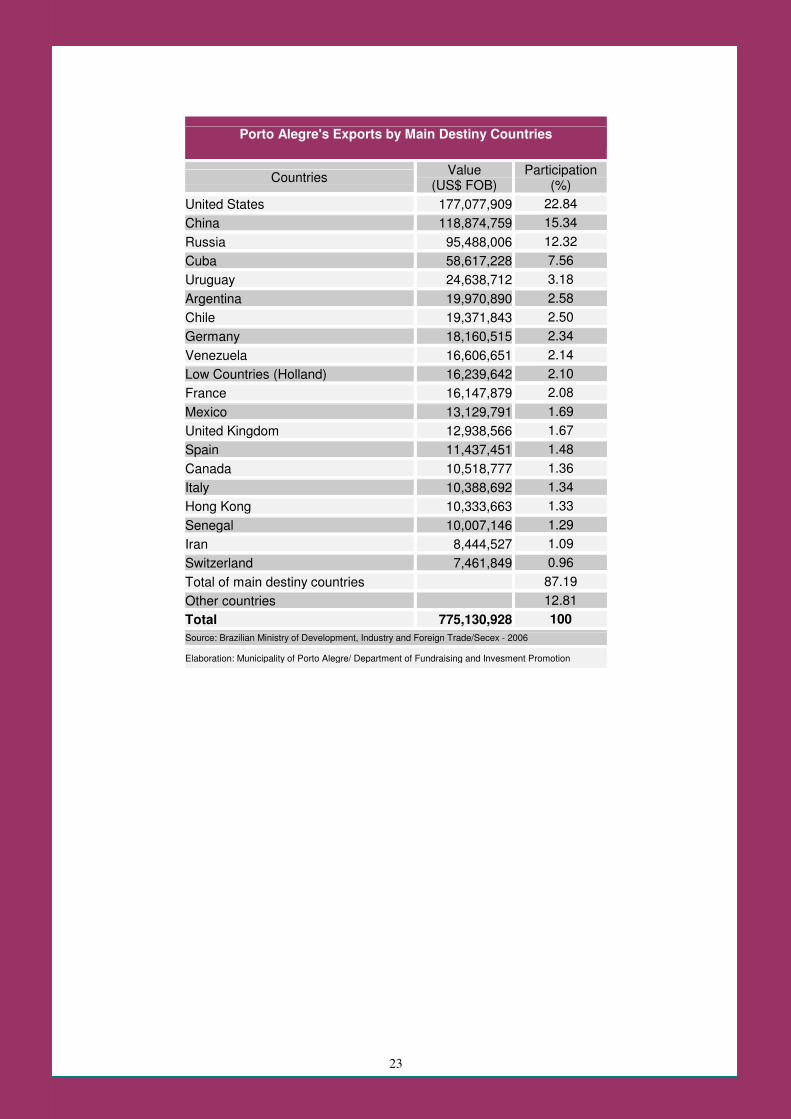
V. Diversified commercial relations
Porto Alegre figures among the ten exporters Brazilian capitals
Porto Alegre’s pattern of exports is
quite diverse, including since soy beans
until accessories for tractors and other
vehicles and leather shoes. In 2007, the
city’s exports totaled US$ 863.726.658, so
that Porto Alegre appeared in the 7th
position in the ranking of Brazilian capitals
to sell more to foreign countries. In the
same year, the balance of trade accounted
a surplus of US$ 142.581.643.
China, United States and Holland
are among the countries to buy most from
Porto Alegre, and the most purchased
product is soybean. Yet, in relation to
imported goods, Argentine, China and
United States are the countries to sell the
most to Rio Grande do Sul’s capital.
.
Porto Alegre’s Trade Balance
Year Exports (US$ FOB)
Imports (US$ FOB)
Net Result
2000 564.350.326 477.627.567 86.722.759 2001 649.255.609 520.721.397 128.534.212 2002 639.866.675 442.376.298 197.490.377 2003 758.628.148 410.782.956 347.845.192 2004 701.452.036 456.869.397 244.582.639 2005 582.785.888 474.111.434 108.674.454 2006 778.483.806 637.725.808 140.757.998 2007 863.726.658 800.466.148 63.260.510
Source: Ministry of Development, Industry e Foreign Trade / Secex
Elaboration: Municipality of Porto Alegre/ Department of Fundraising and Investment Promotion

21
Porto Alegre's Exports for Economic Blocs: main destinies
2008 (Jan-Apr) 2007 (Jan-Apr) Blocs
US$ FOB Participation (%)
US$ FOB Participation (%)
United States (including Puerto Rico) 45.814.872 14,59 64.851.438 36,05 Asia (excluding Middle East) 86.818.504 27,66 6.991.370 3,89 European Union 71.250.922 22,70 24.303.810 13,51 ALADI (excluding Mercosur) 32.874.845 10,47 22.057.000 12,26 Africa (excluding Middle East) 21.469.031 6,84 8.285.844 4,61 Other Blocs 55.694.926 17,74 53.412.163 29,69 Total 313.923.100 100,00 179.901.625 100,00 Source: Brazilian Ministry of Development, Industry and Foreign Trade/ Secex
Elaboration: Municipality of Porto Alegre/ Department of Fundraising and Investment Promotion
Porto Alegre's Balance of Trade Evolution
564.350.326
649.255.609 639.866.675
758.628.148 701.452.036
582.785.888
778.483.806
863.726.658
366.883.146
423.357.499 477.627.567 520.721.397
442.376.298 410.782.956 456.869.397 474.111.434
637.725.808
800.466.148
1999 2000 2001 2002 2003 2004 2005 2006 2007
Exports (US$ FOB) Imports (US$ FOB)

22
Porto Alegre's Main Exports
Good Value (US$ FOB)
Participation (%)
Other soy grains, even ground 126,068,51 16.27 Other components and accessories for tractors and automobile vehicles 78,120,038 10.08 Other natural leather shoes 77,301,538 9.97 Unboned beef, frozen 62,652,077 8.08 Other rifles and carabines for hunting and target shooting 42,992,990 5.55 Other porc meat, frozen 42,140,038 5.44 Other eletrog. Groups for diesel engines 25,403,854 3.28 Unboned beef, fresh or refrigerated 22,512,662 2.90 Broken rice 20,595,214 2.66 Eletrog. Group for diesel engines 15,274,367 1.97 Other natural leather shoes, covering the ankle 14,762,520 1.90 Cereal metal silo, fixed, including the batteries 14,140,253 1.82 Wood furniture for bedrooms 13,698,009 1.77 Other wood furniture 12,010,328 1.55 Other natural leather shoes and leather outsole 10,658,849 1.38 Machines for mixing mineral material with bitumen 10,649,820 1.37 Board consumption - fuel and lubricant for aircrafts 8,174,358 1.05 Other leather and fur 7,523,210 0.97 Other pressed wood, with thickness leaves 7,487,051 0.97 Eletrog. Group for diesel engines 7,270,000 0.94 Other valves for oil-hydraulics 5,697,347 0.74 Bovine tongues, frozen 4,902,020 0.63 Other machines and apparatuses for earthmoving 4,735,041 0.61 Other railroad elements, from cast iron, iron and steel 4,126,963 0.53 Other rubber or plastic shoes 3,546,142 0.46 Other tubes from iron and steel 3,484,232 0.45 Other natural or reconstructed leather works 3,455,209 0.45 Textile shoes, with leather outsole 3,243,079 0.42 Semiwhitened unparboiled rice 3,204,692 0.41 Bladders and stomachs from animals 3,144,737 0.41 Prisms, mirrors and other optic elements 2,944,064 0.38 Parts of other machines and cargo elevation apparatuses 2,917,236 0.38 Other leather and fur, bovine, prepared 2,875,980 0.37 Other textile shoes, rubber and plastic outsole 2,865,636 0.37 Contact lenses 2,437,378 0.31 Other machines and apparatuses for public constructions 2,353,200 0.30 Natural leather shoes, leather outsole, covering the ankle 2,279,750 0.29 Other revolving volume pumps 2,181,839 0.28 Frames, etc. with electric circuit interup. Apparatuses 2,140,334 0.28 Fertilizers with or without phosphorus and potassium 2,128,920 0.27 Other products 90,989,874 11.74 Total of main exported products 684,099,49 88.26 Total 775,089,36 100
Source: Brazilian Ministry of Development, Industry and Foreign Trade/ Secex - 2006
Elaboration: Municipality of Porto Alegre/ Department of Fundraising and Invesment Promotion
23
Porto Alegre's Exports by Main Destiny Countries
Countries Value (US$ FOB)
Participation (%)
United States 177,077,909 22.84
China 118,874,759 15.34
Russia 95,488,006 12.32
Cuba 58,617,228 7.56
Uruguay 24,638,712 3.18
Argentina 19,970,890 2.58
Chile 19,371,843 2.50
Germany 18,160,515 2.34
Venezuela 16,606,651 2.14
Low Countries (Holland) 16,239,642 2.10
France 16,147,879 2.08
Mexico 13,129,791 1.69
United Kingdom 12,938,566 1.67
Spain 11,437,451 1.48
Canada 10,518,777 1.36
Italy 10,388,692 1.34
Hong Kong 10,333,663 1.33
Senegal 10,007,146 1.29
Iran 8,444,527 1.09
Switzerland 7,461,849 0.96
Total of main destiny countries 87.19
Other countries 12.81 Total 775,130,928 100
Source: Brazilian Ministry of Development, Industry and Foreign Trade/Secex - 2006
Elaboration: Municipality of Porto Alegre/ Department of Fundraising and Invesment Promotion

24
Porto Alegre's Main Imports
Good Value (US$ FOB) Participation (%) Natural gas (gaseous state) 52,256,427 8.26 Glyphosate herbicide, its salts, from imazaquim 38,470,156 6.08 Machinery and equipment for false textiles manufacturing 35,792,751 5.66 Other components and accessories for tractors and automobile 28,805,329 4.55 Urea with nitrogen content above 45% in weight 28,543,180 4.51 Other potassium chlorides 24,311,464 3.84 Wheat 21,792,395 3.45 Newspaper paper in roles 15,766,913 2.49 Hydrogen-ortophosphat of diamonio 12,996,647 2.05 Dydrogen-ortophosphat of ammonium 11,770,145 1.86 Superphosphate 9,790,029 1.55 Other diesel engines 9,697,558 1.53 Other fungicides 9,306,023 1.47 Semiwhitened rice 7,263,423 1.15 Silicon-manganese alloy wires 4,982,933 0.79 Other wines 4,853,377 0.77 Insecticide for domestic and sanitary use 4,800,074 0.76 Other integrated circuits monolit. digit. montad. 4,799,747 0.76 Other machinery and mechanic equipments components 4,302,735 0.68 Other plastic works 4,238,135 0.67 Glass ampulla for thermal bottles 4,048,155 0.64 Other unboned bovine cuts 3,565,595 0.56 Other compounds heterocicl.cont. ciclo triazol 3,496,899 0.55 Fresh pear 3,481,329 0.55 Fresh apple 3,449,006 0.55 Other machinery and equipments for offset printing 2,768,481 0.44 Other metal ornaments for furniture 2,516,085 0.40 Other steel spheres calibred for rolling-element bearings 2,512,469 0.40 Other machinery and equipments for earthmoving 2,454,843 0.39 Silicon-maganese alloy bars 2,454,318 0.39 Other chemical fertilizers with nitrogen and phosphorus 2,418,117 0.38 Other rolling-element bearings components 2,389,057 0.38 Contact lens 2,364,295 0.37 Hearing aids 2,298,594 0.36 Other microprocessors 2,290,698 0.36 Automatic trunked centrals for telephony 2,275,421 0.36 Potassium sulfate 2,236,204 0.35 Other medicines 2,200,760 0.35 Ammonium sulfate 2,197,568 0.35 Other videophonic devices for recording and replication 2,180,899 0.34 Total of main imports 61.35 Other goods 38.65 Total 100 Source: Brazilian Ministry of Development, Industry and Foreign Trade/ Secex
Elaboration: Municipality of Porto Alegre/ Department of Fundraising and Invesment Promotion

25
Porto Alegre's Imports by Main Origin Countries
Countries Value (US$ FOB)
Participation (%)
Argentina 162,459,532 25.68 Unites States 84,855,812 13.41 Germany 84,125,736 13.30 Uruguay 42,624,652 6.74 China 42,426,108 6.71 Canada 24,304,041 3.84 Japan 17,175,244 2.72 Russia 17,147,448 2.71 Spain 13,939,542 2.20 Taiwan 12,756,980 2.02 France 11,966,474 1.89 Italy 11,899,300 1.88 Israel 10,412,997 1.65 Chile 9,279,452 1.47 United Kingdom 8,835,700 1.40 Sweden 7,186,690 1.14 Venezuela 6,618,250 1.05 Low Countries (Holland) 5,311,164 0.84 Tunisia 4,658,712 0.74 Poland 3,857,966 0.61 Total of main origin countries 581,841,800 92.00 Other countries 50,707,485 8.00 Total 632,549,285 100,00
Source: Brazilian Ministry of Development, Industry and Foreign Trade/Secex - 2006
Elaboration: Municipality of Porto Alegre/ Department of Fundraising and Invesment Promotion

26
Exports Value of Main Brazilian Cities
Ranking Capital Value (US$ FOB) 1º São Paulo 7.228.887.279 2º Rio de Janeiro 2.558.515.971 3º Vitória 2.215.494.776 4º Curitiba 1.715.331.663 5º São Luis 1.393.866.436 6º Manaus 1.188.535.203 7º Porto Alegre 863.726.658 8º Belo Horizonte 500.897.019 9º Belém 493.737.143 10º Maceió 329.492.414 11º Fortaleza 271.022.516 12º Cuiabá 248.932.649 13º Recife 182.753.537 14º Goiânia 176.129.037 15º Campo Grande 162.143.850 16º João Pessoa 130.550.861 17º Salvador 116.051.962 18º Florianópolis 59.221.955 19º Natal 49.293.719 20º Porto Velho 18.843.467 21º Rio Branco 11.193.854 22º Teresina 8.923.236 23º Boa Vista 5.755.487 24º Aracaju 3.203.424 25º Macapá 1.049.728 26º Palmas 961.394
Source: Brazilian Ministry of Development, Industry and Foreign Trade/Secex - 2007
Elaboration: Municipality of Porto Alegre/ Department of Fundraising and Investment Promotion

27
VI. Business tourism in focus
The capital is choice of destination for visitors from all over the world
Porto Alegre is the 8th Brazilian
city most visited by foreigners and has
been distinguished by the quality and
quantity of hotels and infra-structure
disposable to arrange events. Business
are among the main reasons appointed
by foreigners to visit Rio Grande do
Sul’s capital, the 3rd in the Brazilian
ranking when analyzed tourism related
to business, events and conventions,
only staying behind São Paulo and Rio
de Janeiro.
Most Visited Cities by Foreigners: Business. Events
and Conventions
City % Sao Paulo 49.4
Rio de Janeiro 22.3
Porto Alegre 8.2
Curitiba 5.4
Belo Horizonte 4.1
Campinas 4.1
Brasília 3.4
Foz do Iguaçu 3.0
Salvador 2.7
Florianópolis 1.8 Source: Embratur - 2005
Elaboration: Municipality of Porto Alegre/ Department of Fundraising and Investment Promotion
Most Visited Cities by Foreigners
City % Rio de Janeiro 36.9 Sao Paulo 18.5 Salvador 15.8 Fortaleza 8.5 Recife 7.5 Foz do Iguaçu 7.4 Búzios 6.0 Porto Alegre 5.9 Florianópolis 5.3 Belo Horizonte 5.1 Source: Embratur - 2003
Elaboration: Municipality of Porto Alegre/

28
Main Visitors of Porto Alegre by Origin Country
Origin Country % Uruguay 22.8
Chile 10.8
Germany 9.6
Spain 8.9
Argentina 8.1
United States 4.4 Source: Embratur - 2003
Elaboration: Municipality of Porto Alegre/ Department of Fundraising and Investment Promotion
Tourist Accommodation Daily Average Cost
Outlay Total (%) No Expenses 48,5 R$ 1 to R$ 50 14,1 R$ 50 to R$ 100 17,4 R$ 100 to R$ 150 9,2 R$ 150 to R$ 200 4,9 R$ 200 5,9 Source: Nacional Tourist Profile in the City of Porto Alegre – 2007
Elaboration: Municipality of Porto Alegre/ Department of Fundraising and Investment Promotion
Visitors from Other Brazilian Cities
City Total (%) São Paulo 24,12 Curitiba 10,96 Florianópolis 7,46 Criciúma 3,07 Belo Horizonte 2,63 Salvador 1,75 Campinas 1,75 Brasília 1,75 Others 39,04 Source: Nacional Tourist Profile in the City of Porto Alegre – 2007
Elaboration: Municipality of Porto Alegre/ Department of Fundraising and Investment Promotion
Tourist Individual Monthly Income
Income Total (%)
No Income 8,56 Less then R$ 350 4,03 From R$ 351 to R$ 700 10,33 From R$ 701 to R$ 1.050 13,1 From R$ 1.051 to R$ 1.750 11,34 From R$ 1.751 to R$ 3.500 16,62 From R$ 3.501 to R$ 5.250 12,59 From R$ 5.251 to R$ 7.000 7,56 More then R$ 7.000 13,35 Source: Nacional Tourist Profile in the City of Porto Alegre – 2007
Elaboration: Municipality of Porto Alegre/ Department of Fundraising and Investment Promotion

29
Tourist Evaluation of Porto Alegre
87,66%
10,80% 1,54%
Good/Exc
ellent Regular Bad/Very bad
Source: Nacional Tourist Profile in the City of Porto Alegre – 2007
Intention to Return to Porto Alegre
0,8% 2,8%
96,4%
Yes No Do not no
Source: Nacional Tourist Profile in the City of Porto Alegre – 2007

30
VII. Public finances in balance
Control of public accounts allows larger investment in the city
In 2007, Porto Alegre
participated with 35,81% of total
ICMS collected in Rio Grande do
Sul. In relation to ISSQN, the city
contributed with 41,11% of the total
collected in the state in 2006.
Moreover, it is important to
emphasize that the work done on
municipal finances sought a
balance, what allowed the increase
on investment capacity of
Municipality of Porto Alegre.
Collected Income and Realized Expenses by Porto Alegre's Public
Administration
Year Collected Income (R$)
Realized Expenses (R$)
2001 1,223,278,426 1,173,294,871 2002 1,267,103,592 1,215,699,923 2003 1,389,760,379 1,132,690,849 2004 1,463,543,528 1,234,840,741 2005 1,594,667,210 1,259,261,534 2006 1,697,468,588 1,307,991,802
Source: FEE1
Elaboration: Municipality of Porto Alegre/ Department of Fundraising and Investment Promotion

31
City Taxes
Year ISSQN¹ (R$) IPTU² (R$) ITIBI³ (R$) Total* (R$) 2002 177.906.043 106.866.218 55.749.531 398.678.685 2003 204.263.738 175.027.216 55.126.624 524.198.260 2004 240.975.729 138.685.288 64.786.742 533.954.735 2005 278.872.547 172.208.218 72.178.868 609.429.581 2006 308.749.205 183.456.475 86.027.026 672.441.823
*The total includes the values of other taxations and improvement contributions
¹Tax on Services
²Tax on Building and Land Property
³ Tax on the Transfer of Goods Between Living People
Source: FEE
Elaboration: Municipality of Porto Alegre/ Department of Fundraising and Investment Promotion
Collected ISS in the State and in Porto Alegre
Year Total Collected ISS in the State (R$)
Total Collected ISS in Porto Alege (R$)
Porto Alegre Participation in the ISS Collection (%)
2002 371.345.899 177.906.043 47,91% 2003 454.468.223 204.263.738 44,95% 2004 580.354.220 240.975.729 41,52% 2005 672.599.760 278.872.547 41,46% 2006 750.977.891 308.749.205 41,11%
Source: FEE
Elaboration: Municipality of Porto Alegre/ Department of Fundraising and Investment Promotion
State Taxes
Year ICMS (R$) IPVA (R$) ITBI (R$) 2002 2.631.458.589 133.165.690 261.270 2003 2.925.529.928 155.107.210 248.624 2004 3.289.551.352 150.576.304 187.665 2005 4.200.275.977 164.730.170 374.619 2006 4.526.071.727 191.374.428 215.637 2007 4.388.877.793 217.725.877 230.604
Source: FEE
Elaboration: Municipality of Porto Alegre/ Department of Fundraising and Investment Promotion

32
Collected ICMS in the State and in Porto Alegre
Year ICMS Collection in the State (R$)
Porto Alegre Participation in the
ICMS Collection (R$)
Porto Alegre Participation in the
ICMS Collection (%) 2002 7.266.357.621 2.631.458.589 36,21% 2003 8.595.598.668 2.925.529.928 34,04% 2004 9.637.938.267 3.289.551.352 34,13% 2005 10.883.213.911 4.200.275.977 38,59% 2006 11.812.661.387 4.526.071.727 38,32% 2007 12.257.603.035 4.388.877.793 35,81%
Source: FEE
Elaboration: Municipality of Porto Alegre/ Department of Fundraising and Investment Promotion
Federal Taxes
Ano IPI (R$) IRPJ (R$) Receitas Previdenciárias*
Total das Receitas (R$)
2002 112.044.865 645.952.278 - 3.839.601.384 2003 109.003.521 469.257.495 - 4.262.291.158 2004 104.799.688 588.013.220 - 4.546.946.609 2005 122.028.033 651.752.486 - 5.246.323.784 2006 131.641.845 792.869.410 - 5.750.669.708
2007 151.096.700 977.950.631 2.538.186.729 8.951.133.938 Source: FEE
Elaboration: Municipality of Porto Alegre/ Department of Fundraising and Investment Promotion

33
VIII. Brazil´s Socioeconomic Indicators Why to invest in Brazil?
Economically, because the country:
- Has an area of 8,5 million square
kilometers;
- Has 170 million inhabitants and an
economically active population of 90
million of people;
- Presents an annual demographic
evolution of 2,5 million of people;
- Is an open door for Mercosur;
- Has frontiers with ten countries:
Argentina, Bolivia, Colombia, French
Guyana, Guyana, Paraguay, Suriname,
Uruguay and Venezuela
- Is one of the ten biggest economies in
the world
- Has the biggest and most diversified
industry in Latin America and
Caribbean;
- Is the biggest coffee, orange and
sugar-cane producer in the world
- Has the biggest forest industry in
Latin America;
- Is one of the biggest producers and
exporters of rough and processed
mineral commodities;
- Has huge iron ore, bauxite,
manganese, tin and gold deposits;
- Is one of the biggest world producers
of electric energy;
- Has excellent road structure and
fluvial transport facilities, besides a
large coast with a great number of
ports;
- Is one of the biggest food world
producers;
- Has one of the most modern
telecommunication systems;
- Has the most modern and advanced
bank system of the world;
- Has 32,4 million ton of installed
capacity;
- Is a great consumer good producer;
- Has a modern and competitive textile
industry, with more than 30 thousand
companies that commercialize US$21
billion per year;
- Has 22% of the arable soils of the
world;
- Offers an excellent tourism
infrastructure;

34
- Receives more than 5 million foreign
tourists per year;
- Is the first world producer of regional
jets;
- Is the third shoes world producer,
with a competitive leather industry;
- Is in the third position in the ranking of
soft drinks world production;
- Is the forth biggest world producer of
commercial airships;
- Has the fifth biggest rubber industry;
- Is the sixth biggest cosmetics world
market, with US$9 billion of annual
sales;
- Has the seventh biggest chemical
industry;
- Is the eighth biggest steel world
producer (27 million ton per year);
- Is the tenth biggest automobiles world
producer (1,8 million of vehicles per
year);
- Has the tenth biggest paper and
cellulose industry.
Culturally, because the country:
- Is pacific and multiethnic;
Respects immigrants and their beliefs.
Politically, because the country:
- Sustains a democratic regime and
has stable public institutions, like the
Chamber of Deputies, Federal Senate
and Justice Courts;
- Is free from conflicts, defends
international laws and promotes peace
and progress between nations.
Source: Brazilian Ministry of External
Relations/ BrazilTradeNet
National Accounts
Main Macroeconomic
Aggregates 2001 2002 2003 2004 2005
Gross Domestic 1.198.736 1.346.028 1.556.182 1.766.621 1.937.598 Per capita GDP (R$) 6.896 7.631 8.694 9.729 10.520 Gross national 1.153.452 1.294.084 1.501.032 1.708.131 1.876.001 Gross available output (R$ millions)
1.157.318 1.301.351 1.509.785 1.717.695 1.804.637
Gross savings (R$ 200.817 249.212 317.172 410.117 430.549 Capability (+) or necessity (-) of financing (R$ millions)
(-) 53.409 (-)15.434 11.193 34.512 33.581
Source: Brazilian Institute of Geography and Statistics
Elaboration: Municipality of Porto Alegre/ Department of Fundraising and Investment Promotion
35
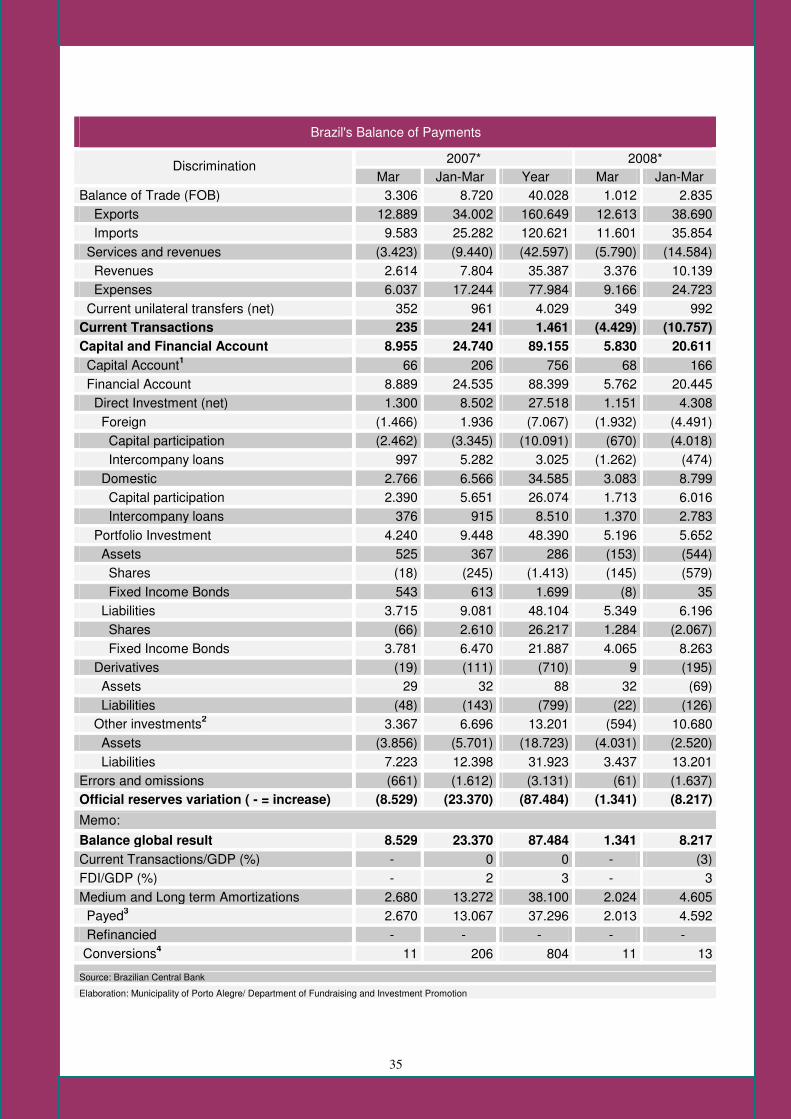
Brazil's Balance of Payments
2007* 2008* Discrimination Mar Jan-Mar Year Mar Jan-Mar
Balance of Trade (FOB) 3.306 8.720 40.028 1.012 2.835 Exports 12.889 34.002 160.649 12.613 38.690 Imports 9.583 25.282 120.621 11.601 35.854 Services and revenues (3.423) (9.440) (42.597) (5.790) (14.584) Revenues 2.614 7.804 35.387 3.376 10.139 Expenses 6.037 17.244 77.984 9.166 24.723 Current unilateral transfers (net) 352 961 4.029 349 992 Current Transactions 235 241 1.461 (4.429) (10.757)
Capital and Financial Account 8.955 24.740 89.155 5.830 20.611
Capital Account1 66 206 756 68 166 Financial Account 8.889 24.535 88.399 5.762 20.445 Direct Investment (net) 1.300 8.502 27.518 1.151 4.308 Foreign (1.466) 1.936 (7.067) (1.932) (4.491) Capital participation (2.462) (3.345) (10.091) (670) (4.018) Intercompany loans 997 5.282 3.025 (1.262) (474) Domestic 2.766 6.566 34.585 3.083 8.799 Capital participation 2.390 5.651 26.074 1.713 6.016 Intercompany loans 376 915 8.510 1.370 2.783 Portfolio Investment 4.240 9.448 48.390 5.196 5.652 Assets 525 367 286 (153) (544) Shares (18) (245) (1.413) (145) (579) Fixed Income Bonds 543 613 1.699 (8) 35 Liabilities 3.715 9.081 48.104 5.349 6.196 Shares (66) 2.610 26.217 1.284 (2.067) Fixed Income Bonds 3.781 6.470 21.887 4.065 8.263 Derivatives (19) (111) (710) 9 (195) Assets 29 32 88 32 (69) Liabilities (48) (143) (799) (22) (126) Other investments2 3.367 6.696 13.201 (594) 10.680 Assets (3.856) (5.701) (18.723) (4.031) (2.520) Liabilities 7.223 12.398 31.923 3.437 13.201 Errors and omissions (661) (1.612) (3.131) (61) (1.637) Official reserves variation ( - = increase) (8.529) (23.370) (87.484) (1.341) (8.217)
Memo:
Balance global result 8.529 23.370 87.484 1.341 8.217
Current Transactions/GDP (%) - 0 0 - (3) FDI/GDP (%) - 2 3 - 3 Medium and Long term Amortizations 2.680 13.272 38.100 2.024 4.605 Payed3 2.670 13.067 37.296 2.013 4.592 Refinancied - - - - - Conversions4 11 206 804 11 13
Source: Brazilian Central Bank
Elaboration: Municipality of Porto Alegre/ Department of Fundraising and Investment Promotion

36
Balance of Trade – FOB (US$ millions)
Period Exports Imports Balance
Accumulated
12 months Accumulated
12 months Accumulated
12 months
2004* Dez 96.678 96.678 62.836 62.836 33.842 33.842 2005* Dez 118.529 118.529 73.600 73.600 44.929 44.929 2006* Jan 9.287 120.359 6.452 74.789 2.835 45.570
Fev 18.061 121.361 12.423 75.781 5.638 45.580 Mar 29.458 123.488 20.130 77.578 9.328 45.909 Abr 39.289 124.098 26.871 78.988 12.418 45.110 Mai 49.594 124.567 34.158 79.903 15.435 44.664 Jun 61.057 125.805 41.524 81.092 19.533 44.713 Jul 74.708 128.377 49.515 83.027 25.193 45.350 Ago 88.380 130.682 58.633 84.448 29.747 46.234 Set 100.957 132.605 66.741 86.242 34.215 46.363 Out 113.646 135.371 75.479 88.752 38.166 46.619 Nov 125.543 136.459 84.138 90.698 41.405 45.761 Dez 137.807 137.807 91.351 91.351 46.457 46.457
2007* Jan 10.984 139.504 8.467 93.368 2.516 46.137 Fev 21.113 140.860 15.695 94.627 5.415 46.233 Mar 34.002 142.352 25.261 96.503 8.720 45.849 Abr 46.449 144.967 33.529 98.030 12.898 46.937 Mai 60.096 148.310 43.318 100.534 16.754 47.776 Jun 73.214 149.964 52.620 102.466 20.575 47.499 Jul 87.333 150.433 63.398 105.249 23.920 45.184 Ago 102.433 151.861 74.967 107.690 27.462 44.171 Set 116.599 153.450 85.662 110.277 30.931 43.173 Out 132.367 156.529 98.001 113.872 34.366 42.657 Nov 146.418 158.683 110.026 117.239 36.392 41.444 Dez 160.649 160.649 120.621 120.621 40.028 40.028
2008* Jan 13.277 162.942 12.334 124.493 943 38.449 Fev 26.077 165.613 24.254 129.182 1.823 36.430 Mar 38.690 165.336 35.854 131.200 2.835 34.136 Abr 52.749 166.949 48.169 135.252 4.579 31.697
* Preliminary data
Source: Brazilian Central Bank
Elaboration: Municipality of Porto Alegre/ Department of Fundraising and Invesment Promotion

37
Commercial Interchange ( US$ millions)
2008* 2007* January-March Discrimination
Exports Imports Balance Exports Imports Balance Total 160,649 120,621 40,028 38.690 8,468 2,516 Aelc 1.808 2.731 (922) 497 602 (106) Africa 8.578 11.339 (2.761) 1.957 3.035 (1.078) Aladi 36.426 20.587 15.839 9.109 6.288 2.822 Argentina 14.417 10.409 4.008 3.967 3.294 673 Chile 4.264 3.481 784 948 922 25 Mexico 4.260 1.979 2.281 946 593 353 Paraguai 1.648 434 1.214 501 179 321 Uruguai 1.288 786 502 331 230 101 Venezuela 4.724 346 4.378 949 87 862 Others 5.824 3.151 2.673 1.467 981 486 Asia 25.086 30.718 (5.632) 5.871 9.814 (3.943) China 10.749 12.620 (1.871) 2.087 4.145 (2.058) Korea 2.047 3.391 (1.345) 475 1.200 (725) Japan 4.321 4.609 (288) 1.114 1.502 (388) Outros 7.970 10.097 (2.128) 2.195 2.967 (771) Canada 2.362 1.708 653 438 423 15 USA¹ 25.314 18.889 6.425 5.761 5.277 484 Eastern Europe 4.309 2.766 1.543 950 970 (21) Middle East 6.399 3.206 3.194 1.504 1.164 340 European 40.428 26.732 13.696 9.627 7.707 1.920 Germany 7.211 8.669 (1.458) 1.600 2.542 (942) France 3.472 3.525 (53) 799 1.072 (273) Italy 4.464 3.348 1.116 1.239 995 244 Netherlands 8.841 1.116 7.725 2.103 303 1.799 United 3.301 1.955 1.346 863 506 357 Others 13.139 8.119 5.020 3.023 2.289 734 Others 9.938 1.952 7.986 2.975 574 2.402 Mercosul 17.354 11.630 5.724 4.799 3.704 1.095 Nafta 31.936 22.577 9.359 7.146 6.293 853 Opep 13.856 13.183 674 3.142 3.785 (643)
¹ Includes Porto Rico.
Source: Brazilian Central Bank
Elaboration: Municipality of Porto Alegre/ Department of Fundraising and Investment Promotion

38
Foreign Direct Investment (FDI)
Value (US$ millions) 2006* 2007* Discrimination
Dec Year Dec Year Total 2.487 18.782 886 34.616 Entrance 4.439 32.297 4.291 50.203 Exits 1.952 13.514 3.405 15.587 Capital participation 2.774 15.373 1.235 26.101 Entrances 3.505 22.706 3.081 34.305 Currency 3.387 20.463 2.549 31.677 Autonomouses 3.387 20.233 2.549 31.677 Privatizations - 230 - - Conversions1 117 2.234 531 2.602 Autonomouses 117 2.234 531 2.602 Privatizations - - - - Good 1 9 1 26 Exits 730 7.333 1.846 8.204 Intercompany loans (287) 3.409 (349) 8.515 Outlays 935 9.590 1.209 15.898 Amortizations 1.222 6.181 1.559 7.383 Loans from the branch in Brazil to the main office (276) (612) (553) (1.147) Received amortizations 12 221 24 695 Conceded outlays 288 833 576 1.842 Loans from the main office abroad to the branch (11) 4.021 203 9.662 Received outlays 922 9.369 1.186 15.203 Payed amortizations 933 5.349 982 5.541
Memo:
FDI conversions' liquid contribution 45 1.431 322 1.183 Total outlays by conversions 117 2.234 531 2.602 Amortizations of intercompany loans' conversions 72 803 210 1.419 ¹ Includes conversions of interest rate, intercompany loans, credit suppliers, bonds and direct loans.
* Preliminary data
Source: Brazilian Central Bank
Elaboration: Municipality of Porto Alegre/ Department of Fundraising and Investment Promotion
39
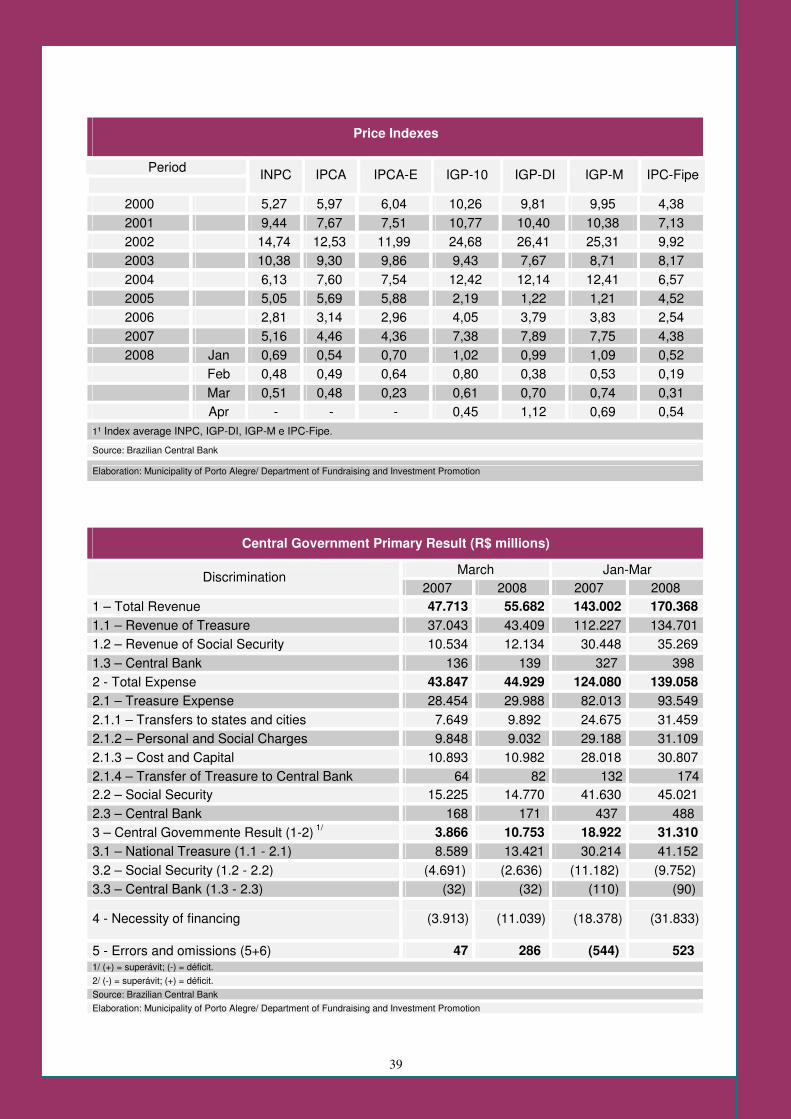
Price Indexes
Period
INPC IPCA IPCA-E IGP-10 IGP-DI IGP-M IPC-Fipe
2000 5,27 5,97 6,04 10,26 9,81 9,95 4,38 2001 9,44 7,67 7,51 10,77 10,40 10,38 7,13 2002 14,74 12,53 11,99 24,68 26,41 25,31 9,92 2003 10,38 9,30 9,86 9,43 7,67 8,71 8,17 2004 6,13 7,60 7,54 12,42 12,14 12,41 6,57 2005 5,05 5,69 5,88 2,19 1,22 1,21 4,52 2006 2,81 3,14 2,96 4,05 3,79 3,83 2,54 2007 5,16 4,46 4,36 7,38 7,89 7,75 4,38 2008 Jan 0,69 0,54 0,70 1,02 0,99 1,09 0,52
Feb 0,48 0,49 0,64 0,80 0,38 0,53 0,19 Mar 0,51 0,48 0,23 0,61 0,70 0,74 0,31 Apr - - - 0,45 1,12 0,69 0,54
1¹ Index average INPC, IGP-DI, IGP-M e IPC-Fipe.
Source: Brazilian Central Bank
Elaboration: Municipality of Porto Alegre/ Department of Fundraising and Investment Promotion
Central Government Primary Result (R$ millions)
March Jan-Mar Discrimination 2007 2008 2007 2008
1 – Total Revenue 47.713 55.682 143.002 170.368
1.1 – Revenue of Treasure 37.043 43.409 112.227 134.701 1.2 – Revenue of Social Security 10.534 12.134 30.448 35.269 1.3 – Central Bank 136 139 327 398 2 - Total Expense 43.847 44.929 124.080 139.058
2.1 – Treasure Expense 28.454 29.988 82.013 93.549 2.1.1 – Transfers to states and cities 7.649 9.892 24.675 31.459 2.1.2 – Personal and Social Charges 9.848 9.032 29.188 31.109 2.1.3 – Cost and Capital 10.893 10.982 28.018 30.807 2.1.4 – Transfer of Treasure to Central Bank 64 82 132 174 2.2 – Social Security 15.225 14.770 41.630 45.021 2.3 – Central Bank 168 171 437 488 3 – Central Govemmente Result (1-2) 1/ 3.866 10.753 18.922 31.310
3.1 – National Treasure (1.1 - 2.1) 8.589 13.421 30.214 41.152 3.2 – Social Security (1.2 - 2.2) (4.691) (2.636) (11.182) (9.752) 3.3 – Central Bank (1.3 - 2.3) (32) (32) (110) (90)
4 - Necessity of financing (3.913) (11.039) (18.378) (31.833)
5 - Errors and omissions (5+6) 47 286 (544) 523 1/ (+) = superávit; (-) = déficit.
2/ (-) = superávit; (+) = déficit.
Source: Brazilian Central Bank
Elaboration: Municipality of Porto Alegre/ Department of Fundraising and Investment Promotion

40
Interest Rate
Period Selic overnight CDI overnight TR TJLP % a.m. % a.a. % a.m. % a.a. % a.m. % a.a. % a.m. % a.a.
2006 Dec 0,99 13,19 0,98 13,14 0,15 1,93 0,55 6,85 2007 Jan 1,08 13,13 1,08 13,07 0,22 2,54 0,53 6,50
Feb 0,87 12,93 0,87 12,89 0,07 1,01 0,53 6,50 Mar 1,05 12,74 1,05 12,69 0,19 2,17 0,53 6,50 Apr 0,94 12,58 0,94 12,52 0,13 1,61 0,53 6,50 May 1,03 12,43 1,02 12,35 0,17 1,95 0,53 6,50 Jun 0,91 12,03 0,90 11,97 0,10 1,21 0,53 6,50 Jul 0,97 11,73 0,97 11,67 0,15 1,70 0,51 6,25 Ago 0,99 11,43 0,99 11,37 0,15 1,62 0,51 6,25 Sep 0,80 11,22 0,80 11,16 0,04 0,47 0,51 6,25 Oct 0,93 11,18 0,92 11,11 0,11 1,32 0,51 6,25 Nov 0,84 11,18 0,84 11,12 0,06 0,75 0,51 6,25 Dec 0,84 11,18 0,84 11,11 0,06 0,81 0,51 6,25
2008 Jan 0,93 11,18 0,92 11,08 0,10 1,16 0,51 6,25 Feb 0,80 11,18 0,79 11,07 0,02 0,32 0,51 6,25 Mar 0,84 11,18 0,84 11,09 0,02 0,26 0,51 6,25
Source: Brazilian Central Bank
Elaboration: Municipality of Porto Alegre/ Department of Fundraising and Investment Promotion
Industrial Production Indicators
Final Goods
Period General Capital Goods Intermediates Goods
General Durable Non-durable and semi-durable
20 Jan 147,29 173,73 147,66 136,32 244,80 119,21 Feb 140,35 166,74 140,20 128,94 237,36 111,96 Mar 163,46 201,55 162,71 149,70 302,38 126,24 Apr 153,17 180,74 154,88 139,46 272,50 118,89 Mai 169,22 210,87 167,81 155,02 305,44 131,79 Jun 164,00 196,80 163,92 150,10 280,78 129,70 Jul 169,25 203,29 169,80 153,33 292,08 131,76 Aug 178,72 223,91 173,57 165,83 323,52 141,43 Sep 167,48 209,42 162,13 156,45 295,61 134,78 Oct 184,53 234,68 175,25 175,16 344,02 149,06 Nov 175,95 231,22 163,56 170,10 330,67 145,24 Dec 157,21 206,73 153,49 146,55 248,49 130,20
20 Jan 160,09 199,86 159,48 147,26 283,13 126,18 Feb 153,94 207,73 154,74 136,06 286,33 113,14 Mar 165,50 227,08 163,18 148,57 322,10 122,20
Source: Brazilian Central Bank
Elaboration: Municipality of Porto Alegre/ Department of Fundraising and Investment Promotion

41
Exchange Rate (R$/US$)
Period End of period Period Media1 Purchase Sell Purchase Sell
Rate Variation (%) Rate Variation
(%) Rate Variation (%) Rate Variation
(%) 2004 2,6536 - 2,6544 - 2,9249 - 2,9257 - 2005 2,3399 -11,82 2,3407 -11,82 2,4333 -16,81 2,4341 -16,80 2006 2,1372 -8,66 2,1380 -8,66 2,1763 -4,74 2,1771 -4,74 2007 1,7705 -17,16 1,7713 -17,15 1,9475 -10,51 1,9483 -10,51 20082/ 1,6864 -4,75 1,6872 -4,75 1,7246 -11,45 1,7254 -11,44
Jan 1,7595 -0,62 1,7603 -0,62 1,7735 -0,66 1,7743 -0,66 Feb 1,6825 -4,38 1,6833 -4,37 1,7269 -2,63 1,7277 -2,63 Mar 1,7483 3,91 1,7491 3,91 1,7068 -1,16 1,7076 -1,16
1/ The diary rate corresponds to the accumulated media in the month, until the indicated day.
2/ Until the last informed date.
Source: Brazilian Central Bank
Elaboration: Municipality of Porto Alegre/ Department of Fundraising and Investment Promotion
Average Real Income of the Occupied People¹ (R$)
Period Formal contract
Informal contract
Autonomous Private Sector Public Sector
2007 Jan 1.165 775 935 1.068 1.812 Feb 1.138 726 947 1.035 1.796 Mar 1.152 717 912 1.043 1.829 Apr 1.153 759 934 1.057 1.824 May 1.125 785 949 1.041 1.797 Jun 1.140 754 932 1.046 1.780 Jul 1.130 761 882 1.042 1.722 Aug 1.118 735 939 1.025 1.790 Sep 1.115 744 939 1.026 1.819 Oct 1.134 748 944 1.043 1.867 Nov 1.257 835 973 1.156 2.047 Dec 1.618 896 977 1.451 2.635
2008 Jan 1.146 788 929 1.065 1.875 Feb 1.139 739 980 1.047 1.833
1/ According to the prices of the last month analyzed, deflated by the INPC, and encompassing the metropolitan region of Recife, Salvador, Belo Horizonte, Rio de Janeiro, São Paulo and Porto Alegre.
Source: Brazilian Central Bank
Elaboration: Municipality of Porto Alegre/ Department of Fundraising and Investment Promotion

42
Human resources
I. Highly qualified workforce
Investment in education reflects positively on city’s economy
Porto Alegre is proud of the
qualification of the
workforce that operates in
different economic sectors. About 26% of
the workers have higher degree
complete. This index rises to around 39%
if analyzed only the sector of trade and
services. Part of that framework is due to
the fact that Rio Grande do Sul’s capital
counts on the presence of 20 higher
education institutions, two of them quite
distinguished in national scene: Rio
Grande do Sul’s Federal University
(UFRGS) and Rio Grande do Sul Catholic
University (PUCRS).
In Courses National Examination
(ENC-Provão) of 2003, both universities
had good results: UFRGS and PUCRS
obtained, respectively, 88% and 61% of
concepts of A and B. From 1996 to 2003,
UFRGS increased by over 83% the
number of people titled in its Masters,
from 570 in 1996 to 1,046 in 2003. In the
same period, the number of qualified
doctors increased by over 327%, from 97
to 415. In PUCRS, in the first semester of
2004, were enrolled 1,202 students in
Master and 595 in Doctorate courses.
In 2001, Rio Grande do Sul’s
State University (UERGS), also
established in Porto Alegre, begun its
activities aiming the graduation of
professionals in areas considered
strategic to the state, because its courses
take into account economic vocation and
the reality in which they will be installed.
Aiming to facilitate the access to
university, UERGS destines 50% of its
vacancies to low income students and
10% to students holder of special
educational needs.
The presence of important
education institutions in Porto Alegre’s
Metropolitan Region, as Vale dos Sinos
University (UNISINOS), Brazilian
Lutheran University (ULBRA) and La
Salle University Center (UNILASALLE),
among others, also contributes to the
qualification of the workforce operating in
Rio Grande do Sul’s capital.
.
Investor’s Guide – Chapter 04

43
People Finishing Superior Education in Porto Alegre
Year Superior Education*/ Finishing People
2001 5.830 2002 6.406 2003 7.132
* Superior Education: Technology education centers, Universities, Colleges.
Source: FEE/ Social Indicator Department
Elaboration: Municipality of Porto Alegre/ Department of Fundraising and Investment Promotion
Superior Education Facilities in Porto Alegre
Year Facilities*
1999 11 2000 12 2001 12 2002 13 2003 17 2004 20
*Total: Technology education centers, Universities and Colleges .
Source: FEE/ Social Indicator Department
Elaboration: Municipality of Porto Alegre/ Department of Fundraising and Investment Promotion
Illiteracy Rate in Porto Alegre
City Illiteracy Rate (%) Porto Alegre 3,45
Source: FEE/ Social Indicator Department - 2000
Elaboration: Municipality of Porto Alegre/ Department of Fundraising and Investment Promotion
Schools, Enrollments and Teachers and Professors in Porto Alegre
Level Schools Enrollments Teachers or Professors
Elementary School
369 204.506 10.624
High School 142 60.895 4.415 College 26 67.412 5.829 Source: IBGE - 2006
Elaboration: Municipality of Porto Alegre/ Department of Fundraising and Investment Promotion

44
Level of Labor Instruction in Porto Alegre
Level of Instruction Number of Employed People Total (%) Illiterate 1.274 0,20
4th grade incomplete 9.544 1,50
4th grade complete 14.220 2,24
8th grade incomplete 48.244 7,59
8th grade complete 83.821 13,18
High School incomplete 49.332 7,76
High School complete 211.262 33,22
College incomplete 51.335 8,07
College complete 166.036 26,11
Master 697 0,11
Doctorate 181 0,03 Source: RAIS - 2006
Elaboration: Municipality of Porto Alegre/ Department of Fundraising and Investment Promotion
Capital Ranking by the Number of Superior Education Facilities
Ranking Capital University Universitarian Center
Integrated Colleges College
Technology Education
Center Total
1º São Paulo 15 13 11 80 19 138 2º Brasília 2 4 4 55 1 66 3º Rio de Janeiro 10 7 4 39 2 62 4º Belo Horizonte 4 4 - 33 6 47 5º Salvador 4 1 1 35 1 42 6º Curitiba 3 3 4 25 6 41 7º Fortaleza 3 - 1 22 5 31 8º Recife 4 - - 23 2 29 9º Vitória 1 - 3 20 2 26 10º Teresina 2 - - 19 2 23 11º Porto Alegre 3 2 - 13 2 20 12º Manaus 2 4 - 11 1 18 13º Belém 4 1 - 9 3 17 14º João Pessoa 1 1 - 10 3 15 15º Florianópolis 2 - 1 8 4 15 16º Goiania 2 1 11 1 15 17º Maceió 1 - 1 11 2 15 18º São Luis 2 1 - 8 1 12 19º Cuiabá 2 1 1 6 2 12 20º Porto Velho 1 - 1 9 - 11 21º Natal 2 - - 8 1 11 22º Macapá 1 - - 9 1 11 23º Aracaju 1 - 8 1 10 24º Campo 3 1 - 4 - 8 25º Palmas 2 1 - 3 - 6 26º Rio Branco 1 - - 5 - 6
Source: INEP/ MEC - 2004
Elaboration: Municipality of Porto Alegre/ Department of Fundraising and Investment Promotion

45
Level of Labor Instruction in the Main Capitals
Level of Instruction Porto Alegre (%)
Recife (%)
Salvador (%)
Belo Horizonte
(%)
Rio de Janeiro
(%)
São Paulo (%)
Curitiba (%)
Illiterate 0,20 0,53 0,33 0,32 0,39 0,26 0,16
4th grade incomplete 1,50 3,02 2,43 2,76 3,11 2,43 1,57
4th grade complete 2,24 3,82 2,87 6,66 5,94 4,77 3,30
8th grade incomplete 7,59 6,03 6,16 9,02 7,94 6,71 5,67
8th grade complete 13,18 22,23 8,38 12,74 16,66 13,58 12,13
High School incomplete 7,76 6,66 8,05 6,34 7,98 7,14 7,67
High School complete 33,22 36,21 48,42 32,64 31,58 36,31 39,23
College incomplete 8,07 4,62 4,69 3,16 7,35 5,57 4,17
College complete 26,11 16,56 18,29 25,79 18,78 22,88 25,84
Master 0,11 0,27 0,32 0,52 0,17 0,18 0,18
Doctorate 0,03 0,05 0,07 0,06 0,08 0,17 0,07 Source: RAIS - 2006
Elaboration: Municipality of Porto Alegre/ Department of Fundraising and Investment Promotion
Level of Labor Instruction by Sector in Porto Alegre
Level of Instruction Industry Civil Construction Trade Services
Agriculture, animal husb.,
vegetal extract., hunting and
fishing Illiterate 182 169 132 744 47
4th grade incomplete 1.205 1.873 838 5.364 264
4th grade complete 1.695 1.620 1.473 9.197 235
8th grade incomplete 5.850 3.844 7.236 31.115 199
8th grade complete 9.624 4.252 15.758 53.890 297 High School incomplete
6.277 1.394 13.263 28.319 79
High School complete
19.518 4.542 45.271 141.679 252
College incomplete 4.957 653 6.618 39.056 51
College complete 6.633 681 6.225 152.354 143
Master 75 6 20 592 4
Doctorate 5 1 29 146 0 Source: RAIS - 2006
Elaboration: Municipality of Porto Alegre/ Department of Fundraising and Investment Promotion

46
II. Diversified labor market
Economy’s vitality contributes to employment generation
The labor market in Porto Alegre
has been characterized by being quite
diverse and by offering a good quantity
of vacancies. Rio Grande do Sul’s
capital is in the 7th position in the
ranking of Brazilian capitals in terms of
number of employment and occupies
the 10th position when analyzed
employment creation.
Following the characteristics of
the main urban centers, the largest
number of establishments with formal
jobs is in service sector. In 2006, it was
registered 23,806 establishments,
accounting for 56% of the total, and
462,456 formal jobs, it is, 73% of the
total.
In trade sector, the indicators
are also significant. There are 14,218
establishments, 85% of them in retail
segment and the remaining (15%) in
wholesale. Around 85% of the formal
jobs are in retail.
Industrial sector are also
present in Porto Alegre. In relation to
labor market, stand out the industries of
food, beverages and alcohol;
metallurgy; paper, cardboard, editorial
and graphic; mechanics; and chemical.

47
Capital Ranking by Employee Total
Ranking Capital Employee Total Total (%)
1º São Paulo 3.905.101 26,98
2º Rio de Janeiro 1.962.014 13,56
3º Belo Horizonte 1.079.244 7,46
4º Brasília 916.929 6,33
5º Curitiba 716.519 4,95
6º Salvador 658.145 4,55
7º Porto Alegre 635.946 4,39
8º Fortaleza 522.794 3,61
9º Recife 506.071 3,50
10º Goiânia 442.332 3,06
11º Manaus 381.580 2,64
12º Belém 315.601 2,18
13º Natal 250.582 1,73
14º Florianópolis 226.597 1,57
15º São Luiz 217.733 1,50
16º João Pessoa 209.992 1,45
17º Campo Grande 205.060 1,42
18º Vitória 201.984 1,40
19º Teresina 194.864 1,35
20º Maceió 187.253 1,29
21º Cuiabá 186.519 1,29
22º Aracajú 179.102 1,24
23º Porto Velho 111.957 0,77
24º Palmas 89.819 0,62
25º Rio Branco 69.791 0,48
26º Macapá 66.300 0,46
27º Boa Vista 34.490 0,24
Source: RAIS - 2006
Elaboration: Municipality of Porto Alegre / Department of Fundraising and Investment Promotion
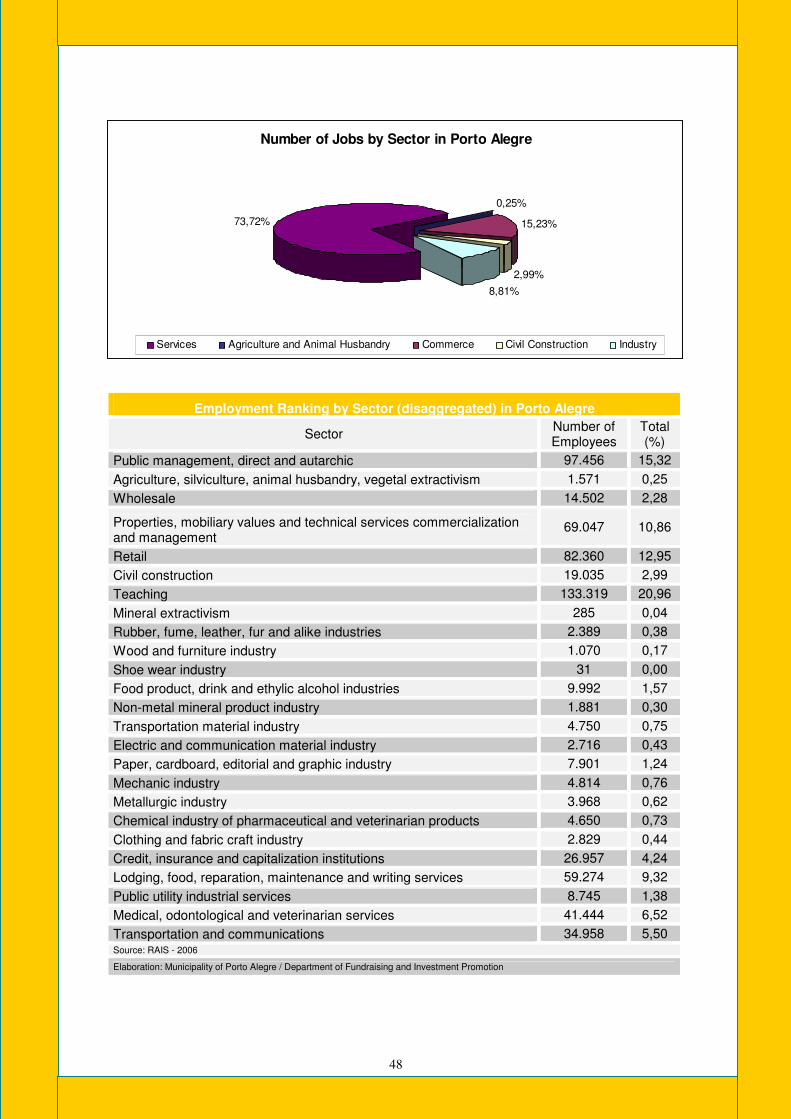
Number of Jobs by Sector in Porto Alegre
Sector Number of Employees
Total (%)
Agriculture and Animal Husbandry
1.571 0,25
Commerce 96.863 15,23
Civil Construction
19.035 2,99
Industry 56.021 8,81 Services 462.456 72,72
Source: RAIS - 2006
Elaboration: Municipality of Porto Alegre/ Department of Fundraising and Investment Promotion
48
Number of Jobs by Sector in Porto Alegre
73,72%
0,25%
15,23%
2,99%
8,81%
Services Agriculture and Animal Husbandry Commerce Civil Construction Industry
Employment Ranking by Sector (disaggregated) in Porto Alegre
Sector Number of Employees
Total (%)
Public management, direct and autarchic 97.456 15,32
Agriculture, silviculture, animal husbandry, vegetal extractivism 1.571 0,25
Wholesale 14.502 2,28
Properties, mobiliary values and technical services commercialization and management
69.047 10,86
Retail 82.360 12,95
Civil construction 19.035 2,99
Teaching 133.319 20,96
Mineral extractivism 285 0,04
Rubber, fume, leather, fur and alike industries 2.389 0,38
Wood and furniture industry 1.070 0,17
Shoe wear industry 31 0,00
Food product, drink and ethylic alcohol industries 9.992 1,57
Non-metal mineral product industry 1.881 0,30
Transportation material industry 4.750 0,75
Electric and communication material industry 2.716 0,43
Paper, cardboard, editorial and graphic industry 7.901 1,24
Mechanic industry 4.814 0,76
Metallurgic industry 3.968 0,62
Chemical industry of pharmaceutical and veterinarian products 4.650 0,73
Clothing and fabric craft industry 2.829 0,44
Credit, insurance and capitalization institutions 26.957 4,24
Lodging, food, reparation, maintenance and writing services 59.274 9,32
Public utility industrial services 8.745 1,38
Medical, odontological and veterinarian services 41.444 6,52
Transportation and communications 34.958 5,50 Source: RAIS - 2006
Elaboration: Municipality of Porto Alegre / Department of Fundraising and Investment Promotion

49
Average Income by Sector in Porto Alegre
Sector Average Income (R$)
Agriculture, Animal Husbandry, Extractivism and Fishing
1.173
Commerce 855
Civil Construction 812
Industry 1.437
Services 1.718 Source: RAIS - 2005
Elaboration: Municipality of Porto Alegre/ Department of Fundraising and Investment Promotion
Average Income by Sector (disaggregated) in Porto Alegre
Sector Average Income (R$)
Finance intermediation, insurance, and alike 3.073,21 Electricity, gas and water production and distribution 2.703,46 International organs and other foreign institutions 2.248,48 Public administration, defense and social security 2.102,94 Education 2.091,64 Health and social services 1.745,69 Extractivist industries 1.694,55 Transformation industries 1.344,71 Transportation, storage and communications 1.340,25 Other collective, social and personal services 1.204,33 Agriculture, animal husbandry, silviculture and forest exploitation 1.164,25 Real estate activities, rent and services to companies 947,76 Commerce, vehicle reparation, personal and domestic objects 855,21 Construction 812,35 Lodging and feeding 521,94 Domestic services 440,58
Source: RAIS - 2005
Elaboration: Municipality of Porto Alegre/ Department of Fundraising and Investment Promotion

50
Average Income by Occupation in Porto Alegre
Occupation Average Income (R$)
Superior members and public power directors 10.846,41
Juridical science professionals 7.887,63
Directors of companies and organizations (except of public interest) 7.451,29
Social and human science professionals 4.379,16
Exact science professionals, physicists and engineers 4.086,28
Directors and managers in health and education companies 3.997,02
Political science researchers and professionals 3.981,45
Health and biological science professionals 3.457,60
Managers 2.981,16
Administration science mid-level technicians 2.547,15
Communicators, artists and religious person 2.369,34
Other mid-level technicians 2.244,66
Transportation service mid-level technicians 1.921,32
Mid-level technicians specialized in physics, chemistry and engineering 1.795,21
Mid-level technicians from culture services and communications 1.699,32
Producers of agriculture and animal husbandry 1.641,10
Mid-level and lay teachers 1.626,25
Production, collection, treatment and distribution operators 1.535,55
General technicians 1.513,91
Biological science mid-level technicians 1.485,72
Bank service employees 1.467,89
Teaching professionals 1.376,80
Maintainers 1.240,77
Mechanical reparation and maintenance employees 1.203,00
Metal and composite transformation employees 1.119,84
Transversal function employees 921,77
Cellulose and paper manufacturing machine installation employees 911,03
Construction and siderurgic facility employees 900,16
Other industry employees 899,78
Accuration and musical instrument and apparatus assemblers 880,97
Electro-electronic manufacturing and installation employees 860,39
Textile, leather, clothing and art industry employees 814,99
Wood and furniture industry employees 811,87
Other employees in conservation, maintenance and reparation 811,56
Salesperson and commerce employees 796,94
Agriculture and animal husbandry exploitation employees 781,36
Service employees 757,45
Agriculture, animal husbandry and forest mechanization employees 740,40
Jewelers, glassers, ceramic workers and alike 708,22
Extractivism industry and civil construction employees 703,43 Source: RAIS - 2005
Elaboration: Municipality of Porto Alegre / Department of Fundraising and Investment Promotion

51
Employed People by Gender in Porto Alegre
Worker Gender Number of Employed
People %
Female 316.260 49,73
Male 319.684 50,27 Source: RAIS - 2006
Elaboration: Municipality of Porto Alegre/ Department of Fundraising and Investment Promotion
Employed People by Sector in Porto Alegre
Sector Men % Women %
Agriculture, Animal Husbandry, Vegetal 1.287 0,40 284 0,09
Trade 54.091 16,92 42.771 13,52
Civil Construction 17.477 5,47 1.588 0,50
Industry 38.409 12,01 17.612 5,57
Services 208.450 65,20 254.005 80,32 Source: RAIS - 2006
Elaboration: Municipality of Porto Alegre/ Department of Fundraising and Investment Promotion
Facility Rate by Sector in Porto Alegre
Sector Facility %
Agriculture, Animal Husbandry, 301 0,71
Commerce 14.218 33,41
Civil Construction 1.539 3,62
Industry 2.691 6,32
Services 23.806 55,94 Source: RAIS - 2006
Elaboration: Municipality of Porto Alegre/ Department of Fundraising and Investment Promotion

52
Facility Rate by Sector (disaggregated) in Porto Alegre
Sector Number of Facilities
%
Public management, direct and autarchic 78 0,18
Agriculture, silviculture, animal husbandry, vegetal extractivism 301 0,70
Wholesale 11.176 26,10 Properties, mobiliary values and technical services commercialization 2.124 4,96
Retail 12.094 28,24
Civil construction 1.539 3,59
Teaching 766 1,79
Mineral extractivism 18 0,04
Rubber, fume, leather, fur and alike industries 200 0,47
Wood and furniture industry 300 0,70
Shoewear industry 159 0,37
Food product, drink and ethylic alcohol industries 6 0,01
Non-metal mineral product industry 505 1,18
Transportation material industry 82 0,19
Electric and communication material industry 65 0,15
Paper, cardboard, editorial and graphic industry 129 0,30
Mechanic industry 405 0,95
Metallurgic industry 212 0,50
Chemical industry of pharmaceutical and veterinarian products 424 0,99
Clothing and fabric craft industry 387 0,90
Credit, insurance and capitalization institutions 895 2,09
Lodging, food, reparation, maintenance and writing services 5.788 13,52
Public utility industrial services 69 0,16
Medical, odontological and veterinarian services 3.134 7,32
Transportation and communications 1.969 4,60 Source: RAIS - 2006
Elaboration: Municipality of Porto Alegre/ Department of Fundraising and Investment Promotion

53
Facility Size in Porto Alegre
Facility Size Facilities %
No active bonds 4.198 9,80
Up to 4 active bonds 25.807 60,26
From 5 to 9 active bonds 6.275 14,65
From 10 to 19 active bonds 3.506 8,19
From 20 to 49 active bonds 1.881 4,39
From 50 to 99 active bonds 613 1,43
From 100 to 249 active bonds 331 0,77
From 250 to 499 active bonds 101 0,24
From 500 to 999 active bonds 59 0,14
1000 or more active bonds 54 0,13 Sourcee: RAIS - 2006
Elaboration: Municipality of Porto Alegre/ Department of Fundraising and Investment Promotion
Ranking of Capitals by Employment Generation Rate Capitals Admission Demission Balance
1º São Paulo 12.342.022 11.708.989 633.033 2º Rio de Janeiro 6.745.754 6.476.634 269.120 3º Belo Horizonte 4.070.350 3.856.616 213.734 4º Brasília 1.983.583 1.843.115 140.468 5º Manaus 1.098.462 993.066 105.396 6º Fortaleza 1.634.338 1.535.882 98.456 7º Curitiba 2.441.159 2.344.070 97.089 8º Salvador 1.554.029 1.465.904 88.125 9º Goiânia 1.432.534 1.366.997 65.537 10º Porto Alegre 1.925.175 1.860.758 64.417 11º Recife 1.272.939 1.212.590 60.349 12º Natal 570.177 519.835 50.342 13º Belém 689.098 644.370 44.728 14º Vitória 564.593 527.368 37.225 15º São Luiz 388.959 354.420 34.539 16º Florianópolis 598.555 567.219 31.336 17º Campo Grande 619.414 591.755 27.659 18º Aracajú 427.903 403.337 24.566 19º Teresina 403.616 380.484 23.132 20º João Pessoa 375.803 356.393 19.410 21º Cuiabá 519.564 505.258 14.306 22º Porto Velho 187.686 178.314 9.372 23º Maceió 371.855 363.451 8.404 24º Macapá 106.620 99.231 7.389 25º Palmas 122.914 116.021 6.893 26º Rio Branco 111.083 105.270 5.813 27º Boa Vista 69.055 64.128 4.927
Sourcee: RAIS - 2006
Elaboration: Municipality of Porto Alegre/ Department of Fundraising and Investment Promotion

54
Infrastructure
Location and logistics benefit the productive sectors
Porto Alegre has a well
developed logistic platform, formed by
one of the largest international airports
in the country, by a road and railway
system that interconnect the city with
other regions in the state and with
Brazil’s and Mercosur’s main cities, and
also by a fluvial harbor. All these modes
are interconnected, allowing the receipt
and discharge of productive sectors to
different locations.
I. Road Structure
Highways in Rio Grande do Sul Type of highway Total (Km) Paving (%) Federal 5.500,26 33,11 of State 11.113,15 66,89 Total 16.613,41 100,00 Source: Department of Transports of Rio Grande do Sul/ DAER
Elaboration: Municipality of Porto Alegre/ Department of Fundraising and Investment Promotion
Investor’s Guide – Chapter 05
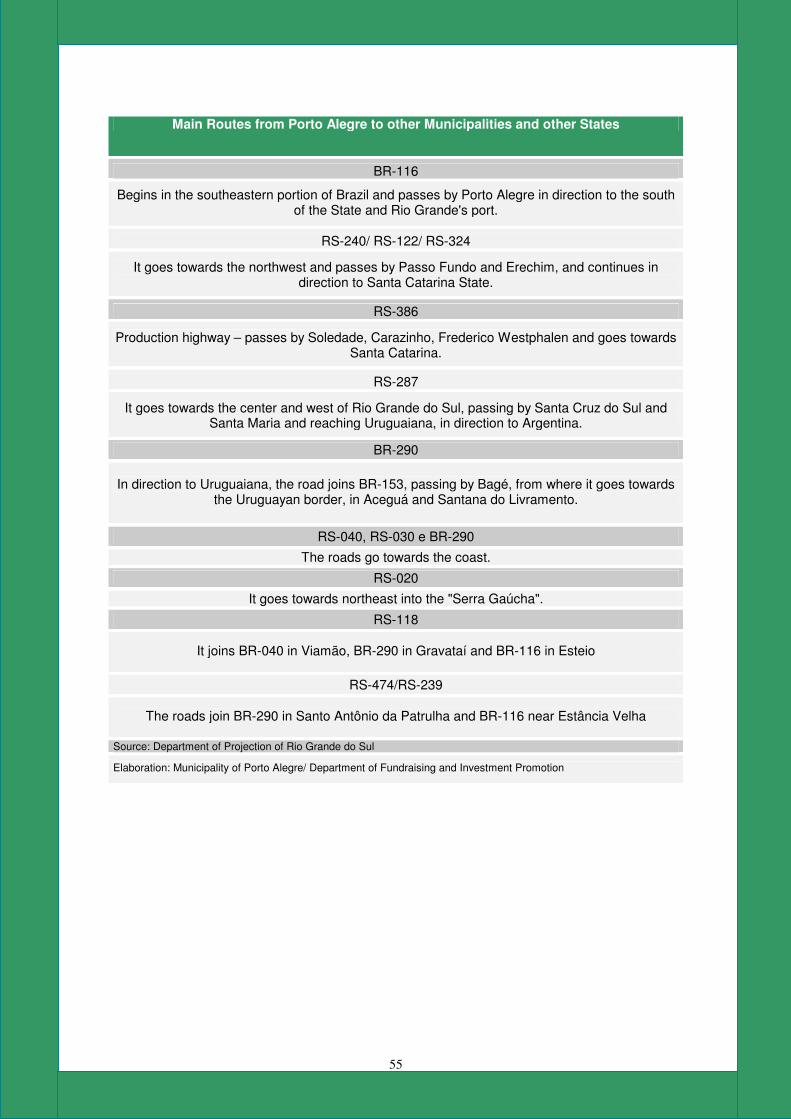
55
Main Routes from Porto Alegre to other Municipalities and other States
BR-116
Begins in the southeastern portion of Brazil and passes by Porto Alegre in direction to the south of the State and Rio Grande's port.
RS-240/ RS-122/ RS-324
It goes towards the northwest and passes by Passo Fundo and Erechim, and continues in direction to Santa Catarina State.
RS-386
Production highway – passes by Soledade, Carazinho, Frederico Westphalen and goes towards Santa Catarina.
RS-287
It goes towards the center and west of Rio Grande do Sul, passing by Santa Cruz do Sul and Santa Maria and reaching Uruguaiana, in direction to Argentina.
BR-290
In direction to Uruguaiana, the road joins BR-153, passing by Bagé, from where it goes towards the Uruguayan border, in Aceguá and Santana do Livramento.
RS-040, RS-030 e BR-290
The roads go towards the coast.
RS-020
It goes towards northeast into the "Serra Gaúcha".
RS-118
It joins BR-040 in Viamão, BR-290 in Gravataí and BR-116 in Esteio
RS-474/RS-239
The roads join BR-290 in Santo Antônio da Patrulha and BR-116 near Estância Velha
Source: Department of Projection of Rio Grande do Sul
Elaboration: Municipality of Porto Alegre/ Department of Fundraising and Investment Promotion

56
Accessibility to the Main Roads
Source: Department of Projection of Rio Grande do Sul
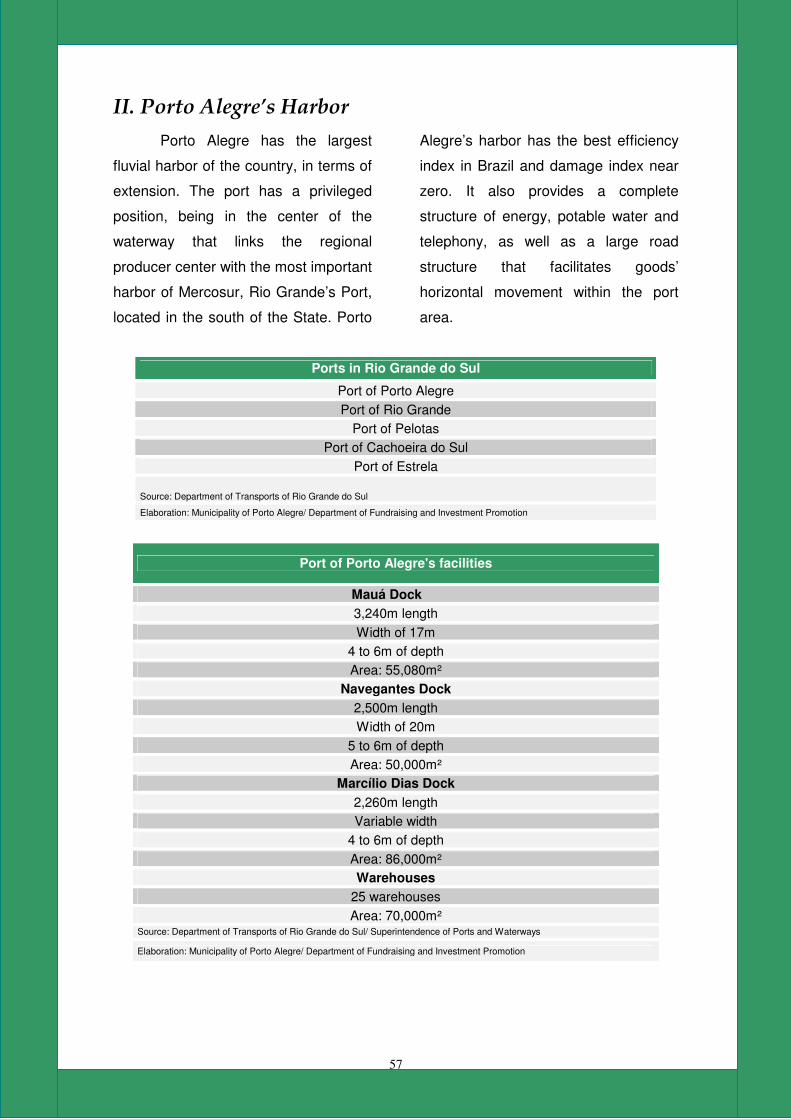
57
II. Porto Alegre’s Harbor
Porto Alegre has the largest
fluvial harbor of the country, in terms of
extension. The port has a privileged
position, being in the center of the
waterway that links the regional
producer center with the most important
harbor of Mercosur, Rio Grande’s Port,
located in the south of the State. Porto
Alegre’s harbor has the best efficiency
index in Brazil and damage index near
zero. It also provides a complete
structure of energy, potable water and
telephony, as well as a large road
structure that facilitates goods’
horizontal movement within the port
area.
Ports in Rio Grande do Sul
Port of Porto Alegre Port of Rio Grande
Port of Pelotas Port of Cachoeira do Sul
Port of Estrela
Source: Department of Transports of Rio Grande do Sul
Elaboration: Municipality of Porto Alegre/ Department of Fundraising and Investment Promotion
Port of Porto Alegre's facilities
Mauá Dock
3,240m length Width of 17m
4 to 6m of depth Area: 55,080m²
Navegantes Dock
2,500m length Width of 20m
5 to 6m of depth Area: 50,000m²
Marcílio Dias Dock
2,260m length Variable width
4 to 6m of depth Area: 86,000m² Warehouses
25 warehouses Area: 70,000m²
Source: Department of Transports of Rio Grande do Sul/ Superintendence of Ports and Waterways
Elaboration: Municipality of Porto Alegre/ Department of Fundraising and Investment Promotion

58
Port of Porto Alegre: Loads Flow Evolution
Year Shipping (Kg) Landing (Kg) Total (Kg)
1996 337.625 5.458.093 5.795.718 1997 255.250 5.060.452 5.315.702 1998 611.774 6.200.634 6.812.408 1999 707.237 5.302.729 6.009.966 2000 1.298.301 9.758.106 11.056.407
Source: Brazilian Ministry of Transports
Elaboration: Municipality of Porto Alegre/ Department of Fundraising and Investment Promotion
Intermodal Structure
Source: Department of Projection of Rio Grande do Sul l

59
III. Salgado Filho International Airport
Salgado Filho International
Airport is one of the most important in
Brazil. It occupies an area of 3,8
thousand square kilometers, providing
modern and efficient facilities. In 2006,
was registered the movement of 59,4
thousand aircraft.
Salgado Filho International Airport
Airport Site
Area: 3,805,810.04 m² Airplanes Site
Area: 142,750 m² Runway
Dimensions: 2,280 x 42 Passengers Terminal
Capacity/Year: TPS-I: 4,000,000 e TPS-II: 2,100,000
Area(m²): TPS-I: 37.600 e TPS-II: 15,540 Parking
Capacity: 1,440 vehicles Airplanes parking
Number of positions: 16 positions Source: Infraero
Elaboration: Municipality of Porto Alegre/ Department of Fundraising and Investment Promotion
Salgado Filho International Airport - Operational Flow
Year Airplanes Aerial Charge Passengers 2002 60.941 38.392.962 2.873.230 2003 53.332 35.402.160 2.880.680 2004 57.740 37.024.689 3.215.545 2005 55.767 36.904.725 3.521.204 2006 59.463 28.932.053 3.846.508
Source: Infraero Elaboration: Municipality of Porto Alegre/ Department of Fundraising and Investment Promotion

60
IV. Urban Transport
Considered by National
Association of Public Transport the best
urban bus company in the country,
Carris is also the only municipal
institution to win the National Award for
Public Management promoted by
Federal Government. In 2005, it
obtained the first position in the
category of Efficient Public Company, in
Top of Mind Research held in Rio
Grande do Sul’s capital
Porto Alegre's Bus Companies and its Fleets
Company Number of vehicles
Carris 335 Conorte 411
STS 474 Unibus 396 Total 1,616
Elaboration: Municipality of Porto Alegre/ Department of Fundraising and Investment Promotion
Carris - Urban Buses Public Company
Lines
26 Fleet
335 bus Vehicles with air conditioner
142 Vehicles with automatic transmission
244 Vehicles with accessibility for physically handicapped people
127 Diary number of passengers
240,000 Number of employees
1,600 Source: Carris Elaboration: Municipality of Porto Alegre/ Department of Fundraising and Investment Promotion

61
V. Energy and Water
The consumption of energy in
Porto Alegre is supplied by State
Electric Energy Company (CEEE). The
water supply, in
turn, is responsibility of Municipal
Department of Water and Sewage
(DMAE).
CEEE – Electric Energy State Company
Hydroelectric facilities 15
Effective potency 910,6 MW
Electric Energy Lines of Transmission 5.781 Km
Municipalities Supplied 72
Source: CEEE
Elaboration: Municipality of Porto Alegre/ Department of Fundraising and Investment Promotion
Municipal Department of Water and Sewers
Extension of the Water Distribution Network 3.615,35 km
Number of Water Connections 271.282
Hydrometric Index 0,9669
Water Treatment Plants 8
Crude Water Pumping Station 8
Treated Water Pumping Station 92
Shells 99
Total Storage Capacity of the Shells 193.890 m³
Tanker Trucks 13
Average Volume of Water Distributed by the Tanker Trucks 172.297m³/year
Source: DMAE/ 2006
Elaboration: Municipality of Porto Alegre/ Department of Fundraising and Investment Promotion

62
Opportunities I. A Science and Technology Center
Porto Alegre is a national
reference in the science and technology
sector due to its high development and
to the integration between the public
sector, the private sector and research
institutions.
Important institutions in the city
help the development of the whole
private and public structure. As an
example, we could cite the Technology
Parks of UFRGS and PUCRS
(Tecnopuc), companies like Dell, HP,
Microsoft, Tlantic, among many other
small, medium and large ones, and the
Infovia, a optical fiber network installed
by the City Hall which has already
reached 311Km long.
It is also installed in Porto
Alegre the first prototyping factory
specialized in integrated circuits of Latin
America, the Center of Excellence in
Advanced Electronics Technology
(CEITEC).
The health sector also stands
out Porto Alegre as the second largest
of Brazil in this area. The city has about
2,900 companies related to this
industry, responsible for the
maintenance of 34 thousand direct
jobs.
Investor’s Guide – Chapter 06

63
II. Benefits
ISSQN Aliquot Reduction
Systems analysis and
development services, programming,
development of computer programs,
licensing or assignment of computer
programs right of use, advice and
consultancy on information technology,
technical support in information
technology, including installation,
configuration and maintenance of
computer programs and databases,
planning, construction, maintenance
and upgrade of electronic pages,
hosting of pages, servers and
applications, management and
distribution of lists and messages:
ALIQUOT: 2.0%
Restinga Industrial Park
The Restinga Industrial Park
(RIP) has the objective to promote the
development of Porto Alegre’s south
zone by offering benefits to the
companies on the acquisitions of lots in
that region. The Park counts with a
complete infrastructure (electric energy
networks, water and drainage systems
– sewer and pluvial – and paved
roads).
Law. 9.094/2003
Art. 7th Will be conceded, in the form of
incentive, a percentage rebate on the
square meter price, according to the
necessary period to the enterprise
installation, as follows:
I - installation and putting into operation
within a period of up to twenty-four (24)
months: rebate of 80% (eighty percent)
on the purchase price of the lot;
II - installation and putting into
operation within twenty-four (24)
months and 01 day up to 36 days
(thirty-six) months: rebate of 60% (sixty
percent) on the purchase price of the
lot, and
III - installation and putting into
operation within 36 (thirty-six) months
and 01 day to forty-eight (48) months:
rebate of 40% (forty percent) on the
purchase price of the lot

64
III. Reasons to invest in Porto Alegre
A complete city, from localization to technology
Porto Alegre, accordingly to EXAME Magazine ranking, is the second-best Brazilian
city to invest.
Many are the reasons supporting this statement:
– Privileged Location
Rio Grande do Sul’s capital is
strategically situated towards
Mercosur’s main cities – São Paulo,
Montevideo, Buenos Aires, Santiago
and Asunción.
– Quality of Life Indicators
Porto Alegre is among the 10 Brazilian
cities with the best Human
Development Index (HDI) and is the
first city in the ranking when
considering only municipalities with
more than 1 million inhabitants.
– Economic Indicators
The capital of Rio Grande do Sul is the
6th city in terms of participation in
Brazil’s Gross Domestic Product
(GDP). The city also stands out
because its GDP per capita is R$
19.582,44
– Labor qualification
Formation and upgrading of human
resources are guaranteed by the 20
higher education institutions, directed
toward different productive activities,
related to graduation and post-
graduation degrees. About 26% of the
employers have high degrees.
– Intermodal Infra-structure
The logistical platform existent in Rio
Grande do Sul’s capital is satisfactorily
developed, and interconnect one of the
main Brazilian international airports
through a road and railway system.
This system is connected to other
regions of Rio Grande do Sul and to the
main cities of Brazil and Mercosur.
With this infra-structure, joins Porto
Alegre’s port, which is the largest
Brazilian fluvial harbor in extension and
has the best efficiency index in Brazil
and damage index near zero.
– Technological Development
An important Information Technology
(IT) center has been developed in Porto
Alegre, so that the city is the first,
among Brazilian cities, to have an
Infovia, it is, an optical fiber net that
contributes for the progress of the city’s
communication networks. The
emergence and growth of this center
are due to established partnerships
between government, universities,

65
incubators, industries and class and
business entities
– Business Tourism
In Rio Grande do Sul’s capital, the
tourism have been greatly developed in
business sector. Porto Alegre is today
among the most visited Brazilian cities
by foreigners.
- Investor Support Center – ISC
The Investor Support Center – ISC was
created by the Department of
Fundraising and Investment Promotion
with the objective to be a support arm
from the municipal public power to the
private sector, more specifically to
entrepreneurs who invest or want to
invest in Porto Alegre.
If you are an investor, you will find in
the ISC a team able to serve you with
the necessary support for the
implementation of your investment. In
the city
- Benefits
The Municipality of Porto Alegre, in
addition to working continuously to
improve the investment climate in the
city, offers a range of benefits to
investors, among which could be
posted the reduction of taxes for
strategic economic sectors and the
ones related with logistics, in the
Restinga Industrial Park area. For more
information about benefits, please
contact the Investor Support Center
whose contact details are in this folder.

66
IV. How to open your business in Porto Alegre Step by step to a great investment
Important consultations needed before
opening a business in Porto Alegre:
- Check the company’s name in Rio
Grande do Sul’s Board of Trade
(JUCERGS)
- Informative Bulletin on Real estate in
Municipal Secretary of Production,
Industry and Trade (SMIC)
- Check the company’s fancy name in
National Institute of Industrial Property
(INPI), in the case of brand registration
Step 1 – CNPJ Request
Deadline: along with the approval of
Social Contract/Entrepreneur Appli-
cation
Cost: Free
In Rio Grande do Sul, the Board
of Trade and Federal Revenue have a
convention for companies’ inscription in
CNPJ. To make this application, the
taxpayer will generate and transmit in
advance his request via internet
through programs offered for free by
Federal Revenue, which must be
downloaded from the web site
www.receita.fazenda.gov.br.
The programs to be
downloaded are CPNJ and
RECEITANET. In CNPJ program, the
taxpayer will fill the request. In
RECEITANET, he will send the
information to Federal Revenue. From
this request, will be generated DBE –
Entrance Basic Document – of CNPJ,
which must be signed and sent with the
documents to Board of Trade.
When registering in CNPJ, it
must be chosen the activity which the
company will execute. This
classification will be utilized not only in
taxation, but also in the monitoring of
company’s activities.
It is necessary to remember that
not all companies can choose Simples.
In order to consult the kinds of
companies that fit in Simples, the
entrepreneur can access National
Simples webs site
www.receita.fazenda.gov.br/SimplesNa
cional
Step 2 – Registration at State Board of
Trade
Deadline: 15 days
Cost: R$ 65,06 or R$ 37,05
A company’s legal registration is
taken in State Board of Trade.
To make the registration, it is
necessary to fill some formularies and
present documents, such as Social
Contract or Entrepreneur Request (in

67
the case of the former individual
signature) and personal documents of
each member.
Step 3 – Company’s registration in
State Secretary of Finance and/or
Municipal Secretary of Finance
Deadline: 2 or 3 days
Cost: Free
The registration in state taxation
system must be done in State
Secretary of Finance (SEFAZ). The
state inscription is compulsory for
companies in the sector of trade,
industry and inter-municipal and
interstate transport services. In this
range are also included communication
and energy services. From this
inscription is generated the company’s
CGC/TE, which will be utilized for the
taxpayer to perform the subsequent
collection of Tax on Goods and
Services (ICMS).
To companies’ that operate in
service sector, it is necessary to make
the inscription in Municipal Secretary of
Finance (SMF), in order to register in
Municipal Register to later collection of
Tax on Service of Any Nature (ISSQN).
It is necessary that the entrepreneur fill
the specific forms and get the required
signatures’ authentication
Step 4 – Location Permission Request
Deadline: in most cases, in time
Cost: R$ 51,15
The company must request in
Municipal Secretary of Industry and
Trade (SMIC) the location Permission..
The Permission is a license that
allows the establishment and the
working of industrial, commercial and
service provider institutions, as well as
companies and associations of any
kind, entailed to natural and juristic
persons
Step 5 – Request for Authorization for
Printing Fiscal Documents (AIDF) in
State Secretary of Finance and/or in
Municipal Secretary of Finance
Deadline: 1 day
Cost: Free
After the AIDF’s request in the
responsible organ, the entrepreneur
can order fiscal notes to authorized
graphics.
Step 6 – Open an account of Time of
Service Guarantee Fund (FGTS) in
Caixa Econômica Federal
Deadline: 1 day
Cost: free
To open an account, the
entrepreneur must go to any agency of
Caixa Econômica Federal carrying a
copy of company’s CNPJ and of Social
Contract or Entrepreneur Request..
Step 7 – Staff Legalization
7.1. Report to Ministry of Labor the staff
employment

68
Deadline: 1 day
Cost: Free
The employer must report the
hiring or dismissal of any employee to
the Regional Labor Office until the 15th
day of the month subsequent to the
event, through a notice via internet or
by mail.
7.2. Register the employees in the
Program of Social Integration (PIS)
Deadline: 1 day
Cost: Free
The registration of the
company’s employees in PIS is
obtained through the delivery of a form
filled out and signed by the employer to
Caixa Econômica Federal.
7.3. Registration in Class Syndicate
Deadline: 5 days
Cost: variable
Step 8 – Company’s registration in
Employer’s Syndicate
Deadline: 5 days
Cost: variable
The company must enroll in the
employer’s syndicate category in which
fits its branch of activity and begin to
pay Employer’s Syndicate Contribution.
Step 9 – Fire Brigade Permission
Deadline: variable
Cost: variable
The entrepreneur must request
the Fire Brigade Permission if the
establishment is open to the public.
Source: Doing Business in Brazil; SEBRAE.
Elaboration: Municipality of Porto Alegre/ Department of Fundraising and Investment Promotion
It is suggested also the "Entrepreneur's
Guide" published by the Zero Hora
Journal on May 08th 2008 and available
through the following link:
http://zerohora.clicrbs.com.br/zerohora/j
sp/default2.jsp?uf=1&local=1&source=a
1854001.xml&template=3898.dwt&editi
on=9815§ion=966

69
The Captare and the Investor Support Center
Institutionally, the Department of
Fundraising and Investment
Promotion/CAPTARE is connected
directly to the Mayor’s Office. Its
activities are developed by four
Technical Units: Fundraising, Special
Projects, International Relations and
the Investor Support Center/ISC. The
Fundraising and Special Projects Units
coordinate the elaboration of studies
and projects, in partnership with several
city councils, with the aim of obtaining
funding and promoting the attainment of
external resources to the municipal
finances. The International Relations
Unit is responsible for providing support
to international actions of the Mayor’s
Office as well as other organs of the
Municipality of Porto Alegre. The fourth
unit is the Investor Support Center/ISC
The ISC was created with the
goal of being a municipal power support
arm to the private sector, more
specifically to entrepreneurs who invest
or want to invest in Porto Alegre.
Between its main activities it can be
emphasized the assistance to
companies in their decision-making
process relatively to the location of the
investment as well as the necessary
support for those companies installing
or already installed in the city.
If you are an investor, please
contact the Investor Support Center
(the data are on the next page). We will
be glad to work with your company and
to provide the necessary support for the
installment of your company in Porto
Alegre!.
Investor’s Guide – Chapter 07

70
Department of Fundraising and Investment Promotion Staff
Cláudio Gilberto Gandolfi Secretary
Luiz Carlos Tubino da Silva
Technical Supervisor
Diego Eugênio Pizetta Technical Adviser
Rodrigo de Souza Corradi
Technical Adviser
Trainees Alexandre Fogaça Damo
Bartira Koch Mattos Bruno Walber Viana
Gisele Grechi Luisa Bertuol Tatsch
Marcos Paulo da Silva Falleiro Saulo da Silva Marques
Wagner dos Santos Guterres
Investor Support Center 335, Giordano Bruno Street - Rio Branco
Phone: +55 51 3289 7314/ 3289 7304 E-mail: [email protected]
Fax: +55 51 3388 5798 Porto Alegre – Rio Grande do Sul – Brazil