guaranteed vs incentive pay - what's the right balance?
TRANSCRIPT
Guaranteed vs. Incentive Pay:
What’s the Right Balance?

Vision: Help You Become a Wealth Multiplier Organization
Transform the way you use compensation to share value with employees.
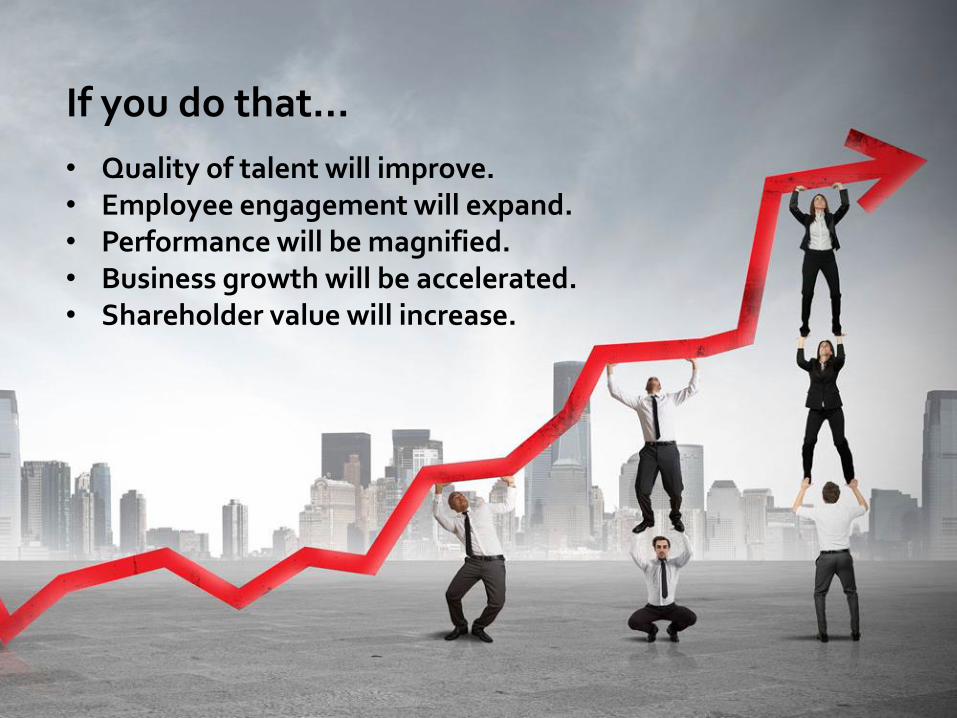
If you do that…
• Quality of talent will improve.• Employee engagement will expand.• Performance will be magnified.• Business growth will be accelerated.• Shareholder value will increase.
44
Governing Thought
Pay the least amount you can “get away with” to attract the best talent available and drive
the maximum performance possible.
55
Questions
Pay higher salaries and price out the competition?
Competitive salary but higher upside?
A blend of those approaches?
66
The Situation is the Boss

77
Technology Company
10 Years-Old Grown from $50 to $75 million in revenue over past three years Wants to grow to $125 million over next three years High Attrition Privately Owned
88
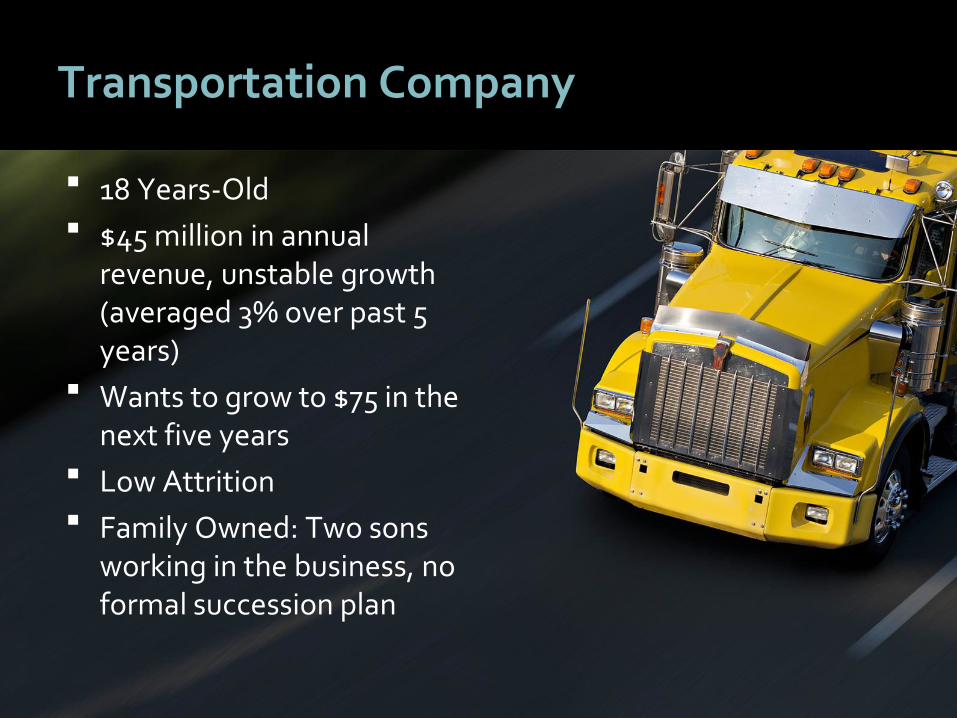
Transportation Company
18 Years-Old $45 million in annual
revenue, unstable growth (averaged 3% over past 5 years)
Wants to grow to $75 in the next five years
Low Attrition Family Owned: Two sons
working in the business, no formal succession plan
99
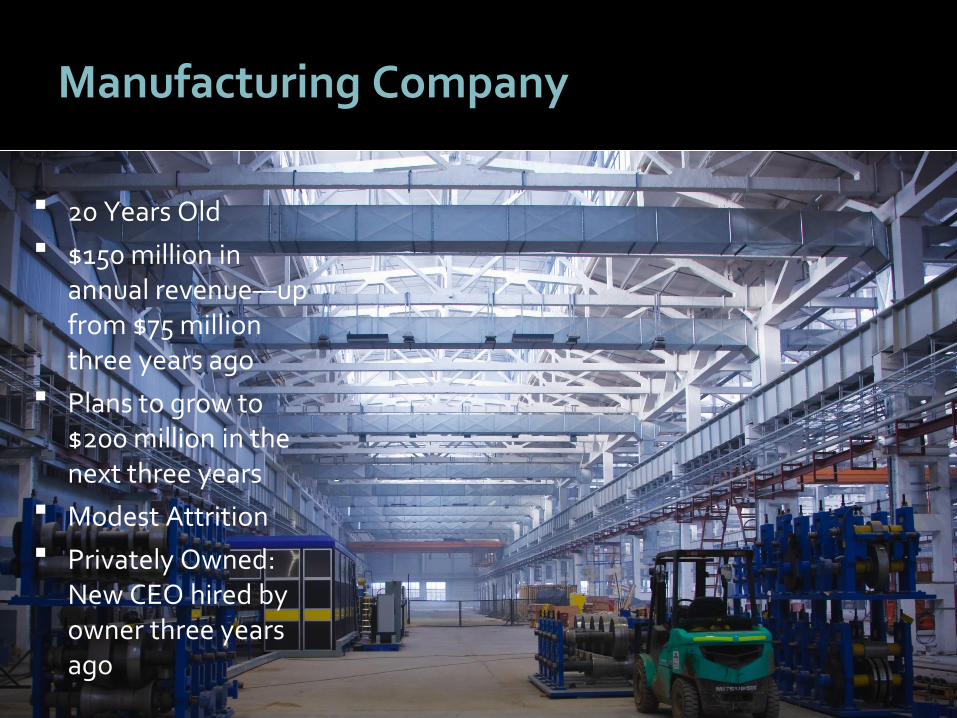
Manufacturing Company
20 Years Old $150 million in
annual revenue—up from $75 million three years ago
Plans to grow to $200 million in the next three years
Modest Attrition Privately Owned:
New CEO hired by owner three years ago
1010
Is There One Pay Formula for All Three?

1111
Balancing Pay: Five Key Practices
1. Define value creation.
2. Establish a clear pay philosophy.
3. Replace “incentives” with value sharing.
4. Focus on play plan alignment.
5. Build a Total Compensation Structure.
1212
1. Define Value Creation
Value attributable to the productivity
and performance of human capital.
1313
Case Study

1414
Keith Williams Assumed leadership of UL in 2005
Company carrying considerable debt
Losing market share
Low employee morale
UL had become bureaucratic and “siloed”
1515
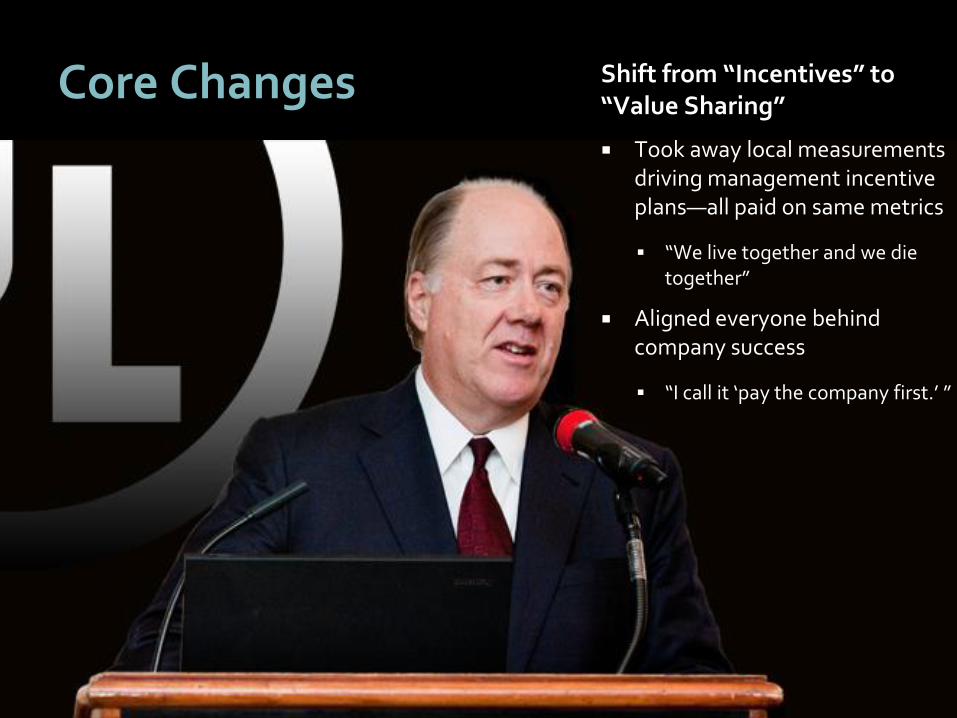
Core Changes Shift from “Incentives” to “Value Sharing”
Took away local measurements driving management incentive plans—all paid on same metrics
“We live together and we die together”
Aligned everyone behind company success
“I call it ‘pay the company first.’ ”
1616
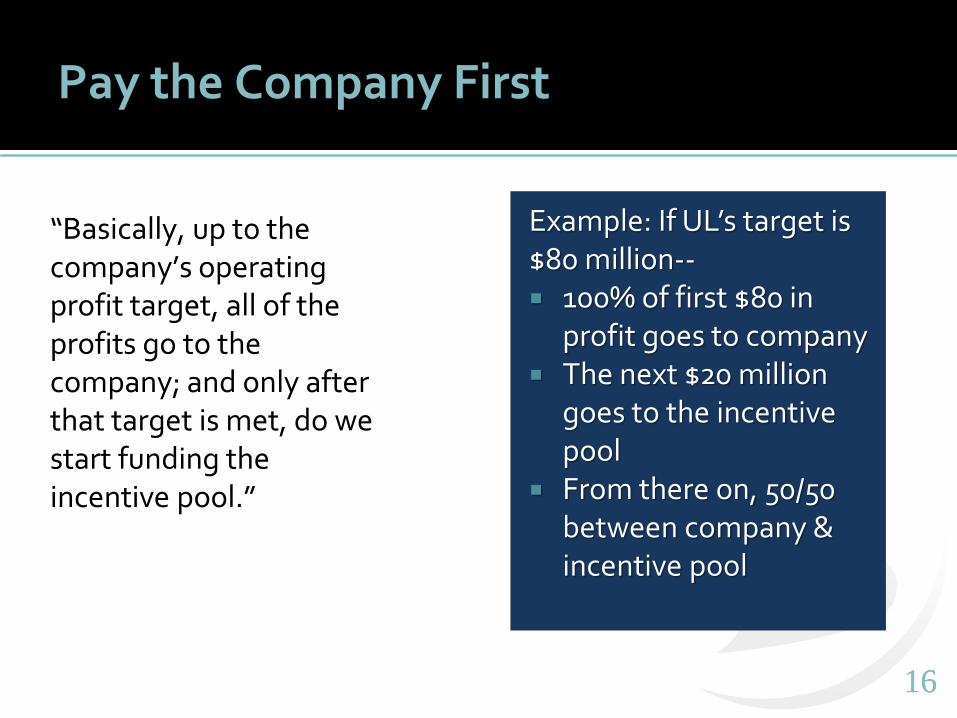
Pay the Company First
“Basically, up to the company’s operating profit target, all of the profits go to the company; and only after that target is met, do we start funding the incentive pool.”
Example: If UL’s target is $80 million-- 100% of first $80 in
profit goes to company The next $20 million
goes to the incentive pool
From there on, 50/50 between company & incentive pool

1717
Pay the Company First
Once value creation is defined, compensation can follow a formula for sharing value in a way that aligns key producers with the company’s business plan and priorities.
1818
2. Establish a Clear Pay Philosophy
A written statement of what the company is willing to “pay for.”
Tie it to value creation.
1919
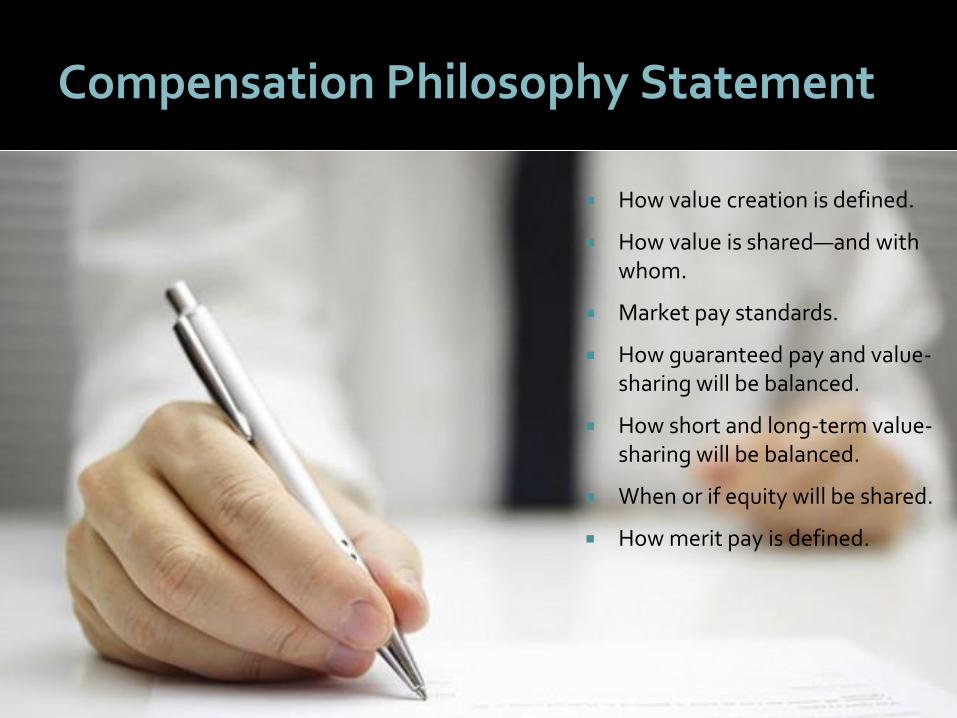
Compensation Philosophy Statement
How value creation is defined.
How value is shared—and with whom.
Market pay standards.
How guaranteed pay and value-sharing will be balanced.
How short and long-term value-sharing will be balanced.
When or if equity will be shared.
How merit pay is defined.
2020
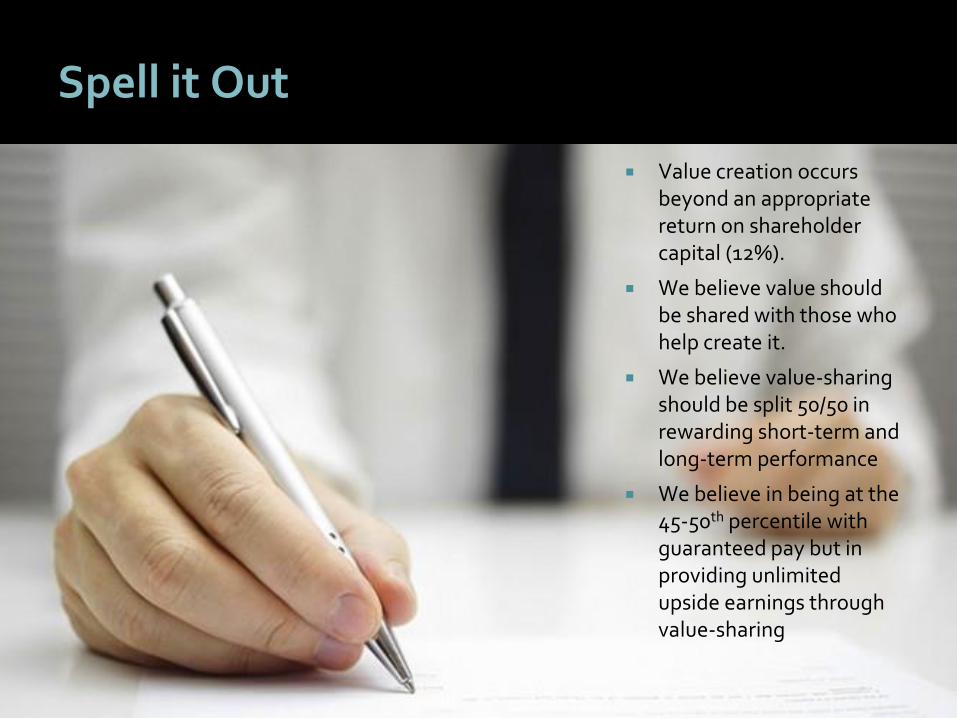
Spell it Out
Value creation occurs beyond an appropriate return on shareholder capital (12%).
We believe value should be shared with those who help create it.
We believe value-sharing should be split 50/50 in rewarding short-term and long-term performance
We believe in being at the 45-50th percentile with guaranteed pay but in providing unlimited upside earnings through value-sharing

2121
Old School
Defensive
Wealth Creation
Wealth Multiplier
21
Pay Philosophy Evolution
2222
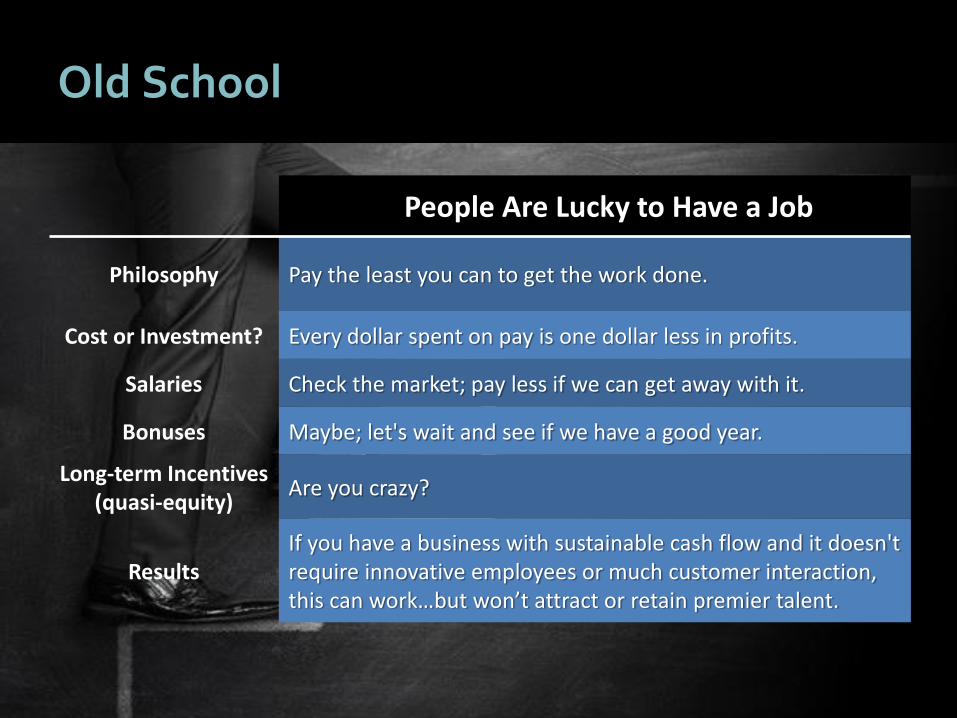
Old School
People Are Lucky to Have a Job
Philosophy Pay the least you can to get the work done.
Cost or Investment? Every dollar spent on pay is one dollar less in profits.
Salaries Check the market; pay less if we can get away with it.
Bonuses Maybe; let's wait and see if we have a good year.
Long-term Incentives (quasi-equity)
Are you crazy?
ResultsIf you have a business with sustainable cash flow and it doesn't require innovative employees or much customer interaction, this can work…but won’t attract or retain premier talent.
2323
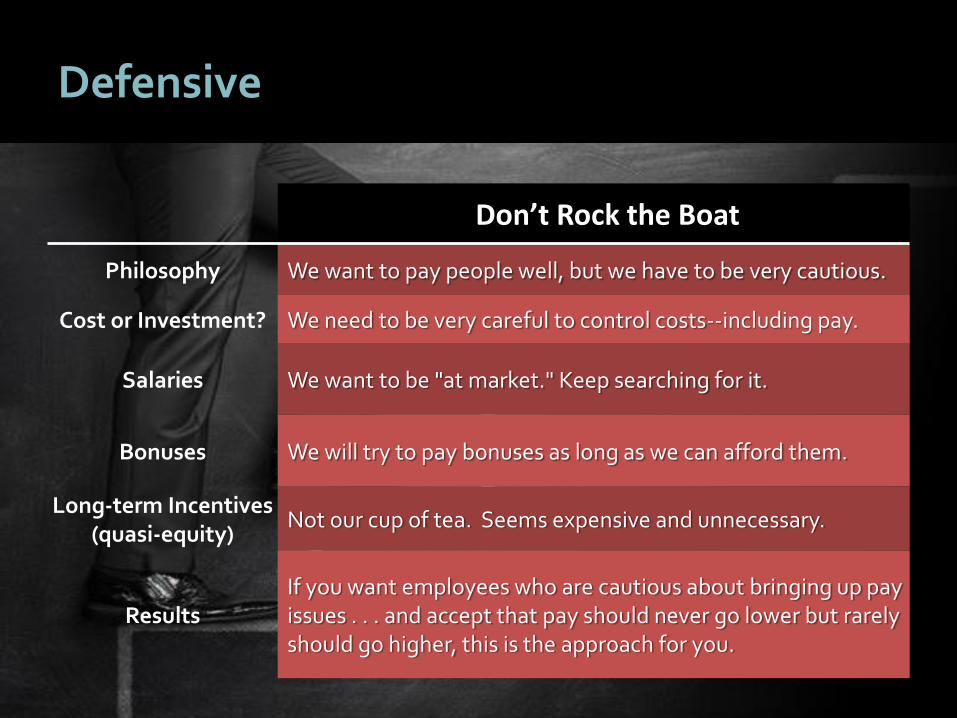
Defensive
Don’t Rock the Boat
Philosophy We want to pay people well, but we have to be very cautious.
Cost or Investment? We need to be very careful to control costs--including pay.
Salaries We want to be "at market." Keep searching for it.
Bonuses We will try to pay bonuses as long as we can afford them.
Long-term Incentives (quasi-equity)
Not our cup of tea. Seems expensive and unnecessary.
ResultsIf you want employees who are cautious about bringing up pay issues . . . and accept that pay should never go lower but rarely should go higher, this is the approach for you.
2424
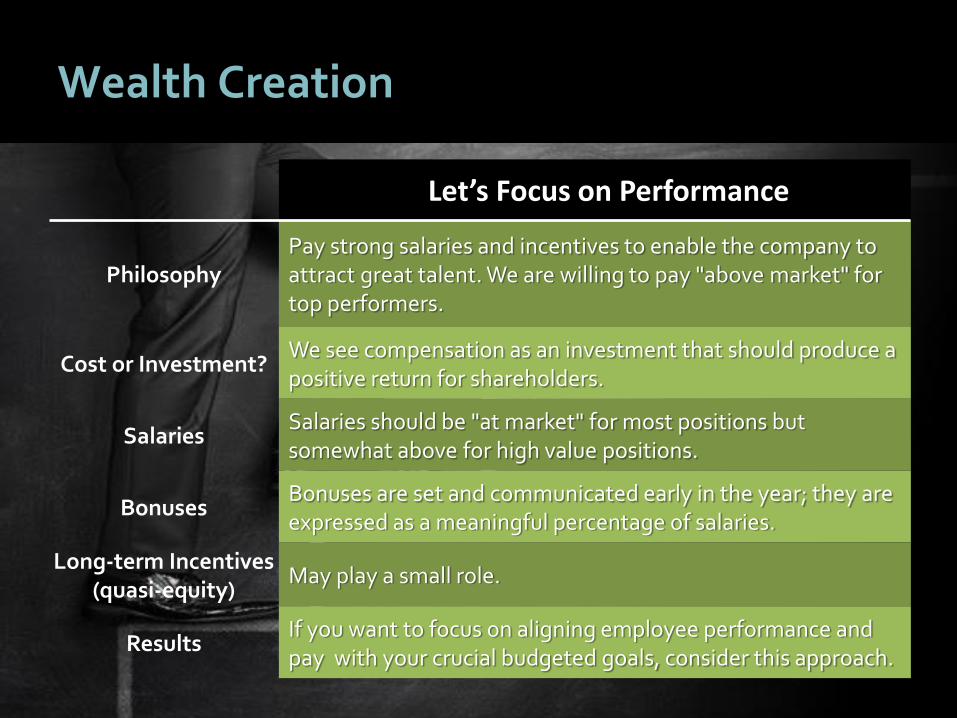
Wealth Creation
Let’s Focus on Performance
PhilosophyPay strong salaries and incentives to enable the company to attract great talent. We are willing to pay "above market" for top performers.
Cost or Investment?We see compensation as an investment that should produce a positive return for shareholders.
SalariesSalaries should be "at market" for most positions but somewhat above for high value positions.
BonusesBonuses are set and communicated early in the year; they are expressed as a meaningful percentage of salaries.
Long-term Incentives (quasi-equity)
May play a small role.
ResultsIf you want to focus on aligning employee performance and pay with your crucial budgeted goals, consider this approach.
2525
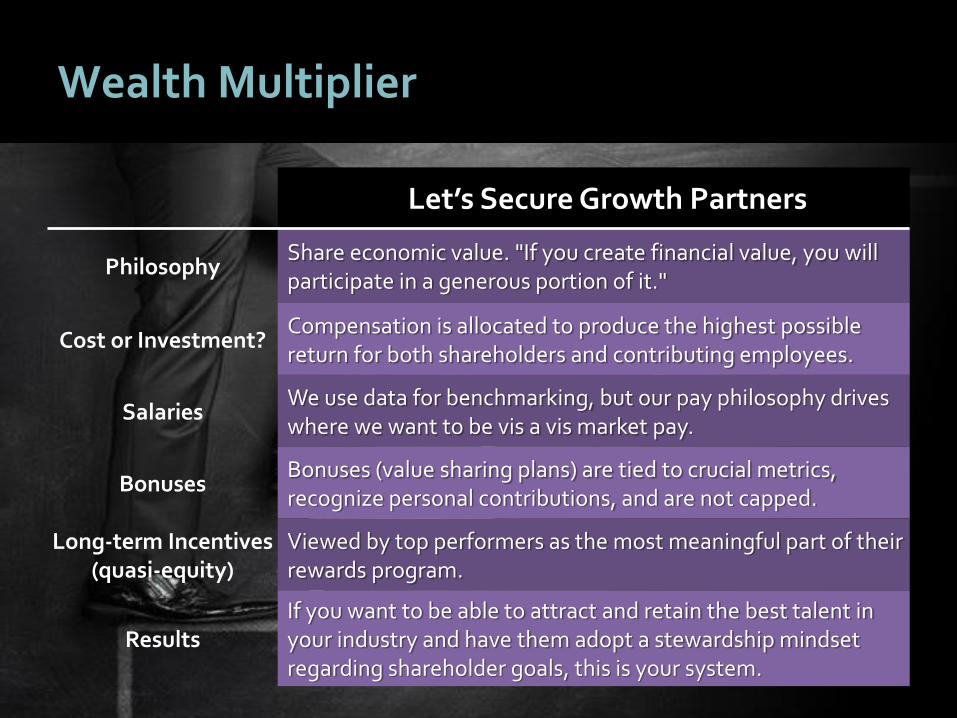
Wealth Multiplier
Let’s Secure Growth Partners
PhilosophyShare economic value. "If you create financial value, you will participate in a generous portion of it."
Cost or Investment?Compensation is allocated to produce the highest possible return for both shareholders and contributing employees.
SalariesWe use data for benchmarking, but our pay philosophy drives where we want to be vis a vis market pay.
BonusesBonuses (value sharing plans) are tied to crucial metrics, recognize personal contributions, and are not capped.
Long-term Incentives (quasi-equity)
Viewed by top performers as the most meaningful part of their rewards program.
ResultsIf you want to be able to attract and retain the best talent in your industry and have them adopt a stewardship mindset regarding shareholder goals, this is your system.
2626
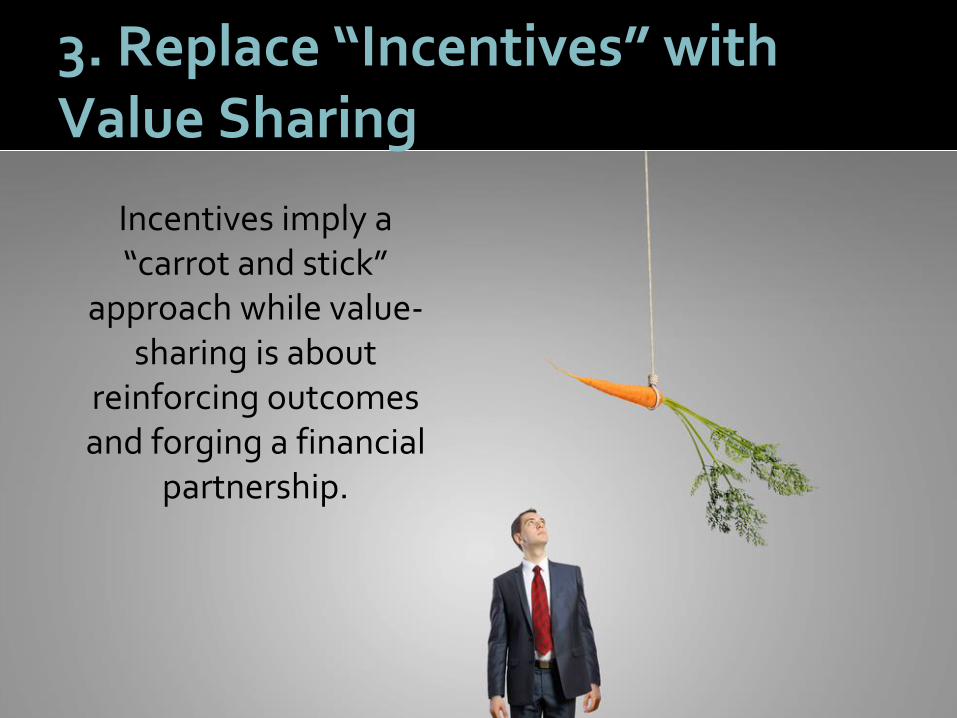
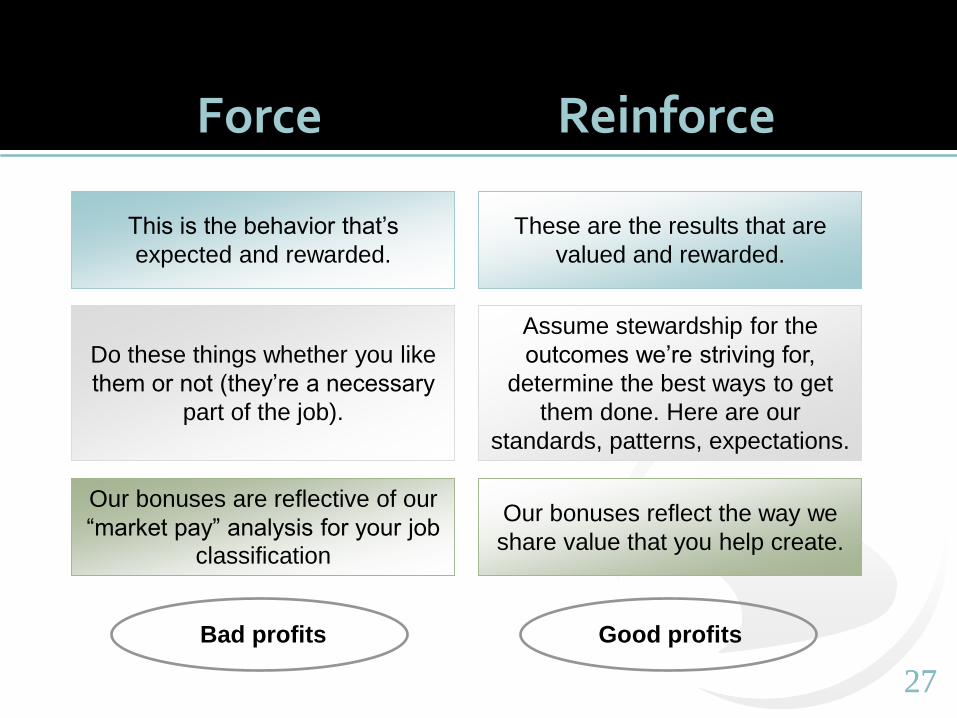
3. Replace “Incentives” with Value Sharing
Incentives imply a “carrot and stick”
approach while value-sharing is about
reinforcing outcomes and forging a financial
partnership.
2727
Force Reinforce
This is the behavior that’s
expected and rewarded.
These are the results that are
valued and rewarded.
Do these things whether you like
them or not (they’re a necessary
part of the job).
Assume stewardship for the
outcomes we’re striving for,
determine the best ways to get
them done. Here are our
standards, patterns, expectations.
Our bonuses are reflective of our
“market pay” analysis for your job
classification
Our bonuses reflect the way we
share value that you help create.
Bad profits Good profits
2828
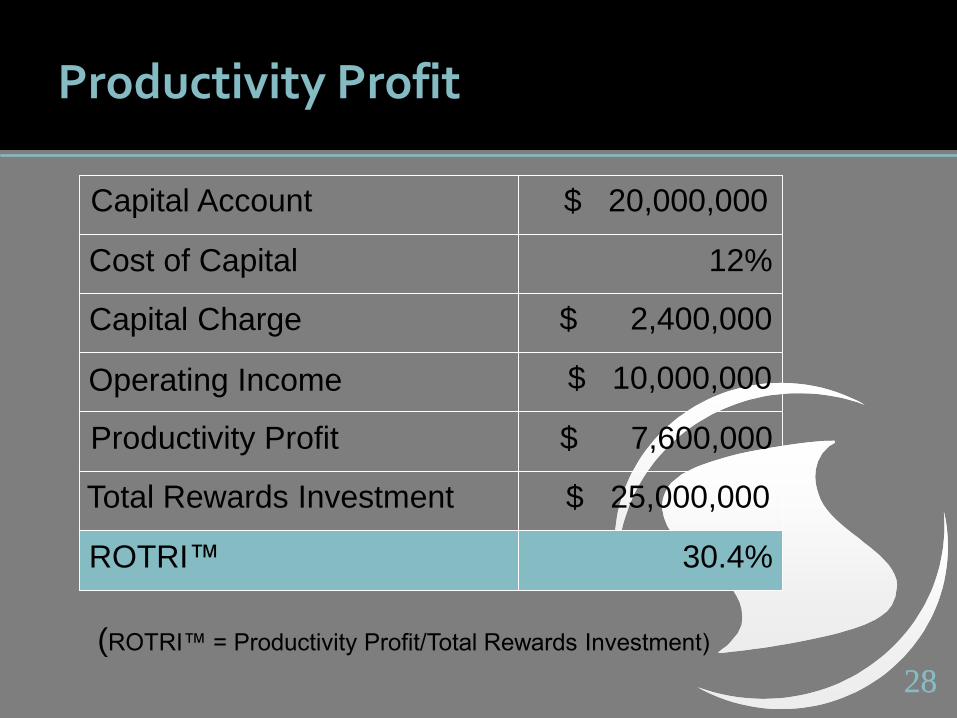
Productivity Profit
Capital Account
Cost of Capital
$ 20,000,000
ROTRI™
Total Rewards Investment
Operating Income
Capital Charge
Productivity Profit
30.4%
$ 25,000,000
$ 7,600,000
$ 10,000,000
12%
$ 2,400,000
(ROTRI™ = Productivity Profit/Total Rewards Investment)
2929
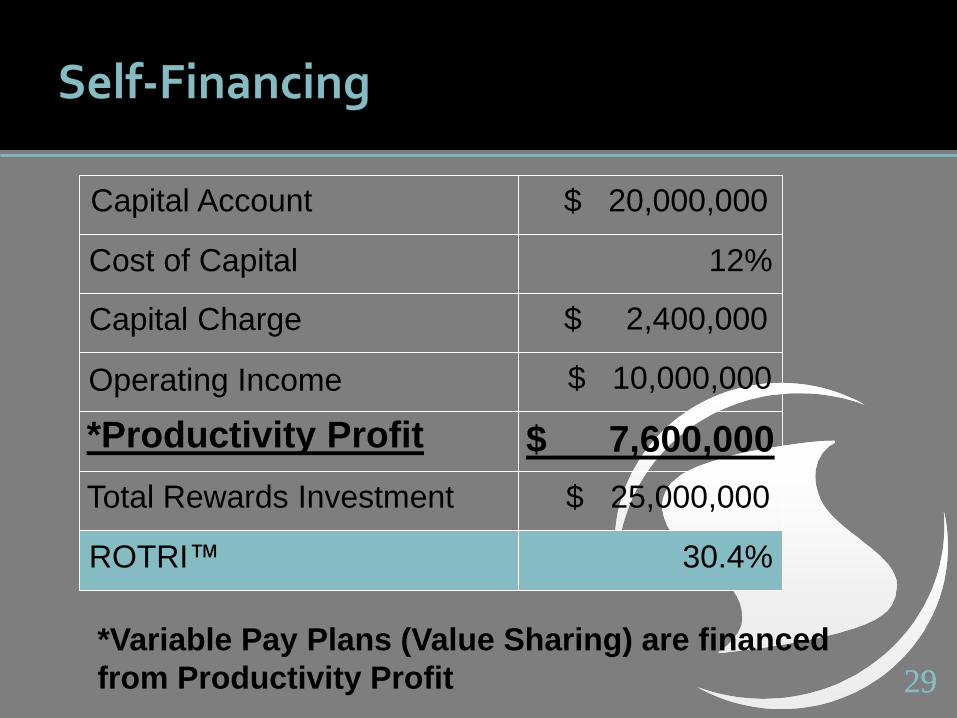
Self-Financing
Capital Account
Cost of Capital
$ 20,000,000
ROTRI™
Total Rewards Investment
Operating Income
Capital Charge
*Productivity Profit
30.4%
$ 25,000,000
$ 7,600,000
$ 10,000,000
12%
$ 2,400,000
*Variable Pay Plans (Value Sharing) are financed
from Productivity Profit
3030
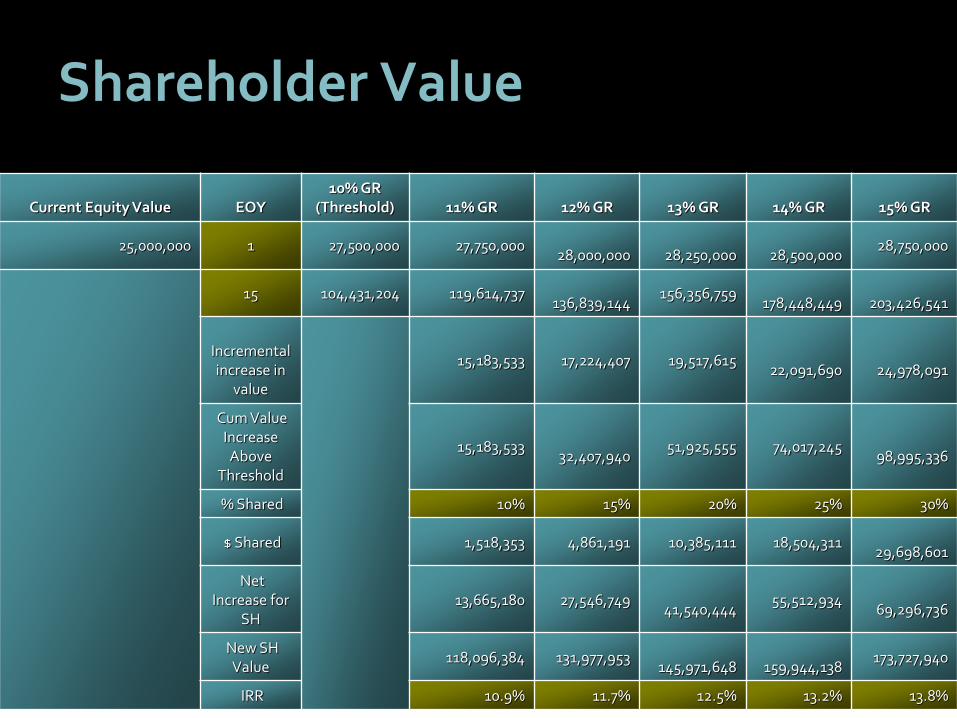
Shareholder Value
Current Equity Value EOY10% GR
(Threshold) 11% GR 12% GR 13% GR 14% GR 15% GR
25,000,000 1 27,500,000 27,750,000 28,000,000 28,250,000 28,500,000
28,750,000
15 104,431,204 119,614,737 136,839,144
156,356,759 178,448,449 203,426,541
Incremental increase in
value
15,183,533 17,224,407 19,517,615 22,091,690 24,978,091
Cum Value Increase Above
Threshold
15,183,533 32,407,940
51,925,555 74,017,245 98,995,336
% Shared 10% 15% 20% 25% 30%
$ Shared 1,518,353 4,861,191 10,385,111 18,504,311 29,698,601
Net Increase for
SH 13,665,180 27,546,749
41,540,444 55,512,934
69,296,736
New SH Value
118,096,384 131,977,953 145,971,648 159,944,138
173,727,940
IRR 10.9% 11.7% 12.5% 13.2% 13.8%
3131
Performance Incentives (Value Sharing)
3232
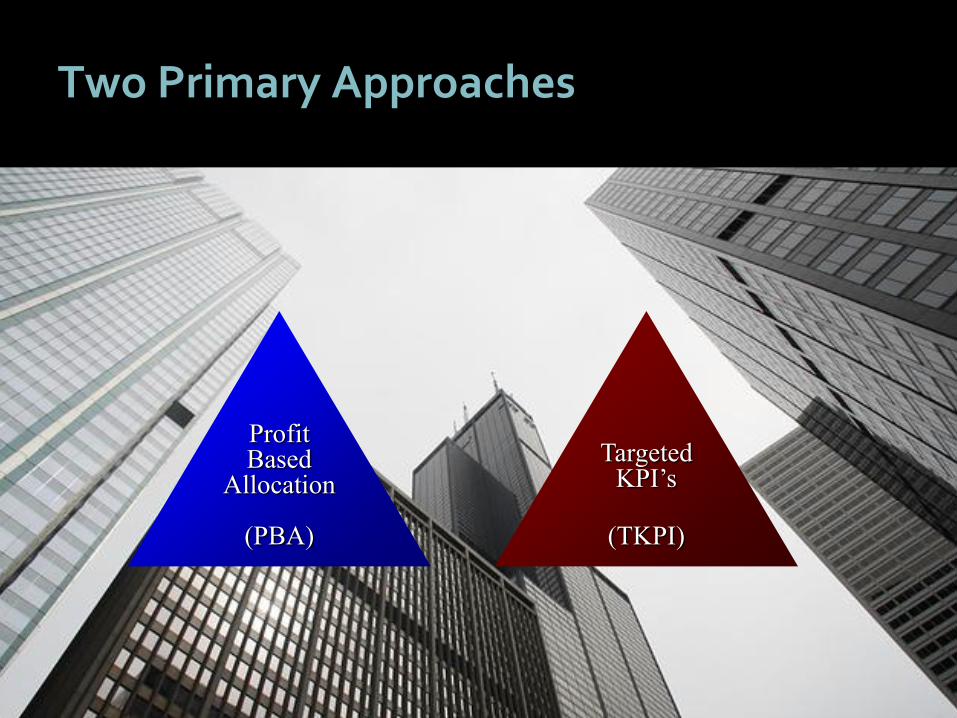
Two Primary Approaches
ProfitBased
Allocation
(PBA)
TargetedKPI’s
(TKPI)
33
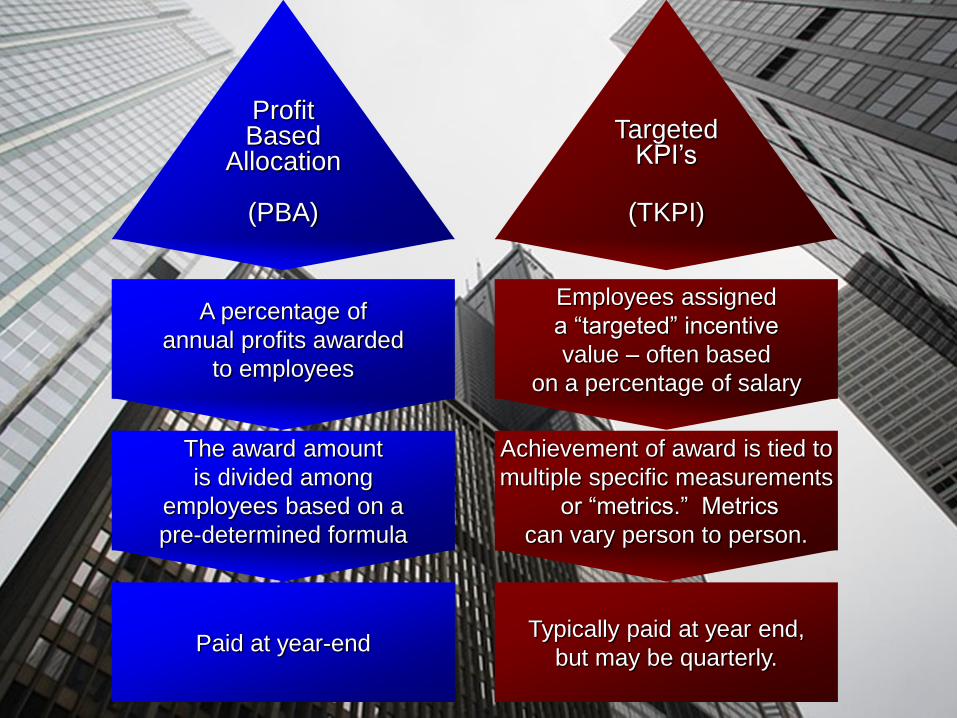
ProfitBased
Allocation
(PBA)
TargetedKPI’s
(TKPI)
A percentage of
annual profits awarded
to employees
The award amount
is divided among
employees based on a
pre-determined formula
Paid at year-end
Employees assigned
a “targeted” incentive
value – often based
on a percentage of salary
Achievement of award is tied to
multiple specific measurements
or “metrics.” Metrics
can vary person to person.
Typically paid at year end,
but may be quarterly.
3434
Growth Incentives (Value Sharing)
3535
Why Long-Term Value Sharing Matters
#1 Value sharing attracts and retains the best talent and magnifies results
3636
Why Long-Term Value Sharing Matters
#2: Value sharing plans reinforce the company’s business model
3737
Why Long-Term Value Sharing Matters
#3: Value sharing protects against bad profits and promotes good profits
3838
Why Long-Term Value Sharing Matters
#4: Value sharing promotes an ownership mindset
3939
Why Long-Term Value Sharing Matters
#5: Value sharing builds trust and accelerates results
4040
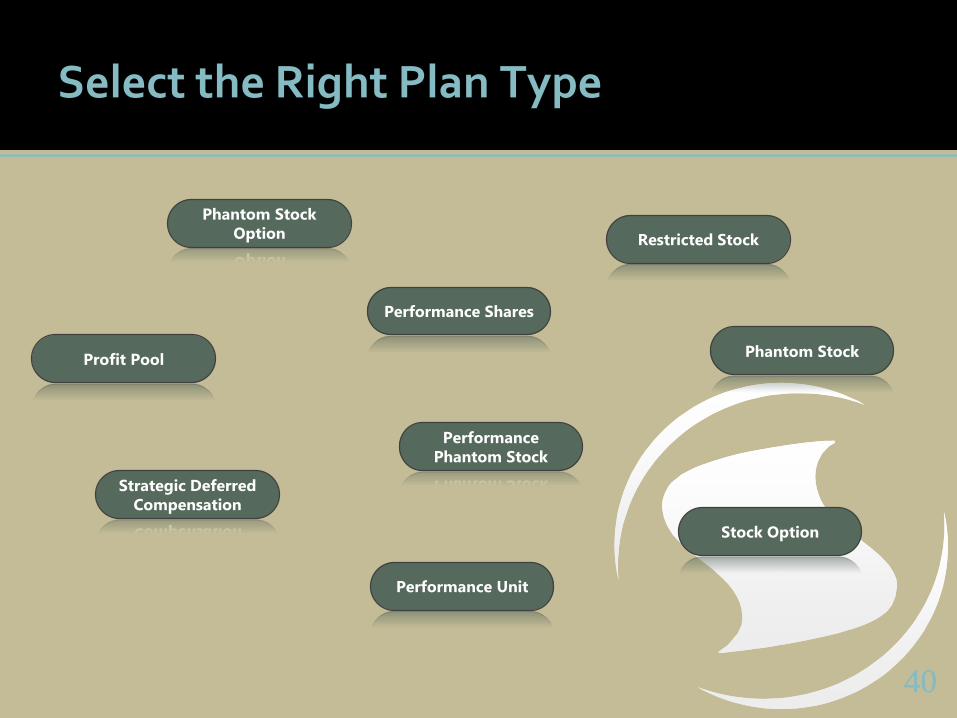
Select the Right Plan Type
Stock Option
Performance Shares
Restricted Stock
Phantom Stock
Option
Performance
Phantom Stock
Phantom StockProfit Pool
Performance Unit
Strategic Deferred
Compensation
4141
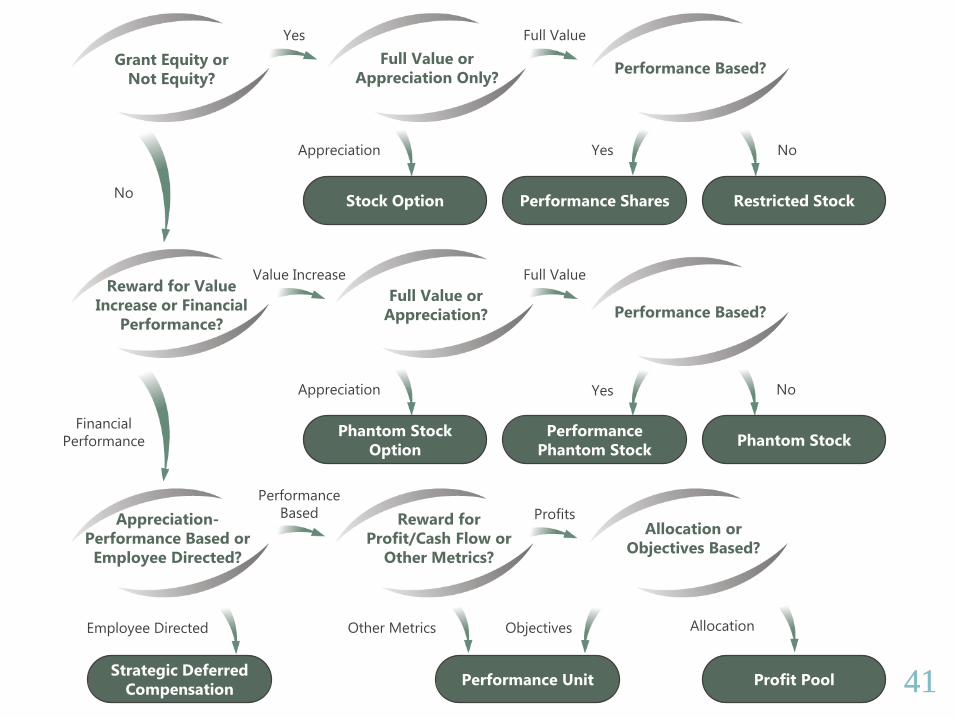
Grant Equity or
Not Equity?
Full Value or
Appreciation Only?
Yes
Appreciation
Stock Option
Full Value
Performance Based?
Yes
Performance Shares
No
Restricted StockNo
Reward for Value
Increase or Financial
Performance?
Value Increase
Full Value or
Appreciation?
Appreciation
Phantom Stock
Option
Full Value
Performance Based?
Yes
Performance
Phantom Stock
No
Phantom StockFinancial
Performance
Appreciation-
Performance Based or
Employee Directed?
Performance
Based Reward for
Profit/Cash Flow or
Other Metrics?
ProfitsAllocation or
Objectives Based?
Allocation
Profit Pool
ObjectivesOther Metrics
Performance Unit
Employee Directed
Strategic Deferred
Compensation
4242
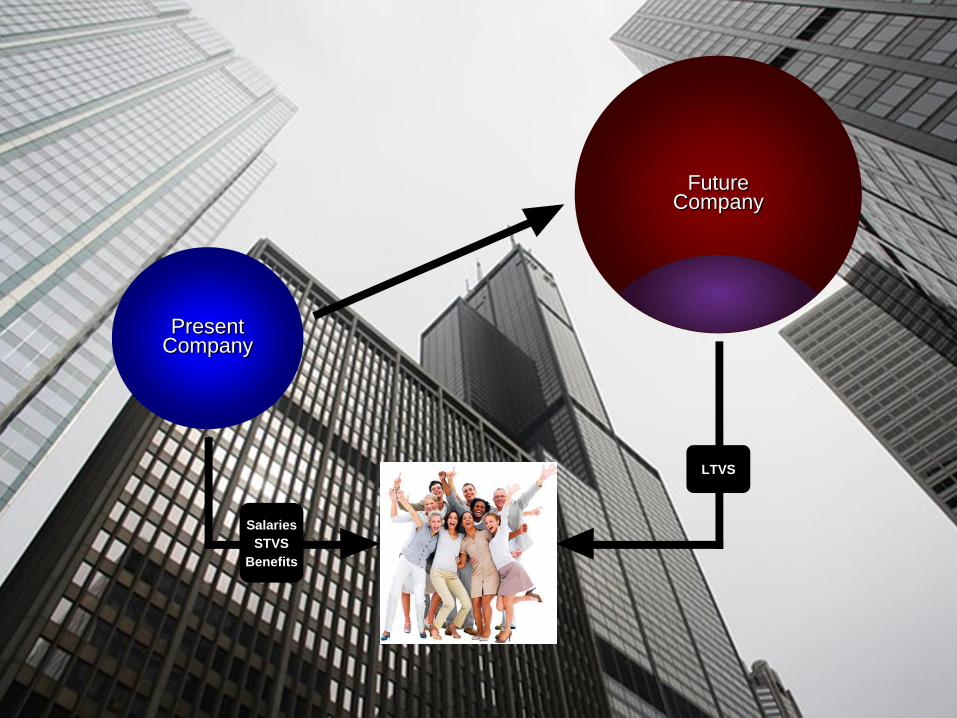
FutureCompany
PresentCompany
Salaries
STVS
Benefits
LTVS
4343
4. Focus on Pay Plan Alignment
Pay should create a unified financial vision for growing the business and turn employees into
growth partners.
4444
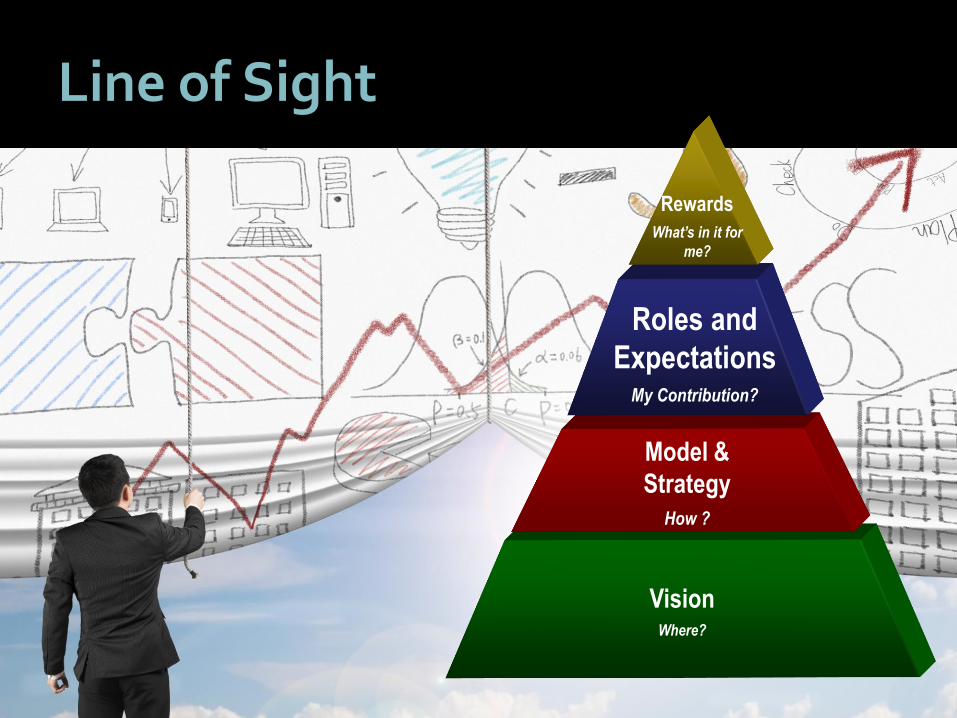
Line of Sight
Vision Where?
Model &
Strategy
How ?
Roles and
ExpectationsMy Contribution?
Rewards
What’s in it for
me?
4545
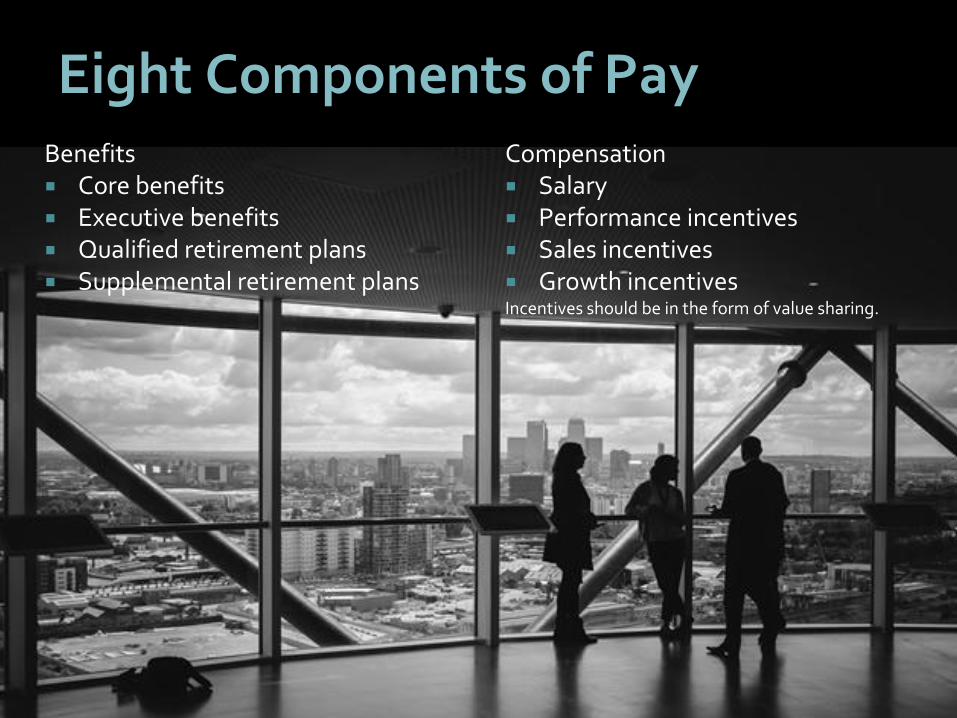
Eight Components of PayBenefits Core benefits Executive benefits Qualified retirement plans Supplemental retirement plans
Compensation Salary Performance incentives Sales incentives Growth incentivesIncentives should be in the form of value sharing.
4646
Salary
Performance Incentives
Sales Incentives
Growth Incentives
Core Health & Welfare
Plans
Executive Benefit Plans
Qualified Retirement
Plans
Nonqualified Retirement
Plans
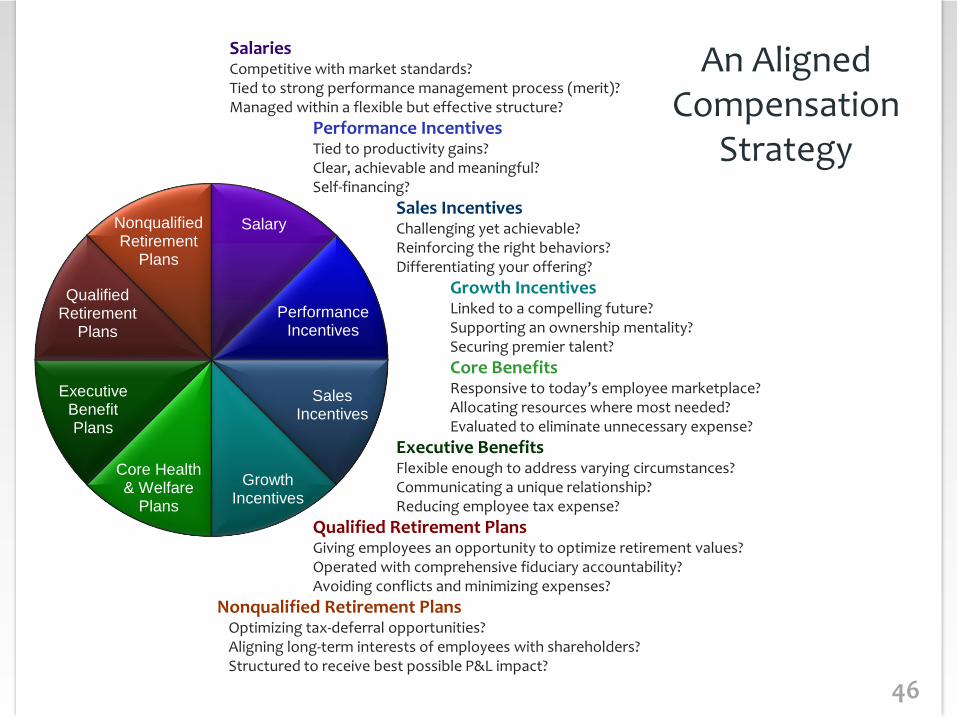
SalariesCompetitive with market standards?Tied to strong performance management process (merit)?Managed within a flexible but effective structure?
Performance IncentivesTied to productivity gains?Clear, achievable and meaningful?Self-financing?
Sales IncentivesChallenging yet achievable?Reinforcing the right behaviors?Differentiating your offering?
Growth IncentivesLinked to a compelling future?Supporting an ownership mentality?Securing premier talent?
Core BenefitsResponsive to today’s employee marketplace?Allocating resources where most needed?Evaluated to eliminate unnecessary expense?
Executive BenefitsFlexible enough to address varying circumstances?Communicating a unique relationship?Reducing employee tax expense?
Qualified Retirement PlansGiving employees an opportunity to optimize retirement values?Operated with comprehensive fiduciary accountability?Avoiding conflicts and minimizing expenses?
Nonqualified Retirement PlansOptimizing tax-deferral opportunities?Aligning long-term interests of employees with shareholders?Structured to receive best possible P&L impact?
An Aligned Compensation
Strategy
4747
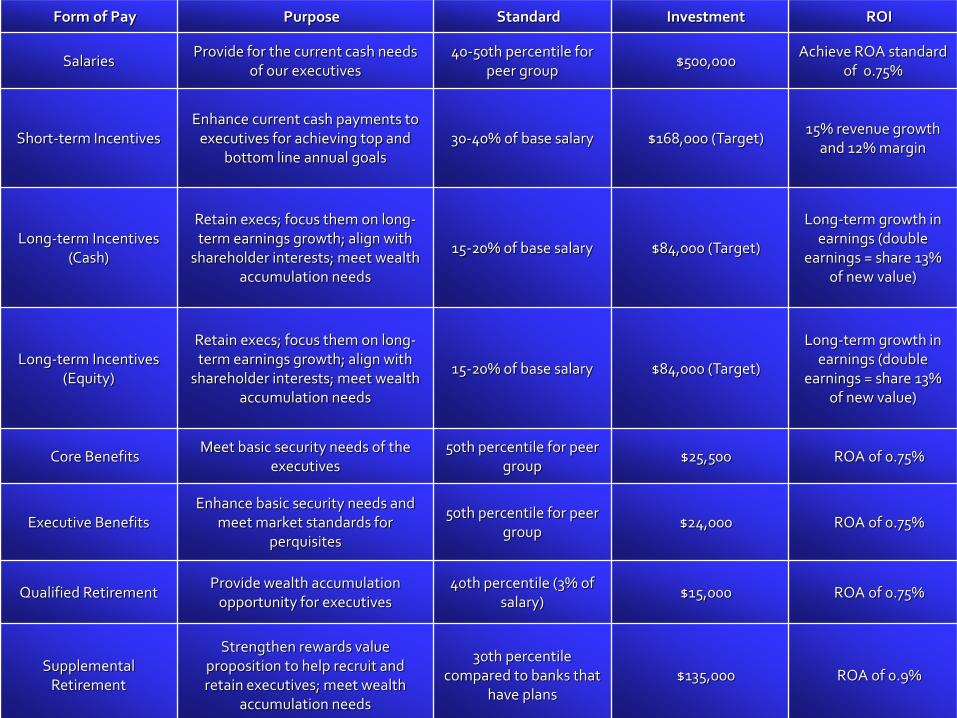
Form of Pay Purpose Standard Investment ROI
SalariesProvide for the current cash needs
of our executives40-50th percentile for
peer group$500,000
Achieve ROA standard of 0.75%
Short-term IncentivesEnhance current cash payments to
executives for achieving top and bottom line annual goals
30-40% of base salary $168,000 (Target)15% revenue growth
and 12% margin
Long-term Incentives (Cash)
Retain execs; focus them on long-term earnings growth; align with
shareholder interests; meet wealth accumulation needs
15-20% of base salary $84,000 (Target)
Long-term growth in earnings (double
earnings = share 13% of new value)
Long-term Incentives (Equity)
Retain execs; focus them on long-term earnings growth; align with
shareholder interests; meet wealth accumulation needs
15-20% of base salary $84,000 (Target)
Long-term growth in earnings (double
earnings = share 13% of new value)
Core BenefitsMeet basic security needs of the
executives50th percentile for peer
group$25,500 ROA of 0.75%
Executive BenefitsEnhance basic security needs and
meet market standards for perquisites
50th percentile for peer group
$24,000 ROA of 0.75%
Qualified RetirementProvide wealth accumulation
opportunity for executives40th percentile (3% of
salary)$15,000 ROA of 0.75%
Supplemental Retirement
Strengthen rewards value proposition to help recruit and retain executives; meet wealth
accumulation needs
30th percentile compared to banks that
have plans$135,000 ROA of 0.9%
4848
5. Build a Total Compensation Structure
A total compensation structure gives you a comprehensive view of all compensation and benefit plans and ensures operational integrity.
4949
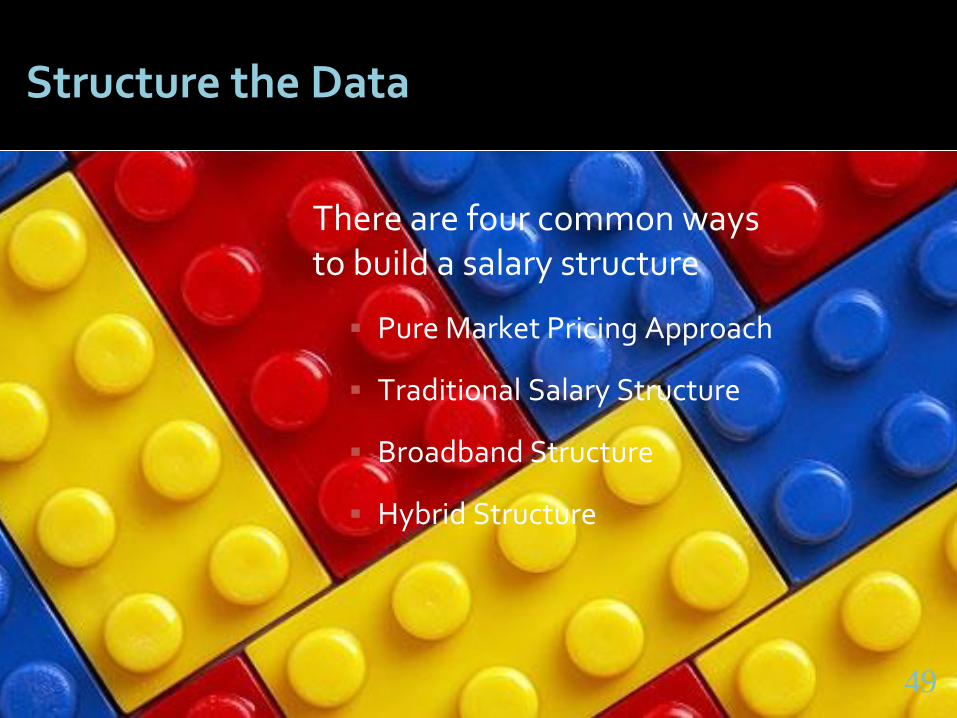
Structure the Data
There are four common ways to build a salary structure
Pure Market Pricing Approach
Traditional Salary Structure
Broadband Structure
Hybrid Structure
49
5050
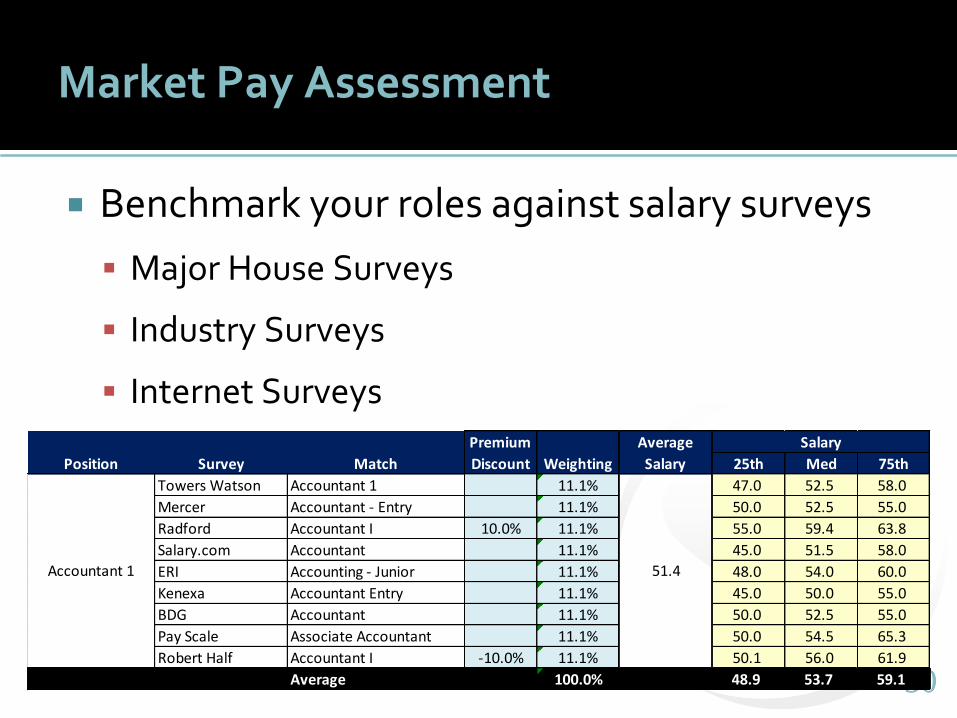
Market Pay Assessment
Benchmark your roles against salary surveys
Major House Surveys
Industry Surveys
Internet Surveys
25th Med 75th
Towers Watson Accountant 1 11.1% 47.0 52.5 58.0
Mercer Accountant - Entry 11.1% 50.0 52.5 55.0
Radford Accountant I 10.0% 11.1% 55.0 59.4 63.8
Salary.com Accountant 11.1% 45.0 51.5 58.0
ERI Accounting - Junior 11.1% 48.0 54.0 60.0
Kenexa Accountant Entry 11.1% 45.0 50.0 55.0
BDG Accountant 11.1% 50.0 52.5 55.0
Pay Scale Associate Accountant 11.1% 50.0 54.5 65.3
Robert Half Accountant I -10.0% 11.1% 50.1 56.0 61.9
Average 100.0% 48.9 53.7 59.1
Accountant 1 51.4
Position Survey Match
Average
Salary
SalaryPremium
Discount Weighting
5151
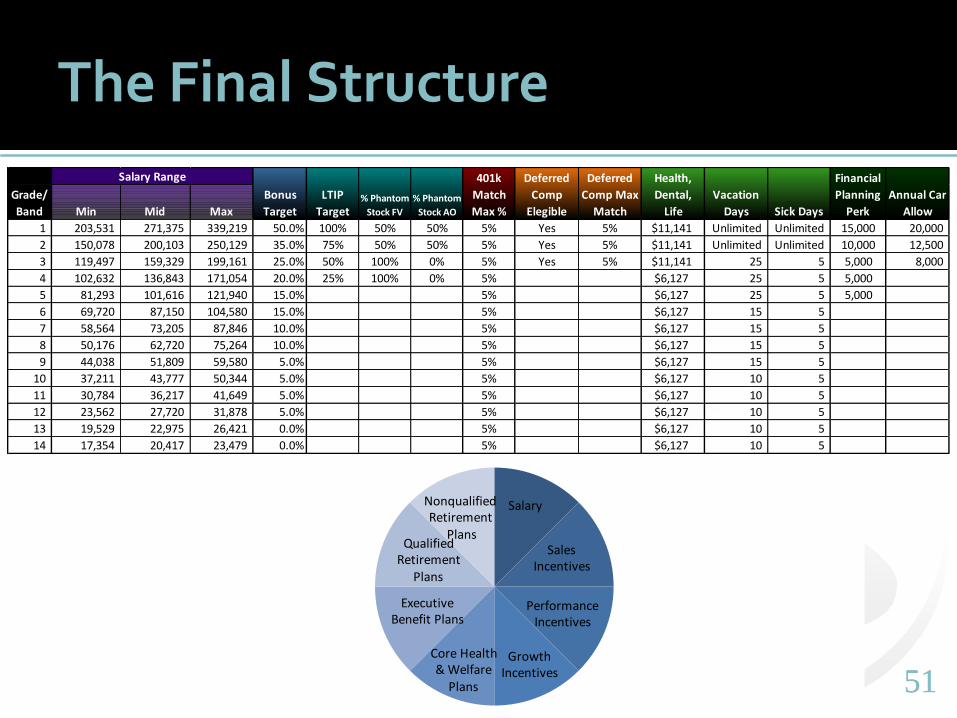
The Final Structure
Salary
SalesIncentives
PerformanceIncentives
GrowthIncentives
Core Health& Welfare
Plans
Executive Benefit Plans
Qualified Retirement
Plans
Nonqualified Retirement
Plans
Min Mid Max
1 203,531 271,375 339,219 50.0% 100% 50% 50% 5% Yes 5% $11,141 Unlimited Unlimited 15,000 20,000
2 150,078 200,103 250,129 35.0% 75% 50% 50% 5% Yes 5% $11,141 Unlimited Unlimited 10,000 12,500
3 119,497 159,329 199,161 25.0% 50% 100% 0% 5% Yes 5% $11,141 25 5 5,000 8,000
4 102,632 136,843 171,054 20.0% 25% 100% 0% 5% $6,127 25 5 5,000
5 81,293 101,616 121,940 15.0% 5% $6,127 25 5 5,000
6 69,720 87,150 104,580 15.0% 5% $6,127 15 5
7 58,564 73,205 87,846 10.0% 5% $6,127 15 5
8 50,176 62,720 75,264 10.0% 5% $6,127 15 5
9 44,038 51,809 59,580 5.0% 5% $6,127 15 5
10 37,211 43,777 50,344 5.0% 5% $6,127 10 5
11 30,784 36,217 41,649 5.0% 5% $6,127 10 5
12 23,562 27,720 31,878 5.0% 5% $6,127 10 5
13 19,529 22,975 26,421 0.0% 5% $6,127 10 5
14 17,354 20,417 23,479 0.0% 5% $6,127 10 5
Annual Car
Allow
Grade/
Band Sick Days
Salary Range
Bonus
Target
LTIP
Target
Financial
Planning
Perk
Deferred
Comp
Elegible
Deferred
Comp Max
Match
401k
Match
Max %
Vacation
Days% Phantom
Stock FV
% Phantom
Stock AO
Health,
Dental,
Life
5252
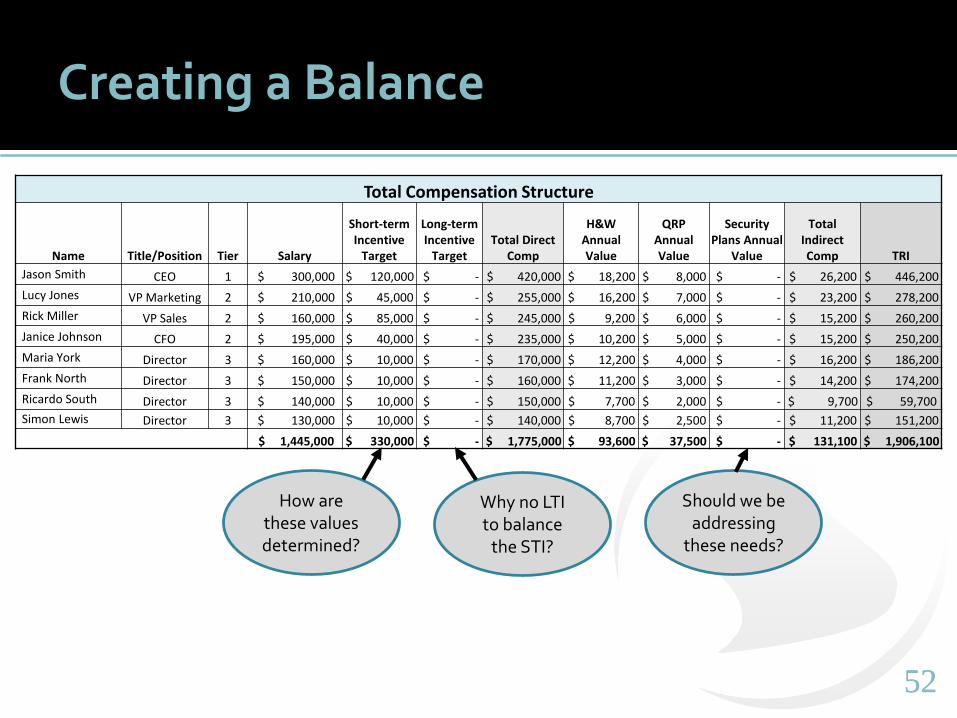
Creating a Balance
Total Compensation Structure
Name Title/Position Tier Salary
Short-term Incentive
Target
Long-term Incentive
TargetTotal Direct
Comp
H&W Annual Value
QRP Annual Value
Security Plans Annual
Value
Total Indirect Comp TRI
Jason Smith CEO 1 $ 300,000 $ 120,000 $ - $ 420,000 $ 18,200 $ 8,000 $ - $ 26,200 $ 446,200
Lucy Jones VP Marketing 2 $ 210,000 $ 45,000 $ - $ 255,000 $ 16,200 $ 7,000 $ - $ 23,200 $ 278,200
Rick Miller VP Sales 2 $ 160,000 $ 85,000 $ - $ 245,000 $ 9,200 $ 6,000 $ - $ 15,200 $ 260,200
Janice Johnson CFO 2 $ 195,000 $ 40,000 $ - $ 235,000 $ 10,200 $ 5,000 $ - $ 15,200 $ 250,200
Maria York Director 3 $ 160,000 $ 10,000 $ - $ 170,000 $ 12,200 $ 4,000 $ - $ 16,200 $ 186,200
Frank North Director 3 $ 150,000 $ 10,000 $ - $ 160,000 $ 11,200 $ 3,000 $ - $ 14,200 $ 174,200
Ricardo South Director 3 $ 140,000 $ 10,000 $ - $ 150,000 $ 7,700 $ 2,000 $ - $ 9,700 $ 59,700
Simon Lewis Director 3 $ 130,000 $ 10,000 $ - $ 140,000 $ 8,700 $ 2,500 $ - $ 11,200 $ 151,200
$ 1,445,000 $ 330,000 $ - $ 1,775,000 $ 93,600 $ 37,500 $ - $ 131,100 $ 1,906,100
How are these values determined?
Why no LTI to balance
the STI?
Should we be addressing
these needs?
5353
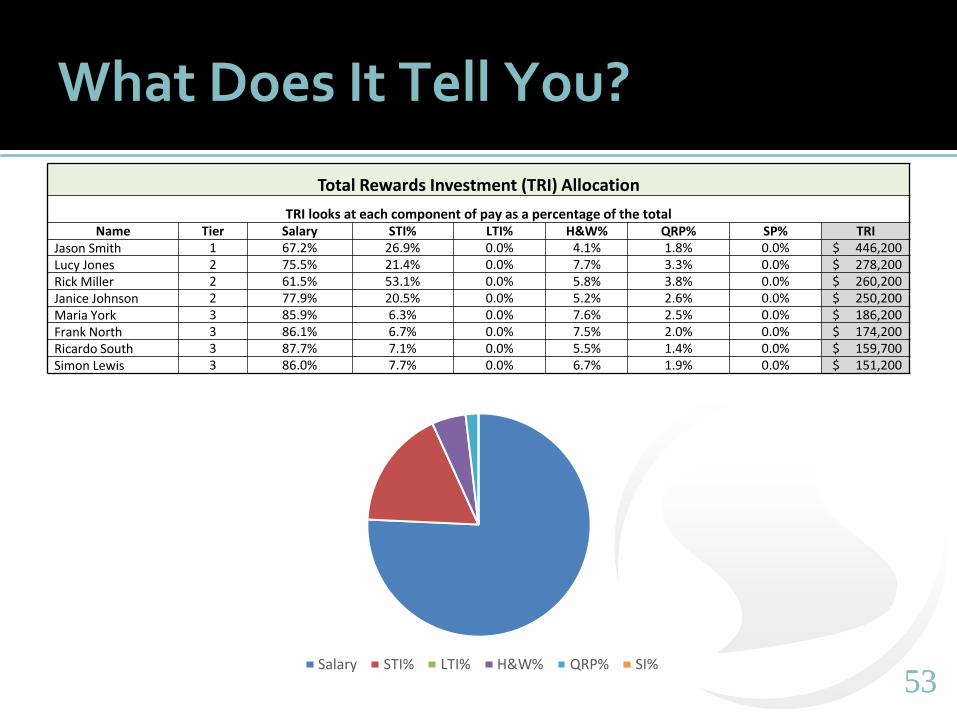
What Does It Tell You?
Total Rewards Investment (TRI) Allocation
TRI looks at each component of pay as a percentage of the totalName Tier Salary STI% LTI% H&W% QRP% SP% TRI
Jason Smith 1 67.2% 26.9% 0.0% 4.1% 1.8% 0.0% $ 446,200 Lucy Jones 2 75.5% 21.4% 0.0% 7.7% 3.3% 0.0% $ 278,200 Rick Miller 2 61.5% 53.1% 0.0% 5.8% 3.8% 0.0% $ 260,200 Janice Johnson 2 77.9% 20.5% 0.0% 5.2% 2.6% 0.0% $ 250,200 Maria York 3 85.9% 6.3% 0.0% 7.6% 2.5% 0.0% $ 186,200 Frank North 3 86.1% 6.7% 0.0% 7.5% 2.0% 0.0% $ 174,200 Ricardo South 3 87.7% 7.1% 0.0% 5.5% 1.4% 0.0% $ 159,700 Simon Lewis 3 86.0% 7.7% 0.0% 6.7% 1.9% 0.0% $ 151,200
Salary STI% LTI% H&W% QRP% SI%
5454
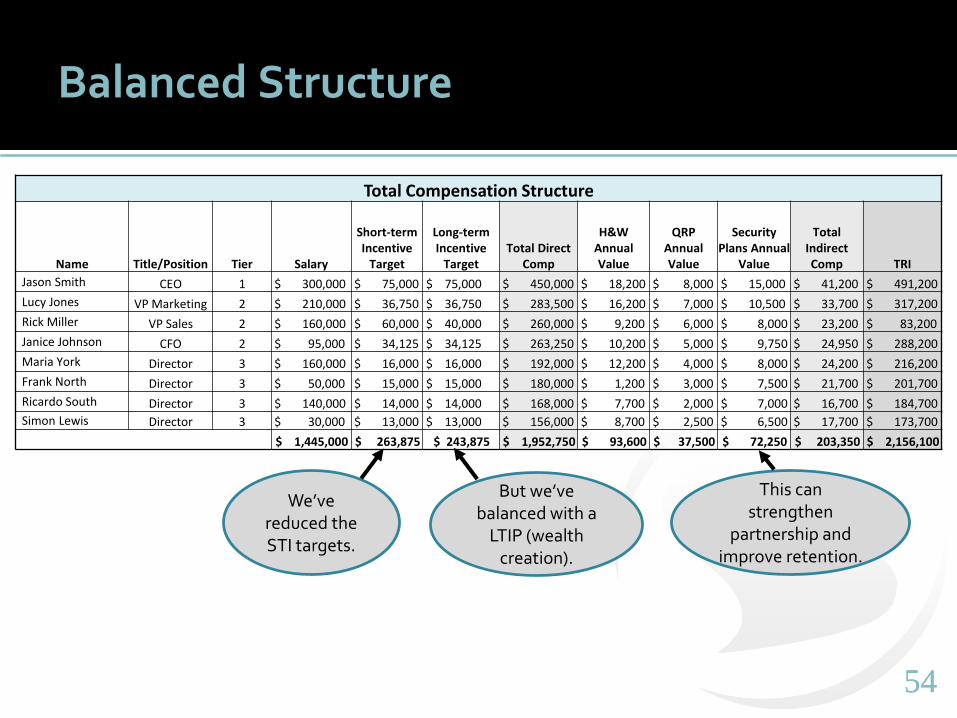
Balanced Structure
Total Compensation Structure
Name Title/Position Tier Salary
Short-term Incentive
Target
Long-term Incentive
TargetTotal Direct
Comp
H&W Annual Value
QRP Annual Value
SecurityPlans Annual
Value
Total Indirect Comp TRI
Jason Smith CEO 1 $ 300,000 $ 75,000 $ 75,000 $ 450,000 $ 18,200 $ 8,000 $ 15,000 $ 41,200 $ 491,200
Lucy Jones VP Marketing 2 $ 210,000 $ 36,750 $ 36,750 $ 283,500 $ 16,200 $ 7,000 $ 10,500 $ 33,700 $ 317,200
Rick Miller VP Sales 2 $ 160,000 $ 60,000 $ 40,000 $ 260,000 $ 9,200 $ 6,000 $ 8,000 $ 23,200 $ 83,200
Janice Johnson CFO 2 $ 95,000 $ 34,125 $ 34,125 $ 263,250 $ 10,200 $ 5,000 $ 9,750 $ 24,950 $ 288,200
Maria York Director 3 $ 160,000 $ 16,000 $ 16,000 $ 192,000 $ 12,200 $ 4,000 $ 8,000 $ 24,200 $ 216,200
Frank North Director 3 $ 50,000 $ 15,000 $ 15,000 $ 180,000 $ 1,200 $ 3,000 $ 7,500 $ 21,700 $ 201,700
Ricardo South Director 3 $ 140,000 $ 14,000 $ 14,000 $ 168,000 $ 7,700 $ 2,000 $ 7,000 $ 16,700 $ 184,700
Simon Lewis Director 3 $ 30,000 $ 13,000 $ 13,000 $ 156,000 $ 8,700 $ 2,500 $ 6,500 $ 17,700 $ 173,700
$ 1,445,000 $ 263,875 $ 243,875 $ 1,952,750 $ 93,600 $ 37,500 $ 72,250 $ 203,350 $ 2,156,100
We’ve reduced the STI targets.
But we’ve balanced with a
LTIP (wealth creation).
This can strengthen
partnership and improve retention.
5555
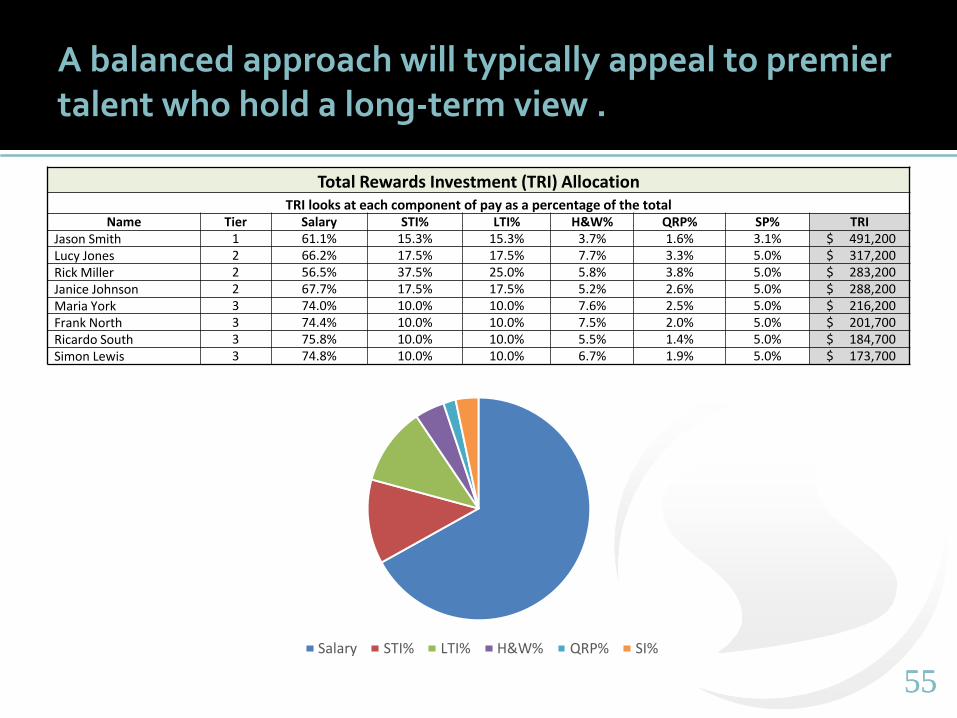
A balanced approach will typically appeal to premier talent who hold a long-term view .
Total Rewards Investment (TRI) AllocationTRI looks at each component of pay as a percentage of the total
Name Tier Salary STI% LTI% H&W% QRP% SP% TRIJason Smith 1 61.1% 15.3% 15.3% 3.7% 1.6% 3.1% $ 491,200 Lucy Jones 2 66.2% 17.5% 17.5% 7.7% 3.3% 5.0% $ 317,200 Rick Miller 2 56.5% 37.5% 25.0% 5.8% 3.8% 5.0% $ 283,200 Janice Johnson 2 67.7% 17.5% 17.5% 5.2% 2.6% 5.0% $ 288,200 Maria York 3 74.0% 10.0% 10.0% 7.6% 2.5% 5.0% $ 216,200 Frank North 3 74.4% 10.0% 10.0% 7.5% 2.0% 5.0% $ 201,700 Ricardo South 3 75.8% 10.0% 10.0% 5.5% 1.4% 5.0% $ 184,700 Simon Lewis 3 74.8% 10.0% 10.0% 6.7% 1.9% 5.0% $ 173,700
Salary STI% LTI% H&W% QRP% SI%
5656
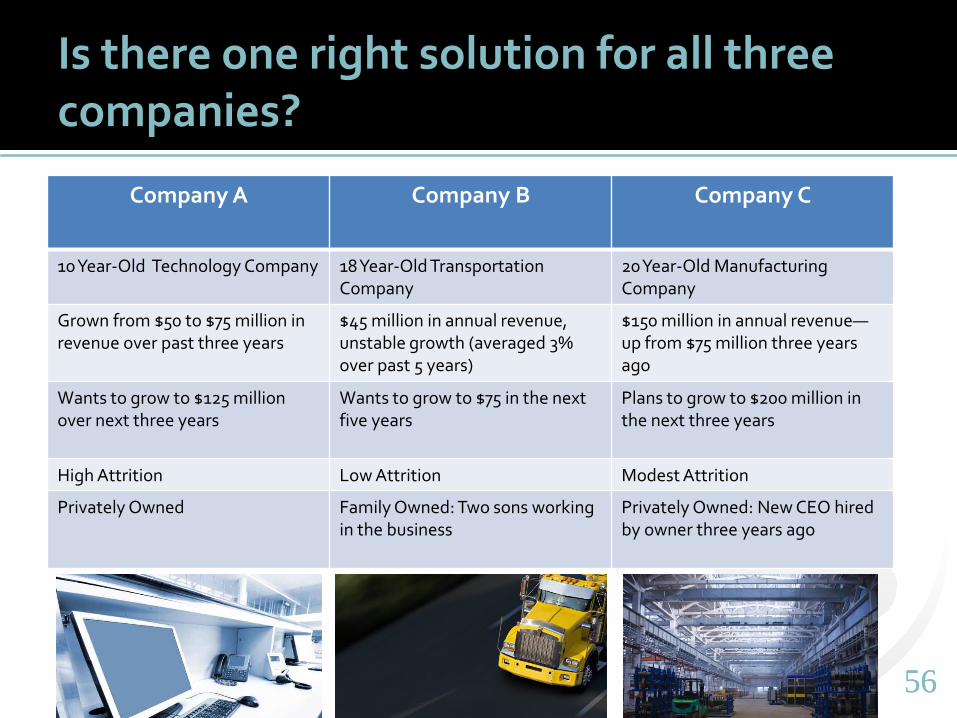
Is there one right solution for all three companies?
Company A Company B Company C
10 Year-Old Technology Company 18Year-Old Transportation Company
20 Year-Old Manufacturing Company
Grown from $50 to $75 million in revenue over past three years
$45 million in annual revenue, unstable growth (averaged 3% over past 5 years)
$150 million in annual revenue—up from $75 million three years ago
Wants to grow to $125 million over next three years
Wants to grow to $75 in the next five years
Plans to grow to $200 million in the next three years
High Attrition Low Attrition Modest Attrition
Privately Owned Family Owned: Two sons working in the business
Privately Owned: New CEO hired by owner three years ago
5757

5858
THANK YOU!(888) 703-0080
www.VLadvisors.comwww.PhantomStockOnline.com