guadalupe generating station application for psd ... · on behalf of guadalupe power partners lp,...
TRANSCRIPT


Environmental Consulting & Technology, Inc.
3701 Northwest 98th Street
Gainesville, FL 32606
(352) 332-0444
FAX (352) 332-6722
November 12, 2012 ECT No. 120468-0200
Mr. Jeff Robinson Chief, Air Permits Section U.S. Environmental Protection Agency, Region 6 Air Permits Section 6PD-R 1445 Ross Avenue Dallas, Texas 75202-2733
Re: Guadalupe Power Partners LP Guadalupe Generating Station; Guadalupe County, Marion, Texas
Dear SirlMadam:
On behalf of Guadalupe Power Partners LP, Environmental Consulting & Technology, Inc. (ECT), is submitting one copy of a greenhouse gas (GHG) Prevention of Significant Deterioration (PSD) permit application for the proposed construction and operation of two simple-cycle combustion turbines at the existing Guadalupe Generating Station located in Marion, Texas. We have also included a compact disc containing an electronic copy of the application as a searchable pdf file.
A copy of this GHG PSD permit application has also been sent to Texas Commission on Environmental Quality (TCEQ) headquarters in Austin, Texas, and the TCEQ regional office in San Antonio.
Since Guadalupe Power Partners LP has previously submitted a PSD permit application to TCEQ for applicable non-GHG pollutants, we would appreciate your expeditious review of this GHG PSD permit application. Please call me at 352/248-3313 if you have any questions regarding this submittal or if there is anything that we can do to expedite the review process.
Sincerely,
ENVIRONMENTAL CONSULTING & TECHNOLOGY, INC.
William F. Karl, P.E. Senior Engineer
WFKldim
cc: Texas Commission on Environmental Quality, Air Permits Division Texas Commission on Environmental Quality, San Antonio District Office F. Giacalone, GPP C. Morris, GPP W. Skinner, GPP J. Walsh, GPP
Y·IGDP· 12INAVASIGUADIWFKII12.DOCX.1
An Equal Opportunity/Affirmative Action Employer

GUADALUPE GENERATING STATION
PREVENTION OF SIGNIFICANT DETERIORATION PERMIT APPLICATION FOR
GREENHOUSE GAS EMISSIONS
Prepared for:
GUADALUPE POWER PARTNERS LP Marion, Texas
Prepared by:
3701 Northwest 98
th Street
Gainesville, Florida 32606
ECT No. 120468-0200
November 2012

i Y:\GDP-12\NAVAS\GUAD\GHG-PSD.DOCX—110512
TABLE OF CONTENTS Section Page
1.0 INTRODUCTION AND SUMMARY 1-1
1.1 INTRODUCTION 1-1 1.2 SUMMARY 1-2
2.0 DESCRIPTION OF THE PROPOSED FACILITY 2-1
2.1 PROJECT DESCRIPTION, AREA MAP, AND PLOT PLAN 2-1
2.2 PROCESS DESCRIPTION AND PROCESS FLOW DIAGRAM 2-1
2.3 ANNUAL GHG EMISSIONS 2-5
3.0 STATE AND FEDERAL REGULATORY REQUIREMENTS 3-1
3.1 STATE REQUIREMENTS 3-1 3.2 FEDERAL REQUIREMENTS 3-1 3.3 PSD APPLICABILITY 3-3 3.4 PSD REQUIREMENTS 3-3
3.4.1 AMBIENT AIR QUALITY AND IMPACT
ANALYSES 3-4 3.4.2 CONTROL TECHNOLOGY REVIEW 3-4
3.5 OTHER FEDERAL REQUIREMENTS 3-6
3.5.1 ENDANGERED SPECIES ACT 3-6 3.5.2 ENVIRONMENTAL JUSTICE 3-7
4.0 BACT FOR GREENHOUSE GASES 4-1
4.1 COMBUSTION TURBINES 4-2 4.1.1 STEP 1—IDENTIFY AVAILABLE CONTROL
TECHNOLOGIES 4-2 4.1.1.1 Combined-Cycle CT Power Plant 4-3 4.1.1.2 CT Energy Efficiency Design, Practices,
and Procedures 4-4 4.1.1.3 Plantwide Energy Efficiency Design,
Practices, and Procedures 4-6 4.1.1.4 Carbon Capture and Sequestration 4-7

ii Y:\GDP-12\NAVAS\GUAD\GHG-PSD.DOCX—110512
TABLE OF CONTENTS (Continued, Page 2 of 3)
Section Page
4.1.2 STEP 2—ELIMINATE TECHNICALLY
INFEASIBLE OPTIONS 4-8 4.1.2.1 Combined-Cycle CT Power Plant 4-8 4.1.2.2 CT Energy Efficiency Design, Practices,
and Procedures 4-10 4.1.2.3 Plantwide Energy Efficiency Design,
Practices, and Procedures 4-10 4.1.2.4 Carbon Capture And Sequestration 4-10
4.1.3 STEP 3—RANK REMAINING CONTROL
TECHNOLOGIES 4-11 4.1.4 STEP 4—EVALUATE MOST EFFECTIVE
CONTROLS AND DOCUMENT RESULTS 4-12 4.1.5 STEP 5—SELECT BACT 4-12
4.2 EMERGENCY FIREWATER PUMP 4-16
4.2.1 STEP 1—IDENTIFY AVAILABLE CONTROL
TECHNOLOGIES 4-16 4.2.2 STEP 2—ELIMINATE TECHNICALLY
INFEASIBLE OPTIONS 4-17 4.2.3 STEP 3—RANK REMAINING CONTROL
TECHNOLOGIES 4-17 4.2.4 STEP 4—EVALUATE MOST EFFECTIVE
CONTROLS AND DOCUMENT RESULTS 4-17 4.2.5 STEP 5—SELECT BACT 4-17
4.3 FUGITIVE GHG EMISSIONS FROM NATURAL GAS
PIPING COMPONENTS 4-18 4.4 SULFUR HEXAFLUORIDE 4-18 4.5 BACT DURING STARTUP AND SHUTDOWN 4-19

iii Y:\GDP-12\NAVAS\GUAD\GHG-PSD.DOCX—110512
TABLE OF CONTENTS (Continued, Page 3 of 3)
Section Page
5.0 OTHER IMPACTS 5-1
5.1 THREATENED AND ENDANGERED SPECIES 5-1 5.2 ENVIRONMENTAL JUSTICE 5-1
APPENDICES APPENDIX A—GENERAL APPLICATION APPENDIX B—EMISSIONS CALCULATIONS APPENDIX C—TEXAS PROFESSIONAL ENGINEER CERTI-
FICATION APPENDIX D—GUADALUPE COUNTY LIST OF RARE SPE-
CIES
iv Y:\GDP-12\NAVAS\GUAD\GHG-PSD.DOCX—110512
LIST OF TABLES Table Page 2-1 Summary of Annual GHG Emissions 2-6
4-1 Proposed GHG BACT Emissions Limits 4-14
4-2 Proposed Simple-Cycle Net Heat Rates 4-15
5-1 Population by Race—2010 5-3
5-2 Income and Poverty Level—2010 5-4
LIST OF FIGURES Figure Page 2-1 Site Location Map 2-2
2-2 Site Layout 2-3
2-3 Simplified Process Flow Diagram of a Basic Simple-Cycle CT 2-4

1-1 Y:\GDP-12\NAVAS\GUAD\GHG-PSD.DOCX—110512
1.0 INTRODUCTION AND SUMMARY
1.1 INTRODUCTION Guadalupe Power Partners LP (GPP) currently owns the Guadalupe Generating Station
(GGS) located in Guadalupe County, approximately 6 kilometers (km) north of Marion
and 45 km northeast of San Antonio, Texas. GGS currently consists of four natural gas-
fired, combined-cycle combustion turbine (CT) generator units capable of producing a
nominal 1,000 megawatts (MW) of electricity. GGS is operated by NAES Corporation.
GGS is currently a major stationary source of air emissions. This facility is permitted un-
der Air Quality Permit No. 38659, PSD-TX-922, and Title V Operating Permit O-02071.
GPP is proposing to construct two natural gas-fired simple-cycle CTs within the existing
GGS property. These units will be identified as CTG-7 and CTG-8. Since GGS is an ex-
isting major stationary source of air emissions, emissions from the proposed simple-cycle
CTs must be compared to the significant emissions rates as defined in Chapter 40,
Part 52.21(b)(23), Code of Federal Regulations (CFR), for all pollutants with the excep-
tion of greenhouse gas (GHG). Significant emissions rates for GHG emissions are listed
in 40 CFR 52.21(b)(49) under the definition of subject to regulation. Potential emissions
from the proposed natural gas-fired simple-cycle CTs will exceed the significant emis-
sions rates for certain pollutants, including GHG emissions. Therefore, the proposed nat-
ural gas-fired simple-cycle CTs will constitute a major modification for GHG emissions
as defined in 40 CFR 52.21(b)(2)(i).
The Texas Commission on Environmental Quality (TCEQ) has adopted the federal U.S.
Environmental Protection Agency (EPA) rules pertaining to prevention of significant de-
terioration (PSD) as contained in 40 CFR 52.21, by reference (see Chapter 30, Sec-
tion 116.160, Texas Administrative Code [TAC]) for all pollutants with the exception of
GHGs. EPA Region 6 has assumed the responsibility of issuing PSD permits for GHG
emissions for proposed facilities located in the state of Texas.
A PSD construction permit application was previously submitted to TCEQ on Septem-
ber 21, 2012, that addressed pollutants subject to PSD review with the exception of GHG

1-2 Y:\GDP-12\NAVAS\GUAD\GHG-PSD.DOCX—110512
emissions. An electronic copy of that PSD permit application for all non-GHG pollutants
was also provided to EPA Region 6. This PSD permit application, which addresses only
GHG emissions, is being submitted to EPA Region 6, because they are the regulatory au-
thority for issuance of GHG PSD permits in Texas. A copy of this GHG PSD permit ap-
plication is also being provided to TCEQ.
This report is organized as follows:
Section 1.2 provides a project overview and a summary of the key regulato-
ry determinations.
Section 2.0 describes the proposed facility and associated GHG emissions.
Section 3.0 describes state and federal regulatory requirements.
Section 4.0 provides an analysis of best available control technology
(BACT).
Section 5.0 provides a review of other impacts.
Appendix A provides the TCEQ Form PI-1, General Application for Air Preconstruction
Permit and Amendment, form. Appendix B contains the detailed GHG emissions calcula-
tions for the four CT manufacturer/model options. Appendix C presents the Texas profes-
sional engineer certification statement. Appendix D provides a current list of rare species
in Guadalupe County, Texas.
1.2 SUMMARY The proposed modification to GGS will consist of the addition of two F-class CTs operat-
ing in simple-cycle mode. At this time, GPP has not decided on the specific CT manufac-
turer or model number. The determination of the final CT manufacturer and model will
be based on a variety of factors including, but not limited to, capital cost, availability of
CTs to meet project schedule milestones, and consistency with the existing combined-
cycle CTs at GGS. The CTs will be either General Electric (GE) Model 7FA.03, 7FA.04,
or 7FA.05 or Siemens Westinghouse (SW) 5000F(5). GHG emissions for the four CT
manufacturer/model options have been calculated based on a maximum annual operating

1-3 Y:\GDP-12\NAVAS\GUAD\GHG-PSD.DOCX—110512
schedule of 2,500 hours per year (hr/yr) of operation. Appendix B presents detailed GHG
emissions calculations.
All four CT manufacturer/model options will exceed the PSD applicability threshold of
75,000 tons per year (tpy) for GHG emissions; therefore, a GHG BACT review will be
conducted for each of the four CT manufacturer/model options. The proposed modifica-
tion will also include one diesel-fired emergency firewater pump. The CTs will be fired
exclusively with pipeline-quality natural gas containing no more than 0.5 grain of total
sulfur per one hundred standard cubic feet (gr S/100 scf), and the emergency firewater
pump will be fueled exclusively with ultra-low sulfur diesel (ULSD).
As to project schedule, the key milestones are financial closure, start of construction, and
commercial operation. GPP will require financing for the addition of these two simple-
cycle CTs. The permits needed to start construction, including the PSD permit issued by
TCEQ for all non-GHG pollutants subject to PSD review and the GHG PSD permit is-
sued by EPA Region 6, must be in hand before financial closure can occur. To complete
the financing process and allow adequate time to conduct engineering studies prior to
starting construction, GPP will need to have both the non-GHG and GHG PSD permits
issued by September 2013. The planned construction start date for the addition of the two
simple-cycle CTs is October 2013. The projected date for the facility to begin commer-
cial operation is March 2014, following initial equipment startup and completion of re-
quired performance testing.
As presented in this report, the BACT analyses required for this air quality permit appli-
cation resulted in the following conclusions:
A combined-cycle CT was considered under the BACT review but was de-
termined to fundamentally redefine the nature of a natural gas-fired simple-
cycle peaker project.
There are no postcombustion control technologies for GHG emissions that
are technically feasible for a natural gas-fired simple-cycle CT facility. Car-
bon capture and sequestration (CCS) was considered as a potential control

1-4 Y:\GDP-12\NAVAS\GUAD\GHG-PSD.DOCX—110512
technology under the BACT review but was determined to be technically in-
feasible for the proposed natural gas-fired simple-cycle peaker project.
Energy efficient design and operation of the CTs and the emergency firewa-
ter pump was determined to be BACT for GHG emissions. GHG BACT
emissions limits for the CTs and emergency firewater pump will include an
annual GHG emissions limit in units of tpy. In addition, the GHG BACT
emissions limit for the CTs will also include a heat rate limit measured in
British thermal units per kilowatt-hour (Btu/kWh) for each of the four CT
manufacturer/model options.

2-1 Y:\GDP-12\NAVAS\GUAD\GHG-PSD.DOCX—110512
2.0 DESCRIPTION OF THE PROPOSED FACILITY
2.1 PROJECT DESCRIPTION, AREA MAP, AND PLOT PLAN GPP owns GGS, which is located in south-central Texas approximately 6 km north of
Marion and 45 km northeast of San Antonio, Texas. GGS currently consists of four natu-
ral gas-fired combined-cycle CT generator units capable of producing a nominal
1,000 MW of electricity. GPP proposes to construct two F-class simple-cycle CTs at
GGS. GPP has not selected the specific CT manufacturer or model and will select from
the following four CT options:
GE 7FA.03.
GE 7FA.04.
GE 7FA.05.
SW 5000F(5).
Figure 2-1 provides a site location map of GGS. The plant site is located in Guadalupe
County south of County Road (CR) 374, Weil Road, and east of CR 359. Figure 2-2 pro-
vides a site layout that shows the location of the two proposed simple-cycle CTs in rela-
tion to the existing four combined-cycle CTs. The location and configuration of the two
proposed simple-cycle CTs will not change based on the final selection of the specific CT
manufacturer and model.
GPP proposes to operate each of the simple-cycle CTs for a maximum of 2,500 hr/yr, and
annual GHG emissions will be calculated based on 2,500-hr/yr CT operation. GHG emis-
sions from the emergency firewater pump will be based on operating a maximum of
500 hr/yr based on EPA guidance for emergency engines. The emergency firewater pump
will be limited to 100 hr/yr of operation for maintenance and testing excluding emergen-
cy operation.
2.2 PROCESS DESCRIPTION AND PROCESS FLOW DIAGRAM Figure 2-3 presents a process flow diagram for the two simple-cycle CTs at GGS. De-
pending on the final selection of the CT manufacturer and model, the power block will
have the potential to generate between a nominal 383 MW of electricity (GE 7FA.03) and
a nominal 454 MW of electricity (SW 5000F[5]).
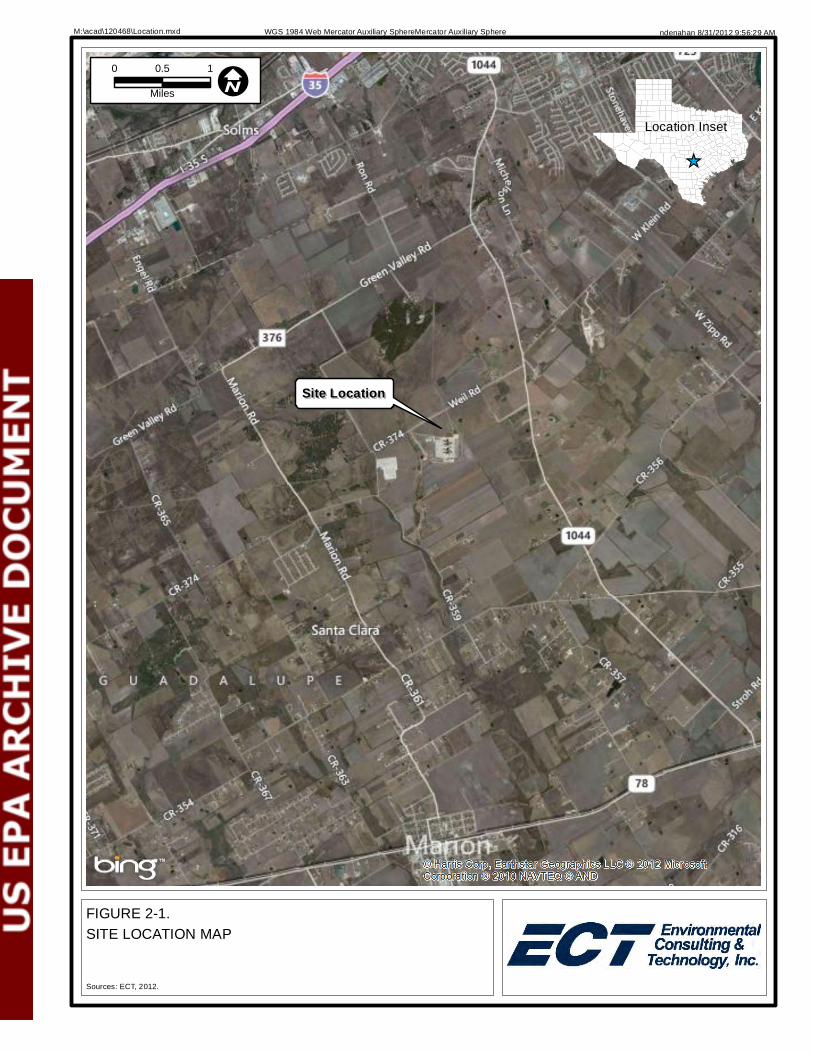
FIGURE 2-1.SITE LOCATION MAP
Sources: ECT, 2012.
M:\acad\120468\Location.mxd ndenahan 8/31/2012 9:56:29 AMWGS 1984 Web Mercator Auxiliary SphereMercator Auxiliary Sphere
I0 10.5
Miles
_̂
Location Inset
Site LocationSite Location
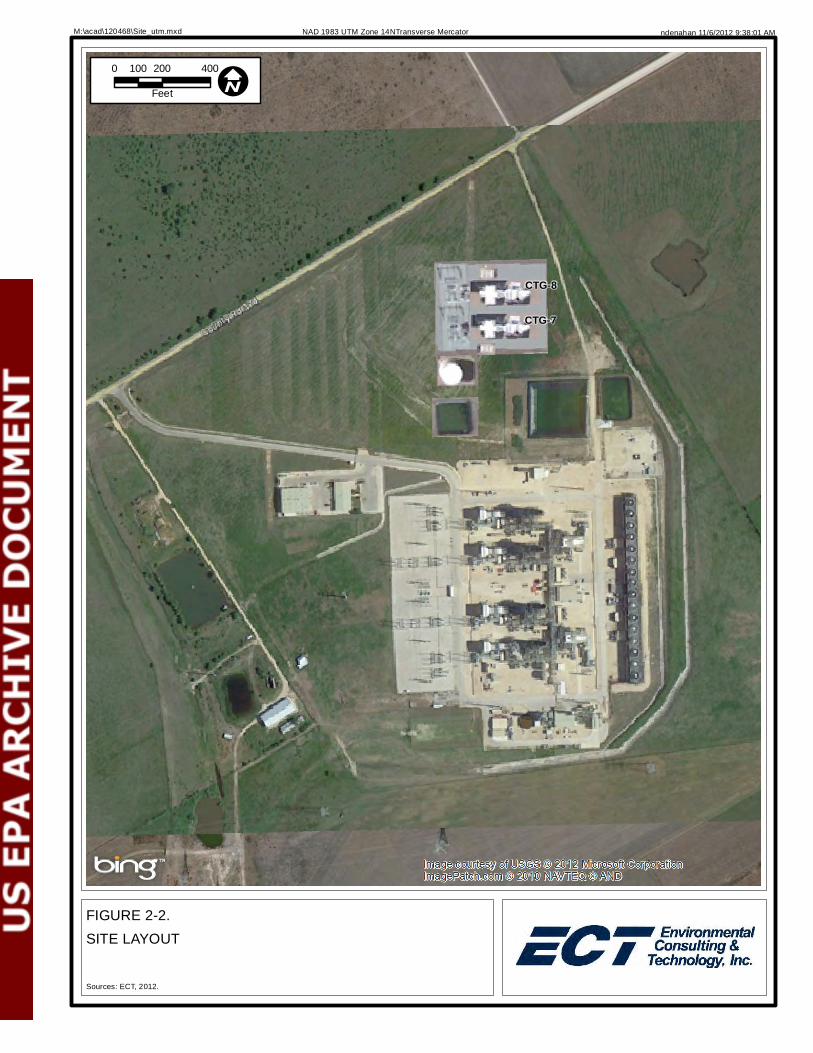
FIGURE 2-2.SITE LAYOUT
Sources: ECT, 2012.
M:\acad\120468\Site_utm.mxd ndenahan 11/6/2012 9:38:01 AMNAD 1983 UTM Zone 14NTransverse Mercator
I0 200 400100
Feet
CTG-7
CTG-8

M:\acad\120468\PFD.dwg Sep 17, 2012 - 4:56pm by ndenahan
FIGURE 2-3.
SIMPLIFIED PROCESS FLOW DIAGRAM OF A BASIC SIMPLE-CYCLE CT

2-5 Y:\GDP-12\NAVAS\GUAD\GHG-PSD.DOCX—110512
CTs are heat engines that convert latent fuel energy into work using compressed hot gas
as the working medium. CTs deliver mechanical output by means of a rotating shaft used
to drive an electrical generator, thereby converting a portion of the engine’s mechanical
output to electrical energy. Ambient air is first filtered and then compressed by the CT
compressor. The CT compressor increases the pressure of the combustion air stream and
also raises its temperature. During warm days (typically 60 degrees Fahrenheit [°F] or
greater), the turbine inlet ambient air can be cooled by evaporative cooling, thus provid-
ing denser air for combustion and improving the power output. In some cases, the tem-
perature of the natural gas fuel will be raised by the use of an electric fuel heater to pre-
vent condensation in the CT fuel system. The compressed combustion air is then com-
bined with the natural gas fuel and burned in the CT’s high-pressure combustor to pro-
duce hot exhaust gases. These high-pressure, hot gases next expand and turn the turbine
to produce rotary shaft power, which is used to drive an electric generator as well as the
CT air compressor. The CT exhaust gases will be discharged to the atmosphere after
passing through the turbine.
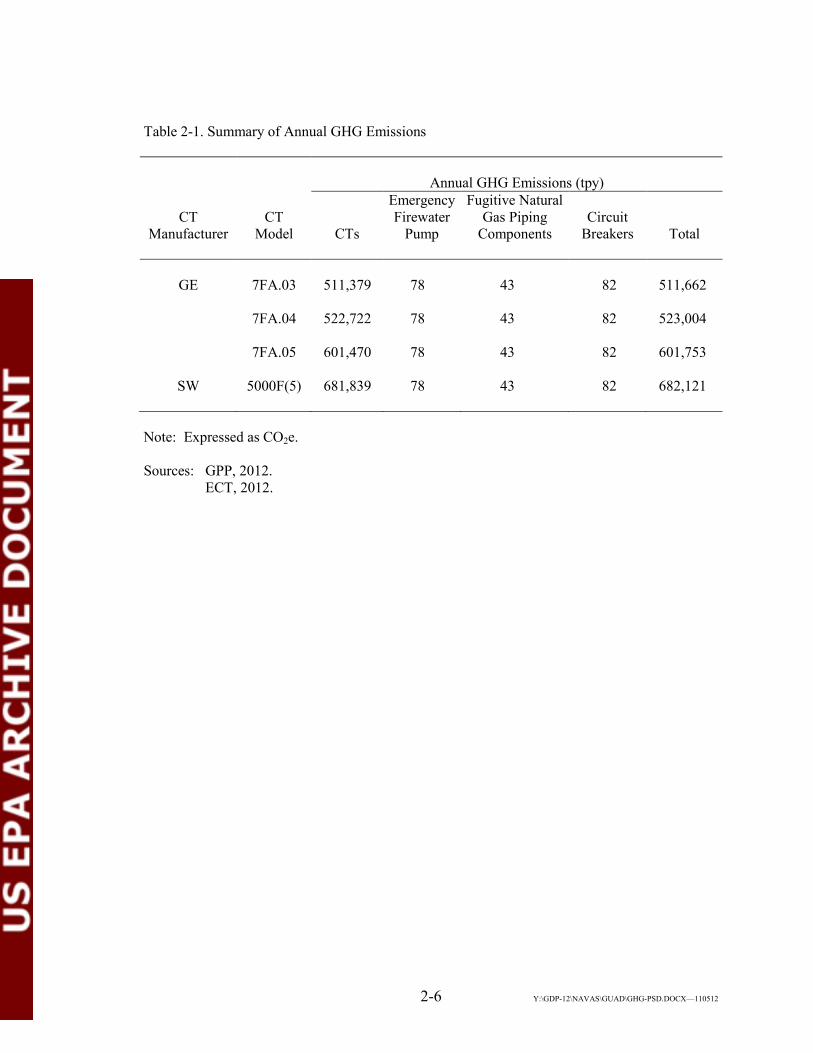
2.3 ANNUAL GHG EMISSIONS Table 2-1 presents the total annual GHG emissions, expressed as carbon dioxide equiva-
lent (CO2e), for the two proposed simple-cycle CTs for the two CT manufacturers and
four models. The annual GHG emissions total includes GHG emissions from the simple-
cycle CTs, GHG emission from the emergency firewater pump, fugitive GHG emissions
from the natural gas piping components, and GHG emissions from the circuit breakers.
Only those newly installed natural gas piping components and circuit breakers associated
with the installation of the two simple-cycle CTs are addressed in this application. Ap-
pendix B provides detailed GHG emissions calculations for the four CT manufactur-
er/model options.
2-6 Y:\GDP-12\NAVAS\GUAD\GHG-PSD.DOCX—110512
Table 2-1. Summary of Annual GHG Emissions
Annual GHG Emissions (tpy)
CT
Manufacturer
CT
Model
CTs
Emergency Firewater
Pump
Fugitive Natural Gas Piping
Components
Circuit
Breakers
Total
GE 7FA.03 511,379 78 43 82 511,662
7FA.04 522,722 78 43 82 523,004
7FA.05 601,470 78 43 82 601,753
SW 5000F(5) 681,839 78 43 82 682,121 Note: Expressed as CO2e. Sources: GPP, 2012. ECT, 2012.

3-1 Y:\GDP-12\NAVAS\GUAD\GHG-PSD.DOCX—110512
3.0 STATE AND FEDERAL REGULATORY REQUIREMENTS
3.1 STATE REQUIREMENTS TCEQ has not been delegated authority by EPA to issue air permits relating to GHG
emissions. Accordingly, there are currently no relevant Texas regulations that specifically
address GHG emissions.
3.2 FEDERAL REQUIREMENTS On June 3, 2010, EPA published a final rule (effective August 2, 2010) in the Chapter 75,
Part 106, of the Federal Register (FR), entitled Prevention of Significant Deterioration
and Title V Greenhouse Gas Tailoring Rule, commonly referred to as the Tailoring Rule.
For PSD/Title V purposes, GHGs are a single air pollutant defined as the aggregate group
of carbon dioxide (CO2), nitrous oxide (N2O), methane, hydrofluorocarbons (HFCs),
perfluorocarbons (PFCs), and sulfur hexafluoride (SF6). This final rule established specif-
ic applicability thresholds for GHG emissions for new major sources and modifications to
existing major sources under the PSD and Title V programs. This was necessary, since
applying the previous PSD and Title V applicability thresholds of 100 and 250 tpy to
GHG emissions would have resulted in a large number of relatively small sources becom-
ing subject to these regulatory programs.
On December 30, 2010, EPA promulgated a federal implementation plan (FIP) to provide
authority for regulations of GHGs in compliance with the Clean Air Act (CAA). This FIP
will apply in states, such as Texas, that do not have an approved SIP regulating GHGs or
that have not received EPA delegation to implement the federal GHG regulations. Since
TCEQ does not have authority to regulate GHGs, air permitting of GHG emissions for
the proposed two simple-cycle CTs at GGS is the responsibility of EPA Region 6.
Effective January 2, 2011, a new source or modification, i.e., a new major stationary
source for an NSR pollutant other than GHG, whose GHG emissions exceed 75,000 tpy
CO2e is subject to PSD review including a BACT analysis for GHG emissions. (CO2e
emissions are defined as the sum of the mass emissions of each individual GHG adjusted
for its respective global warming potential using Table A-1 of the Greenhouse Gas Re-
3-2 Y:\GDP-12\NAVAS\GUAD\GHG-PSD.DOCX—110512
porting Program [40 CFR 98, Subpart A]). Effective July 1, 2011, in addition to this ma-
jor stationary source applicability criterion, any new stationary source that emits more
than 100,000 tpy CO2e or existing source that has the potential to emit 100,000 tpy CO2e
or greater and commences a modification that results in an emissions increase of
75,000 tpy CO2e or greater is subject to PSD and Title V programs for GHG.
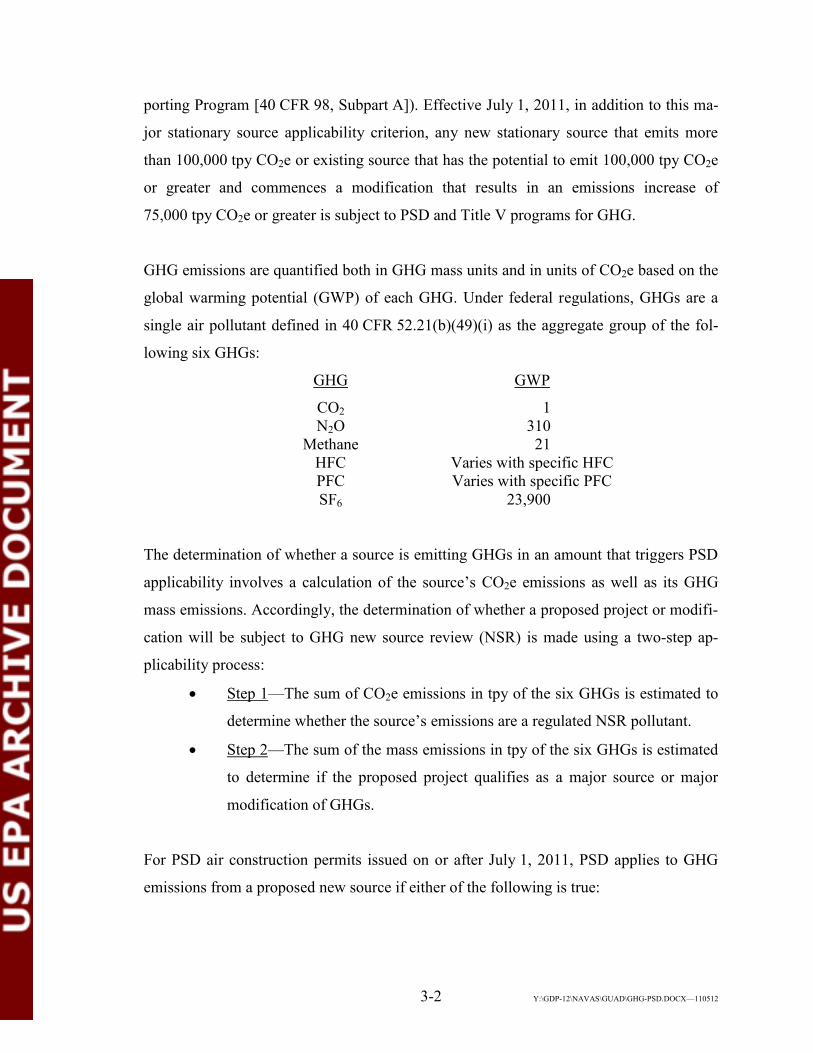
GHG emissions are quantified both in GHG mass units and in units of CO2e based on the
global warming potential (GWP) of each GHG. Under federal regulations, GHGs are a
single air pollutant defined in 40 CFR 52.21(b)(49)(i) as the aggregate group of the fol-
lowing six GHGs:
GHG GWP
CO2 1 N2O 310
Methane 21 HFC Varies with specific HFC PFC Varies with specific PFC SF6 23,900
The determination of whether a source is emitting GHGs in an amount that triggers PSD
applicability involves a calculation of the source’s CO2e emissions as well as its GHG
mass emissions. Accordingly, the determination of whether a proposed project or modifi-
cation will be subject to GHG new source review (NSR) is made using a two-step ap-
plicability process:
Step 1—The sum of CO2e emissions in tpy of the six GHGs is estimated to
determine whether the source’s emissions are a regulated NSR pollutant.
Step 2—The sum of the mass emissions in tpy of the six GHGs is estimated
to determine if the proposed project qualifies as a major source or major
modification of GHGs.
For PSD air construction permits issued on or after July 1, 2011, PSD applies to GHG
emissions from a proposed new source if either of the following is true:

3-3 Y:\GDP-12\NAVAS\GUAD\GHG-PSD.DOCX—110512
The source is subject to PSD review for another PSD pollutant, and the po-
tential to emit GHGs is greater than or equal to 75,000 tpy on a CO2e basis
and greater than 100 or 250 tpy on a mass basis.
Potential emissions of GHGs from the source is equal to or greater than
100,000 tpy on a CO2e basis and equal to or greater than 100/250 tpy on a
mass basis.
As a result of the CAA, EPA has enacted primary and secondary national ambient air
quality standards (NAAQS) for six air pollutants (40 CFR 50). Primary NAAQS are in-
tended to protect the public health, and secondary NAAQS are intended to protect the
public welfare from any known or anticipated adverse effects associated with the pres-
ence of pollutants in the ambient air. Areas of the country in violation of ambient air
quality standards are designated as nonattainment areas, and new sources to be located in
or near these areas may be subject to more stringent air permitting requirements; i.e.,
nonattainment area NSR. PSD NSR applies to major new facilities and major modifica-
tions that will be located in areas designated attainment with NAAQS. Since NAAQS
have not been adopted for GHGs, nonattainment NSR is not applicable.
3.3 PSD APPLICABILITY Potential GHG emissions for the proposed two simple-cycle CTs at GGS exceed
75,000 tpy on both a CO2e and mass basis; therefore, the project qualifies as a major
source subject to PSD GHG review. This is true for the four CT manufacturer/model op-
tions being considered for this project. Accordingly, the project will need to comply with
applicable provisions of the PSD NSR requirements contained in 40 CFR 52.21 for each
of the four CT manufacturer/model options.
3.4 PSD REQUIREMENTS PSD NSR includes the following requirements:
Ambient air quality monitoring.
Ambient impact analysis.
Additional impact analysis.
Control technology review.

3-4 Y:\GDP-12\NAVAS\GUAD\GHG-PSD.DOCX—110512
3.4.1 AMBIENT AIR QUALITY AND IMPACT ANALYSES NAAQS have not been established for GHGs. Therefore, the PSD NSR requirements per-
taining to ambient air quality monitoring (background ambient air quality monitoring)
and ambient impact analysis (dispersion modeling) are not applicable.
PSD regulations require additional impact analyses for three areas: associated growth,
soils and vegetation impact, and visibility impairment. Since GHG emissions will cause
no visibility impairment or direct adverse impacts to soils or vegetation, these analyses
are not required. Also, since NAAQS have not been established for GHGs, analysis of the
effects of associated growth on air quality is not required.
The following subsections provide a discussion of the PSD NSR review requirements for
control technology review (BACT).
3.4.2 CONTROL TECHNOLOGY REVIEW An analysis of BACT is required for each pollutant proposed to be emitted in amounts
equal to or greater than the PSD significant emissions rate levels. BACT is defined as:
“[a]n emissions limitation, including a visible emissions standard, based on the maximum degree of reduction of each pollutant emitted which the Ad-ministrator, on a case by case basis, taking into account energy, environ-mental, and economic impacts and other costs, determines is achievable…. through application of production processes or available methods, systems, and techniques (including fuel cleaning or treatment or innovative fuel combustion techniques) for control of each such pollutant.”
BACT determinations are made on a case-by-case basis as part of the PSD review pro-
cess and apply to each pollutant that exceeds PSD significant emissions rate thresholds.
Emissions units that emit or increase emissions of the applicable pollutants involved in a
major modification or a new major source must undergo BACT analysis. Because each
applicable pollutant must be analyzed, particular emissions units may undergo BACT
analysis for more than one pollutant.
BACT is defined in terms of a numerical emissions limit. This numerical emissions limit
can be based on the application of air pollution control equipment; specific production

3-5 Y:\GDP-12\NAVAS\GUAD\GHG-PSD.DOCX—110512
processes, methods, systems, or techniques; fuel cleaning; or combustion techniques.
BACT limitations may not exceed any applicable federal new source performance stand-
ards (NSPS) as codified under 40 CFR 60, National Emissions Standard For Hazardous
Air Pollutants (NESHAPs), as codified under 40 CFR 61 or 63, or any other emissions
limitation established by state regulations.
BACT analyses must be conducted using the following five-step, top-down approach:
1. Available control technology alternatives are identified based on knowledge
of the particular industry of the applicant, control technology vendors, tech-
nical journals and reports, and previous control technology permitting deci-
sions for other identical or similar sources.
2. The identified available control technologies are evaluated for technical fea-
sibility. If a control technology has been installed and operated successfully
on the type of source under review, it is considered demonstrated and tech-
nically feasible. An undemonstrated control technology may be considered
technically feasible if it is available and applicable. A control technology is
considered available if it can be obtained commercially (i.e., the technology
has reached the licensing and commercial sales phase of development). An
available control technology is applicable if it can reasonably be installed
and operated on the source type under consideration. Undemonstrated avail-
able control technologies determined to be technically infeasible, based on
physical, chemical, and engineering principals, are eliminated from further
consideration.
3. The technically feasible technology alternatives are ranked from the most
stringent, i.e. provides the greatest amount of pollutant removal efficiency,
to the least stringent.
4. The hierarchy is evaluated starting with the top, or most stringent alterna-
tive, to determine economic, environmental, and energy impacts and assess
the feasibility or appropriateness of each alternative as BACT based on site-
specific factors. If the top control alternative is accepted as BACT from an
economic and energy standpoint, evaluation of energy and economic im-
pacts is not required, since the only reason for conducting these assessments

3-6 Y:\GDP-12\NAVAS\GUAD\GHG-PSD.DOCX—110512
is to document the rationale for rejecting a technically feasible control op-
tion as BACT. Instead, the applicant proceeds to evaluate the top case con-
trol technology for impacts of unregulated air pollutants or impacts in other
media (i.e., collateral environmental impacts). If there are no issues regard-
ing collateral environmental impacts, the BACT analysis is complete, and
the top case control technology alternative is proposed as BACT. If the top
control alternative is not applicable due to adverse energy, environmental, or
economic impacts, it is rejected as BACT, and the next most stringent con-
trol alternative is then considered.
5. This evaluation process continues until an applicable control alternative is
determined to be both technologically and economically feasible, thereby
defining the emissions level corresponding to BACT for the evaluated pollu-
tant.
Chapter B of EPA’s Draft New Source Review Manual dated October 1990 describes this
five-step procedure for conducting a BACT analysis. In March 2011, EPA published an
updated version of its guidance document entitled PSD and Title V Permitting Guidance
for Greenhouse Gases. This guidance document, which was originally published in No-
vember 2010, provides, among other issues, guidance on performing BACT analyses for
GHG emissions. EPA’s guidance reaffirms that a BACT analysis for GHG emissions
must be conducted using the same five-step, top-down approach used for other NSR pol-
lutants. GPP has followed this guidance document in conducting the BACT analysis pro-
vided in Section 4.0.
3.5 OTHER FEDERAL REQUIREMENTS For federal EPA permitting, GHG PSD reviews must also include consideration of two
other federal laws and programs: the Endangered Species Act and Environmental Jus-
tice. Each of these programs is discussed in the following subsections.
3.5.1 ENDANGERED SPECIES ACT Section 7 of the Endangered Species Act of 1973, as amended (Chapter 16, Part 1531
et seq., United States Code [U.S.C.]) directs federal agencies to use their existing authori-

3-7 Y:\GDP-12\NAVAS\GUAD\GHG-PSD.DOCX—110512
ties to conserve threatened and endangered species and, in consultation with the U.S. Fish
and Wildlife Service and/or National Oceanic and Atmospheric Administration’s Nation-
al Marine Fisheries Service, ensure that their actions do not jeopardize listed species or
destroy or adversely modify critical habitat. Section 7 applies to federal actions that may
affect listed species, including federal approval of private activities through the issuance
of federal permits, licenses, or other actions.
Section 5.0 of this permit application provides details concerning the impact of this pro-
posed project on threatened and endangered species.
3.5.2 ENVIRONMENTAL JUSTICE Executive Order 12898, Federal Actions to Address Environmental Justice in Minority
Populations and Low-Income Populations (Volume 59, Issue 7629, Federal Register
[FR]), is intended to ensure that potential disproportionately high and adverse human
health or environmental effects on minority and low-income populations do not occur as
a result of a federal action. EPA recently established Plan EJ 2014 to guide the way EPA
will integrate environmental justice into the agency’s programs, policies, and activities.
Section 5.0 of this permit application provides details concerning environmental justice
as it relates to this project.

4-1 Y:\GDP-12\NAVAS\GUAD\GHG-PSD.DOCX—110512
4.0 BACT FOR GREENHOUSE GASES
On June 3, 2010, EPA published a final rule (effective August 2, 2010) in the Federal
Register (75 FR 106) entitled Prevention of Significant Deterioration and Title V Green-
house Gas Tailoring Rule (the Tailoring Rule). For PSD/Title V purposes, GHGs are a
single air pollutant defined as the aggregate group of CO2, N2O, methane, HFCs, PFCs,
and SF6. This final rule established specific applicability thresholds for GHG emissions
for new major sources and modifications to existing major sources under the PSD and
Title V programs.
Effective January 2, 2011, a new source or modification, i.e., a new major stationary
source for an NSR pollutant other than GHG, whose GHG emissions exceed 75,000 tpy
CO2e, is subject to PSD review including a BACT analysis for GHG emissions. (CO2e
emissions are defined as the sum of the mass emissions of each individual GHG adjusted
for its respective global warming potential using Table A-1 of the Greenhouse Gas Re-
porting Program [40 CFR 98, Subpart A]). Effective July 1, 2011, in addition to this ma-
jor stationary source applicability criterion, any new stationary source that emits more
than 100,000 tpy of CO2e or any existing source that has the potential to emit 100,000 tpy
of CO2e or greater and commences a modification that results in an emissions increase of
75,000 tpy of CO2e or greater is subject to PSD and Title V programs for GHG.
Since the proposed project is a new major stationary source for an NSR pollutant other
than GHG and has CO2e emissions greater than 75,000 tpy, the proposed project is sub-
ject to PSD review including a BACT analysis for GHGs.
In March 2011, EPA published an updated version of the guidance document entitled
PSD and Title V Permitting Guidance for Greenhouse Gases (EPA, 2011). This guidance
document, which was originally published in November 2010, provides, among other is-
sues, guidance on performing BACT analyses for GHG emissions. EPA’s guidance doc-
ument reaffirms that a BACT analysis for GHG emissions must be conducted using the
same five-step, top-down approach used for other NSR pollutants. These five steps are:
4-2 Y:\GDP-12\NAVAS\GUAD\GHG-PSD.DOCX—110512
Step 1—Identify available control technologies.
Step 2—Eliminate technically infeasible options.
Step 3—Rank remaining control technologies.
Step 4—Evaluate most effective controls and document results.
Step 5—Select BACT.
The following subsections provide the BACT analysis for GHG emissions required for
this project. This BACT analysis reflects the guidance provided in EPA’s updated guid-
ance document entitled PSD and Title V Permitting Guidance for Greenhouse Gases, dat-
ed March 2011.
In addition to utilizing the aforementioned documents to complete the BACT analysis,
GPP also evaluated the existing Reasonably Available Control Technology (RACT)/
BACT/Lowest Achievable Emissions Rate (LAER) Clearinghouse (RBLC) database,
which did not have any results or permitting decisions for CTs under the classification of
Large CTs, Simple-Cycle, Natural Gas, Process Code 15.110. GPP has also reviewed and
evaluated the GHG PSD permit applications submitted to as well as draft and final per-
mits issued by EPA Region 6 for applicability to this GHG BACT review.
4.1 COMBUSTION TURBINES 4.1.1 STEP 1—IDENTIFY AVAILABLE CONTROL TECHNOLOGIES Step 1 of the top-down BACT analysis is the identification of available control technolo-
gies or techniques, including inherently lower-emitting processes/practices/designs, add-
on controls, and a combination of inherently lower-emitting processes/practices and add-
on controls, that have a practical application to the control of GHG emissions. These con-
trol technologies must include control technologies for the pollutant under evaluation,
GHG, regardless of the source category type. For example, control technologies must be
identified not only for those demonstrated on other combined-cycle CT facilities but also
for control technologies determined through technology transfer that are applied to source
categories with similar exhaust stream characteristics.

4-3 Y:\GDP-12\NAVAS\GUAD\GHG-PSD.DOCX—110512
Technologies that formed the basis of an applicable NSPS should also be considered in
the BACT analysis, since a BACT emissions limit cannot be less stringent than an appli-
cable NSPS emissions limit. The two proposed simple-cycle CTs are subject to the NSPS
for Stationary CTs, 40 CFR 60, Subpart KKKK.
It is important to note and must be emphasized that available control technologies should
not include inherently lower-emitting processes, practices, or designs that would funda-
mentally redefine the nature of the proposed project or source. A BACT analysis should
not consider those control technologies that would change or redefine that applicant’s
goal, objectives, purpose, or basic design. A BACT analysis may consider control tech-
nologies that change aspects of the proposed facility but do not redefine the nature of the
proposed facility.
The project configuration consists of two simple-cycle F-class CTs. The EPA guidance
document dated March 2011 states that, “combined-cycle CTs, which generally have
higher efficiencies than simple-cycle turbines, should be listed as options when an appli-
cant proposes to construct a natural gas-fired facility.” In complying with this specific
EPA guidance, GPP will list a combined-cycle power plant as an energy-efficient control
technology in Step 1. This potential control option will then be further evaluated on the
basis of technical feasibility in Step 2.
4.1.1.1 Combined-Cycle CT Power Plant A simple-cycle CT power plant, also termed a peaker plant, consists of a CT fueled typi-
cally by either natural gas or fuel oil. The high-temperature, high-pressure combustion
gases expand in a post-CT section, which drives an electrical generator. The high-
temperature exhaust gases exiting the CT section are then exhausted directly to the at-
mosphere.
In a combined-cycle CT power plant, the high-temperature exhaust gases exiting the CT
section are routed to a heat recovery steam generator (HRSG). Steam is generated in the
HRSG due to the high-temperature exhaust gases and, in some cases, the supplemental
firing of duct burners. Steam generated in the HRSG is then sent to a steam turbine for

4-4 Y:\GDP-12\NAVAS\GUAD\GHG-PSD.DOCX—110512
additional electrical power generation. The combined-cycle process recovers some of the
energy contained in the high-temperature exhaust gases to create additional electrical
power and thus provides a higher overall process energy efficiency as compared to a sim-
ple-cycle CT process.
4.1.1.2 CT Energy Efficiency Design, Practices, and Procedures
CT Design
CO2 is a product of combustion of fuel containing carbon, which is inherent in any power
generation technology using fossil fuel. The basic theoretical combustion equation for
methane (CH4) is:
CH4 + O2 = CO2 + 2H2O
CO2 emissions are the essential product of the chemical reaction between the fuel and the
oxygen in which it burns and not a byproduct caused by imperfect combustion. There-
fore, CO2 emissions cannot be reduced by improving the combustion efficiency, and
there is no technology available that can reduce CO2 generation from the combustion of
carbon-based fuels. The only effective means to minimize the amount of CO2 generated
by a fuel-burning power plant is through high-efficiency combustion and plant design
resulting in the lowest heat rate in units of Btu/kWh. Minimizing the amount of fuel re-
quired (in units of million British thermal units) to produce a given amount of electrical
power output (in units of kilowatt-hours) results in lowest amount of CO2 generated dur-
ing the combustion process.
As previously discussed, the most efficient means of generating electricity from a natural
gas CT plant is through the use of a combined-cycle design. For fossil fuel technologies,
efficiencies typically range between approximately 30 and 50 percent (higher heating
value [HHV]). A typical coal-fired Rankine cycle power plant has a typical base load ef-
ficiency of approximately 30 percent (HHV), while an F-class natural gas-fired com-
bined-cycle unit operating under optimal conditions has a base load efficiency of approx-
imately 50 percent (HHV) or greater.

4-5 Y:\GDP-12\NAVAS\GUAD\GHG-PSD.DOCX—110512
There are several other design features employed within the CT process that can improve
the overall efficiency of the process. These additional features include those summarized
in the following paragraphs.
Evaporative Inlet Air Cooling or Inlet Fogging
Evaporative inlet air cooling or inlet fogging is used during high ambient air temperature
operating cases to lower the temperature of the inlet combustion air and thus increase the
density of the combustion air. Increasing the density of the inlet combustion air increases
the mass flow rate of the inlet combustion air, which allows more fuel to be combusted in
the CT process. This provides greater electrical power output from the CT during certain
operating cases and in cases of high electrical power demand. Increasing the electrical
power output provides increased overall energy efficiency of the CT.
Periodic Burner Maintenance
F-class CTs have regularly scheduled maintenance programs. These maintenance pro-
grams are important for the reliable operation of the unit, as well as to maintain optimal
efficiency. As the CT is operated, the unit experiences degradation and loss in perfor-
mance. The CT maintenance program helps restore the recoverable lost performance. The
maintenance program schedule is determined by the number of hours of operation and/or
turbine starts. There are three basic maintenance levels: combustion inspections, hot gas
path inspections, and major overhauls. Combustion inspections are the most frequent of
the maintenance cycles. As part of this maintenance activity, the combustors are tuned to
restore highly efficient low-emissions operation.
Reduction in Heat Loss
F-class CTs have high operating temperatures. The high operating temperatures are a re-
sult of the heat of compression in the compressor along with the fuel combustion in the
burners. To minimize heat loss from the CT and protect personnel and equipment around
the machine, insulation blankets are applied to the CT casing. These blankets minimize
the heat loss through the CT shell and help improve the overall efficiency of the machine.

4-6 Y:\GDP-12\NAVAS\GUAD\GHG-PSD.DOCX—110512
Instrumentation and Controls
F-class CTs have sophisticated instrumentation and controls to automatically control the
operation of the CT. The control system is a digital type and is supplied with the CT. The
distributed control system controls all aspects of the turbine’s operation, including the
fuel flow rate and burner operations, to achieve high efficiency, low-nitrogen oxides
(NOx) combustion. The control system monitors the operation of the unit and modulates
the fuel flow and turbine operation to achieve optimal high-efficiency, low-emissions
performance under all operating cases.
4.1.1.3 Plantwide Energy Efficiency Design, Practices, and Procedures There are several other plantwide energy efficiency designs, practices, and procedures
within a CT power plant that could potentially improve overall plant efficiency. These
include clean fuels and fuel gas preheating.
Clean Fuels
The CAA includes clean fuels in the definition of BACT; therefore, clean fuels should be
considered as a potential control technology for GHG emissions. Fuels that reduce GHG
emissions of a new source should be considered in a BACT analysis, provided they do
not fundamentally redefine the source. For example, a proposed new coal plant should
not have to consider switching fuels from coal to natural gas, as that would fundamental-
ly redefine the source. However, different types of coal may be considered to evaluate the
benefits of combusting various types of coal in reducing GHG emissions.
Fuel Gas Preheating
The overall efficiency of the CT process is increased as the temperature of fuel is in-
creased. Fuel gas preheating is commonly applied to F-class CT-based plants to maintain
the fuel gas temperature above the dew point and prevent condensation in the fuel. Fuel
gas preheating also provides a constant fuel gas temperature to the CT. Fuel gas preheat-
ing improves the efficiency of a CT-based power process.
The other available control technology for GHG emissions for the simple-cycle CT at
GGS is CCS. EPA defines an available control option as, “those air pollution control

4-7 Y:\GDP-12\NAVAS\GUAD\GHG-PSD.DOCX—110512
technologies or techniques (including lower-emitting processes and practices) that have
the potential for practical application to the emissions unit and the regulated pollutant un-
der evaluation.”
CCS technology does have the “potential” for practical application and therefore was
considered an available control option.
4.1.1.4 Carbon Capture and Sequestration CCS consists of the separation and capture of CO2 from the flue gas, pressurization of the
captured CO2, transportation of the CO2 as a fluid via pipeline, and injection and long-
term geologic storage.
The capture technologies applicable for fossil fuel combustion include the following:
Precombustion systems designed to separate CO2 and hydrogen in the high-
pressure syngas typically produced at integrated gasification combined-
cycle power plants.
Postcombustion systems designed to separate CO2 from the flue gas pro-
duced by the combustion process.
Oxy-combustion systems that use high-purity oxygen rather than air in the
combustion process to produce a highly concentrated CO2 stream.
Precombustion systems are not technically feasible for GGS, since they would fundamen-
tally redefine the nature of the proposed source. Both post- and oxy-combustion systems
would be considered an available control option, and both are currently in development
as demonstration projects on much smaller exhaust slip streams at coal-fired power plants
using amine and ammonia capture systems to remove the CO2 from the flue gas. Oxy-
combustion systems are limited by the parasitic power required for oxygen production in
a conventional air separation unit. In addition, the oxy-combustion process also requires a
portion of the exhaust CO2 stream to be cooled and recycled in the combustion chamber
for mass and temperature control. These capture systems are associated with high energy
penalties.

4-8 Y:\GDP-12\NAVAS\GUAD\GHG-PSD.DOCX—110512
Once CO2 is separated and captured, it then can be compressed under high pressure for
transport to an appropriate geological storage site. The process of transporting CO2 is typ-
ically considered via pipeline and has substantial associated logistic hurdles and opera-
tional penalties. Transportation infrastructure issues include pipeline routing, acquisition
of rights-of-way, and associated environmental impacts. In addition, additional energy
must be expended to compress and transport the compressed CO2. An alternative means
of transporting the compressed CO2 is via a ship, similar to transporting liquid natural
gas. Again, there are similar logistic hurdles and operational penalties for transporting
compressed CO2 via ship that can be substantial.
CCS usually involves the injection of CO2 into deep geological formations of porous rock
that are capped by one or more nonporous layers of rock. Injected at high pressure, the
CO2 exists as a liquid that flows through the porous rock to fill the voids. Saline for-
mations, exhausted oil and gas fields, and unmineable coal seams are candidates for CO2
storage. Also, CO2 injected for enhanced oil recovery projects can result in long-term se-
questration depending on the geologic conditions. Other schemes include liquid storage
in the ocean, solid storage by reactions leading to the creation of carbonates, and terres-
trial sequestration.
4.1.2 STEP 2—ELIMINATE TECHNICALLY INFEASIBLE OPTIONS Step 2 of the top-down BACT analysis is the elimination of technically infeasible op-
tions. EPA considers a technology to be technically feasible if, one, it has been demon-
strated and operated successfully on the same type of source under review, or two, it is
available and applicable to the source type under review. A control technology should
also be considered technically available or applicable if it has been demonstrated on an
exhaust stream with similar physical and chemical characteristics.
4.1.2.1 Combined-Cycle CT Power Plant In accordance with EPA guidance, a natural gas-fired combined-cycle CT power plant
was considered as a potential control option. A combined-cycle CT power plant is typi-
cally more energy efficient than a comparable simple-cycle CT power plant due to the
fact that a portion of the thermal energy contained in the high-temperature CT exhaust

4-9 Y:\GDP-12\NAVAS\GUAD\GHG-PSD.DOCX—110512
gas is recovered in the HRSG. This thermal energy is used to generate steam in the
HRSG, which is then used to drive a steam turbine generator creating additional electrical
power output.
A combined-cycle power plant typically takes a longer period of time to start up as com-
pared to a simple-cycle power plant. This is due in part to the fact that the temperature of
the HRSG must be gradually increased to its operating temperature to minimize thermal
stress effects to the HRSG components. There are other factors that contribute to the in-
creased startup time for a combined-cycle plant. For this reason, combined-cycle plants
are typically considered intermediate load or baseload power plants, which operate for
longer periods of time after startup. Note that there are some combined-cycle CT power
plant designs that propose the use of fast or rapid start CT. These designs allow the CT to
operate in simple-cycle mode and produce some electrical power, while the HRSG and
other equipment associated with combined-cycle operation are allowed time to become
operational. Operation of a combined-cycle plant in this manner, to produce electrical
power in simple-cycle mode, is not economical on an extended basis and, therefore, can-
not be comparable to a simple-cycle CT operating as a peaker plant.
The primary function of a peaker plant is to provide immediate electrical power to the
electric grid in response to an immediate increase in electrical demand. To meet this
function, a peaker plant must be able to reach full load operations in an extremely quick
and responsive manner. It is estimated that the two proposed simple-cycle CTs for GGS
can start up in less than 15 minutes. A peaker plant must also be able to shut down quick-
ly and be able to restart in response to the electrical demand. It is not uncommon for a
peaker plant to start multiple times in a single day.
A combined-cycle CT power plant, even if the CTs are operated in simple-cycle mode, is
simply not designed to operate as a peaker plant. A combined-cycle power plant cannot
respond to the quick and immediate electrical demands required for a peaker plant.
The two proposed simple-cycle CTs will be limited to 2,500 hr/yr of operation and are
therefore considered peaker plants. A combined-cycle CT power plant is not designed for

4-10 Y:\GDP-12\NAVAS\GUAD\GHG-PSD.DOCX—110512
peaker operation and would fundamentally redefine the nature of the source. A com-
bined-cycle CT power plant is not further considered in this BACT analysis.
4.1.2.2 CT Energy Efficiency Design, Practices, and Procedures All CT energy efficiency designs, practices and procedures including the CT design it-
self, evaporative inlet air cooling, CT tuning, reduction in heat loss, and instrumentation
and controls are all technically feasible and will be considered further in this BACT anal-
ysis
4.1.2.3 Plantwide Energy Efficiency Design, Practices, and Procedures The use of clean fuels and fuel gas heating, which minimize the facility’s GHG emis-
sions, are technically feasible and will be considered further in this BACT review.
4.1.2.4 Carbon Capture And Sequestration EPA considers a technology to be technically feasible if it, one, has been demonstrated
and operated successfully on the same type of sources under review, or two, is available
and applicable to the source type under review.
CCS has not been demonstrated on a full-scale power generation facility. There are sev-
eral CCS demonstration projects or research and development projects, but these projects
are on a significantly smaller scale and are only applied to a slipstream of the total ex-
haust gas stream. CCS technology is not currently commercially available for a full-scale
power generation facility. CCS technology has not been demonstrated on a similar ex-
haust gas stream that could be considered an equivalent scale as a full-scale power gener-
ation facility.
CCS technology is currently in various stages of development and is not commercially
available. There have been no CCS demonstration projects to date (and none planned) for
natural gas-fired simple-cycle CT facilities. Priorities with respect to federal funding of
CCS demonstration projects have focused on developing cost-effective CCS technology
for large fossil fuel-fired combustion sources such as coal-fired power plants. Since CO2
emissions from natural gas-fired simple-cycle CT facilities are significantly lower than
4-11 Y:\GDP-12\NAVAS\GUAD\GHG-PSD.DOCX—110512
coal-fired power plants, it is unlikely the limited federal funds available for CCS devel-
opment will be applied to natural gas-fired CT facilities.
EPA recognizes the significant technical and logistical issues associated with the installa-
tion and operation of a CCS control system that do not allow CCS technology to be eval-
uated in the same fashion as demonstrated add-on control technologies typically used to
reduce emissions of other regulated pollutants. In contrast to CCS technology, demon-
strated add-on control technologies for other regulated pollutants have a proven track
record of performance and an existing reasonably accessible infrastructure in place to ad-
dress waste disposal and other offsite needs.
Additionally, EPA does allow site-specific considerations in evaluating whether an avail-
able control option should be considered technically infeasible including physical space
for CO2 capture equipment and postcapture CO2 compression equipment at an existing
facility. GGS is an existing power plant located on a relatively small piece of land area.
There is extremely limited physical space available to install CCS equipment, even if it
were commercially available.
Therefore, although CCS was identified as an available control option in Step 1, CCS
technology is not considered technically feasible for the two proposed natural gas-fired
simple-cycle CTs at GGS and is not further considered in this BACT analysis.
4.1.3 STEP 3—RANK REMAINING CONTROL TECHNOLOGIES Step 3 of the top-down BACT analysis is the ranking of technically feasible options.
Since it has been determined that CCS is not technically feasible, the remaining techni-
cally feasible options include high thermal or energy efficiency, fuel gas heating, and the
exclusive use of clean fuels. The energy efficiency must look at the high thermal effi-
ciency design of the CTs system as well as various energy efficiency improvements
throughout the process.

4-12 Y:\GDP-12\NAVAS\GUAD\GHG-PSD.DOCX—110512
4.1.4 STEP 4—EVALUATE MOST EFFECTIVE CONTROLS AND DOCU-MENT RESULTS
Step 4 of the top-down BACT analysis is the consideration of economic, energy, and en-
vironmental impacts.
The two proposed simple-cycle CTs will use high thermal efficiency CT design, fuel gas
heating, and exclusive use of clean fuel; i.e., pipeline-quality natural gas. Since there are
no other technically feasible available options for reducing GHG emissions, no further
analysis of economic, energy, or environmental impacts is necessary.
4.1.5 STEP 5—SELECT BACT Step 5 of the top-down BACT analysis is the selection of BACT.
GPP proposes as BACT for GHG the following energy efficiency designs, practices, and
procedures for the proposed simple-cycle power generation technology:
CT energy efficiency design, practices, and procedures:
o Efficient CT design.
o CT inlet air cooling.
o Periodic CT burner maintenance and tuning.
o Reduction in heat loss, i.e., insulation of the CT.
o Instrumentation and controls.
Plantwide energy efficiency design, practices, and procedures:
o Exclusive use of clean fuels, i.e., pipeline-quality natural gas for the
CTs and ULSD for the new emergency firewater pump.
o Electric heating of the fuel gas prior to combustion.
GPP proposes an annual GHG BACT emissions for each of the four CT manufactur-
er/model options. These annual GHG BACT emissions limits include GHG emissions
from the two simple-cycle CTs, GHG emissions from the emergency firewater pump, fu-
gitive GHG emissions from newly installed natural gas piping components, and GHG
emissions from estimated SF6 insulating gas leakage from newly installed circuit breakers
(see Table 4-1).

4-13 Y:\GDP-12\NAVAS\GUAD\GHG-PSD.DOCX—110512
Compliance with this numerical annual GHG BACT emissions limit will be demonstrat-
ed by measuring and recording the total heat input to the CTs and monitoring CO2 emis-
sions with continuous emissions monitoring systems. Methane and N2O emissions will be
calculated using emissions factors as defined in the Mandatory Greenhouse Gas Report-
ing Rule, Table C-2. CO2e emissions will then be calculated using each GHG pollutant’s
respective GWP as defined in the Mandatory Greenhouse Gas Reporting Rule, Ta-
ble A-1.
To ensure the inherent efficiency of the two proposed simple-cycle CTs remains high,
GPP also proposes a numerical limit on the simple-cycle CT gross heat rate, expressed in
units of Btu/kWh (HHV).
The proposed simple-cycle CT gross heat rate is based on operating at base load and In-
ternational Organization for Standardization (ISO) conditions. The following margins
were used to adjust base load heat rates for each of the CT manufacturer/model options:
3.3 percent to account for the potential difference between the design CT
heat rate and the actual tested CT heat rate.
6 percent for CT efficiency losses due to degradation prior to CT overhaul.
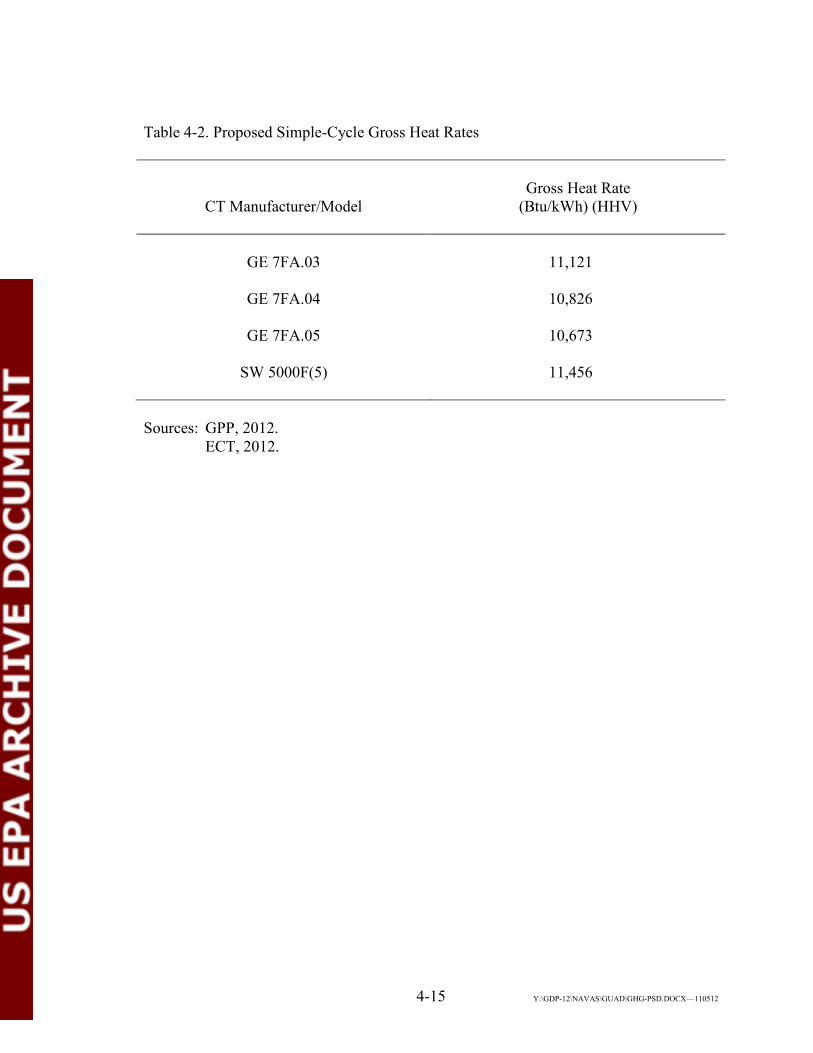
Table 4-2 presents the proposed simple-cycle gross heat rates for each of the CT manu-
facturer/model options.
GPP proposes to demonstrate compliance with the annual GHG emissions limit by moni-
toring the fuel usage to the CTs on a 12-month rolling basis. GHG emissions from the
CTs will be calculated using emissions factors from the Mandatory Reporting of Green-
house Gases, Final Rule; Federal Register, Vol. 74, No. 209, October 30, 2009, Ta-
bles C-1 and C-2, to Subpart C of Part 98.
GPP proposes to demonstrate compliance with the gross heat rate by conducting an annu-
al thermal efficiency test at base load and corrected to ISO conditions. Demonstrating

4-14 Y:\GDP-12\NAVAS\GUAD\GHG-PSD.DOCX—110512
Table 4-1. Proposed GHG BACT Emissions Limits
CT Manufacturer and Model
Annual GHG Emission Limit*
(tpy)
GE 7FA.03 511,429
GE 7FA.04 522,772
GE 7FA.05 601,520
SW 5000F(5) 681,839
*Expressed as CO2e. Sources: GPP, 2012. ECT, 2012.
4-15 Y:\GDP-12\NAVAS\GUAD\GHG-PSD.DOCX—110512
Table 4-2. Proposed Simple-Cycle Gross Heat Rates
CT Manufacturer/Model
Gross Heat Rate
(Btu/kWh) (HHV)
GE 7FA.03 11,121
GE 7FA.04 10,826
GE 7FA.05 10,673
SW 5000F(5) 11,456
Sources: GPP, 2012. ECT, 2012.

4-16 Y:\GDP-12\NAVAS\GUAD\GHG-PSD.DOCX—110512
compliance on an annual basis will ensure that the CT is operating efficiently not only at
base load and ISO conditions but at all other ambient temperatures and loads.
A review of GHG BACT heat rate determinations for large simple-cycle CTs was per-
formed. Federal and state agency Websites and databases reviewed include EPA’s RBLC
database, EPA Regional Office Website including Region 6, and state environmental
regulatory agency Websites. To date, there have been very few simple-cycle CTs that
have been subject to BACT review for GHG emissions.
A search of EPA’s RBLC database for GHG BACT determinations over the past 10 years
for large (more than 25 MW) natural gas-fired simple-cycle CTs yielded only one facili-
ty, Sabine Pass liquefied natural gas (LNG) terminal located in Cameron County, Louisi-
ana. The CTs were GE LM2500 units, which are not comparable to the proposed F-class
CTs proposed for GGS. Good combustion/operating practices and use of natural gas were
listed as the control methodology for the LM2500 units.
A final GHG PSD permit was issued by EPA Region 8 on September 27, 2012, for the
Cheyenne Light, Fuel, and Power/Black Hills Power, Inc., Cheyenne Prairie Generating
Station located in Laramie County, Wyoming. This proposed facility consists of two GE
LM6000 PF SPRINT CTs operating in a two-on-one combined-cycle configuration and
three GE LM6000 PF SPRINT CTs operating in simple-cycle mode. The CTs are all
fired exclusively with pipeline-quality natural gas. The GE LM6000 CT is an aero-
derivative CT and is not comparable to the F-class CTs proposed for GGS.
4.2 EMERGENCY FIREWATER PUMP 4.2.1 STEP 1—IDENTIFY AVAILABLE CONTROL TECHNOLOGIES The available GHG control technologies that could be potentially applicable to a diesel-
fueld firewater pump include:
CCS.
Efficient engine design.
Clean fuels.
Good combustion practices.

4-17 Y:\GDP-12\NAVAS\GUAD\GHG-PSD.DOCX—110512
4.2.2 STEP 2—ELIMINATE TECHNICALLY INFEASIBLE OPTIONS As previously discussed, CCS is currently being considered for larger fossil fuel-fired
power plants with higher exhaust mass flow rates and CO2 concentrations as compared to
a diesel-fired compression ignition (CI) internal combustion engine (ICE). CCS is not
technically feasible for an emergency diesel-fired firewater pump, which will operate in-
frequently and only during emergencies except for periods of testing and maintenance.
4.2.3 STEP 3—RANK REMAINING CONTROL TECHNOLOGIES Since it has been determined that CCS is technically infeasible, the other remaining con-
trol technologies are efficient engine design, clean fuels, and good combustion practices.
4.2.4 STEP 4—EVALUATE MOST EFFECTIVE CONTROLS AND DOCU-MENT RESULTS
The emergency firewater pump will incorporate the technically feasible control technolo-
gies, i.e. efficient engine design, use of clean fuels, and good combustion practices.
4.2.5 STEP 5—SELECT BACT GPP proposes a maximum annual GHG emissions limit of 79 tpy for the emergency
firewater pump based on a maximum operation of 500 hr/yr.
The diesel-fired engine will meet the applicable standards of NSPS for Stationary Com-
pression Ignition Internal Combustion Engines, 40 CFR 60, Subpart IIII, and will be lim-
ited to 100 hours of operation for testing and maintenance purposes excluding operation
during an emergency. Compliance with NSPS Subpart IIII will demonstrate efficient en-
gine design. The emergency firewater pump will use clean fuels by the exclusive use of
ULSD. Good combustion practices will include complying with manufacturers recom-
mended operation and maintenance procedures.
Compliance with the maximum annual GHG emissions limit will be demonstrated by
monitoring the hours of operation on a 12-month rolling basis. Annual ULSD fuel con-
sumption will be calculated based on the hours of operation and engine hourly fuel con-
sumption. GHG emissions from the emergency firewater pump will be calculated using

4-18 Y:\GDP-12\NAVAS\GUAD\GHG-PSD.DOCX—110512
emissions factors from the Mandatory Reporting of Greenhouse Gases, Final Rule; Fed-
eral Register Vol. 74, No. 209, October 30, 2009, Tables C-1 and C-2, to Subpart C of
Part 98.
4.3 FUGITIVE GHG EMISSIONS FROM NATURAL GAS PIPING COMPO-NENTS
Fugitive GHG emissions will be calculated for all newly installed natural gas piping
components on an annual basis to demonstrate compliance with the annual GHG BACT
emissions limit. Only those natural gas piping components under GPP control and outside
the CT enclosure have been considered. The CT enclosure is maintained under negative
pressure, and any natural gas leaks from piping components within the CT enclosure will
be captured and not emitted to atmosphere. GHG emissions will be calculated using
emissions factors contained in EPA’s Mandatory Reporting of Greenhouse Gas Rule,
40 CFR 98, Table W-1A, Default Whole Gas Emission Factors for Onshore Petroleum
and Natural Gas Production. GHG emissions from natural gas piping components will be
calculated on an annual basis.
4.4 SULFUR HEXAFLUORIDE SF6 is one of the six pollutants that comprise GHGs. SF6 is a synthetic gas that possesses
excellent electrical insulating properties. Because of this, SF6 is used as an insulating gas
in many electrical circuit breakers. The newly installed circuit breakers for the two pro-
posed simple-cycle CTs will contain a quantity of SF6 for the purpose of acting as an
electrical insulator. Because of the size required for the circuit breakers, SF6 circuit
breakers are the only feasible alternative for this application, i.e., compressed air and die-
lectric oil circuit breakers would not safely handle the design voltages.
There may potentially be some small, nonroutine emissions of SF6 during the operation,
i.e. opening and closing, of the circuit breaker. To minimize the emissions of SF6, GPP
proposes to use state-of-the-art enclosed pressure SF6 circuit breakers as BACT for SF6.
The circuit breakers will be equipped with SF6 pressure monitors and a low SF6 alarm. In
comparison to older circuit breakers containing SF6, modern circuit breakers are designed
as totally enclosed-pressure systems with a far lower potential for SF6 emissions.

4-19 Y:\GDP-12\NAVAS\GUAD\GHG-PSD.DOCX—110512
4.5 BACT DURING STARTUP AND SHUTDOWN BACT must be met at all times including during periods of startup and shutdown. Pollu-
tants subject to BACT analysis and review must address BACT emissions limits not only
during normal operation but also during startup and shutdown.
GHG emissions are lower during startup and shutdown, as these emissions are directly
proportional to the amount of fuel combusted. Since fuel flow rates are lower during
startup and shutdown compared to normal operation, emissions of GHGs during startup
and shutdown will also be lower compared to normal operation. Therefore, the proposed
annual GHG BACT CO2e emissions limits proposed for the simple-cycle CTs will apply
during periods of startup and shutdown, as well as during periods of normal operation.

5-1 Y:\GDP-12\NAVAS\GUAD\GHG-PSD.DOCX—110612
5.0 OTHER IMPACTS
5.1 THREATENED AND ENDANGERED SPECIES Thirty-two rare species have been identified as potentially occurring in Guadalupe Coun-
ty by the Texas Parks and Wildlife Department. Appendix D contains the complete list.
The proposed addition of the two simple-cycle CTs to the existing GGS does not repre-
sent the construction and operation of a new greenfields power generation facility. GGS
is an existing power generation facility, and the addition of the proposed simple-cycle
CTs will be located on property already owned and under the control of GPP.
The addition of the proposed simple-cycle CTs is expected to have little to no impact on
threatened and endangered species due to the fact that the proposed location of these CTs
is within the existing GGS plant boundary. The specific area for the proposed project fa-
cilities has been previously impacted and disturbed by construction and operation of the
existing power facilities. The previous environmental licensing studies for the initial de-
velopment and subsequent expansions of the GGS included detailed surveys and assess-
ments for wetlands, vegetation, and protected wildlife and plant species. This immediate
area contains no wetlands or suitable wildlife habitat. The proposed project would have
no additional impacts on biological resources.
5.2 ENVIRONMENTAL JUSTICE
Executive Order 12898, Federal Actions to Address Environmental Justice in Minority
Populations and Low Income Populations, requires federal agencies to identify and ad-
dress disproportionately high adverse human health or environmental effects of their pro-
grams and policies on minority and low-income communities and Native American
tribes.
The proposed addition of the two simple-cycle CTs to the existing GGS does not repre-
sent construction and operation of a new greenfields power generation facility. GGS is an
existing power generation facility, and the addition of the proposed simple-cycle CTs will

5-2 Y:\GDP-12\NAVAS\GUAD\GHG-PSD.DOCX—110512
be located on property already owned and under the control of GPP. This GHG PSD
permit application provides the following analysis addressing environmental justice.
Table 5-1 provides information regarding the total population and racial makeup levels in
Guadalupe County and the state of Texas. This information demonstrates that Guadalupe
County, in general, does not contain a significantly great amount of minorities as com-
pared to the entire state of Texas.
Table 5-2 provides information regarding the median household income and poverty lev-
els in Guadalupe County and the state of Texas. This information demonstrates that Gua-
dalupe County, in general, does not contain a significantly great amount of lower income
households as compared to the entire state of Texas.
Therefore, no disproportionately high or adverse impacts to minority or low-income
communities are expected due to the proposed project.

5-3 Y:\GDP-12\NAVAS\GUAD\GHG-PSD.DOCX—110512
Table 5-1. Population by Race—2010
Race (%)
Area Total Population
White
African American
Asian
Other
Identified by Two or More
Guadalupe County 131,533 79.8 6.5 1.4 9.2 3.1
State of Texas 25,145,561 70.4 11.9 3.8 11.2 2.7 Source: U.S. Census Bureau, 2012.

5-4 Y:\GDP-12\NAVAS\GUAD\GHG-PSD.DOCX—110512
Table 5-2. Income and Poverty Level—2010
Area
Median Household Income
Per Capita Income
Persons Below Poverty Level
(%)
Guadalupe County $58,799 $25,218 11.4
State of Texas $48,622 $24,870 17.9 Source: U.S. Census Bureau, 2012.

APPENDIX A
GENERAL APPLICATION

TCEQ – 10252 (Revised 07/12) PI-1 Form Y:\GDP-12\NAVAS\GUAD\GHG-PSD_A.DOCX—110512 This form is for use by facilities subject to air quality permit requirements and may be revised periodically. (APDG 5171v19) Page 1 of 9
Texas Commission on Environmental Quality Form PI-1 General Application for
Air Preconstruction Permit and Amendment
Important Note: The agency requires that a Core Data Form be submitted on all incoming applications unless a Regulated Entity and Customer Reference Number have been issued and no core data information has changed. For more information regarding the Core Data Form, call (512) 239-5175 or go to www.tceq.texas.gov/permitting/central_registry/guidance.html. I. Applicant Information
A. Company or Other Legal Name: Guadalupe Power Partners LP
Texas Secretary of State Charter/Registration Number (if applicable):
B. Company Official Contact Name: Mr. John Walsh
Title: Director of Operations
Mailing Address: 5740 Weil Road
City: Marion State: Texas ZIP Code: 78124
Telephone No.: 707- 327-8883 Fax No.: 832-442-3259 E-mail Address: [email protected]
C. Technical Contact Name: Mr. Bill Skinner
Title: Director of Engineering
Company Name: Navasota Energy
Mailing Address: 403 Corporate Woods
City: Magnolia State: Texas ZIP Code: 77354
Telephone No.: 281-252-5221 Fax No.: 832-442-3259 E-mail Address: [email protected]
D. Site Name: Guadalupe Generating Station
E. Area Name/Type of Facility: Combustion Turbines CTG-7 and CTG-8 Permanent Portable
F. Principal Company Product or Business: Electrical Power Generation
Principal Standard Industrial Classification Code (SIC): 4911
Principal North American Industry Classification System (NAICS): 221112
G. Projected Start of Construction Date: October 2013
Projected Start of Operation Date: March 2014
H. Facility and Site Location Information (If no street address, provide clear driving directions to the site in writing.):
Street Address: 5740 Weil Road
City/Town: Marion County: Guadalupe ZIP Code: 78124
Latitude (nearest second): 29.625517 Longitude (nearest second): 98.145064
TCEQ – 10252 (Revised 07/12) PI-1 Form Y:\GDP-12\NAVAS\GUAD\GHG-PSD_A.DOCX—110512 This form is for use by facilities subject to air quality permit requirements and may be revised periodically. (APDG 5171v19) Page 2 of 9
Texas Commission on Environmental Quality Form PI-1 General Application for
Air Preconstruction Permit and Amendment
I. Applicant Information (continued)
I. Account Identification Number (leave blank if new site or facility):
J. Core Data Form.
Is the Core Data Form (Form 10400) attached? If No, provide customer reference number and regulated entity number (complete K and L).
YES NO
K. Customer Reference Number (CN): 600132120
L. Regulated Entity Number (RN):100225820
II. General Information
A. Is confidential information submitted with this application? If Yes, mark each confidential page confidential in large red letters at the bottom of each page.
YES NO
B. Is this application in response to an investigation or enforcement action? If Yes, attach a copy of any correspondence from the agency.
YES NO
C. Number of New Jobs:
D. Provide the name of the State Senator and State Representative and district numbers for this facility site:
Senator: Jeff Wentworth District No.: 25
Representative: John Kuempel District No.: 44
III. Type of Permit Action Requested
A. Mark the appropriate box indicating what type of action is requested.
Initial Amendment Revision (30 TAC 116.116(e)) Change of Location Relocation
B. Permit Number (if existing):
C. Permit Type: Mark the appropriate box indicating what type of permit is requested. (check all that apply, skip for
change of location)
Construction Flexible Multiple Plant Nonattainment Prevention of Significant Deterioration
Hazardous Air Pollutant Major Source Plant-Wide Applicability Limit
Other:
D. Is a permit renewal application being submitted in conjunction with this amendment in accordance with 30 TAC 116.315(c).
YES NO

TCEQ – 10252 (Revised 07/12) PI-1 Form Y:\GDP-12\NAVAS\GUAD\GHG-PSD_A.DOCX—110512 This form is for use by facilities subject to air quality permit requirements and may be revised periodically. (APDG 5171v19) Page 3 of 9
Texas Commission on Environmental Quality Form PI-1 General Application for
Air Preconstruction Permit and Amendment
III. Type of Permit Action Requested (continued)
E. Is this application for a change of location of previously permitted facilities? If Yes, complete III.E.1 - III.E.4.
YES NO
1. Current Location of Facility (If no street address, provide clear driving directions to the site in writing.):
Street Address:
City: County: ZIP Code:
2. Proposed Location of Facility (If no street address, provide clear driving directions to the site in writing.):
Street Address:
City: County: ZIP Code:
3. Will the proposed facility, site, and plot plan meet all current technical requirements of the permit special conditions? If No, attach detailed information.
YES NO
4. Is the site where the facility is moving considered a major source of criteria pollutants or HAPs?
YES NO
F. Consolidation into this Permit: List any standard permits, exemptions or permits by rule to be consolidated into this permit including those for planned maintenance, startup, and shutdown.
List:
G. Are you permitting planned maintenance, startup, and shutdown emissions? If Yes, attach information on any changes to emissions under this application as specified in VII and VIII.
YES NO
H. Federal Operating Permit Requirements (30 TAC Chapter 122 Applicability)
Is this facility located at a site required to obtain a federal operating permit? If Yes, list all associated permit number(s), attach pages as needed).
YES NO To be determined
Associated Permit No (s.): O-02071
1. Identify the requirements of 30 TAC Chapter 122 that will be triggered if this application is approved.
FOP Significant Revision FOP Minor Application for an FOP Revision To Be Determined
Operational Flexibility/Off-Permit Notification Streamlined Revision for GOP None

TCEQ – 10252 (Revised 07/12) PI-1 Form Y:\GDP-12\NAVAS\GUAD\GHG-PSD_A.DOCX—110512 This form is for use by facilities subject to air quality permit requirements and may be revised periodically. (APDG 5171v19) Page 4 of 9
Texas Commission on Environmental Quality Form PI-1 General Application for
Air Preconstruction Permit and Amendment
III. Type of Permit Action Requested (continued)
H. Federal Operating Permit Requirements (30 TAC Chapter 122 Applicability) (continued)
2. Identify the type(s) of FOP(s) issued and/or FOP application(s) submitted/pending for the site. (check all that apply)
GOP Issued GOP application/revision application submitted or under APD review
SOP Issued SOP application/revision application submitted or under APD review
IV. Public Notice Applicability
A. Is this a new permit application or a change of location application? YES NO
B. Is this application for a concrete batch plant? If Yes, complete V.C.1 – V.C.2. YES NO
C. Is this an application for a major modification of a PSD, nonattainment, FCAA 112(g) permit, or exceedance of a PAL permit?
YES NO
D. Is this application for a PSD or major modification of a PSD located within 100 kilometers or less of an affected state or Class I Area?
YES NO
If Yes, list the affected state(s) and/or Class I Area(s).
E. Is this a state permit amendment application? If Yes, complete IV.E.1. – IV.E.3. No
1. Is there any change in character of emissions in this application? YES NO
2. Is there a new air contaminant in this application? YES NO
3. Do the facilities handle, load, unload, dry, manufacture, or process grain, seed, legumes, or vegetables fibers (agricultural facilities)?
YES NO
F. List the total annual emission increases associated with the application (list all that apply and attach additional
sheets as needed): (maximum emissions of all four CT manufacturers and models)
Volatile Organic Compounds (VOC): 25.9 tons per year
Sulfur Dioxide (SO2): 6.8 tons per year
Carbon Monoxide (CO): 198.0 tons per year
Nitrogen Oxides (NOx): 171.9 tons per year
Particulate Matter (PM): 11.8 tons per year (filterable only)
PM 10 microns or less (PM10): 23.3 tons per year (filterable and condensable)
PM 2.5 microns or less (PM2.5): 23.3 tons per year (filterable and condensable)
Lead (Pb): Negligible
Hazardous Air Pollutants (HAPs): 3.2 tons per year (Total HAPs)
Other speciated air contaminants not listed above: GHG (as CO2e) – 682,065 tons per year

TCEQ – 10252 (Revised 07/12) PI-1 Form Y:\GDP-12\NAVAS\GUAD\GHG-PSD_A.DOCX—110512 This form is for use by facilities subject to air quality permit requirements and may be revised periodically. (APDG 5171v19) Page 5 of 9
Texas Commission on Environmental Quality Form PI-1 General Application for
Air Preconstruction Permit and Amendment
V. Public Notice Information (complete if applicable)
A. Public Notice Contact Name: Mr. Bill Skinner
Title: Director of Engineering
Mailing Address: 403 Corporate Woods Drive
City: Magnolia State: Texas ZIP Code: 77354
Telephone No.: 281-252-5221
B. Name of the Public Place: Seguin-Guadalupe County Public Library
Physical Address (No P.O. Boxes): 707 East College Street
City: Seguin County: Guadalupe ZIP Code: 78155
The public place has granted authorization to place the application for public viewing and copying. YES NO
The public place has internet access available for the public. YES NO
C. Concrete Batch Plants, PSD, and Nonattainment Permits
1. County Judge Information (For Concrete Batch Plants and PSD and/or Nonattainment Permits) for this facility site.
The Honorable: Charles Willmann
Mailing Address: 211 West Court Street
City: Seguin State: Texas ZIP Code: 78155
2. Is the facility located in a municipality or an extraterritorial jurisdiction of a municipality? (For Concrete Batch Plants)
YES NO
Presiding Officers Name(s):
Title:
Mailing Address:
City: State: ZIP Code:
3. Provide the name, mailing address of the chief executive of the city for the location where the facility is or will be located. Not Applicable
Chief Executive:
Mailing Address:
City: State: ZIP Code:

TCEQ – 10252 (Revised 07/12) PI-1 Form Y:\GDP-12\NAVAS\GUAD\GHG-PSD_A.DOCX—110512 This form is for use by facilities subject to air quality permit requirements and may be revised periodically. (APDG 5171v19) Page 6 of 9
Texas Commission on Environmental Quality Form PI-1 General Application for
Air Preconstruction Permit and Amendment
V. Public Notice Information (complete if applicable) (continued)
3. Provide the name, mailing address of the Indian Governing Body for the location where the facility is or will be located. (continued) Not Applicable
Name of the Indian Governing Body:
Title:
Mailing Address:
City: State: ZIP Code:
D. Bilingual Notice
Is a bilingual program required by the Texas Education Code in the School District? YES NO
Are the children who attend either the elementary school or the middle school closest to your facility eligible to be enrolled in a bilingual program provided by the district?
YES NO
If Yes, list which languages are required by the bilingual program? Spanish
VI. Small Business Classification (Required)
A. Does this company (including parent companies and subsidiary companies) have fewer than 100 employees or less than $6 million in annual gross receipts?
YES NO
B. Is the site a major stationary source for federal air quality permitting? YES NO
C. Are the site emissions of any regulated air pollutant greater than or equal to 50 tpy? YES NO
D. Are the site emissions of all regulated air pollutants combined less than 75 tpy? YES NO
VII. Technical Information
A. The following information must be submitted with your Form PI-1 (this is just a checklist to make sure you have included everything)
1. Current Area Map
2. Plot Plan
3. Existing Authorizations
4. Process Flow Diagram
5. Process Description
6. Maximum Emissions Data and Calculations
7. Air Permit Application Tables
a. Table 1(a) (Form 10153) entitled, Emission Point Summary
b. Table 2 (Form 10155) entitled, Material Balance
c. Other equipment, process or control device tables
TCEQ – 10252 (Revised 07/12) PI-1 Form Y:\GDP-12\NAVAS\GUAD\GHG-PSD_A.DOCX—110512 This form is for use by facilities subject to air quality permit requirements and may be revised periodically. (APDG 5171v19) Page 7 of 9
Texas Commission on Environmental Quality
Form PI-1 General Application for Air Preconstruction Permit and Amendment
VII. Technical Information
B. Are any schools located within 3,000 feet of this facility? YES NO
C. Maximum Operating Schedule:
Hours: 2,500 per year Day(s): 7 per week Week(s): 52 per year Year(s):[Life of Plant or blank??]
Seasonal Operation? If Yes, please describe in the space provide below. YES NO
D. Have the planned MSS emissions been previously submitted as part of an emissions inventory? YES NO
Provide a list of each planned MSS facility or related activity and indicate which years the MSS activities have been included in the emissions inventories. Attach pages as needed.
E. Does this application involve any air contaminants for which a disaster review is required? YES NO
F. Does this application include a pollutant of concern on the Air Pollutant Watch List (APWL)? YES NO
VIII. State Regulatory Requirements Applicants must demonstrate compliance with all applicable state regulations to obtain a permit or amendment. The application must contain detailed attachments addressing applicability or non applicability;
identify state regulations; show how requirements are met; and include compliance demonstrations.
A. Will the emissions from the proposed facility protect public health and welfare, and comply with all rules and regulations of the TCEQ?
YES NO
B. Will emissions of significant air contaminants from the facility be measured? YES NO
C. Is the Best Available Control Technology (BACT) demonstration attached? YES NO
D. Will the proposed facilities achieve the performance represented in the permit application as demonstrated through recordkeeping, monitoring, stack testing, or other applicable methods?
YES NO
IX. Federal Regulatory Requirements Applicants must demonstrate compliance with all applicable federal regulations to obtain a permit or amendment The application must contain detailed attachments addressing applicability or non applicability;
identify federal regulation subparts; show how requirements are met; and include compliance demonstrations.
A. Does Title 40 Code of Federal Regulations Part 60, (40 CFR Part 60) New Source Performance Standard (NSPS) apply to a facility in this application?
YES NO
B. Does 40 CFR Part 61, National Emissions Standard for Hazardous Air Pollutants (NESHAP) apply to a facility in this application?
YES NO
C. Does 40 CFR Part 63, Maximum Achievable Control Technology (MACT) standard apply to a facility in this application?
YES NO

TCEQ – 10252 (Revised 07/12) PI-1 Form Y:\GDP-12\NAVAS\GUAD\GHG-PSD_A.DOCX—110512 This form is for use by facilities subject to air quality permit requirements and may be revised periodically. (APDG 5171v19) Page 8 of 9
Texas Commission on Environmental Quality Form PI-1 General Application for
Air Preconstruction Permit and Amendment
IX. Federal Regulatory Requirements Applicants must demonstrate compliance with all applicable federal regulations to obtain a permit or amendment The application must contain detailed attachments addressing applicability or non applicability;
identify federal regulation subparts; show how requirements are met; and include compliance demonstrations.
D. Do nonattainment permitting requirements apply to this application? YES NO
E. Do prevention of significant deterioration permitting requirements apply to this application? YES NO
F. Do Hazardous Air Pollutant Major Source [FCAA 112(g)] requirements apply to this application?
YES NO
G. Is a Plant-wide Applicability Limit permit being requested? YES NO
X. Professional Engineer (P.E.) Seal
Is the estimated capital cost of the project greater than $2 million dollars? YES NO
If Yes, submit the application under the seal of a Texas licensed P.E.
XI. Permit Fee Information
Check, Money Order, Transaction Number ,ePay Voucher Number: Fee Amount: Not Applicable
Company name on check: Guadalupe Power Partners LP Paid online?: YES NO
Is a copy of the check or money order attached to the original submittal of this application?
YES NO N/A
Is a Table 30 (Form 10196) entitled, Estimated Capital Cost and Fee Verification, attached?
YES NO N/A

XII. Delinquent Fees and Penalties
Texas Commission on Environmental Quality Form PI-l General Application for
Air Preconstruction Permit and Amendment
This fonn will not be processed until all delinquent fees and/or penalties owed to the TCEQ or the Office of the Attorney General on behalf of the TCEQ is paid in accordance with the Delinquent Fee and Penalty Protocol. For more infonnation regarding Delinquent Fees and Penalties, go to the TCEQ Web site at: www.tceq.texas.gov/agency/delin/index.html .
XIII. Signature
The signature below confinns that I have knowledge of the facts included in this application and that these facts are true and correct to the best of my knowledge and belief. I further state that to the best of my knowledge and belief, the project for which application is made will not in any way violate any provision of the Texas Water Code (TWC), Chapter 7, Texas Clean Air Act (TCAA), as amended, or any of the air quality rules and regulations of the Texas Commission on Environmental Quality or any local governmental ordinance or resolution enacted pursuant to the TCAA I further state that I understand my signature indicates that this application meets all applicable nonattainment, prevention of significant deterioration, or major source of hazardous air pollutant pennitting requirements. The signature further signifies awareness that intentionally or knowingly making or causing to be made false material statements or representations in the application is a criminal offense subject to criminal penalties.
Name: John Walsh
Signature: tiL ~ ~ Original Signature Required
Date: /~/~/2P/2
TCEQ-10252 (Revised 07112) PI-I Form This form is for use by facilities subject to air quality permit requirements and may be revised periodically. (APDG 5171v19)
Y IGDP· 12 AVAS .GUADIGHG.PSD_A DOCX- IIOSI2
Page 9 of9

APPENDIX B
EMISSIONS CALCULATIONS

Table B-1. Potential Greenhouse Gas (GHG) Emissions: Navasota Guadalupe - GE 7FA.03 CTs
CO2eOperating Potential Emissions Emissions Emissions Potential
Hours Heat Input Factor‡ Factor § Factor § EmissionsSource LHV * HHV † (hr/yr) (MMBtu/yr) (kg/MMBtu) CO2 CO2e ¥ (kg/MMBtu) CH4 CO2e ¥ (kg/MMBtu) N2O CO2e ¥ (short tpy)CTG-7 1,578 1,748 2,500 4,369,877 53.02 255,439 255,439 1.0E-03 5 101 1.0E-04 0 149 255,690CTG-8 1,578 1,748 2,500 4,369,877 53.02 255,439 255,439 1.0E-03 5 101 1.0E-04 0 149 255,690FWP-2 NA 1.92 500 960 73.96 78.3 78.3 3.0E-03 0.0 0.1 6.0E-04 0.0 0.2 78.5
Total CO2e Potential Annual Emissions 511,458
EmissionsNumber Factor per Number
of Component of Per AnnualComponent Components (scf/hr) £ CO2 ∂ CH4 ∂ CO2e ¥ Circuit Component Total Leak Rate CO2e ¥
Valve 50 0.121 0.03 1.08 22.7 Breakers (lb) (lb) (%) lb/yr tpy tpyFlange 200 0.017 0.02 0.61 12.8 2 690 1380.00 0.50 6.9 0.00345 82.5
Relief valve 10 0.193 0.01 0.34 7.2 Total 82.5Total 42.7
Annual ¥(tpy)
511,458794382 `
511,662
*Based on 100-percent load at 59°F.†HHV based on HHV/LHV ratio of 1.1077.‡Mandatory Reporting of Greenhouse Gases, Final Rule; Federal Register Vol. 74, No. 209, October 30, 2009, Table C-1 to Subpart C of Part 98.§Mandatory Reporting of Greenhouse Gases, Final Rule; Federal Register Vol. 74, No. 209, October 30, 2009, Table C-2 to Subpart C of Part 98.¥Based on global warming potential of 1 for CO2, 21 for CH4, 310 for N2O, and 23,900 for SF6.£Based on 40 CFR 98, Table W-1a for Western United States.∂Based on natural gas composition of 98-percent CH4 and 1-percent CO2.
Sources: GPP, 2012. ECT, 2012.
TotalCircuit breakers
NG piping
CTsFWP-2
Potential CO2e Emissions from Natural Gas Piping Components
Total Facility Potential CO2e Emissions
SF6
Annual Emissions (tpy)
Potential CO2e Emissions from Circuit Breakers Quantity
SF6 Insulating GasAnnual Emissions
Potential Carbon Dioxide Equivalent (CO2e) Emissions from the Combustion Sources
Emissions
CO2 CH4 N2OMaximum AnnualPotential EmissionsPotential EmissionsPotential Emissions
(MMBtu/hr)Heat Input
(short tpy) (short tpy)(short tpy)
Y:\GDP-12\NAVAS\GUAD\GHG-PSD_B.XLSX/7FA.03—11/5/2012

Table B-2. Potential Greenhouse Gas (GHG) Emissions: Navasota Guadalupe - GE 7FA.04 CTs
CO2eOperating Potential Emissions Emissions Emissions Potential
Hours Heat Input Factor‡ Factor § Factor § EmissionsSource LHV * HHV † (hr/yr) (MMBtu/yr) (kg/MMBtu) CO2 CO2e ¥ (kg/MMBtu) CH4 CO2e ¥ (kg/MMBtu) N2O CO2e ¥ (short tpy)CTG-7 1,613 1,787 2,500 4,466,800 53.02 261,105 261,105 1.0E-03 5 103 1.0E-04 0 153 261,361CTG-8 1,613 1,787 2,500 4,466,800 53.02 261,105 261,105 1.0E-03 5 103 1.0E-04 0 153 261,361FWP-2 NA 1.92 500 960 73.96 78.3 78.3 3.0E-03 0.0 0.1 6.0E-04 0.0 0.2 78.5
Total CO2e Potential Annual Emissions 522,800
EmissionsNumber Factor per Number
of Component of Per AnnualComponent Components (scf/hr) £ CO2 ∂ CH4 ∂ CO2e ¥ Circuit Component Total Leak Rate CO2e ¥
Valve 50 0.121 0.03 1.08 22.7 Breakers (lb) (lb) (%) lb/yr tpy tpyFlange 200 0.017 0.02 0.61 12.8 2 690 1380.00 0.50 6.9 0.00345 82.5
Relief valve 10 0.193 0.01 0.34 7.2 Total 82.5Total 42.7
Annual ¥(tpy)
522,800794382
523,004
*Based on 100-percent load at 59°F.†HHV based on HHV/LHV ratio of 1.1077.‡Mandatory Reporting of Greenhouse Gases, Final Rule; Federal Register Vol. 74, No. 209, October 30, 2009, Table C-1 to Subpart C of Part 98.§Mandatory Reporting of Greenhouse Gases, Final Rule; Federal Register Vol. 74, No. 209, October 30, 2009, Table C-2 to Subpart C of Part 98.¥Based on global warming potential of 1 for CO2, 21 for CH4, 310 for N2O, and 23,900 for SF6.£Based on 40 CFR 98, Table W-1a for Western United States.∂Based on natural gas composition of 98-percent CH4 and 1-percent CO2.
Sources: GPP, 2012. ECT, 2012.
Potential CO2e Emissions from Natural Gas Piping Components Potential CO2e Emissions from Circuit Breakers
Total
QuantitySF6 Insulating Gas
Annual Emissions (tpy) Annual EmissionsSF6
Total Facility Potential CO2e Emissions
CTs
NG pipingCircuit breakers
FWP-2
Potential Carbon Dioxide Equivalent (CO2e) Emissions from the Combustion Sources
Emissions
Maximum Annual CO2 CH4 N2OHeat Input Potential Emissions Potential Emissions Potential Emissions
(MMBtu/hr) (short tpy) (short tpy) (short tpy)
Y:\GDP-12\NAVAS\GUAD\GHG-PSD_B.XLSX/7FA.04—11/5/2012

Table B-3. Potential Greenhouse Gas (GHG) Emissions: Navasota Guadalupe - GE 7FA.05 CTs
CO2eOperating Potential Emissions Emissions Emissions Potential
Hours Heat Input Factor‡ Factor § Factor § EmissionsSource LHV * HHV † (hr/yr) (MMBtu/yr) (kg/MMBtu) CO2 CO2e ¥ (kg/MMBtu) CH4 CO2e ¥ (kg/MMBtu) N2O CO2e ¥ (short tpy)CTG-7 1,856 2,056 2,500 5,139,728 53.02 300,440 300,440 1.0E-03 6 119 1.0E-04 1 176 300,735CTG-8 1,856 2,056 2,500 5,139,728 53.02 300,440 300,440 1.0E-03 6 119 1.0E-04 1 176 300,735FWP-2 NA 1.92 500 960 73.96 78.3 78.3 3.0E-03 0.0 0.1 6.0E-04 0.0 0.2 78.5
Total CO2e Potential Annual Emissions 601,549
EmissionsNumber Factor per Number
of Component of Per AnnualComponent Components (scf/hr) £ CO2 ∂ CH4 ∂ CO2e ¥ Circuit Component Total Leak Rate CO2e ¥
Valve 50 0.121 0.03 1.08 22.7 Breakers (lb) (lb) (%) lb/yr tpy tpyFlange 200 0.017 0.02 0.61 12.8 2 690 1380.00 0.50 6.9 0.00345 82.5
Relief valve 10 0.193 0.01 0.34 7.2 Total 82.5Total 42.7
Annual ¥(tpy)
601,549794382
601,753
*Based on 100-percent load at 59°F.†HHV based on HHV/LHV ratio of 1.1077.‡Mandatory Reporting of Greenhouse Gases, Final Rule; Federal Register Vol. 74, No. 209, October 30, 2009, Table C-1 to Subpart C of Part 98.§Mandatory Reporting of Greenhouse Gases, Final Rule; Federal Register Vol. 74, No. 209, October 30, 2009, Table C-2 to Subpart C of Part 98.¥Based on global warming potential of 1 for CO2, 21 for CH4, 310 for N2O, and 23,900 for SF6.£Based on 40 CFR 98, Table W-1a for Western United States.∂Based on natural gas composition of 98-percent CH4 and 1-percent CO2.
Sources: GPP, 2012. ECT, 2012.
Potential CO2e Emissions from Natural Gas Piping Components Potential CO2e Emissions from Circuit Breakers
Total
QuantitySF6 Insulating Gas
Annual Emissions (tpy) Annual EmissionsSF6
Total Facility Potential CO2e Emissions
CTs
NG pipingCircuit breakers
FWP-2
Potential Carbon Dioxide Equivalent (CO2e) Emissions from the Combustion Sources
Emissions
Maximum Annual CO2 CH4 N2OHeat Input Potential Emissions Potential Emissions Potential Emissions
(MMBtu/hr) (short tpy) (short tpy) (short tpy)
Y:\GDP-12\NAVAS\GUAD\GHG-PSD_B.XLSX/7FA.05—11/5/2012

Table B-4. Potential Greenhouse Gas (GHG) Emissions: Navasota Guadalupe - SW 5000F(5) CTs
CO2eOperating Potential Emissions Emissions Emissions Potential
Hours Heat Input Factor‡ Factor § Factor § EmissionsSource LHV * HHV † (hr/yr) (MMBtu/yr) (kg/MMBtu) CO2 CO2e ¥ (kg/MMBtu) CH4 CO2e ¥ (kg/MMBtu) N2O CO2e ¥ (short tpy)CTG-7 2,104 2,331 2,500 5,826,502 53.02 340,586 340,586 1.0E-03 6 135 1.0E-04 1 199 340,920CTG-8 2,104 2,331 2,500 5,826,502 53.02 340,586 340,586 1.0E-03 6 135 1.0E-04 1 199 340,920FWP-2 NA 1.92 500 960 73.96 78.3 78.3 3.0E-03 0.0 0.1 6.0E-04 0.0 0.2 78.5
Total CO2e Potential Annual Emissions 681,918
EmissionsNumber Factor per Number
of Component of Per AnnualComponent Components (scf/hr) £ CO2 ∂ CH4 ∂ CO2e ¥ Circuit Component Total Leak Rate CO2e ¥
Valve 50 0.121 0.03 1.08 22.7 Breakers (lb) (lb) (%) lb/yr tpy tpyFlange 200 0.017 0.02 0.61 12.8 2 690 1380.00 0.50 6.9 0.00345 82.5
Relief valve 10 0.193 0.01 0.34 7.2 Total 82.5Total 42.7
Annual ¥(tpy)
681,918794382
682,121
*Based on 100-percent load at 59°F.†HHV based on HHV/LHV ratio of 1.1077.‡Mandatory Reporting of Greenhouse Gases, Final Rule; Federal Register Vol. 74, No. 209, October 30, 2009, Table C-1 to Subpart C of Part 98.§Mandatory Reporting of Greenhouse Gases, Final Rule; Federal Register Vol. 74, No. 209, October 30, 2009, Table C-2 to Subpart C of Part 98.¥Based on global warming potential of 1 for CO2, 21 for CH4, 310 for N2O, and 23,900 for SF6.£Based on 40 CFR 98, Table W-1a for Western United States.∂Based on natural gas composition of 98-percent CH4 and 1-percent CO2.
Sources: GPP, 2012. ECT, 2012.
Potential CO2e Emissions from Natural Gas Piping Components Potential CO2e Emissions from Circuit Breakers
Total
QuantitySF6 Insulating Gas
Annual Emissions (tpy) Annual EmissionsSF6
Total Facility Potential CO2e Emissions
CTs
NG pipingCircuit breakers
FWP-2
Potential Carbon Dioxide Equivalent (CO2e) Emissions from the Combustion Sources
Emissions
Maximum Annual CO2 CH4 N2OHeat Input Potential Emissions Potential Emissions Potential Emissions
(MMBtu/hr) (short tpy) (short tpy) (short tpy)
Y:\GDP-12\NAVAS\GUAD\GHG-PSD_B.XLSX/5000F(5)—11/5/2012

APPENDIX C
TEXAS PROFESSIONAL ENGINEER CERTIFICATION
TEXAS PROFESSIONAL ENGINEER CERTIFICATION
I, the undersigned, hereby certify that, to the best of my knowledge, any greenhouse gas
emissions estimates reported or relied upon in this application are true, accurate, and
complete and are based on reasonable techniques available for calculating greenhouse gas
emissions.
Jeffrey L. Meling, P.E. Senior Vice President Environmental Consulting & Technology, Inc.
Date ] I
Y" GDP-12INA V AS'.GUADlGHG-PSD.DOCX- 110512

APPENDIX D
GUADALUPE COUNTY LIST OF RARE SPECIES

APPENDIX DGuadalupe County List of Rare Species (Continued, Page 1 of 2)
Common Name Scientific NameUSFWS Status
TPWD Status
BirdsAmerican peregrine falcon Falco peregrinus anatum DL TArctic peregrine falcon Falco peregrinus tundrius DL —Bald eagle Haliaeetus leucocephalus DL TInterior least tern Sterna antillarum athalassos E EMountain plover Charadrius montanus — —Peregrine falcon Falco peregrinus DL TSprague's pipit Anthus spragueii CWestern burrowing owl Athene cunicularia hypugaea — —Whooping crane Grus americana E EWood stork Mycteria americana T
FishesGuadalupe bass Micropterus treculii — —Guadalupe darter Percina sciera apristis — —
InsectsMayfly Campsurus decoloratus — —
MammalsCave myotis bat Myotis velifer — —Plains spotted skunk Spilogale putorius interrupta — —Red wolf Canis rufus E E
MollusksCreeper (squawfoot) Strophitus undulatus — —False spike mussel Quadrula mitchelli — TGolden orb Quadrula aurea C TTexas fatmucket Lampsilis bracteata C TTexas pimpleback Quadrula petrina C T
ReptilesCagle's map turtle Graptemys caglei — TSpot-tailed earless lizard Holbrookia lacerata — —Texas garter snake Thamnophis sirtalis annectens — —Texas horned lizard Phrynosoma cornutum — TTexas tortoise Gopherus berlandieri — TTimber/Canebrake rattlesnake Crotalus horridus — T
Y:\GDP-12\NAVAS\GUAD\GHG-PSD_D.XLSX—11/5/2012

APPENDIX DGuadalupe County List of Rare Species (Continued, Page 2 of 2)
Common Name Scientific NameUSFWS Status
TPWD Status
PlantsBig red sage Salvia pentstemonoides — —Elmendorf's onion Allium elmendorfii — —Green beebalm Monarda viridissima — —Parks' jointweed Polygonella parksii — —Sandhill woollywhite Hymenopappus carrizoanus — —
Note: DL = delisted.T = threatened.E = endangered.C = candidate for listing.
Source: http://www.tpwd.state.tx.us/gis/ris/es/ES_Reports.aspx?county=Guadalupe, 2012.
Y:\GDP-12\NAVAS\GUAD\GHG-PSD_D.XLSX—11/5/2012