gtm research presentation: the evolution of the u.s. solar market
TRANSCRIPT

The Evolution of The U.S. Solar Market
Shayle KannSenior Vice President, ResearchGTM Solar SummitApril 2015

www.gtmresearch.com
The First U.S. Solar Wave By the Numbers
-2-Source: GTM Research/SEIA U.S. Solar Market Insight
Start Of 2010 Start Of 2015
1.2 GW Operating
18.3 GW Operating
15X Growth in Five Years

Solar Project Utility
Solar Customer

Utility-Scale Solar

www.gtmresearch.com
Utility Solar PPA Prices Now Consistently Below $70/MWh
-5-
2008 2009 2010 2011 2012 2013 2014 2015$0
$25
$50
$75
$100
$125
$150
$175
$200
Contract Execution Date
PPA
Pri
ce (
$/M
Wh
)
Source: GTM Research U.S. Utility PV Tracker
www.gtmresearch.com
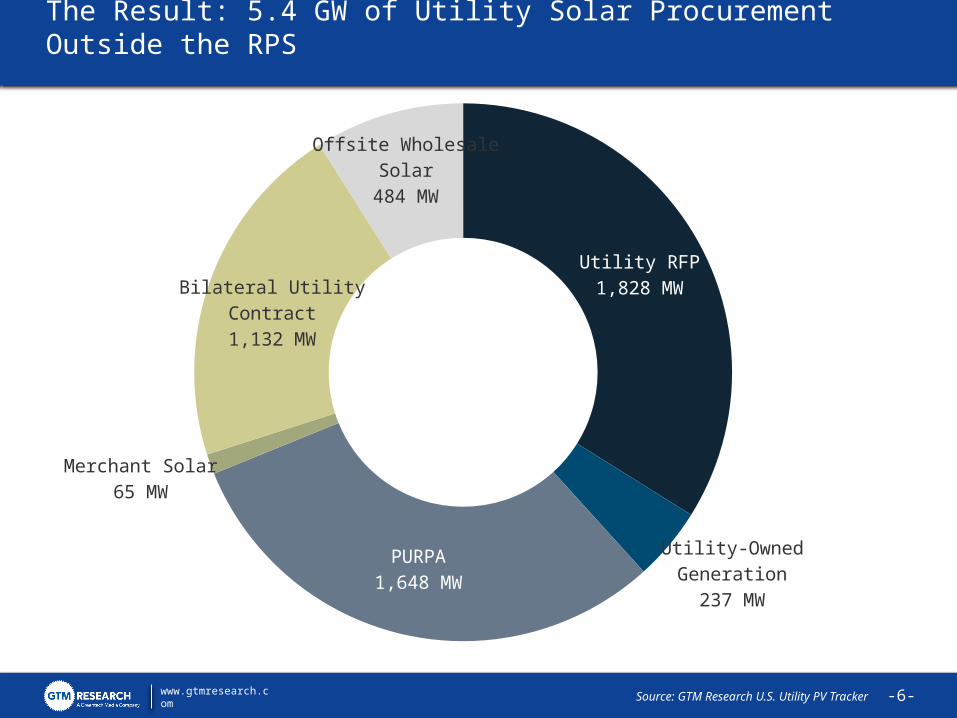
The Result: 5.4 GW of Utility Solar Procurement Outside the RPS
-6-
Utility RFP1,828 MW
Utility-Owned Generation237 MW
PURPA1,648 MW
Merchant Solar65 MW
Bilateral Utility Contract1,132 MW
Offsite Wholesale Solar484 MW
Source: GTM Research U.S. Utility PV Tracker

www.gtmresearch.com
Large-Scale Solar: It’s Not Just For Utilities Anymore
-7-
130 MW, 25 year PPA from California Flats project
3 MW, 2 year PPA from 21 MW Barilla project
110 MW, 20 year PPA from 485 MW Blythe project
80 MW, 25 year PPA from two projects in Fresno County 4.3 MW, 25 year PPA from project in MA
Source: GTM Research U.S. Utility PV Tracker

Distributed Solar

www.gtmresearch.com
Residential Solar’s Limits
-9-
U.S. Households
…That Own Their Home…
...In the 20 States With A
Solar Market…
…With a FICO Score Over
680…
…With a Solar-Friendly Roof
0
20
40
60
80
100
120113
73
38
29
9
Ho
use
ho
lds
(Mill
ion
)
Community Solar
Recent activity in NM, TX, SC
Source: GTM Research, U.S. Census Bureau

www.gtmresearch.com
Enter Community Solar
-10-
2013 2014 2015E 2016E0
50
100
150
200
250
300
5.220.2
148.2
280.9
Colorado Massachusetts Minnesota California Other Markets
Com
munit
y Sola
r In
stalla
tions
(MW
)
Upfront fee or Monthly Payment
On-Bill Credits
Developer
• Incentives• Wholesale rate for
unsubscribed power
Delivery and Admin Charge
Utility Subscriber
Source: GTM Research

www.gtmresearch.com
DG Compensation Is Getting More Complex
-11-
Below Retail Rate Retail Rate Varies No NEM
CA and HI: Ongoing discussion of NEM 2.0
MN, Austin, TX: Value-of-solar tariffsVOST bills pending in MI, CT
>5 States: Current docket re: fixed charges
SRP: Among the first residential demand charges
NY: REV Initiative – many possibilities
Source: GTM Research

What Happens if Solar Exports Lose Full Retail Credit?

www.gtmresearch.com
Southern California Edison: A Case Study
Customer Profile
Customer Type Large Residential
Utility Southern California Edison
Tariff Time of Use, Option B
Year of Installation 2016
Scenario 1 - Today
Full Retail NEM
Weighted Avg. Electricity Price: $0.20/kWh
Optional Time-of-Use Pricing
Scenario 2 - Theoretical
PV Export Price Drops to $0.10/kWh
-13-Source: GTM Research

www.gtmresearch.com
How Residential Energy Storage Actually Works
-14-
1:0
0 A
M
3:0
0 A
M
5:0
0 A
M
7:0
0 A
M
9:0
0 A
M
11:0
0 A
M
1:0
0 P
M
3:0
0 P
M
5:0
0 P
M
7:0
0 P
M
9:0
0 P
M
11:0
0 P
M
Day
2, hr
1
Day
2, hr
3
Day
2, hr
5
Day
2, hr
7
Day
2, hr
9
Day
2, hr
11
Day
2, hr
13
Day
2, hr
15
Day
2, hr
17
Day
2, hr
19
Day
2, hr
21
Day
2, hr
23
0.0
0.5
1.0
1.5
2.0
2.5
Baseline Load
Ele
ctri
city
Consu
mption
(kW
h)
Source: GTM Research

www.gtmresearch.com
How Residential Energy Storage Actually Works
-15-
1:0
0 A
M
3:0
0 A
M
5:0
0 A
M
7:0
0 A
M
9:0
0 A
M
11:0
0 A
M
1:0
0 P
M
3:0
0 P
M
5:0
0 P
M
7:0
0 P
M
9:0
0 P
M
11:0
0 P
M
Day
2, hr
1
Day
2, hr
3
Day
2, hr
5
Day
2, hr
7
Day
2, hr
9
Day
2, hr
11
Day
2, hr
13
Day
2, hr
15
Day
2, hr
17
Day
2, hr
19
Day
2, hr
21
Day
2, hr
23
0.0
0.5
1.0
1.5
2.0
2.5
Baseline Load Net Consumption With Solar
Ele
ctri
city
Consu
mption
(kW
h)
Source: GTM Research

www.gtmresearch.com
0.0
0.5
1.0
1.5
2.0
2.5
3.0
3.5
4.0
Export - Solar Only
Exp
ort
(kW
h)
How Residential Energy Storage Actually Works
-16-
1:0
0 A
M
3:0
0 A
M
5:0
0 A
M
7:0
0 A
M
9:0
0 A
M
11:0
0 A
M
1:0
0 P
M
3:0
0 P
M
5:0
0 P
M
7:0
0 P
M
9:0
0 P
M
11:0
0 P
M
Day
2, hr
1
Day
2, hr
3
Day
2, hr
5
Day
2, hr
7
Day
2, hr
9
Day
2, hr
11
Day
2, hr
13
Day
2, hr
15
Day
2, hr
17
Day
2, hr
19
Day
2, hr
21
Day
2, hr
23
0.0
0.5
1.0
1.5
2.0
2.5
Baseline Load Net Consumption With Solar
Ele
ctri
city
Consu
mption
(kW
h)
Exporting: 8 AM-5 PM
Source: GTM Research

www.gtmresearch.com
0.0
0.5
1.0
1.5
2.0
2.5
3.0
3.5
4.0
0%10%20%30%40%50%60%70%80%90%100%
Export - Solar Only State of Charge (%)
Exp
ort
(kW
h)
Sto
rage S
tate
of
Charg
e
(%)
How Residential Energy Storage Actually Works
-17-
1:0
0 A
M
3:0
0 A
M
5:0
0 A
M
7:0
0 A
M
9:0
0 A
M
11:0
0 A
M
1:0
0 P
M
3:0
0 P
M
5:0
0 P
M
7:0
0 P
M
9:0
0 P
M
11:0
0 P
M
Day
2, hr
1
Day
2, hr
3
Day
2, hr
5
Day
2, hr
7
Day
2, hr
9
Day
2, hr
11
Day
2, hr
13
Day
2, hr
15
Day
2, hr
17
Day
2, hr
19
Day
2, hr
21
Day
2, hr
23
0.0
0.5
1.0
1.5
2.0
2.5
Baseline Load Net Consumption With Solar
Ele
ctri
city
Consu
mption
(kW
h)
Charging: 8 AM-12 PM
Discharging: 4 PM-8 PM
Source: GTM Research

www.gtmresearch.com
0.0
0.5
1.0
1.5
2.0
2.5
3.0
3.5
4.0
Export - Solar Only Export - Solar Plus Storage
Exp
ort
(kW
h)
How Residential Energy Storage Actually Works
-18-
1:0
0 A
M
3:0
0 A
M
5:0
0 A
M
7:0
0 A
M
9:0
0 A
M
11:0
0 A
M
1:0
0 P
M
3:0
0 P
M
5:0
0 P
M
7:0
0 P
M
9:0
0 P
M
11:0
0 P
M
Day
2, hr
1
Day
2, hr
3
Day
2, hr
5
Day
2, hr
7
Day
2, hr
9
Day
2, hr
11
Day
2, hr
13
Day
2, hr
15
Day
2, hr
17
Day
2, hr
19
Day
2, hr
21
Day
2, hr
23
0.0
0.5
1.0
1.5
2.0
2.5
Baseline Load Net Consumption With Solar
Ele
ctri
city
Consu
mption
(kW
h)
Reduce Export Avoid Peak Prices
Source: GTM Research

www.gtmresearch.com
How Residential Energy Storage Actually Works
-19-
1:0
0 A
M
3:0
0 A
M
5:0
0 A
M
7:0
0 A
M
9:0
0 A
M
11:0
0 A
M
1:0
0 P
M
3:0
0 P
M
5:0
0 P
M
7:0
0 P
M
9:0
0 P
M
11:0
0 P
M
Day
2, hr
1
Day
2, hr
3
Day
2, hr
5
Day
2, hr
7
Day
2, hr
9
Day
2, hr
11
Day
2, hr
13
Day
2, hr
15
Day
2, hr
17
Day
2, hr
19
Day
2, hr
21
Day
2, hr
23
0.0
0.5
1.0
1.5
2.0
2.5
Baseline Load Net Consumption With SolarNet Consumption With Solar and Storage
Ele
ctri
city
Consu
mption
(kW
h)
Source: GTM Research
New Load Profile
www.gtmresearch.com
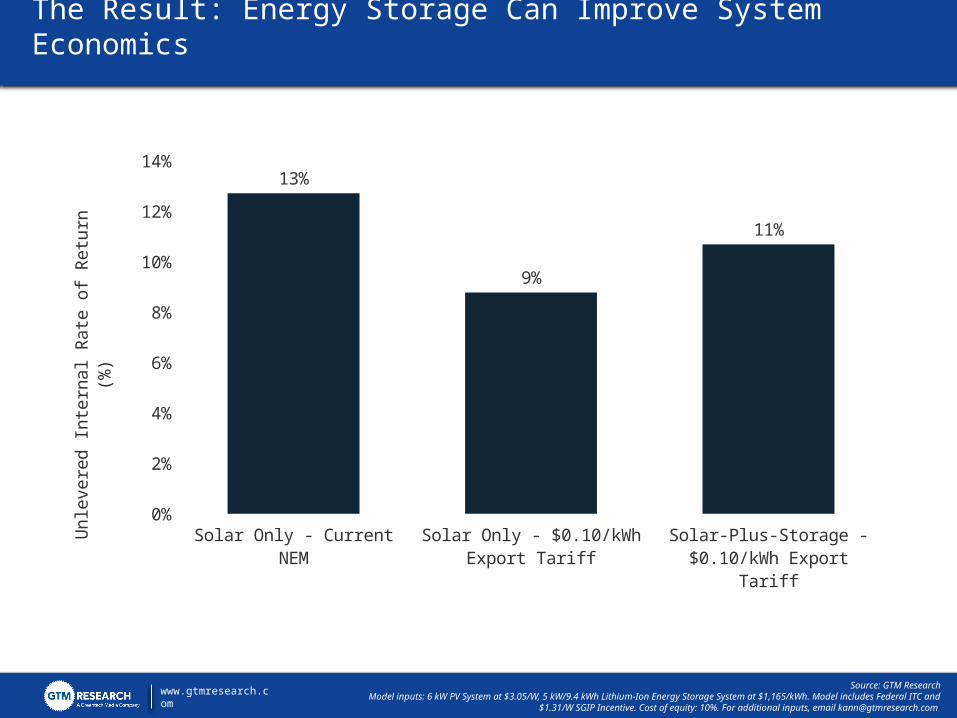
The Result: Energy Storage Can Improve System Economics
Source: GTM ResearchModel inputs: 6 kW PV System at $3.05/W, 5 kW/9.4 kWh Lithium-Ion Energy Storage System at $1,165/kWh. Model includes Federal ITC and
$1.31/W SGIP Incentive. Cost of equity: 10%. For additional inputs, email [email protected]
Solar Only - Current NEM Solar Only - $0.10/kWh Export Tariff
Solar-Plus-Storage - $0.10/kWh Export Tariff
0%
2%
4%
6%
8%
10%
12%
14%13%
9%
11%
Unle
vere
d In
tern
al R
ate
of R
eturn
(%
)
www.gtmresearch.com
0.0
0.5
1.0
1.5
2.0
2.5
3.0
3.5
4.0
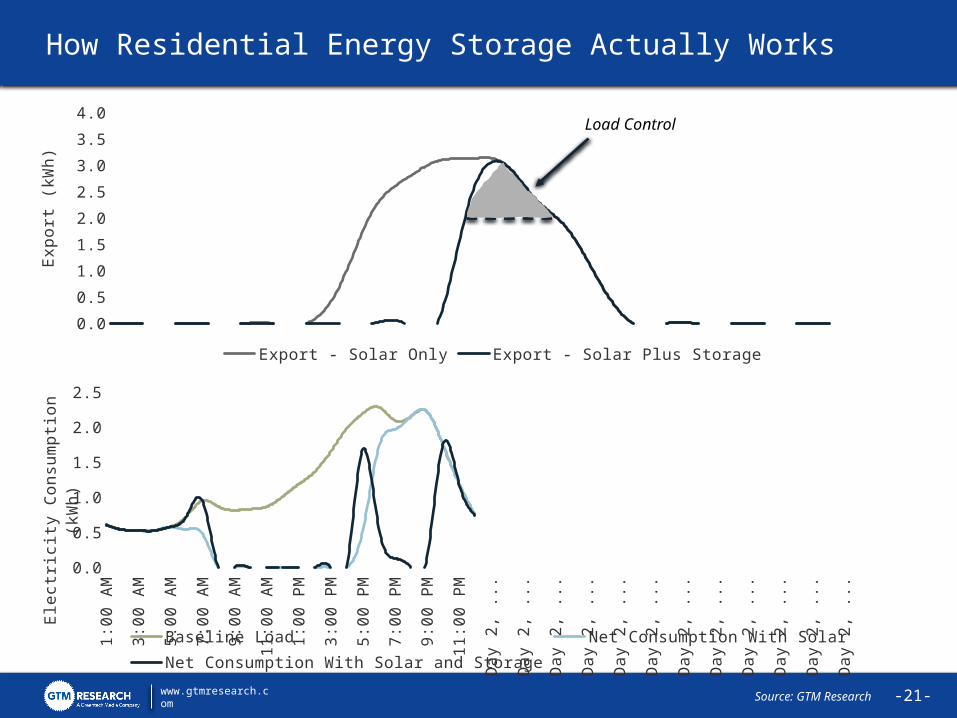
Export - Solar Only Export - Solar Plus Storage
Exp
ort
(kW
h)
How Residential Energy Storage Actually Works
-21-
1:0
0 A
M
3:0
0 A
M
5:0
0 A
M
7:0
0 A
M
9:0
0 A
M
11:0
0 A
M
1:0
0 P
M
3:0
0 P
M
5:0
0 P
M
7:0
0 P
M
9:0
0 P
M
11:0
0 P
M
Day
2, hr
1
Day
2, hr
3
Day
2, hr
5
Day
2, hr
7
Day
2, hr
9
Day
2, hr
11
Day
2, hr
13
Day
2, hr
15
Day
2, hr
17
Day
2, hr
19
Day
2, hr
21
Day
2, hr
23
0.0
0.5
1.0
1.5
2.0
2.5
Baseline Load Net Consumption With SolarNet Consumption With Solar and Storage
Ele
ctri
city
Consu
mption
(kW
h)
Load Control
Source: GTM Research

www.gtmresearch.com -22-
The Emerging Ecosystem of “Solar Plus”
Solar + Energy Management/Load Control
Solar + EV
Solar + Storage
Source: GTM Research

www.gtmresearch.com
What Should Be the Regulated Utility’s Role in Distributed Solar?
-23-
Finance DG, Earn Cost Recovery
Own/Rate Base Full System,
Subcontract Installation
Interconnect, Credit Excess Generation,
Maintain Grid Reliability
Default in Traditional Distributed
Solar Markets
Act As Distribution
System Platform Provider
New York REV Order
Rate-Base Purchased DG Value Streams
SolarCity Proposal (March 2015)
Own/Rate Base Grid-Interactive Portion of Systems
Various Proposals
Own/Rate Base Full
System, Self-Installation
RESIDENTIAL SOLAR
NON-RESIDENTIAL SOLAR
COMMUNITY SOLAR
Utility Program Administration, 3rd Party Project Ownership
Utility Project Ownership Utility Project Ownership and Customer Acquisition
Entirely 3rd Party Entirely Utility-Run
Source: GTM Research

Final Thoughts
Shayle KannSenior Vice President, Research
Greentech Media
Questions? Visit www.gtmresearch.comOr contact [email protected]