gs503 vcf lecture 4 valuation ii 090215
TRANSCRIPT

VALUATION II :VALUATION II :VC METHOD, DCF VC METHOD, DCF & COMPARABLES& COMPARABLES
Prof.Stephen OngProf.Stephen OngBSc(Hons)Econs (LSE), MBA (Bradford)BSc(Hons)Econs (LSE), MBA (Bradford)
Visiting Professor, Shenzhen UniversityVisiting Professor, Shenzhen UniversityAcademic Fellow, Entrepreneurship & Innovation,Academic Fellow, Entrepreneurship & Innovation,
The Lord Ashcroft International Business School, The Lord Ashcroft International Business School, Anglia Ruskin University Cambridge UKAnglia Ruskin University Cambridge UK
MSC TECHNOPRENEURSHIP : MSC TECHNOPRENEURSHIP : VENTURE CAPITAL FINANCINGVENTURE CAPITAL FINANCING

Today’s Overview Today’s Overview

LEARNING OBJECTIVESLEARNING OBJECTIVES
To understand the VC method of To understand the VC method of valuation;valuation;
To discuss the Discounted Cash Flow To discuss the Discounted Cash Flow (DCF) analysis method of growth (DCF) analysis method of growth companies;companies;
To discuss the Comparables Analysis To discuss the Comparables Analysis as an alternative approach. as an alternative approach.

1.Venture Capital Method

The VC Method of ValuationThe VC Method of Valuation
KEY IDEA:KEY IDEA: Estimate the Estimate the value of the company in a value of the company in a successful exit. successful exit. DiscountDiscount that value back to today at that value back to today at a a very high ratevery high rate..

VC Method: Main ElementsVC Method: Main Elements
““Successful” exit valuationSuccessful” exit valuation
Target multiple-of-moneyTarget multiple-of-money
Expected retention percentageExpected retention percentage
Investment recommendationInvestment recommendation

Exit ValuationExit Valuation
We want to estimate the valuation We want to estimate the valuation conditional on a successful outcome.conditional on a successful outcome.
Key distinction is between Key distinction is between absolute absolute valuationvaluation ( (discounted cash flow discounted cash flow analysisanalysis) and ) and relative valuation relative valuation ((comparables analysiscomparables analysis).).

The Standard VC Method (1)The Standard VC Method (1)
Step 1) What is the required Step 1) What is the required investment today? investment today? ( = ( = $I $I ))
Step 2) What is the exit valuation Step 2) What is the exit valuation for this company? for this company? (($ exit valuation)$ exit valuation)
Step 3) What is the target multiple-Step 3) What is the target multiple-of-money on our investment?of-money on our investment? ( (MM) )
Step 4) What is the expected Step 4) What is the expected retention percentage? retention percentage? (retention)(retention)

The Standard VC Method (2)The Standard VC Method (2)Step 5) Estimate the total valuation for Step 5) Estimate the total valuation for
the company todaythe company today: : total valuation = total valuation = $ exit valuation * retention / M.$ exit valuation * retention / M.
Step 6) What is the proposed Step 6) What is the proposed ownership percentage today? ownership percentage today? ((proposed %proposed %))
Step 7) Estimate the partial valuation Step 7) Estimate the partial valuation for this investment: for this investment: partial valuation = partial valuation = proposed % * total valuation.proposed % * total valuation.
Step 8) Investment Recommendation: Step 8) Investment Recommendation: Compare partial valuation to $I.Compare partial valuation to $I.

The Modified VC Method (3)The Modified VC Method (3) Step 8) Estimate the LP cost for the investment: Step 8) Estimate the LP cost for the investment: LP cost = $I (committed capital / investment LP cost = $I (committed capital / investment
capitalcapital Step 9) What is the expected GP% for this Step 9) What is the expected GP% for this
investment? investment? GPGP% = carry% * % = carry% * (GVM*investment capital – carry basis) / (GVM*investment capital – carry basis) / (GVM * investment capital).(GVM * investment capital).
Step 10) Estimate the LP valuation from this Step 10) Estimate the LP valuation from this investment: investment:
LP valuation = (1 – GP%) * partial valuation.LP valuation = (1 – GP%) * partial valuation.
Step 11) Investment Recommendation: Step 11) Investment Recommendation: Compare LP valuation to LP cost. Compare LP valuation to LP cost.

2.DCF Analysis of Growth
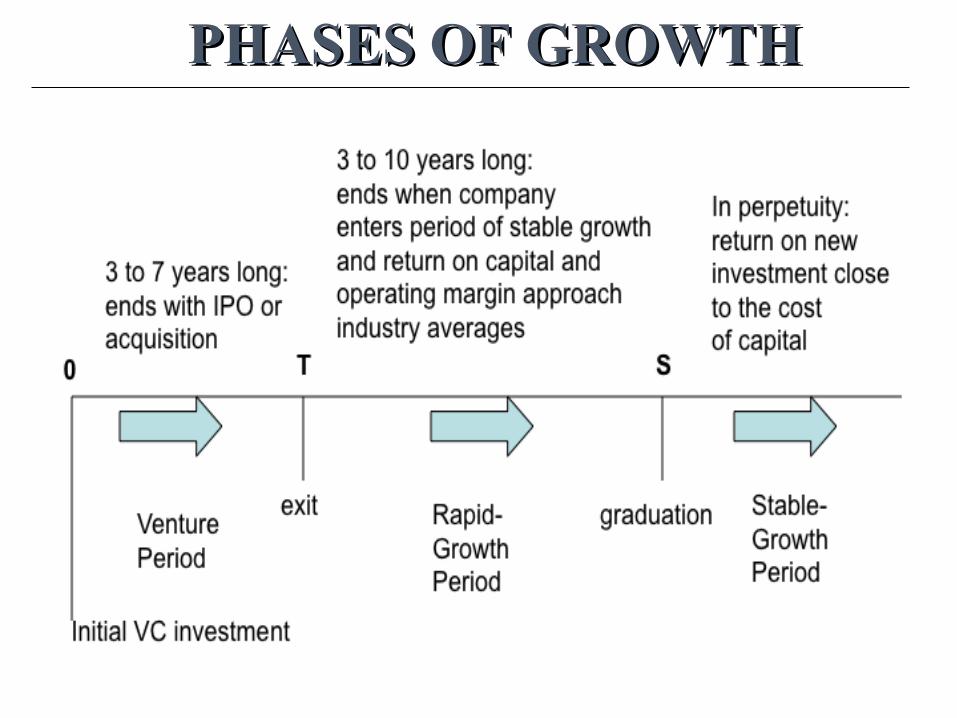
PHASES OF GROWTHPHASES OF GROWTH

Growth vs. AgeGrowth vs. Age
-20.0%
-10.0%
0.0%
10.0%
20.0%
30.0%
40.0%
50.0%
60.0%
70.0%
1 2 3 4 5 6 7
Years since IPO
Rev
enu
e G
row
th -
In
du
stry
Ave
rag
e
75th percentile
median
25th percentile

Assumptions for exit-value DCFsAssumptions for exit-value DCFs
All-equity structureAll-equity structure
No amortization costsNo amortization costs
No non-operating assetsNo non-operating assets

Leverage of VC-backed companiesLeverage of VC-backed companies
Years Since IPO
Mean Median
0 4.7% 1.2% 1 4.0% 1.9% 2 5.7% 2.8% 3 6.8% 3.8% 4 7.2% 3.9% 5 8.1% 4.4% 6 8.2% 5.1% 7 9.1% 6.0% 8 8.7% 5.6% 9 10.6% 6.2%
10 11.0% 6.0% 11 11.8% 6.4% 12 12.4% 8.9% 13 11.0% 7.8% 14 7.7% 4.8% 15 11.0% 6.4%

DCF – MechanicsDCF – Mechanics
CFCF = = EBITEBIT(1-t) + depreciation (1-t) + depreciation – – Capital expenditures – Δ NWCCapital expenditures – Δ NWC
where,where,CF CF = cash flow,= cash flow,EBITEBIT = earnings before interest and taxes, = earnings before interest and taxes,t = the corporate tax rate, andt = the corporate tax rate, andΔ NWC = Δ net working capital = Δ net Δ NWC = Δ net working capital = Δ net
current assets – Δ net current liabilities. current assets – Δ net current liabilities.

CF and InvestmentCF and Investment
NI = capital expenditures + Δ NWCNI = capital expenditures + Δ NWC
- depreciation- depreciation
Investment rate (IR) = Plowback ratio = Investment rate (IR) = Plowback ratio = revinvestment rate = NI / E revinvestment rate = NI / E
CF = E – NI = E – IR * E = (1 – IR) * ECF = E – NI = E – IR * E = (1 – IR) * E

NPVNPV
NPV of perpetuity = X /(r – g)NPV of perpetuity = X /(r – g)
Graduation Value = GV = CFGraduation Value = GV = CFS+1S+1 / (r – g) / (r – g)

Graduation ValueGraduation Value
EEN+1N+1 = E = ENN + NI * R + NI * R
g = (Eg = (EN+1N+1 – E – ENN) / E) / ENN
= (NI * R) / E= (NI * R) / ENN = IR * R = IR * R
GV = (1 – IR) * E / (r – (IR * R))GV = (1 – IR) * E / (r – (IR * R))
GV = ( 1 – g/R) * E / (r – g)GV = ( 1 – g/R) * E / (r – g)

R as a function of NIR as a function of NI

Reality-Check DCFReality-Check DCF
On the exit date:On the exit date: Revenue is forecast for the average Revenue is forecast for the average
success case;success case; Other accounting ratios (Other accounting ratios (not not valuation valuation
ratios) are estimated using ratios) are estimated using comparable companies or rule-of-comparable companies or rule-of-thumb estimates.thumb estimates.
The discount rate is estimated from The discount rate is estimated from industry averages or comparable industry averages or comparable companies.companies.

Reality-Check DCF (2)Reality-Check DCF (2)
On the graduation date:On the graduation date: The stable growth rate is equal to The stable growth rate is equal to
expected inflation;expected inflation; The return on new capital – R(new) – The return on new capital – R(new) –
is equal to the cost-of-capital (r);is equal to the cost-of-capital (r); The return on old capital – R(old) – is The return on old capital – R(old) – is
equal to the industry-average R;equal to the industry-average R; The operating margin is equal to the The operating margin is equal to the
industry average.industry average. The cost-of-capital (r) is equal to the The cost-of-capital (r) is equal to the
industry average cost-of-capital.industry average cost-of-capital.

Reality-Check DCF (3)Reality-Check DCF (3) During the rapid-growth period:During the rapid-growth period:
The length of the rapid-growth period is The length of the rapid-growth period is between between five and seven yearsfive and seven years;;
Average revenue growth is set to the 75th Average revenue growth is set to the 75th percentile of growth for new IPO firms in the percentile of growth for new IPO firms in the same industry, from data contained in growth same industry, from data contained in growth worksheet of the DCF spreadsheet; (worksheet of the DCF spreadsheet; (NOTE: NOTE: for public companies, one can also use for public companies, one can also use analyst estimates here.)analyst estimates here.)
Margins, tax rates, and the cost-of-capital all Margins, tax rates, and the cost-of-capital all change in equal increments across years, so change in equal increments across years, so that exit values reach graduation values in the that exit values reach graduation values in the graduation year.graduation year.

EXERCISEEXERCISE
Semico : Semico : DCF AnalysisDCF Analysis

Example : SemicoExample : SemicoEBV is considering an investment in Semico, an early-stage EBV is considering an investment in Semico, an early-stage semiconductor company. If Semico can execute on their business semiconductor company. If Semico can execute on their business plan, then EBV estimates it would be five years until a successful exit, plan, then EBV estimates it would be five years until a successful exit, when Semico would have about $50M in revenue, 150 employees, a when Semico would have about $50M in revenue, 150 employees, a 10 percent operating margin, a tax rate of 40 percent, and 10 percent operating margin, a tax rate of 40 percent, and approximately $50M in capital (= assets). Semico’s business is to approximately $50M in capital (= assets). Semico’s business is to design and manufacture analog and mixed-signal integrated circuits design and manufacture analog and mixed-signal integrated circuits (ICs) for the servers, storage systems, game consoles, and networking (ICs) for the servers, storage systems, game consoles, and networking and communications markets. It also plans to expand into providing and communications markets. It also plans to expand into providing customized manufacturing services to customers that outsource customized manufacturing services to customers that outsource manufacturing but not the design function. It expects to sell its manufacturing but not the design function. It expects to sell its product predominantly to electronic equipment manufacturers. product predominantly to electronic equipment manufacturers.
ProblemProblem
1.1. To make the transaction work, EBV believes that To make the transaction work, EBV believes that the exit value must be at least $300M. How does the exit value must be at least $300M. How does this compare with the reality-check DCF? this compare with the reality-check DCF?
2.2. How much must the baseline assumptions change to How much must the baseline assumptions change to justify this valuation?justify this valuation?

3.Comparables Analysis

CompsComps
Comps = Comparables Analysis = Multiples Comps = Comparables Analysis = Multiples Analysis = Method of Multiples = Relative Analysis = Method of Multiples = Relative ValuationValuation
Simple Example: Forecast $50M exit revenue, Simple Example: Forecast $50M exit revenue, average multiple in industry is Enterprise average multiple in industry is Enterprise Value (EV) = Value (EV) = 5X revenue 5X revenue
$250M implied EV$250M implied EV$250M implied EV

MultiplesMultiples
EV / RevenueEV / RevenueEV / EBITEV / EBITEV / EBITDAEV / EBITDAPrice / EarningsPrice / EarningsPrice / BookPrice / BookEV / EmployeesEV / EmployeesEV/ Eyeballs, EV/ Patents, EV / Scientists, EV/ Eyeballs, EV/ Patents, EV / Scientists,
EV/ Drugs in Clinical Trials etc…EV/ Drugs in Clinical Trials etc…

DCF vs. CompsDCF vs. CompsEV = CF / (r – g) = CF / (r – R * IR) EV = CF / (r – g) = CF / (r – R * IR)
CF = (1 – IR) * E = (1 – IR) * (1 – t) * EBIT CF = (1 – IR) * E = (1 – IR) * (1 – t) * EBIT
EV / E = Market Cap / E (when debt = 0)EV / E = Market Cap / E (when debt = 0)= P / E = (1 – IR) / (r – R * IR)= P / E = (1 – IR) / (r – R * IR)
EV / Revenue = margin * (1 – t) * (1 – IR) / (r – R * EV / Revenue = margin * (1 – t) * (1 – IR) / (r – R * IR)IR)
EV / employees = EV / employees = revenue per employee * margin * (1 – t) * (1 – IR) / revenue per employee * margin * (1 – t) * (1 – IR) / (r – R * IR)(r – R * IR)

EXERCISEEXERCISE
Semico : Semico : Comps AnalysisComps Analysis

Example : SemicoExample : SemicoEBV is considering an investment in Semico, an early-stage EBV is considering an investment in Semico, an early-stage
semiconductor company. If Semico can execute on their business semiconductor company. If Semico can execute on their business plan, then EBV estimates it would be five years until a successful exit, plan, then EBV estimates it would be five years until a successful exit, when Semico would have about $50M in revenue, 150 employees, a when Semico would have about $50M in revenue, 150 employees, a 10 percent operating margin, a tax rate of 40 percent, and 10 percent operating margin, a tax rate of 40 percent, and approximately $50M in capital (= assets). Semico’s business is to approximately $50M in capital (= assets). Semico’s business is to design and manufacture analog and mixed-signal integrated circuits design and manufacture analog and mixed-signal integrated circuits (ICs) for the servers, storage systems, game consoles, and networking (ICs) for the servers, storage systems, game consoles, and networking and communications markets. It also plans to expand into providing and communications markets. It also plans to expand into providing customized manufacturing services to customers that outsource customized manufacturing services to customers that outsource manufacturing but not the design function. It expects to sell its manufacturing but not the design function. It expects to sell its product predominantly to electronic equipment manufacturers. product predominantly to electronic equipment manufacturers.
ProblemsProblems
a) Identify comparable companies for Semico.a) Identify comparable companies for Semico.b) Use accounting and market information from these b) Use accounting and market information from these
companies to estimate a relative valuation for companies to estimate a relative valuation for Semico.Semico.

Identifying CompsIdentifying Comps
Theme: Think about the “DCF vs. Theme: Think about the “DCF vs. Comps” formulasComps” formulasRevenue range (IR and R)Revenue range (IR and R)Elasticity of product demand Elasticity of product demand
(margins)(margins)Place in the supply chain (margins, rev Place in the supply chain (margins, rev
per employee)per employee)Industry, sub-industry (all variables)Industry, sub-industry (all variables)

Semico Comps
Cannot use negative multiplesCannot use negative multiples
Typical problem for high-growth Typical problem for high-growth companies!companies!
Answer comes down to “which Answer comes down to “which company is more comparable?”company is more comparable?”

Using comps for the cost of capitalUsing comps for the cost of capital
1) Identify a set of comparable companies;1) Identify a set of comparable companies;2) Estimate a performance-evaluation 2) Estimate a performance-evaluation
regression for each of these companies;regression for each of these companies;3) Compute the 3) Compute the unlevered betasunlevered betas for these for these
companies; (described below)companies; (described below)4) Compute the average of these unlevered 4) Compute the average of these unlevered
betas; betas; 5) Use the corresponding cost of capital 5) Use the corresponding cost of capital
formula to estimate the cost of capitalformula to estimate the cost of capital

Unlevering betaUnlevering betaIf beta of debt (and other securities) = 0 and tax If beta of debt (and other securities) = 0 and tax
shields are discounted at the unlevered cost of shields are discounted at the unlevered cost of capital, then we can compute the unlevered beta ascapital, then we can compute the unlevered beta as
ββUU = MC / EV * = MC / EV * ββLL
Where Where ββUU is the unlevered beta, MC is market cap, is the unlevered beta, MC is market cap, EV is enterprise value, and EV is enterprise value, and ββLL is the levered beta. is the levered beta.
(NOTE: This simplification should not be used in (NOTE: This simplification should not be used in highly levered industries.)highly levered industries.)

Cost of CapitalCost of Capital
Using unlevered beta(s), e.g.
r = 0.04 + βU * 0.07 (for the CAPM)

Further ReadingFurther Reading
Metrick, Andrew and Yasuda, Ayako (2011) Venture Capital & the Finance of Innovation. 2nd Edition. John Wiley & Sons.
Lerner,Losh, Hardymon, Felda and Leamon, Ann (2012). Venture Capital and Private Equity : A Casebook. 5th Edition. John Wiley & Sons.
Dorf, R.C. and Byers, T.H. (2008) Technology Ventures – From Idea to Enterprise 2nd Edition, McGraw Hill

QUESTIONS?